the Creative Commons Attribution 4.0 License.
the Creative Commons Attribution 4.0 License.
 | 30 Sep 2026 | OSR10 | Chapter 4.3
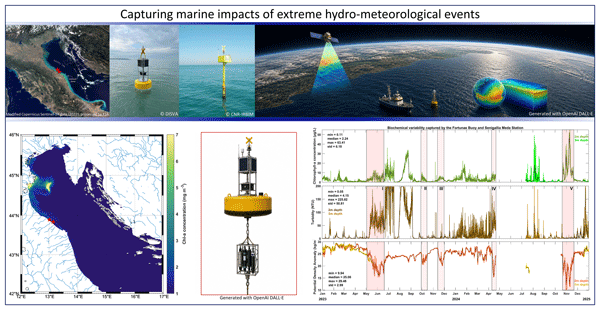
Insights into exceptional freshening events in the northern Adriatic Sea throughout 2023–2024

Alessandro Coluccelli
Francesco Memmola
Pierluigi Penna
Fabrizio Moro
Enrico Zambianchi
Pierpaolo Falco
The northern Adriatic Sea experienced multiple extreme freshening events in 2023 and 2024, underscoring the intensifying influence of heavy precipitation, river discharge, and coastal flooding in the region. This study combines high-frequency in-situ observations from two autonomous meteo-marine monitoring platforms offshore of Fano and Senigallia with river discharge records, satellite imagery, and Copernicus Marine Service products to examine the evolution, drivers, and ecological implications of these events.
The first freshening event in early summer 2023 was linked to consecutive heavy rainfall episodes, including Storm Minerva, which triggered catastrophic flooding across the Emilia-Romagna region in northern Italy. Near-surface salinity declined from ∼ 36 g kg−1 to below 24 g kg−1 within two weeks, corresponding to an estimated freshwater input of ∼ 42.5 m3 h−1 in the vicinity of the buoy. Events in late 2023 and 2024 were even more abrupt and intense, culminating in late October 2024 with salinity values dropping to ∼ 15 g kg−1 following Storm Boris. A key distinction between the two years was the marked recovery of Po River discharge in 2024 after a prolonged drought, which significantly amplified freshwater inputs. These events triggered cascading environmental responses, including stratification, turbidity peaks, and phytoplankton blooms including summertime mucilage-forming aggregations, posing risks to aquaculture, water quality, and coastal tourism.
By combining autonomous in-situ measurements, satellite observations, and Copernicus reanalysis products, this study demonstrates a robust and cost-effective approach to tracking extreme hydrological events in coastal zones. The integrated dataset not only captures rapid thermohaline and biogeochemical changes near-real time but also places them in a broader environmental context. These findings underscore the value of sustained and interoperable observing systems in supporting early warning capabilities, scientific research, and climate adaptation in vulnerable marine regions such as the northern Adriatic Sea.
- Article
(5529 KB) - Full-text XML
- BibTeX
- EndNote


Coastal regions like the shallow Northern Adriatic are complex and densely-populated socio-ecological systems that provide high-value services (Costanza et al., 2014) which are susceptible to the impacts of climate change and other anthropogenic and natural pressures.
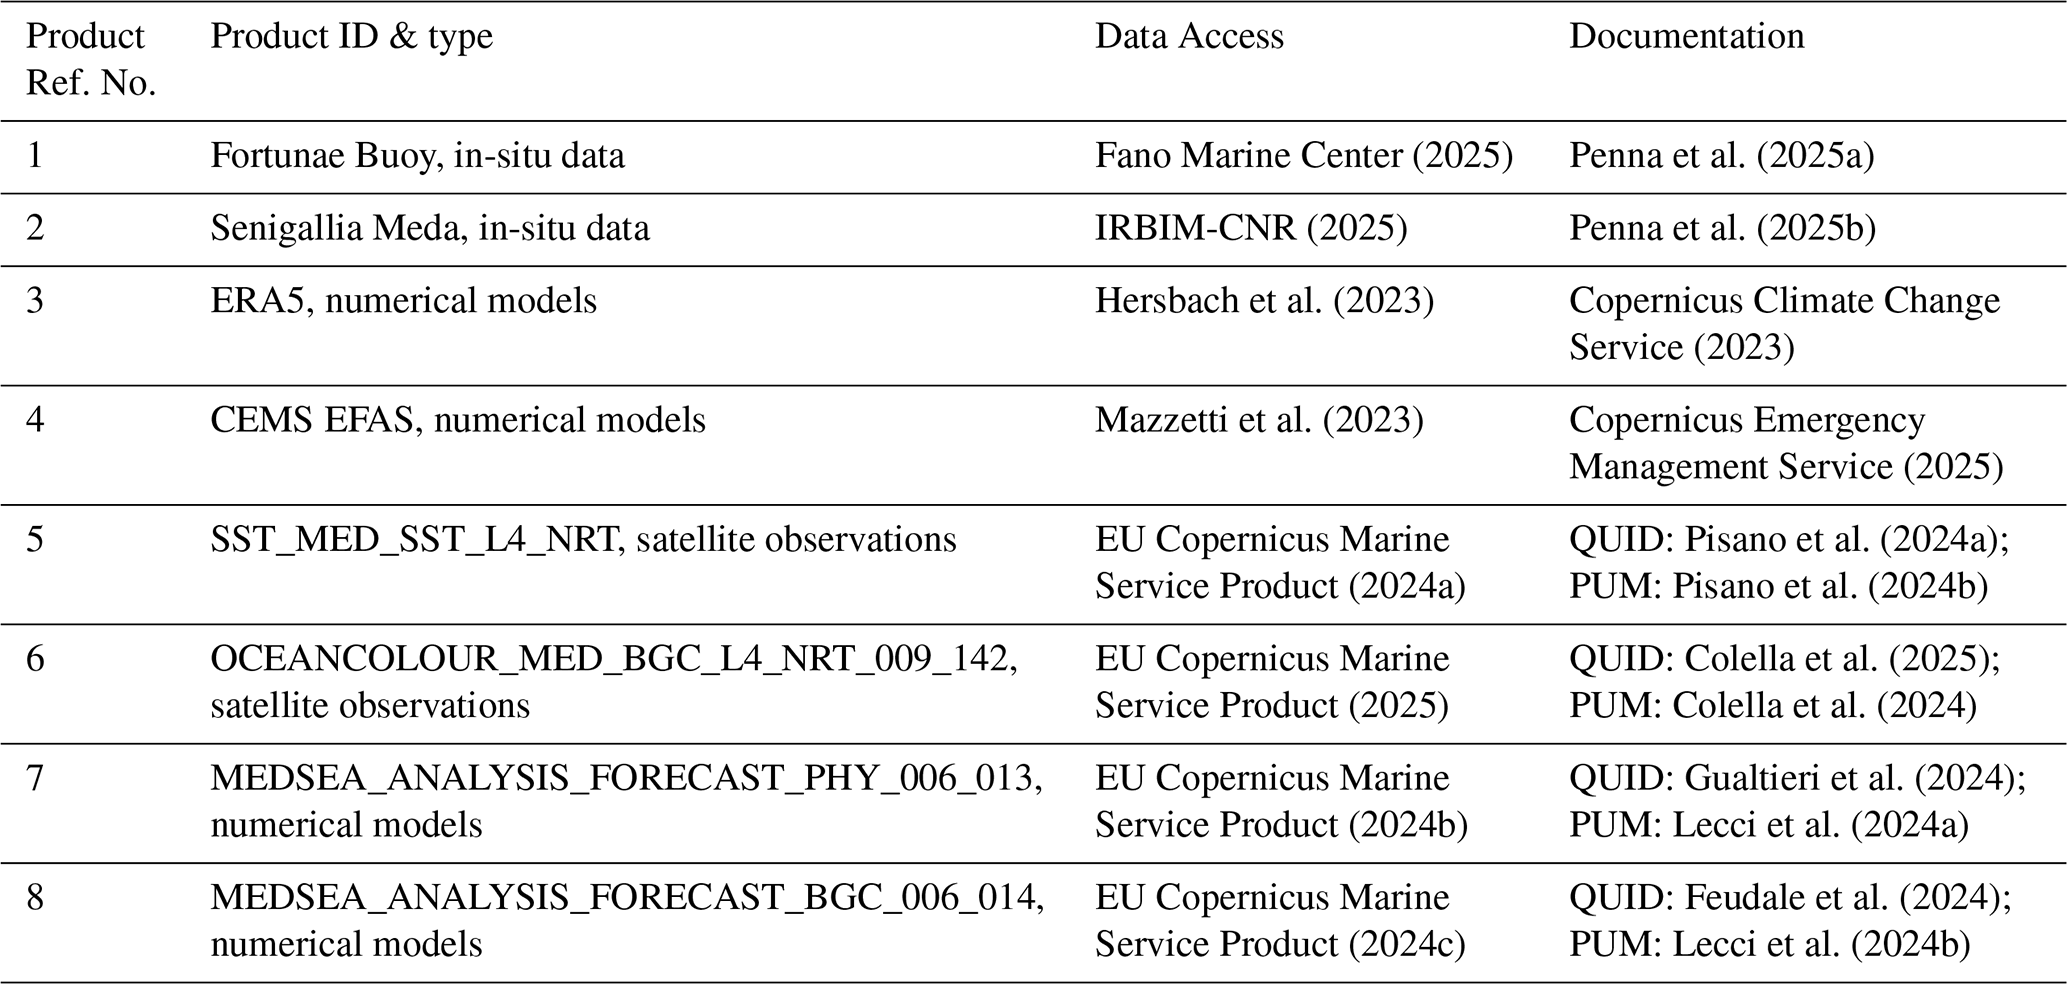
Table 1Products from the Copernicus Service and other complementary datasets used in this study, including the Product User Manual (PUM) and Quality Information Document (QUID). For complementary datasets, the links to the product description, data access and/or references are provided.
Among these, flooding events, triggered by factors such as high tides, storm surges and precipitation whiplashes can lead to large adverse impacts on human and natural systems (Zscheischler et al., 2018; Wright and Nichols, 2019; Tan et al., 2023). According to the latter, precipitation whiplashes, including abrupt shifts between dry and wet extremes, favor the generation of significant surface runoff and flooding, concurrent landslides and erosion that can also amplify negative trends in water quality. Overall, river discharge plays a crucial role in coastal ecosystems by providing freshwater and nutrients that impact hydrology, biogeochemistry, and productivity. Along the Northwestern Adriatic coast, several small rivers and the major Po river discharge nutrient-rich freshwater which is mainly transferred southward along the Italian coast by the Western Adriatic Current (Goudeau et al., 2013), while the Po plume is known to remain close to the coast under stratified conditions (Cozzi and Giani, 2011). This, in turn, affects nutrient cycling, species growth and survival rates (Ludwig et al., 2009; Cozzi and Giani, 2011) as well as water mass formation processes (Falcieri et al., 2014).
The coastal impacts of flooding events extend beyond environmental concerns, affecting local communities and economies that depend on infrastructure and marine resources (e.g., IPCC, 2022, 2023). The need for coastal observations and monitoring efforts is therefore increasingly recognized as essential for guiding policy and public safety needs. The Copernicus Marine Service plays a key role in this context by offering a wide range of physical and biogeochemical near-real time data. However, the location, rapidity and complexity of floods and the related coastal events present specific challenges. Accurate detection and monitoring require an integrated methodology that combines local high-resolution in-situ measurements, satellite data and modeling approaches. This study leverages the high-resolution data from a coastal meteo-marine buoy and several Copernicus sources to provide a comprehensive analysis of a series of exceptional freshening events in the northern Adriatic Sea throughout the last 2 years.
In order to assess the spatio-temporal characteristics, environmental drivers, and ecological impact of extreme freshening events in the northwestern Adriatic Sea during 2023 and 2024, we integrated a set of in-situ, satellite-derived, reanalysis, and model-based datasets.
2.1 Local meteo-marine conditions
High-frequency in-situ measurements of thermohaline, atmospheric and biogeochemical properties were obtained from two autonomous meteo-marine monitoring systems, positioned ∼ 3.7 km offshore of Fano (43°53′30.0′′ N, 13°00′30.0′′ E) and Senigallia (43°45′20.9′′ N, 13°12′32.4′′ E) on the western coast of the northern Adriatic Sea (product ref. 1 and 2; Table 1).
Raw data from these platforms (mentioned as Buoy Fortunae offshore of Fano and Meda Station offshore of Senigallia henceforth) were first converted with the calibration coefficients in the configuration file provided by Sea-Bird Electronics and processed according to the typical SBE data processing sequences. The necessary calculation and analysis of thermodynamic properties was based on the Gibbs Seawater (GSW) Oceanographic Toolbox (IOC et al., 2010), which contains the TEOS-10 subroutines (http://www.TEOS-10.org, last access: 12 February 2025) for the evaluation of seawater properties (McDougall and Barker, 2011). Detailed sensor specifications and processing steps are available in Appendix A1.1–A1.3.
2.2 Precipitation and river discharge
Hourly precipitation data were retrieved from the ERA5 reanalysis dataset, produced by the Copernicus Climate Change Service, which provides gridded atmospheric fields at 0.25° spatial and 1 h temporal resolution (product ref. 3; Table 1). In parallel, 6-hourly river discharge estimates were extracted from the European Flood Awareness System (EFAS) model, based on the LISFLOOD hydrological model forced with gridded meteorological observations (product ref. 4; Table 1). Considering the dominant southeastward flow of the Western Adriatic Current, freshwater input from major (Po, Adige, Reno) and minor regional rivers (e.g., Lamone, Savio, Metauro, and 14 others) was assessed at their upstream mouths along the northwestern Adriatic coast (see Fig. 3 for river mouth locations and characteristic circulation patterns).
2.3 Freshwater rate estimation
To estimate the required freshwater inflow necessary to account for the observed decrease in surface seawater salinity over a given time period, a simplified salt mass conservation approach was applied. This method was based on in-situ salinity data from the Fortunae buoy (product ref. 1; Table 1) and the estimated area of the affected region, derived from satellite SST and ocean-colour observations (product refs. 5 and 6; Table 1) capturing the cold and turbid coastal plume. Assuming that salinity and density are conserved during mixing and proportional to the volumes involved, the following salt mass balance equation was applied:
where ρ1 and ρ2 are the initial and final density in kg m−3; S1 and S2 are the initial and final salinity in g kg−1; V1 is the initial considered volume of seawater in m3; V2 is the final volume after mixing with the added freshwater in m3.
And the freshwater flow (Q) in m3 s−1, required to achieve the observed salinity decrease over the time period Δt is calculated as:
A practical example of this calculation, including measured values from the Fortunae buoy and assumptions on the affected volume based on the buoy's position and local bathymetry, is provided in Appendix A2, along with a schematic diagram illustrating the considered water volume (Fig. A1).
2.4 Complementary satellite and model-based datasets
To complement the in-situ observations and support the freshwater rate estimation (Sect. 2.3), we incorporated satellite-derived and model-based datasets (products 5–8; Table 1) providing full spatial coverage of the northwestern Adriatic Sea. These included daily fields of sea surface temperature (SST; 0.01° × 0.01°), chlorophyll a concentration (Chl-a, 1 km × 1 km), light attenuation coefficient at 490 nm (KD490; 1 km × 1 km), surface salinity (SSS; 0.042° × 0.042°), and horizontal current components (u and v).
These datasets served three main purposes:
-
to delineate the surface extent of freshwater-affected waters and define the horizontal area used in freshwater input calculations (see Appendix A2);
-
to fill temporal gaps in the buoy and coastal station records, ensuring continuous environmental context during key periods of data loss; and
-
to extend the analysis beyond the nearshore region, offering insight into the broader evolution of surface thermohaline and biogeochemical properties across the Adriatic Sea.
The satellite products provided gap-free, multi-sensor interpolated surface fields, while model outputs offered physically consistent estimates of key oceanographic variables across space and time.
2.5 Statistical analysis
Basic statistics were computed following Emery and Thomson (1998). Root Mean Square Difference (RMSD), bias, and cross-correlation were applied to evaluate temporal coherence between thermohaline, biogeochemical and environmental conditions. Detailed equations and assumptions are reported in Appendix A3.
Over the past two years, the northern Adriatic Sea experienced a series of hydro-meteorological extremes, resulting in rapid and recurrent freshening episodes with cascading environmental and societal implications.
3.1 Surface freshening
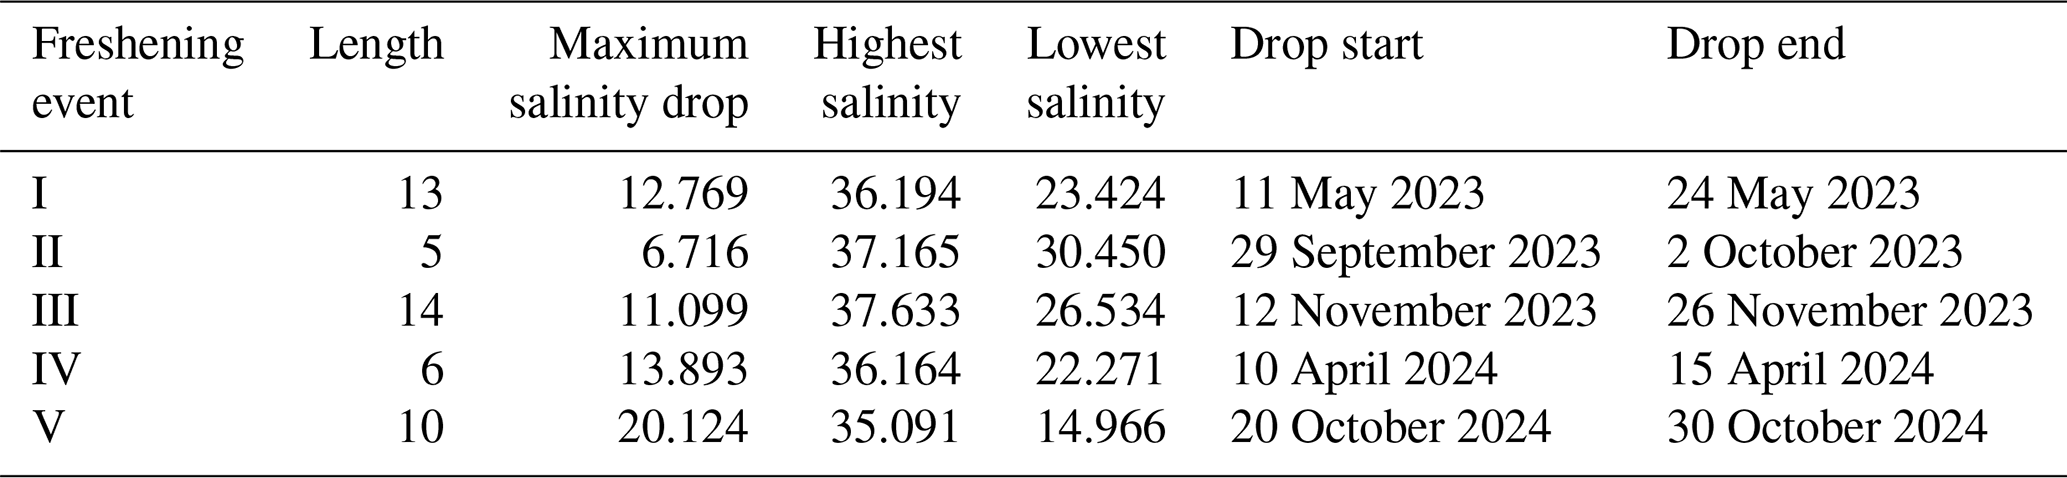
Between May 2023 and November 2024, five distinct surface freshening events were identified in the northern Adriatic Sea from high-frequency salinity observations collected by the Fortunae buoy and the Senigallia Meda Station. These events varied in duration (12 to 53 d), intensity (6.7 to 20.1 g kg−1 salinity drop), and temporal structure, shaped both by prolonged and abrupt freshwater input dynamics (Tables A4 and A5).
Event I (2 May–24 June 2023) was the longest, spanning 53 d. It was characterized by a multi-phase freshening, including an extended period of anomalously low salinity and a gradual recovery. The most pronounced salinity decrease occurred over 13 d (11–24 May), with salinity dropping by 12.77 g kg−1, from 36.19 to 23.42 g kg−1. This prolonged freshening suggests sustained riverine discharge into the northwestern Adriatic. Event II (29 September–16 October 2023, 17 d) showed a more abrupt signature. Over just 5 d, salinity fell by 6.72 g kg−1 (from 37.17 to 30.45 g kg−1), indicating a rapid freshwater input followed by a relatively short recovery. Event III (12 November–2 December 2023, 20 d) included the highest initial salinity observed (37.63 g kg−1), followed by a significant 14 d drop to 26.53 g kg−1, which corresponds to a total decrease of 11.10 g kg−1. Event IV (9–21 April 2024, 12 d) was short but intense, featuring a 6 d salinity decrease of 13.89 g kg−1, from 36.16 to 22.27 g kg−1, representing one of the steepest gradients recorded. Event V (20 October–22 November 2024, 33 d) was the most extreme in terms of salinity reduction. A 10 d drop of 20.12 g kg−1 brought surface salinity from 35.09 to 14.97 g kg−1, making this the most intense freshening event of the record.
These events illustrate the basin's dual sensitivity to sustained meteorological forcing and intense short-term hydrological extremes. Cross-event comparisons emphasize differing recovery behaviors and highlight the coupling between catchment saturation and downstream marine responses (Figs. A2–A6).
3.2 Environmental connections
Hydrological analysis revealed that major freshening events coincided with intense precipitation and river discharge anomalies in the Emilia-Romagna region, with events driven by both catchment saturation and localized convective storms.
A sequence of five rainfall episodes culminated in catastrophic flooding from 1–24 May 2023 (Fig. 2b). The first rainstorm (1–3 May) brought over 200 mm of precipitation to central-eastern Emilia-Romagna. Initial flooding affected the Reno and Lamone basins. Two subsequent moderate episodes (9–10 and 12–14 May) further saturated soils. The most severe storm, associated with Storm Minerva (16–18 May), delivered over 300 mm in areas such as Forlì, with cumulative precipitation more than 5 times the monthly climatological average.
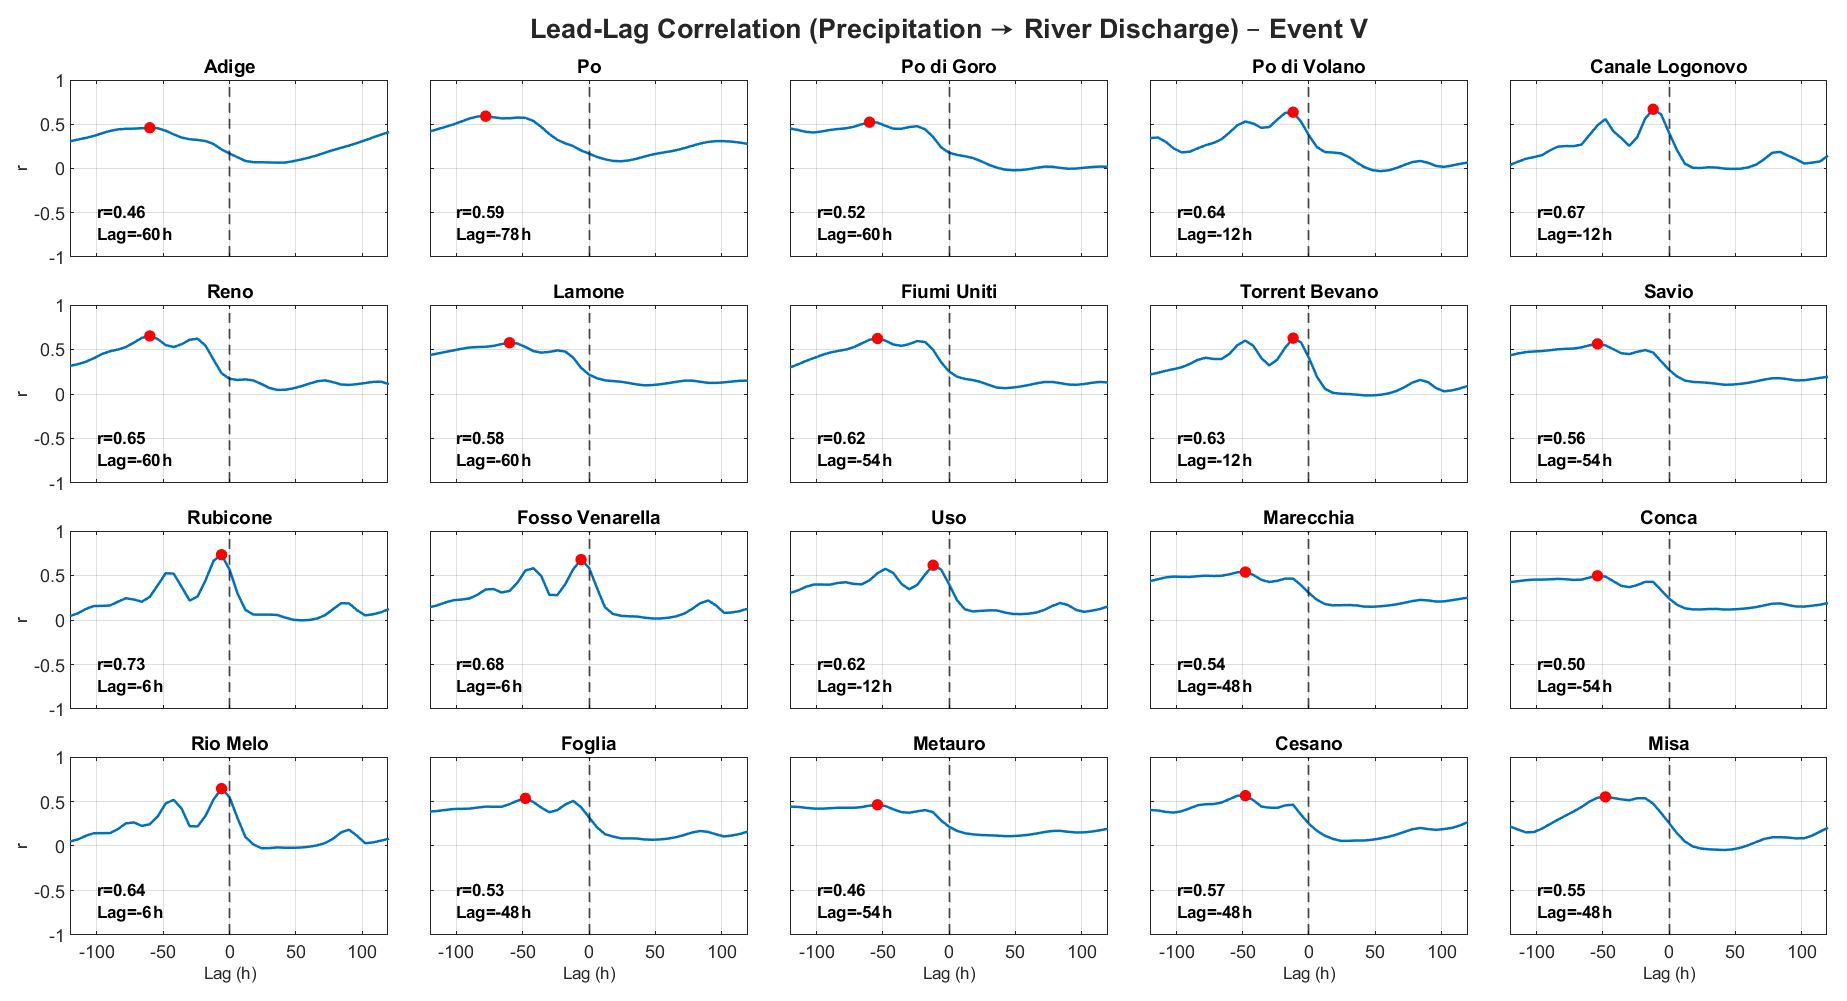
During this period, the Po River remained well below the climatological average discharge, with values around 2000 m3 s−1, as the most intense rainfall did not affect its main basin, whereas local rivers like the Lamone, Savio, and Reno exceeded historical flood levels (Fig. 3c). Cross-correlation analysis between accumulated precipitation and river discharge (Fig. A5) confirmed statistically significant relationships (p < 0.05), with time lags ranging from −6 to −120 h. Rapid response was observed in local rivers with short catchments, such as Rubicone (r = 0.74, lag = −6 h), while larger basins like the Adige exhibited longer delays (r = 0.71, lag = −36 h).
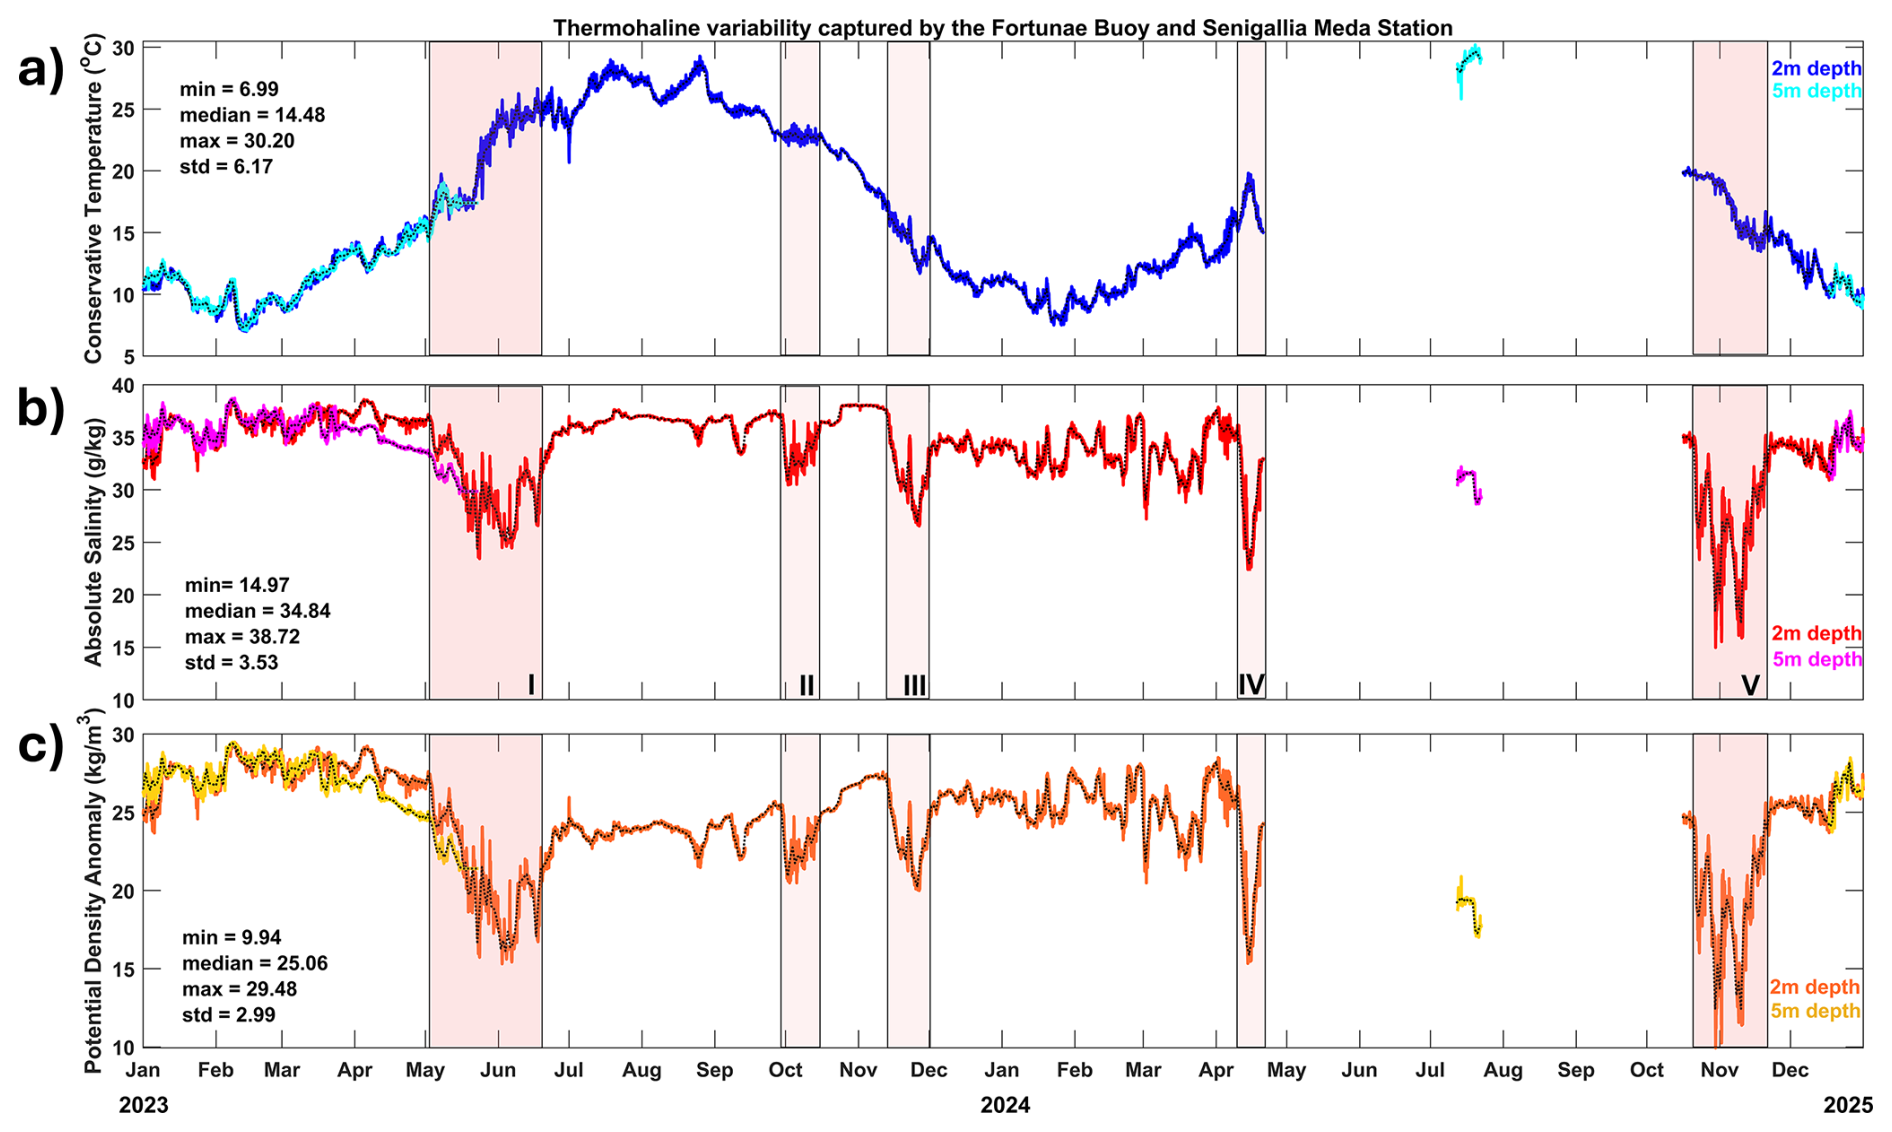
Figure 1Hourly (colored lines) and daily-averaged (black dotted lines) time series of (a) conservative temperature, (b) absolute salinity, and (c) potential density anomaly recorded at 2 and 5 m depth offshore of Fano and Senigallia, respectively (product ref. 1 and 2; Table 1). Basic statistical descriptors (minimum, maximum, median, standard deviation) for each thermohaline property are reported in the top left corner of each panel. Light red shaded areas (I–V) indicate the timing of the five most significant surface freshening events identified between 2023 and 2024.
No widespread heavy precipitation was recorded in correspondence with Event II in late September 2023, but localized convective storms likely impacted the Marche region, just south of Emilia-Romagna, between 25–29 September. An increase in the discharge of the Adige and Po was reported and the freshening signal suggests a short-lived but intense localized input (Fig. 1). In accordance, two prolonged rainfall episodes occurred later during 2–5 November and 30 November–2 December (Event III). The latter was the most severe, with up to 383 mm of rainfall recorded inland, in the Parma Apennines. A third, minor event on 4–5 December followed the main storm.
During spring 2024, an unseasonable storm system between 20–24 April brought 70–80 mm of weak but steady rainfall and rivers with short response times reacted quickly to the precipitation input, leading to the abrupt salinity drop during Event IV (Fig. 1).
Autumn 2024 saw the return of exceptional rains. Between 17–20 September, Storm Boris delivered ∼ 300 mm of rainfall in eastern Emilia-Romagna, causing major river discharges in local rivers like the Savio, Fiumi Uniti and Lamone River (Fig. 3c). Less than a month later (18–19 October), another storm triggered river discharge records for all major rivers, especially for the Po River (record value = 7880 m3 s−1), reflecting a marked hydrological recovery after prolonged drought.
This analysis affirms that both large-scale catchment saturation and localized storm activity contributed significantly to the observed salinity anomalies. Rivers with differing catchment sizes showed distinct response times, with immediate peaks in small rivers and delayed responses in larger ones. Figures 2 and 3, along with Appendix Figs. A2–A6, provide a spatial and temporal context for precipitation and discharge patterns associated with each event.
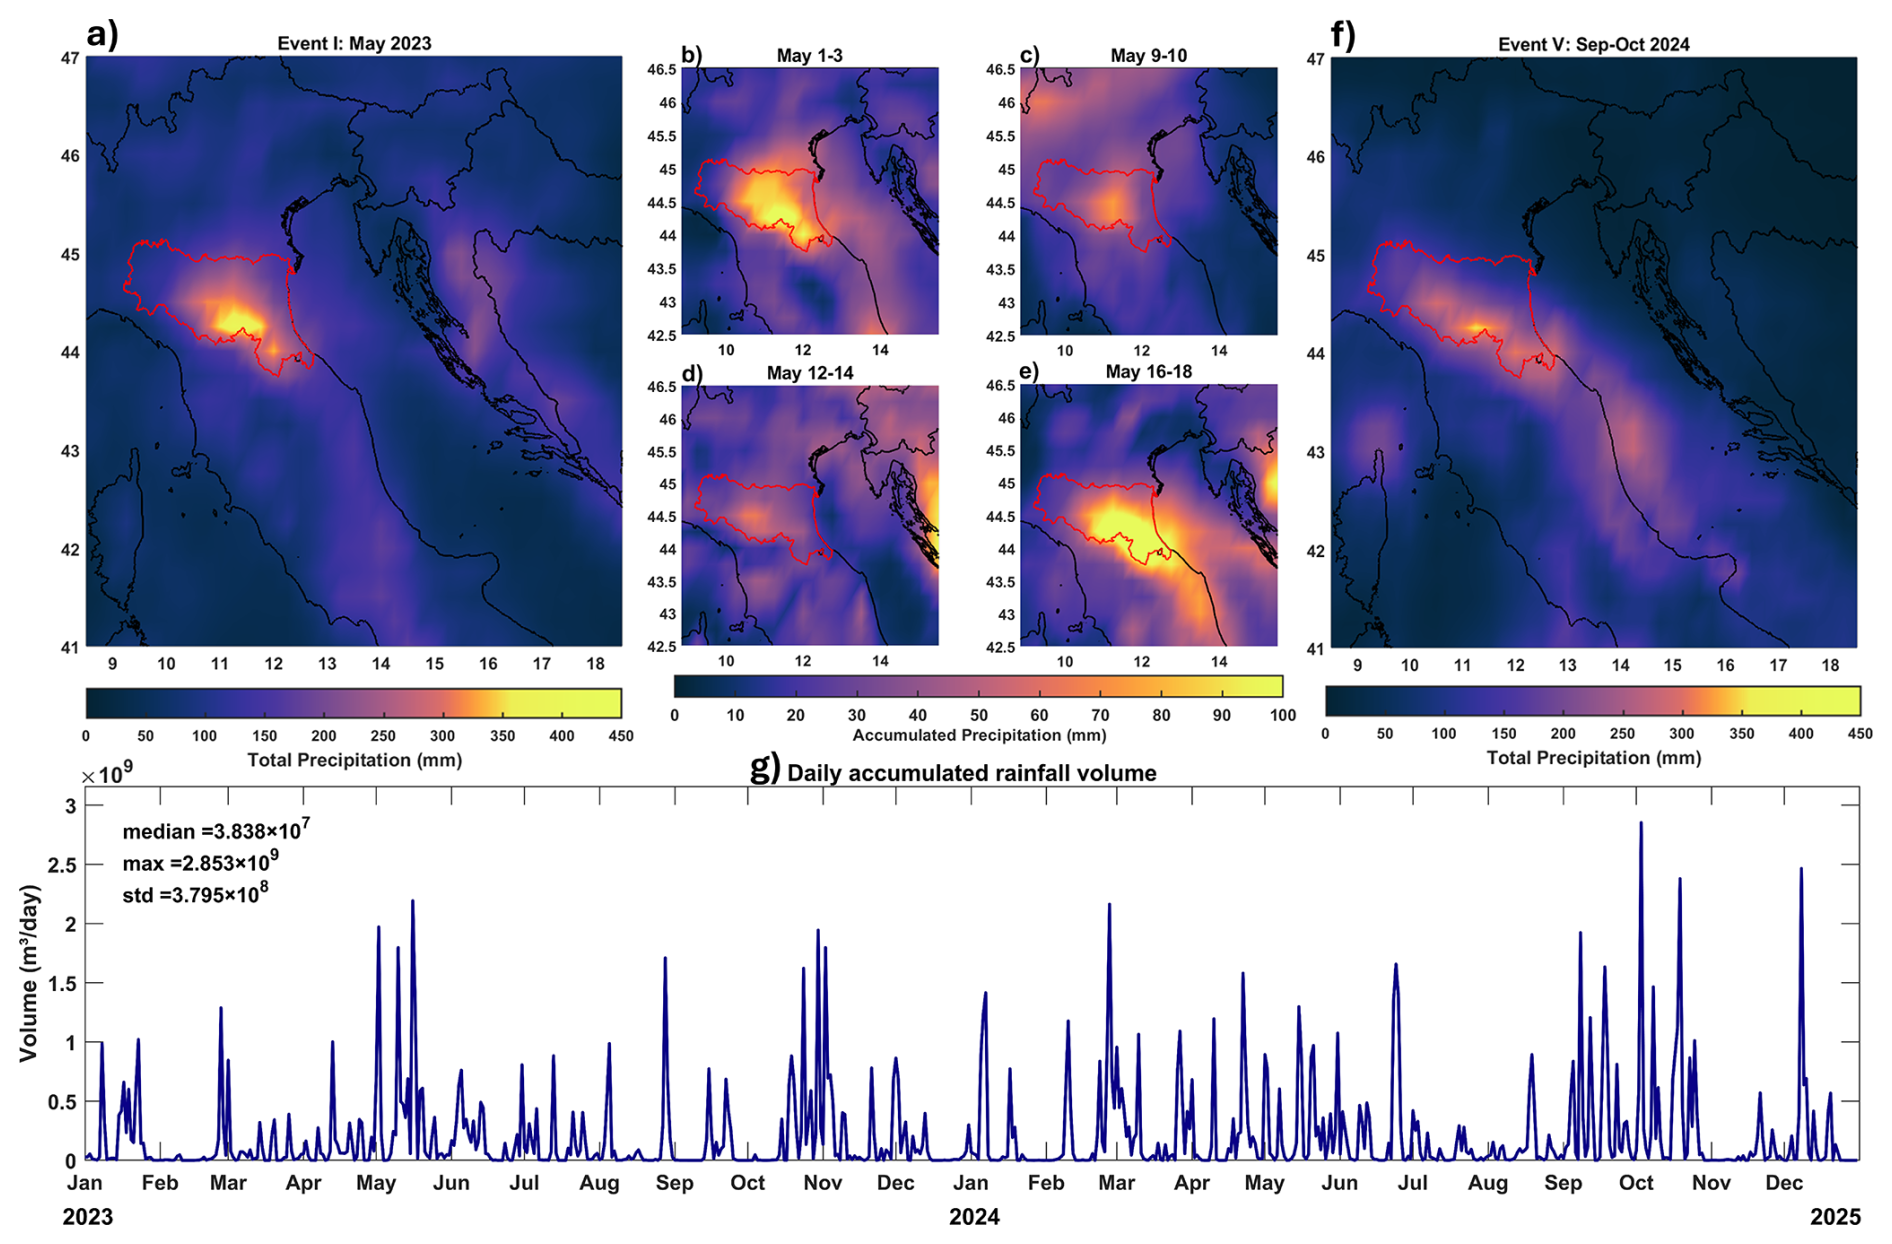
Figure 2Spatial distribution of accumulated precipitation (product ref. 2; Table 1) over Emilia-Romagna and surrounding areas during key extreme rainfall events associated with surface freshening Event I and Event V (see Fig. 1). (a) Total precipitation during the combined May 2023 period (Event I). Accumulated precipitation during individual May 2023 storm episodes: (b) 1–3 May, (c) 9–10 May, (d) 12–14 May, and (e) 16–18 May. (f) Total precipitation during the two September–October 2024 events (Event V). The Emilia-Romagna region is outlined in red in each panel. (g) Time series of daily accumulated rainfall volume (m3 d−1) over the domain, highlighting the timing and intensity of individual rainfall peaks between January 2023 and December 2024. Basic statistical descriptors (minimum, maximum, median, standard deviation) are reported in the upper left corner.
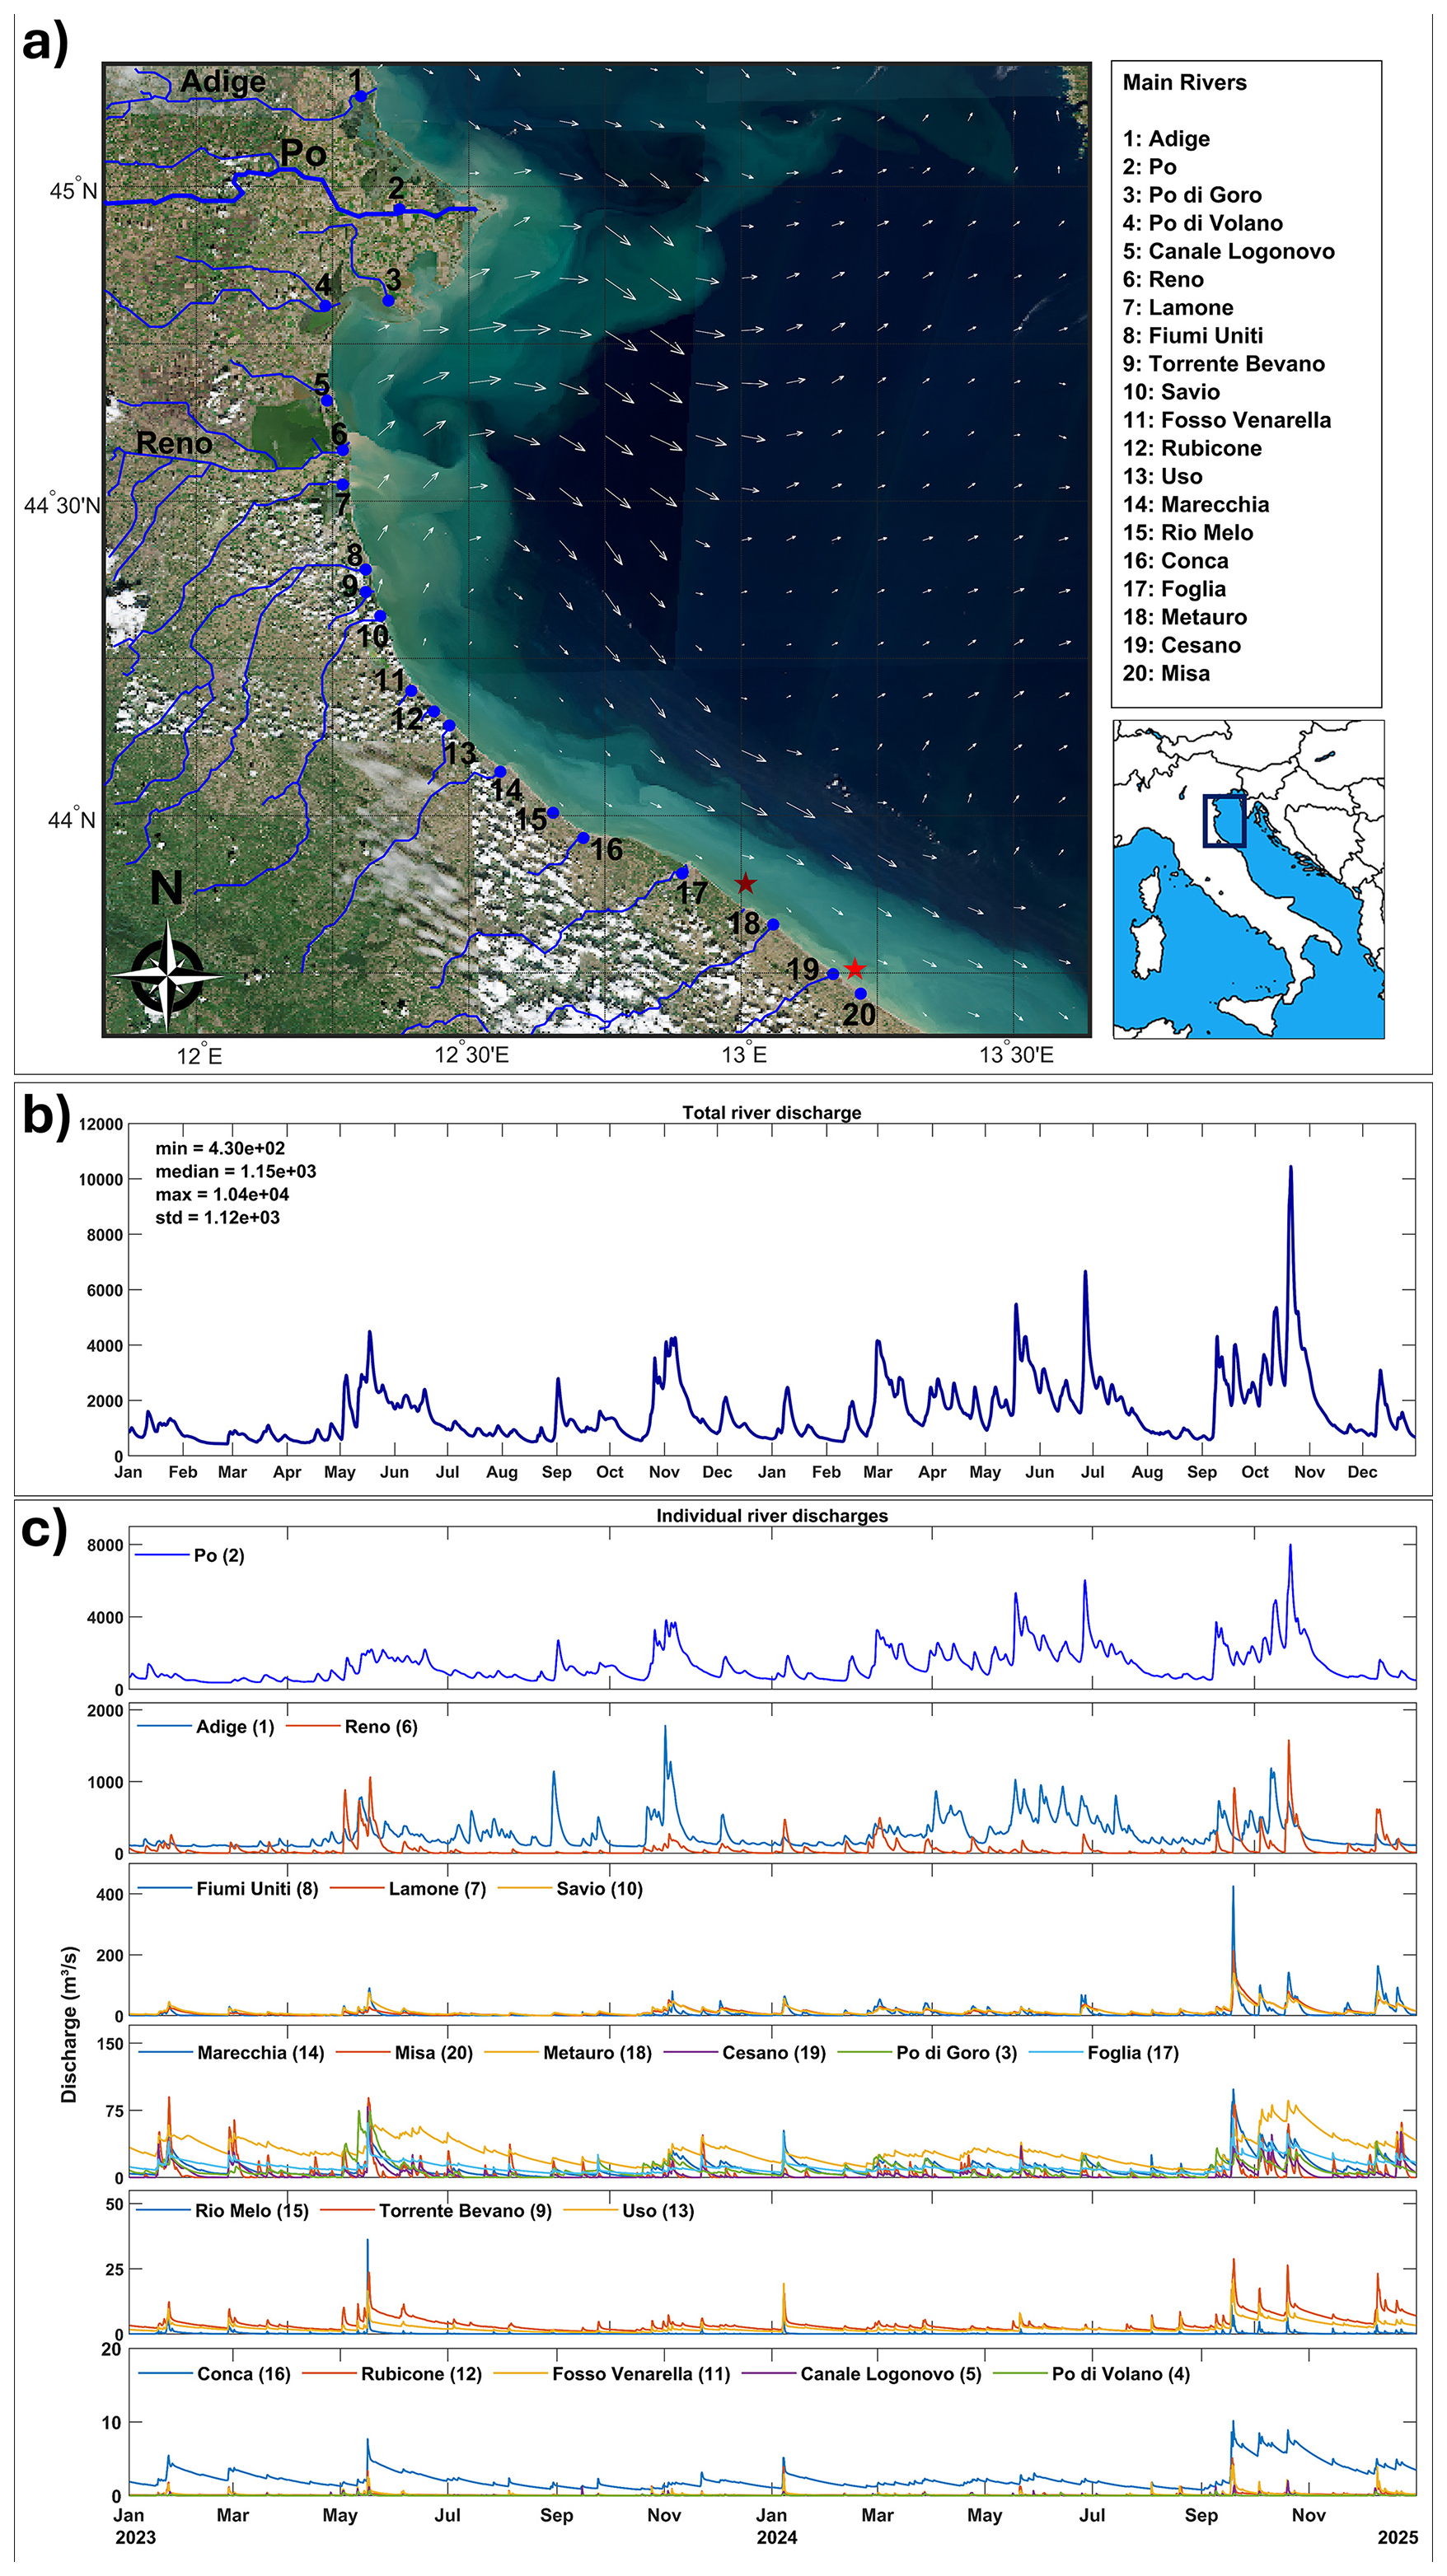
Figure 3Overview of (a) the study area with the location of the 20 assessed river mouths (blue dots) and the positions of the autonomous monitoring platforms offshore of Fano and Senigallia (dark and light red star, respectively). The background corresponds to a Sentinel-2 Level 2A true-color image (https://dataspace.copernicus.eu/browser, last access: 17 August 2025) acquired on 31 October 2024, overlaid with surface current vectors derived from the numerical circulation model (product ref. 8; Table 1) for the same date. (b) Daily time series of the total accumulated river discharge (m3 s−1) from all 20 rivers for the period January 2023–December 2024 (product ref.3; Table 1). Key descriptive statistics (minimum, median, maximum, standard deviation) are indicated. (c) Individual river discharge time series, grouped by magnitude, with numeric labels corresponding to the river mouth positions indicated in panel (a).
3.3 Ecological implications
Each freshening event identified in this study (Fig. 1) triggered a marked biogeochemical response in the northern Adriatic Sea, as captured by the high-frequency in-situ measurements of chlorophyll a, turbidity, and dissolved oxygen collected by the Fortunae Buoy and the Senigallia Meda Station (Fig. 4). These parameters serve as proxies for primary productivity, sediment transport, and oxygen dynamics, offering direct evidence of ecosystem perturbations following extreme hydro-meteorological events.
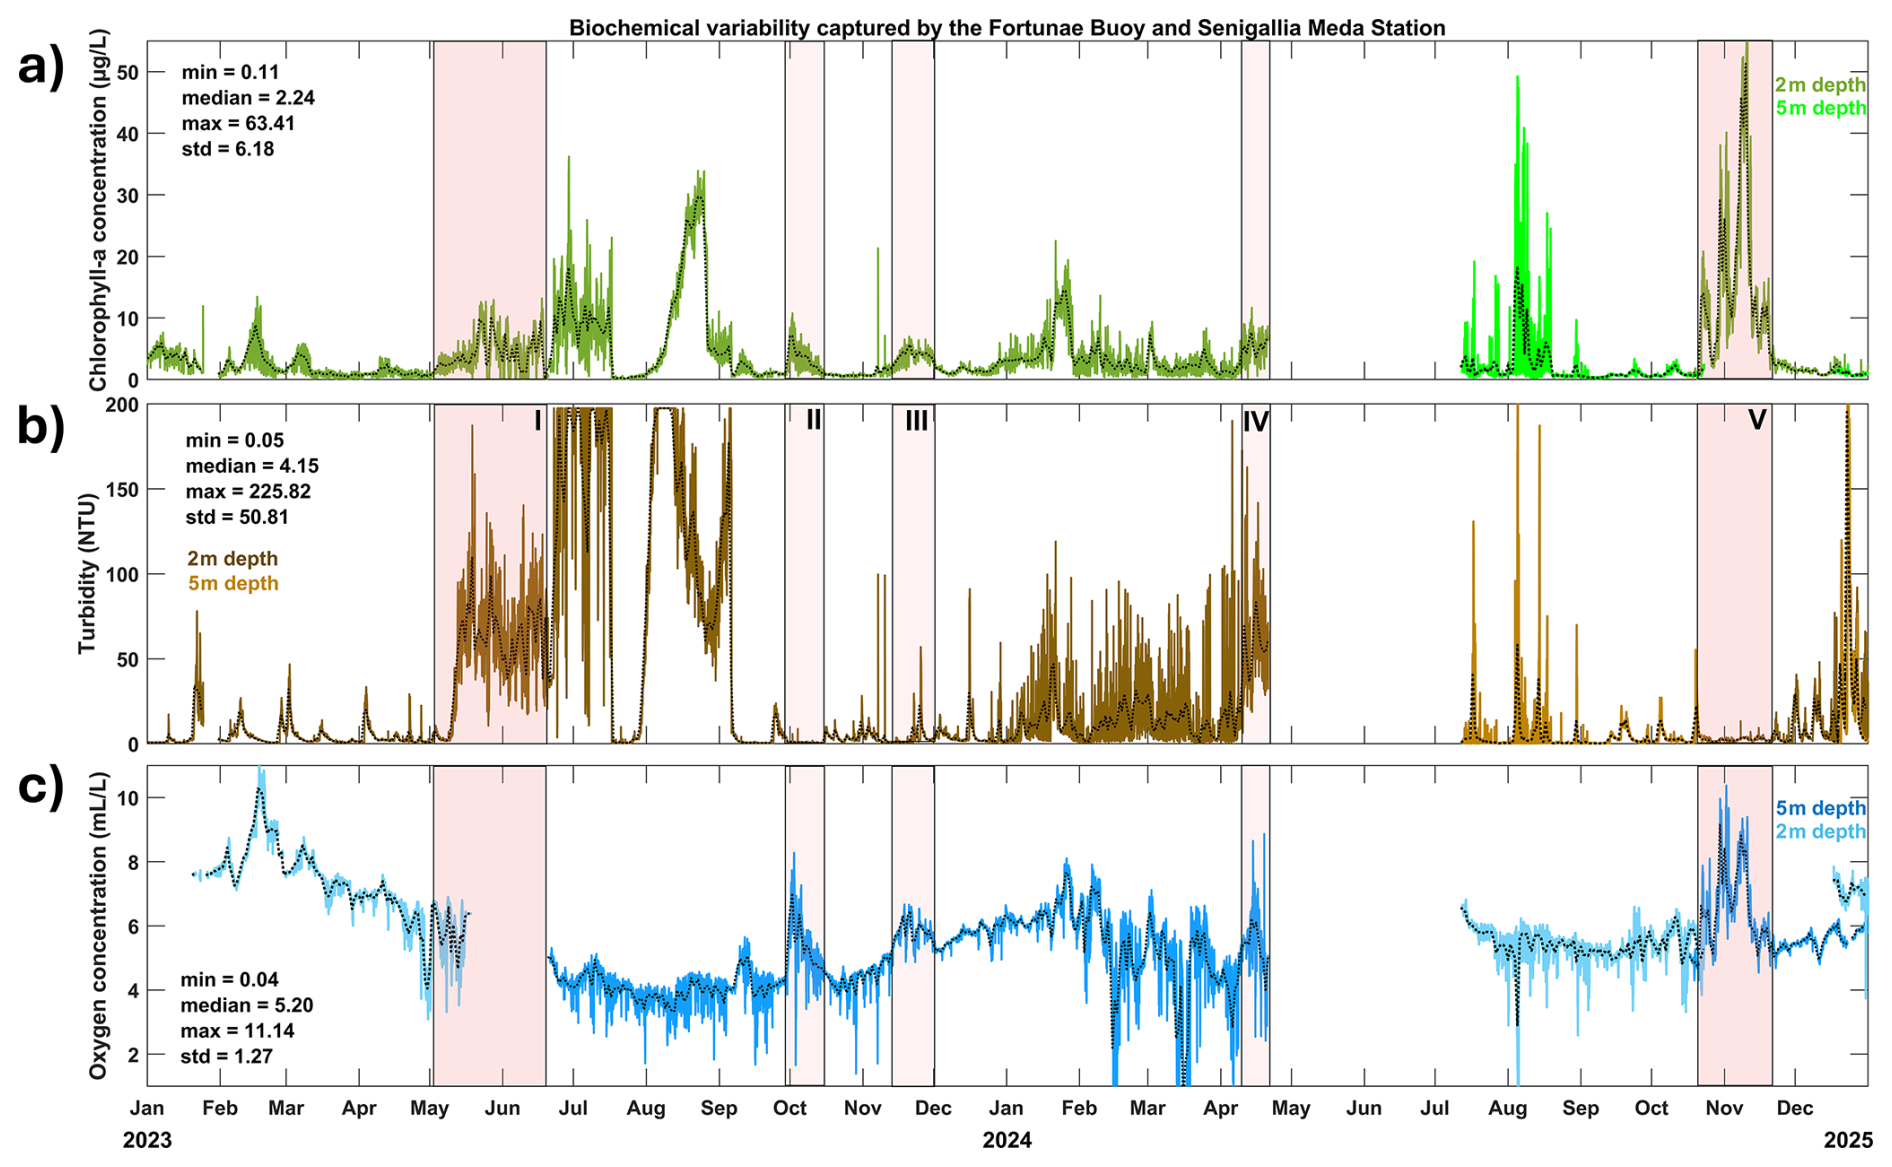
Figure 4Hourly (colored lines) and daily-averaged (black dotted lines) time series of (a) chlorophyll a concentration, (b) turbidity, and (c) dissolved oxygen concentration measured at 2 and 5 m depths by the Fortunae buoy (offshore of Fano) and the Senigallia Meda station, respectively (product ref. 1 and 2; Table 1). Basic statistical descriptors (minimum, maximum, median, standard deviation) are reported in the left corner of each panel. Red shaded areas (I–V) denote the timing of the five most pronounced surface freshening events as identified in Fig. 1. Biogeochemical responses, including sharp increases in turbidity and chlorophyll a, coincide with or follow these events, reflecting ecosystem perturbations.
Following Event I (May 2023), which was preceded by a sequence of five intense rainfall episodes in the Emilia-Romagna region and culminated in catastrophic flooding (Fig. 2b–e), an extreme turbidity increase (∼ 70 NTU average) was recorded for more than a month, along with chlorophyll a concentrations exceeding 10 µg L−1 (Fig. 4). These responses reflect the combined influence of excess sediment transport and nutrient enrichment, especially from local rivers like the Lamone, Reno, and Savio, which exceeded historical discharge levels (Fig. 3c). The sustained rainfall and resulting prolonged runoff seem to have led to a persistent stratified surface layer that confined biological activity and promoted bloom formation.
After the record May flood period, a particularly notable anomaly was observed in June–July 2023, with sustained extreme turbidity (> 200 NTU) and following chlorophyll a values (> 30 µg L−1). Subsequent visual inspections of the buoy infrastructure revealed the presence of mucilage-forming macroaggregates, consistent with recurring gelatinous algal blooms historically observed in the Adriatic under warm, stratified, and nutrient-enriched conditions (Arrighi and Domeneghetti, 2024). These mucilage events have well-documented impacts on marine ecosystems, coastal water quality, and economic sectors such as aquaculture and tourism.
The response to Event II (late September–October 2023) presented a contrasting case. While no widespread heavy precipitation and flooding occurred in Emilia-Romagna, localized convective storms over the Marche region and rising discharges in the Adige and Po rivers triggered a short-lived but intense freshening. While turbidity remained low, the biogeochemical response included a marked increase in chlorophyll a concentration and oxygen supersaturation reaching approximately 150 %, indicating a nutrient rich but low sediment freshwater input. Moreover, dissolved oxygen rose near-synchronously with chlorophyll a concentrations (r = 0.77, lag = 0 h), consistent with well-lit bloom conditions. This event exemplifies how smaller, convective systems can fuel biological productivity without large sediment loads, while favorable light conditions likely allowed rapid phytoplankton growth.
The prolonged rainfall in early and late November 2023 preceded Event III, which produced another strong bloom and variable oxygen patterns. This response suggests that delayed runoff from larger, saturated catchments delivered substantial nutrient loads, with peak phytoplankton activity followed by oxygen variability related to organic matter remineralization and light attenuation during turbid phases.
The corresponding biogeochemical response to event IV followed an unseasonable storm system in April 2024. Rapid response from short catchment rivers like the Rubicone and Uso led to an abrupt salinity drop (Fig. 1) and sharp turbidity and chlorophyll peaks, consistent with the fast land-sea transfer typical of springtime storms over saturated terrain. These dynamics emphasize the system's sensitivity even to moderate precipitation when antecedent soil conditions favor immediate runoff.
Finally, Event V in autumn 2024 was preceded by two major storm systems: Storm Boris (17–20 September) and an intense October storm (18–19 October), the latter driving the Po River to record discharge levels (Fig. 3c). This sequence produced the most intense surface freshening and the highest chlorophyll a concentration observed during the study period, exceeding 60 µg L−1. Interestingly, these extremely high chlorophyll a levels occurred in conjunction with notably low turbidity, suggesting that sediment-laden runoff from the Po River may have settled or dispersed before reaching the offshore monitoring sites at Fano and Senigallia. This decoupling implies that nutrient transport remained effective despite reduced suspended particulate matter, allowing for favorable light conditions and enhanced primary productivity which is consistent with a multi-day negative turbidity–chlorophyll relationship (r = −0.32 at −144 h lag) and near-synchronous, positive chlorophyll–oxygen coupling (r = 0.86 at 0 h lag), together indicating strong photosynthetic control under clear conditions.
Across all events, dissolved oxygen dynamics reflected a combination of photosynthetic production during bloom conditions and oxygen depletion during periods of high turbidity and organic matter degradation. Event-scale lead–lag patterns showed a biphasic turbidity–chlorophyll response with a short-lag negative branch when high turbidity limits light, and a positive branch at multi-day delays when nutrient delivery and stratification promote blooms. The chlorophyll–oxygen coupling is typically positive and near-synchronous, with longer-lag negatives appearing during potential bloom decay and post-bloom respiration.
These findings confirm that hydro-meteorological forcing, whether through widespread rainfall, localized storms, or antecedent soil saturation, directly drive ecosystem-level responses in the northern Adriatic Sea. The magnitude and timing of these responses depend not only on precipitation intensity and discharge volume, but also on the sediment load, nutrient delivery, and seasonal conditions governing stratification and light availability.
The northern Adriatic experienced a series of extreme freshening events between 2023 and 2024, underscoring its vulnerability to compound hydro-meteorological extremes. Events such as Storm Minerva and Storm Boris were marked by intense precipitation and widespread flooding, with significant hydrological and ecological repercussions. These cases highlight the increasing role of precipitation whiplash and flood-drought cycles in modulating coastal hydrography.
According to the IPCC's Sixth Assessment Report, heavy rainfall events and the corresponding overflow are projected to increase in frequency and intensity as global temperatures rise beyond 1.5 °C (IPCC, 2023). River floods in central and western Europe are already increasing, and small catchments, like those affected along the northwestern Adriatic coast, are especially vulnerable. Future storms may more frequently exceed their coping capacities, reinforcing the urgency of adaptive monitoring systems.
In the Northern Adriatic, where the Po River and smaller local rivers drive salinity and biogeochemical patterns, such shifts have significant implications. As the shallowest and northernmost basin of the Mediterranean, it is particularly vulnerable to such perturbations due to its limited flushing, strong land-sea coupling, and intensive human pressure (Coll et al., 2010). Its physical and ecological sensitivity to episodic freshwater pulses, such as those examined here, underscores the growing importance of continuous monitoring in the context of climate change.
Surface freshening alters water column structure, promotes stratification, and modulates ecological responses. In summer 2023 and 2024, sea surface temperatures exceeded 30 °C, accompanied by extensive mucilage-forming algal aggregations. These events compromise water quality, threaten aquaculture viability, and negatively impact tourism, posing socio-ecological risks.
High-resolution in-situ observations play a critical role in capturing such rapid and localized phenomena. Coastal meteo-marine platforms, such as the utilized Fortunae buoy and Senigallia Meda station, offer a cost-effective, automated system capable of operating under harsh conditions and at high sampling rates in complex nearshore zones.
We therefore recommend a collective effort that incorporates such observational datasets into Copernicus and broader databases. Such an integration would bridge existing gaps in coastal coverage, complementing the basin-wide scope of satellite and reanalysis products with finer-scale, real-time data. As climate-induced extremes accelerate, safeguarding ecological and societal resilience in shallow semi-enclosed seas, such as the Adriatic Sea, requires sustained, integrated, and transdisciplinary efforts anchored in robust, real-time observations and openly accessible data.
A1 Overview of the meteo-marine buoy Fortunae
The multidisciplinary buoy is equipped with a series of sensors that measure atmospheric parameters at 2 m height; wave parameters at sea level; as well as current, thermohaline and biochemical parameters at ∼ 2 m depth below the sea level.
A1.1 Atmospheric conditions at 2 m height
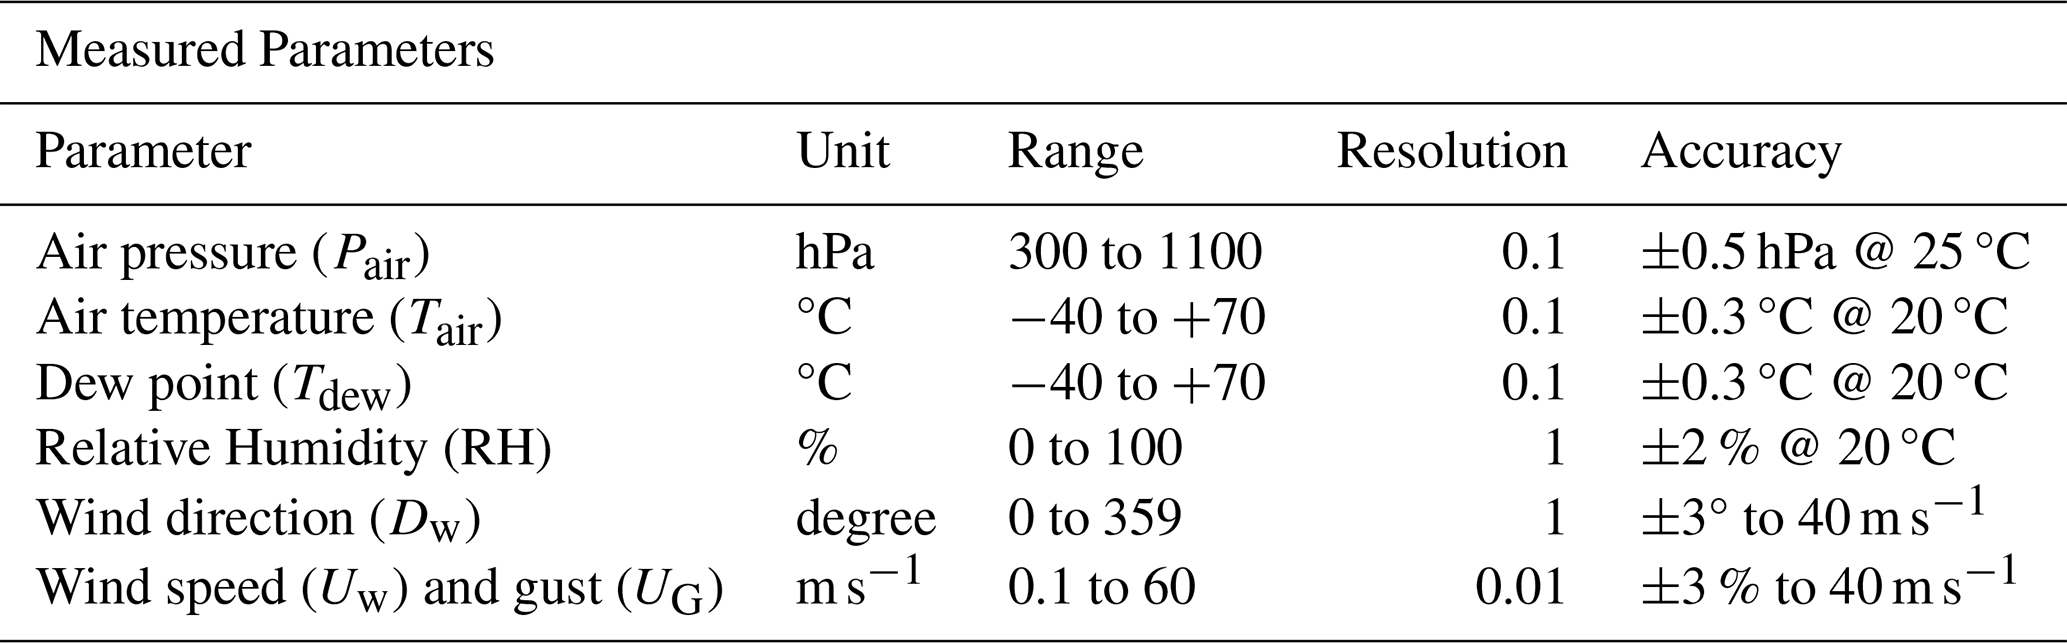
More precisely, the following atmospheric parameters are systematically sampled every 30 min at 2 m above sea level using a GILL MaxiMet GMX500 Compact Weather Station equipped with GPS (https://gillinstruments.com/, last access: 10 May 2026; Table A1).
Table A1Overview of the observed atmospheric parameters with the corresponding technical details and characteristics. Additional information are available under the feature specification of the GMX500 Model: https://gillinstruments.com/wp-content/uploads/2022/08/1957-008-Maximet-gmx500-Iss-9.pdf, last access: 10 May 2026.
A1.2 Wave conditions at sea level
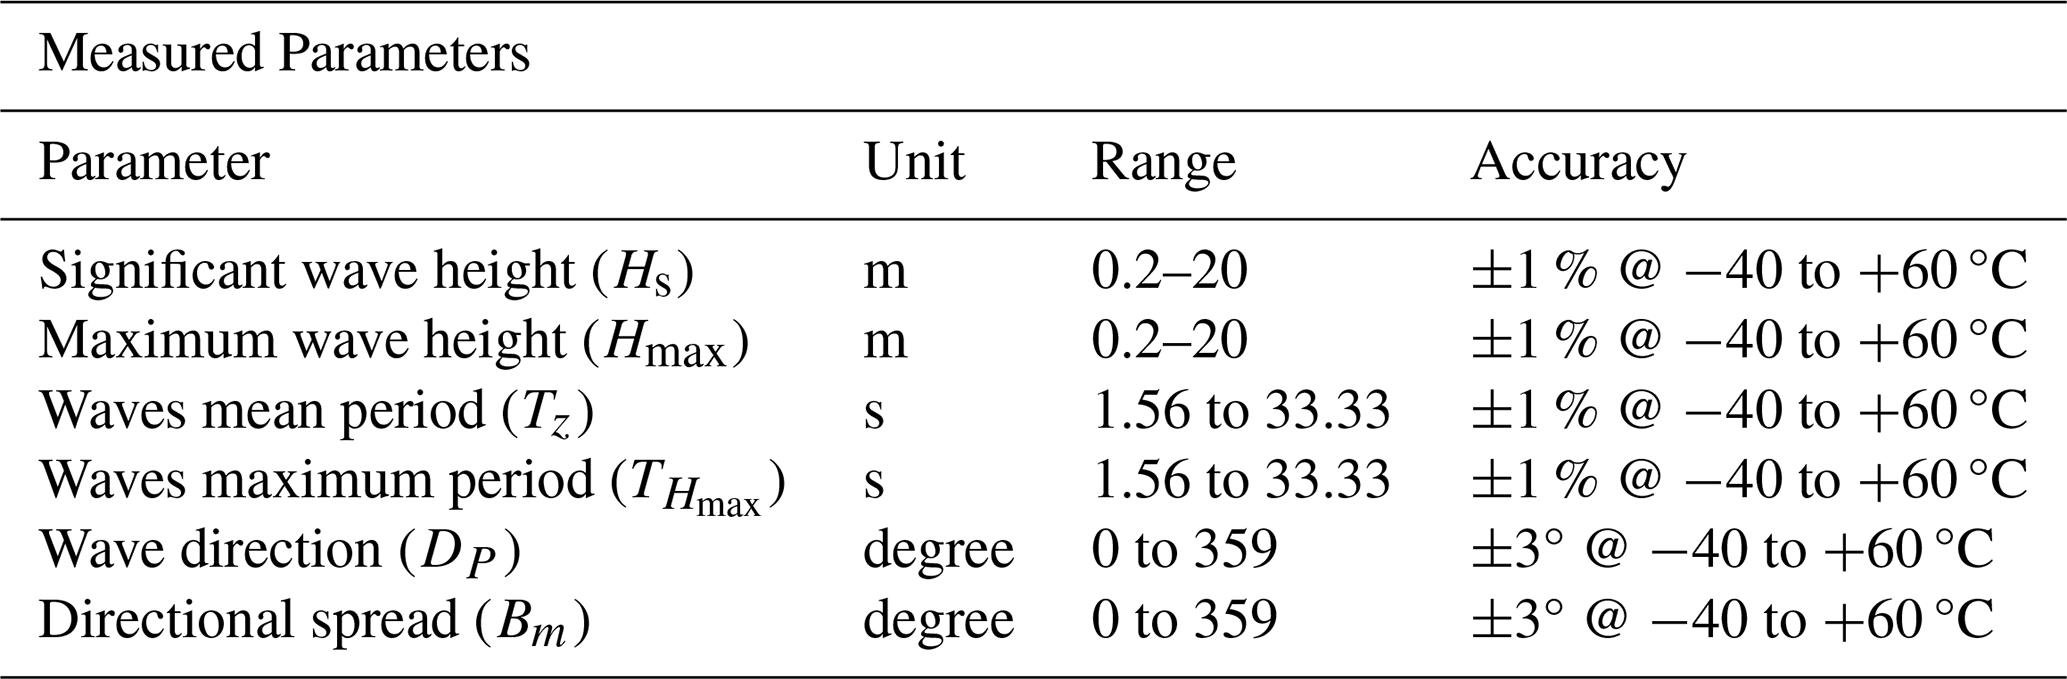
Note that wave measurements are available from the platform but were not utilized in the present study. The following wave parameters are systematically sampled every 60 min at sea level utilizing a Brizo-X Directional Wave Height Sensor with an integrated Global Navigation Satellite System (GNSS) from Xeos Technologies (https://xeostech.com/brizo-x, last access: 14 May 2026; Table A2).
Table A2Overview of the observed wave characteristics with the corresponding technical details. Wave height range information stem from Wang et al. (2016). Additional information is available under the feature specification of the Brizo-X Model: https://xeostech.com/sites/default/files/2019-08/BrizoX%20Brochure%20WEB.pdf, last access: 14 May 2026.
The Brizo-X Directional Wave Height Sensor utilizes standard spectral analysis techniques and formulas to calculate wave parameters for waves of periods from 1.6 s to 33 s (Earle, 1996). The energy density spectrum of a sea state is generally designated by E(f) and the total energy is given by
The wave frequency spectrum can, therefore, be determined from a wave record η(t) by using a Fourier transform as follows: The wave energy averaged over a period is given by
where 〈η〉 is the mean value.
Inserting in this expression the Fourier development of , gives
where g is the gravitational acceleration, ρ is the seawater density.
A1.3 Thermohaline and biochemical conditions at 2 m depth
Additionally, the following oceanographic parameters are systematically sampled every 30 min at ∼ 2 m depth below the sea level by a submerged MicroCAT SBE-37 SIP (Serial Interface Pumped) CTD (Conductivity-Temperature-Depth) and a WET Labs ECO-FLNTU fluorescence sensor with Bio-Wiper option from Sea-Bird (https://www.seabird.com/, last access: 14 May 2026; Table A3).
Table A3Overview of the observed oceanographic parameters∗ with the corresponding technical details and characteristics. Additional information is available in the SBE feature specifications: https://www.seabird.com/products/sbe-37-microcat (last access: 14 May 2026).
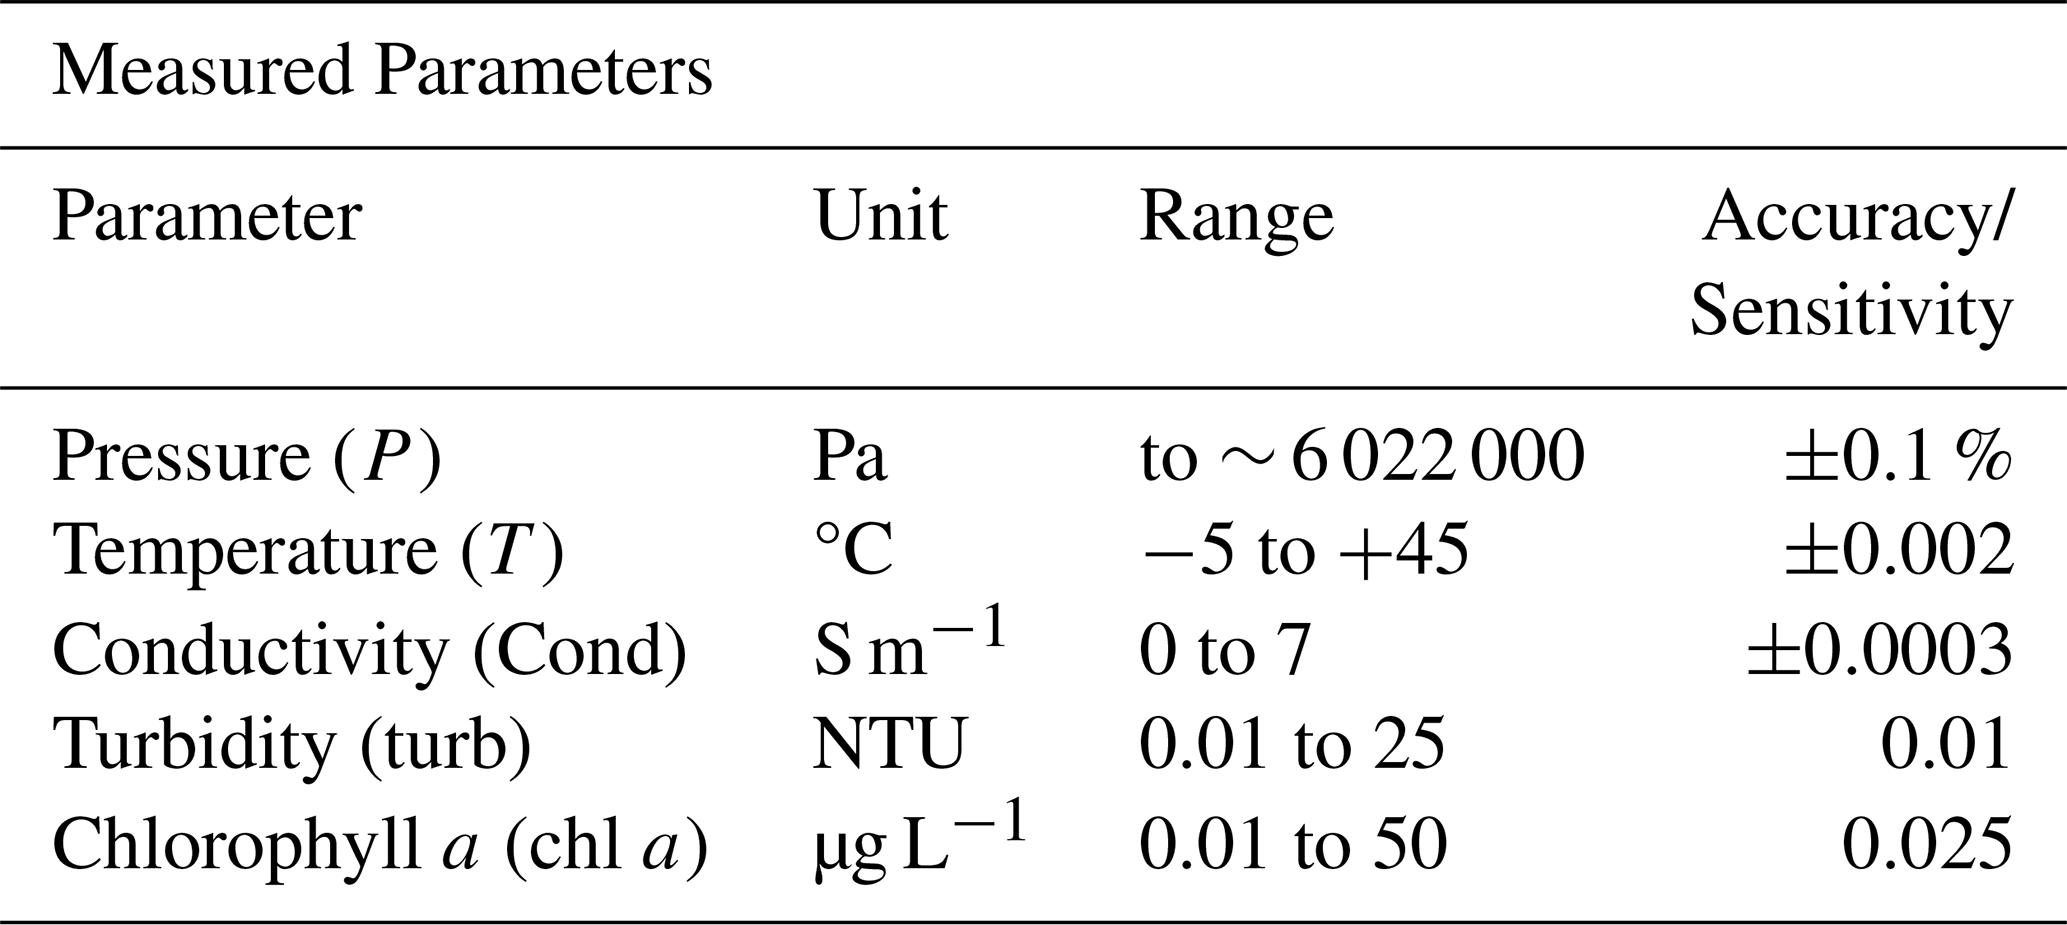
∗ Though not included in this study, additional parameters are available from an SBE optical oxygen sensor and a Nortek Aquadopp current meter from 14 July 2023 onwards.
The TEOS-10 GSW Matlab routines (version 3.05.5) were applied to derive Absolute Salinity (SA) (mass fraction of dissolved material, in g kg−1) and of Conservative Temperature (CT, in °C) from of Practical Salinity (S, unitless) and Potential Temperature (θ, in °C), respectively. According to McDougall and Barker (2011) these properties are calculated as follows:
where is the difference between the Absolute Salinity and Reference Salinity (SR) based on the location, with x and y being the longitude and latitude in decimal degrees and p the pressure in dbar.
where J kg−1 K−1 is a reference value of the specific heat capacity, chosen to be as close as possible to the spatial average of the heat capacity over the ocean surface and h0 is the potential enthalpy which corresponds to the enthalpy (h, in J kg−1) at a reference pressure:
Readers interested in the full observational capabilities of the buoy are referred to Table 1 and Penna et al. (2025a).
A2 Freshwater flow rate calculation
Following the salt mass balance equation (Eq. 1) and based on the in-situ data from the Fortunae buoy (Product Ref. No. 1) and the estimated impacted area from the satellite observations (Product Ref. No. 5 and 6), the freshwater input leading to the first extreme freshening can be calculated as follows.
Taking into account that
-
ρ1=1026.212 kg m−3 is the initial seawater density measured by the buoy;
-
ρ2=1015.725 kg m−3 is the final seawater density measured by the buoy;
-
S1=36.194 g kg−1 is the initial seawater salinity measured by the buoy;
-
S2=23.424 g kg−1 is the final seawater salinity measured by the buoy;
-
m3 is the initial volume of seawater confined by the distance from the shore (15 × 103 m), the width (1 m) and depth (1.5 m) considering the position of the buoy sensors;
-
V2 is the final volume.
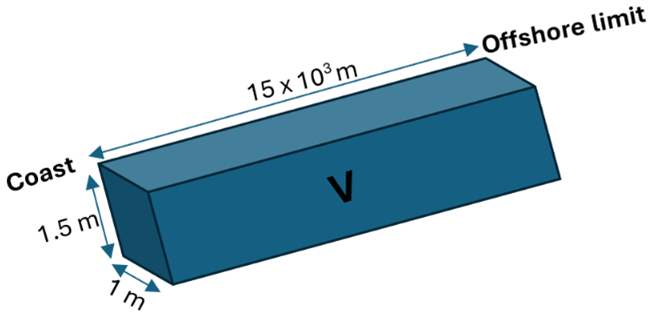
Note that the control volume is defined by an offshore distance of 15 × 103 m, consistent with the observed plume extent, a depth of 1.5 m corresponding to the buoy sensor level, and an alongshore width of 1 m. This width is intentionally chosen to express the freshwater requirement per meter of coastline. The resulting freshwater rate therefore represents the required freshwater inflow per meter of coastline near the buoy location, rather than the total discharge integrated along the entire coastal segment.
Equation ρ1S1V1=ρ2S2V2 can be solved for m3 and the corresponding volume change m3 provides the freshwater volume and the flow rate (Qf) required to achieve the average salinity change of 0.982 g kg−1 d−1 (from 36.194 to 23.424 g kg−1) over the first specified 13 d period as follows: m3 d−1 or 42.509 m3 h−1.
A3 Statistical analysis
Following Emery and Thomson (1998), the standard deviation (σ) and the corresponding standard error (Sε) were calculated from the variance (σ2) as follows:
where xi is the ith data point in the dataset and N is the number of data points.
Correspondingly, the Root Mean Square Difference (RMSD) and bias of the different datasets (x,y) were calculated based on the following equations:
In addition, the cross-covariance (Cxy) and cross-correlation (rxy) function was used to assess the relationship between two time series (Emery and Thomson, 1998). Assuming that x and y are the relative variables, the function was calculated as follows:
where τ=kΔt is the lag time for k sampling time increments of duration Δt
where σx and σy are the standard deviations for each time series.
A4 Summary of the freshening events
Table A4Overview of the 5 defined freshening events, representing the start and end date, the duration (in days) and the highest and lowest measured absolute salinity during each corresponding event (in g kg−1).
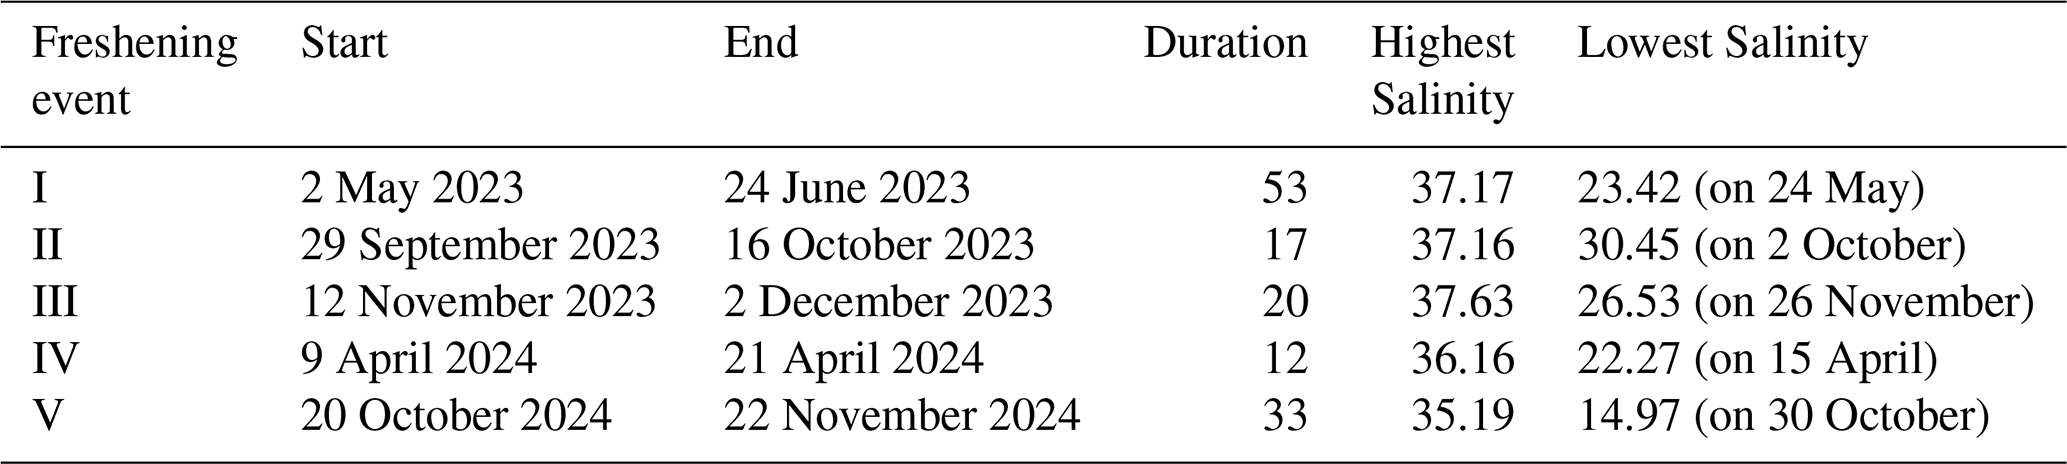
Table A5Overview of the most pronounced freshening period during each event, representing the duration (in days) during which the largest total decrease in surface salinity (in g kg−1) was observed. The corresponding maximum and minimum salinity values and the respective timestamps are reported.
A5 Lead-lag correlations between accumulated precipitation and river discharge responses
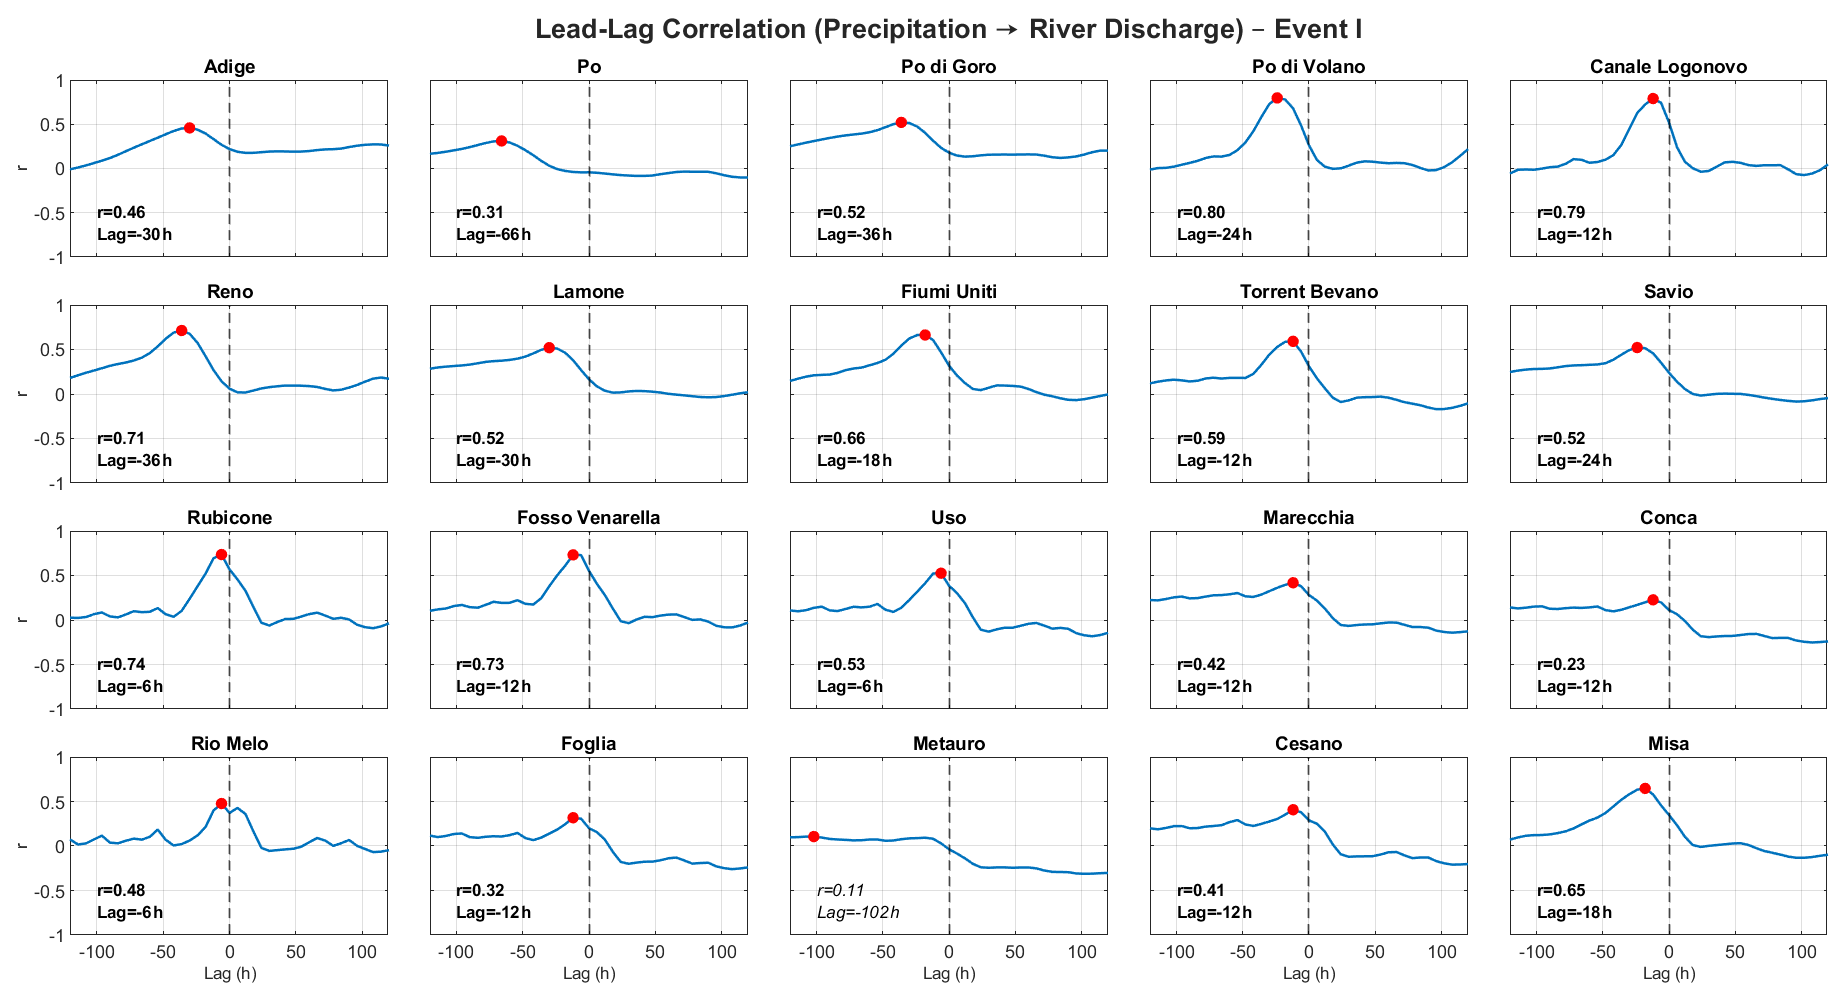
Figure A2Lead-lag correlation plots between accumulated precipitation over the Emilia-Romagna region and the discharge of 20 rivers during the first major flooding periods that lead to the previously-defined freshening event I. Each subplot shows the Pearson correlation coefficient (r) as a function of lag time (in hours), where negative lags indicate that precipitation leads river discharge. The maximum correlation point for each river is marked with a red dot. Corresponding correlation values and lags are annotated in bold if statistically significant (p < 0.05), and in italics otherwise.
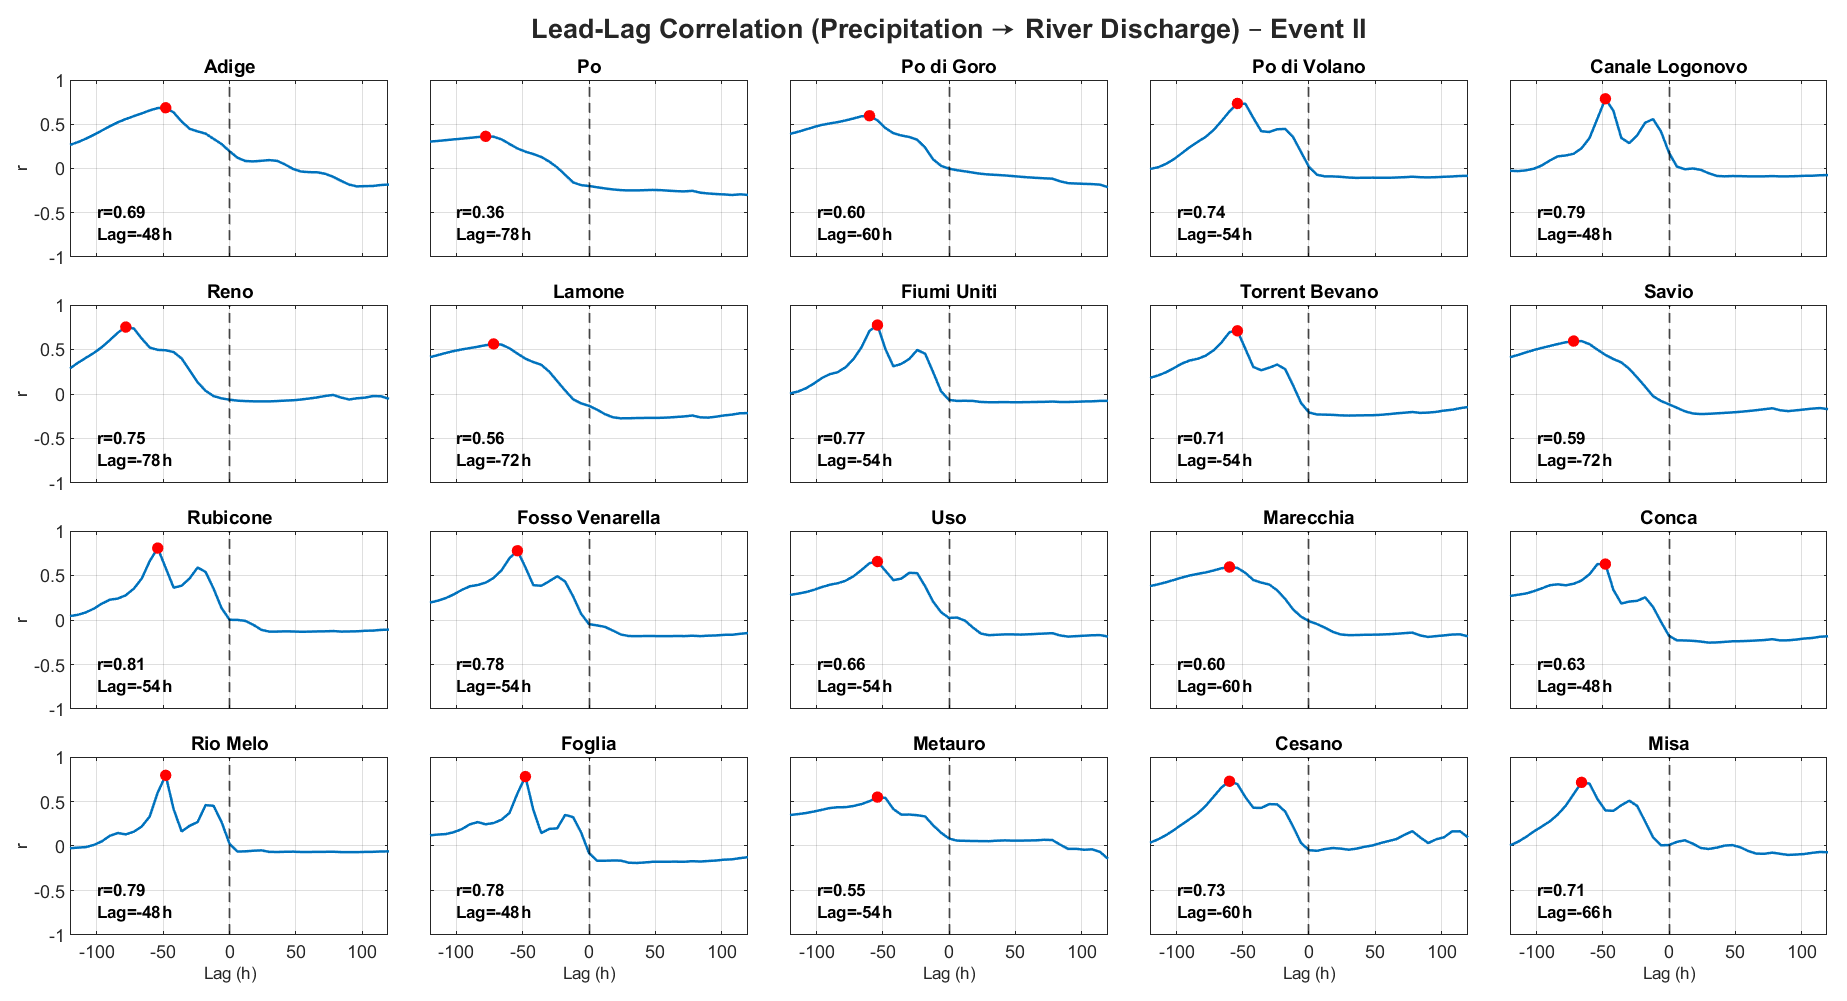
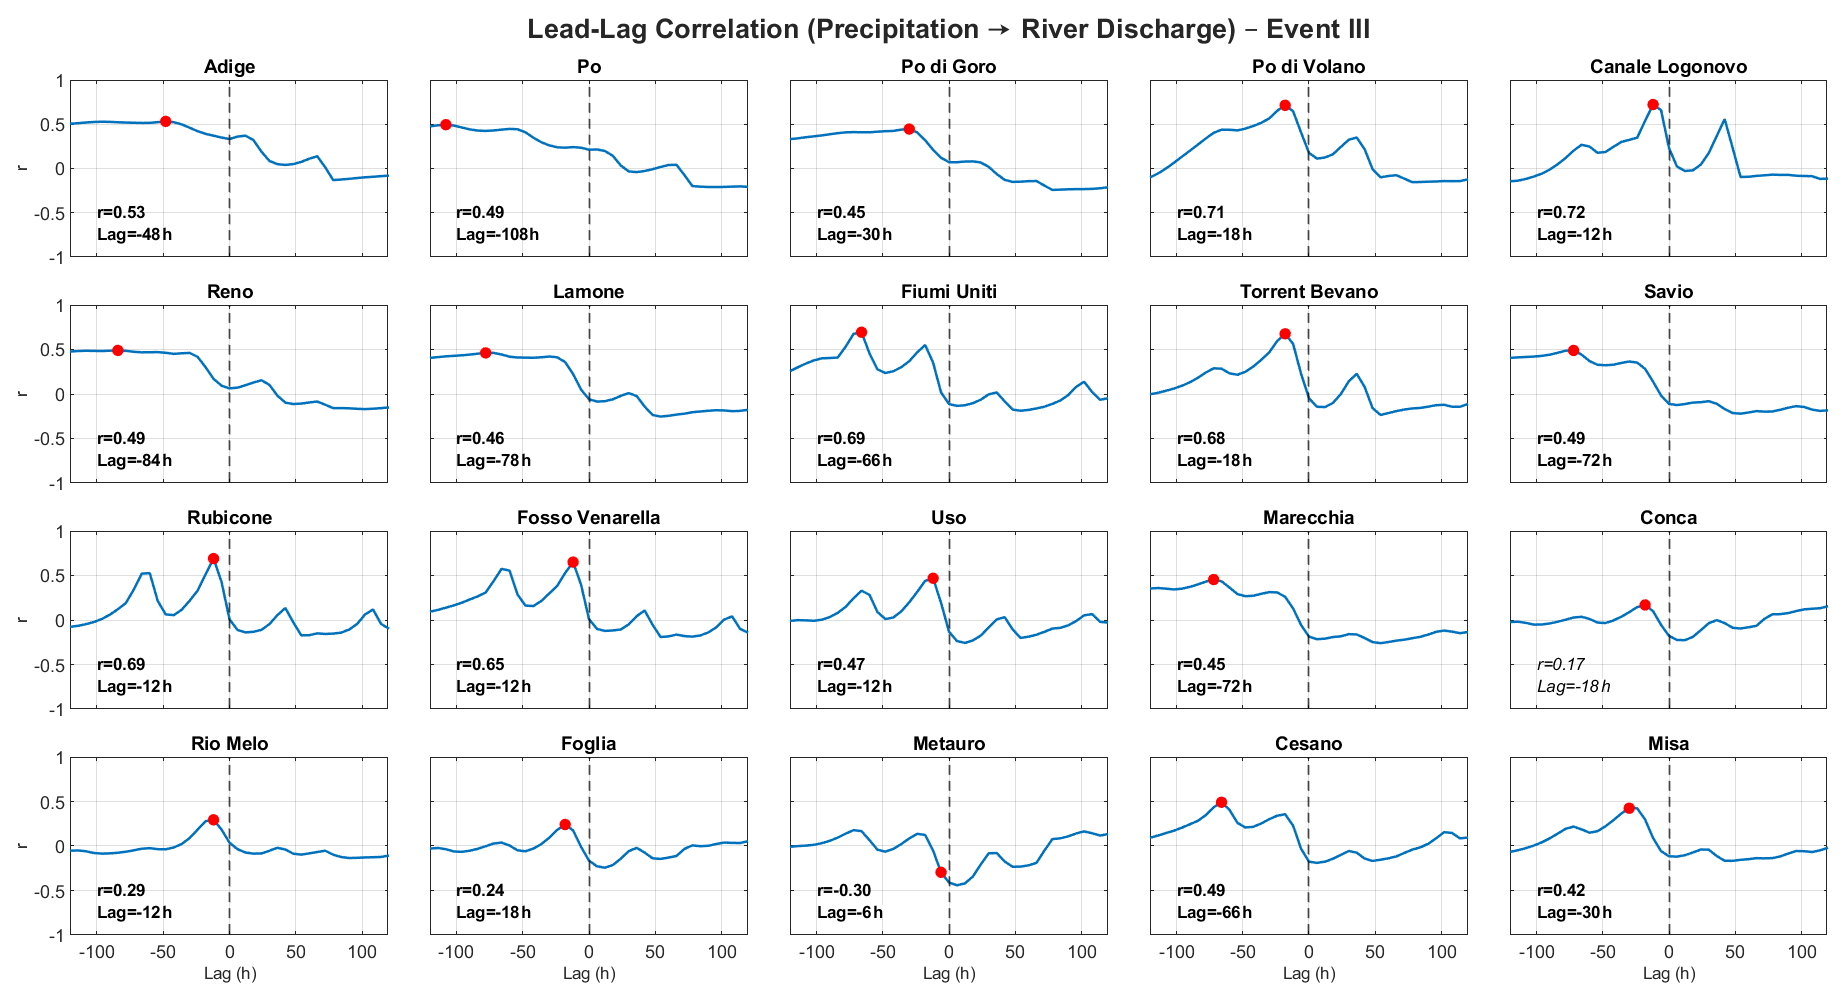
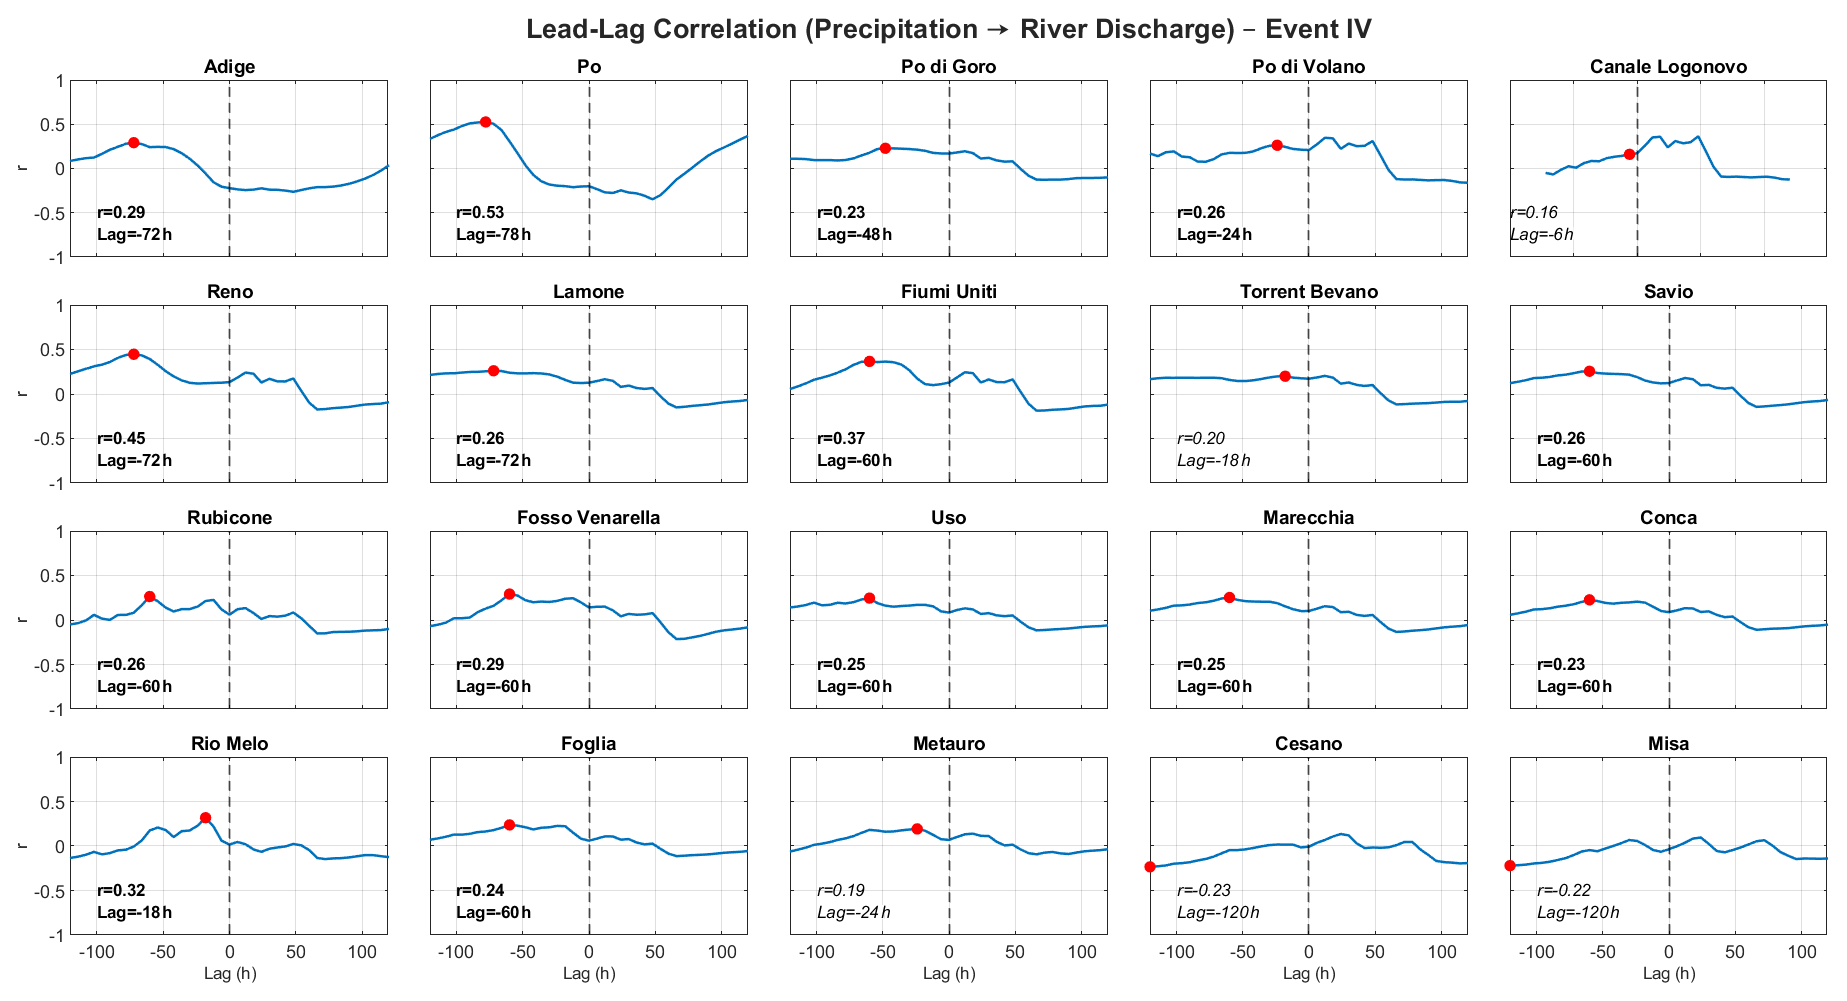
Utilized datasets as well as their availability and documentations are summarized in Table 1. MATLAB scripts used for the analyses described in this study can be obtained from the corresponding author upon reasonable request. The country and regional boundaries shown in the maps are based on GADM shapefiles (version 4.1) which are available at https://gadm.org/download_country.html (last access: 14 May 2026). The utilized colormaps are freely available in the cmocean package described by Thyng et al. (2016) and accessible via the MATLAB Central File Exchange (https://www.mathworks.com/matlabcentral/fileexchange/57773-cmocean-perceptually-uniform-colormaps, last access: 14 May 2026), containing perceptually uniform colormaps for commonly used oceanographic variables.
N.K. processed and analyzed the data, prepared the figures and wrote the manuscript. P.F., E.Z., F.M., contributed to the paper organization and to the interpretation of the results. P.F. and P.P. were responsible for the project management of the meteo-oceanographic buoy Fortunae offshore of Fano, and P.P. for the Meda Station offshore of Senigallia. F.M. enabled the near real-time transfer and online visualization of the corresponding data. P.P., A.C., F.M., P.F., F.M., and N.K. were involved in the maintenance and quality assurance of the meteo-oceanographic instruments. All authors reviewed the manuscript.
The contact author has declared that none of the authors has any competing interests.
The Copernicus Marine Service offering is regularly updated to ensure it remains at the forefront of user requirements. In this process, some products may undergo replacement or renaming, leading to the removal of certain product IDs from the catalogue. If readers have any questions or require assistance regarding these modifications, please feel free to reach out to the Copernicus Marine Service user support team for further guidance. They will be able to provide the necessary information to address concerns and find suitable alternatives.
Publisher's note: Copernicus Publications remains neutral with regard to jurisdictional claims made in the text, published maps, institutional affiliations, or any other geographical representation in this paper. The authors bear the ultimate responsibility for providing appropriate place names. Views expressed in the text are those of the authors and do not necessarily reflect the views of the publisher.
The authors would like to thank and acknowledge the logistical support provided by Port Marina dei Cesari (https://marinadeicesari.it, last access: 14 May 2026), which was essential for the buoy maintenance offshore of Fano.
This paper was edited by Piero Lionello and reviewed by two anonymous referees.
Arrighi, C. and Domeneghetti, A.: Brief communication: On the environmental impacts of the 2023 floods in Emilia-Romagna (Italy), Nat. Hazards Earth Syst. Sci., 24, 673–679, https://doi.org/10.5194/nhess-24-673-2024, 2024.
Colella, S., Böhm, E., Cesarini, C., Jutard, Q., and Brando, V. E.: EU Copernicus Marine Service Product User Manual for Mediterranean Sea, Bio-Geo-Chemical, L4, monthly means, daily gapfree and climatology Satellite Observations (Near Real Time), OCEANCOLOUR_MED_BGC_L4_NRT_009_142, Issue 5.0, Mercator Ocean International, https://documentation.marine.copernicus.eu/PUM/CMEMS-OC-PUM.pdf (last access: 14 May 2026), 2024.
Colella, S., Brando, V.E., Di Cicco, A., D'Alimonte, D., Forneris, V., and Bracaglia, M.: EU Copernicus Marine Service Quality Information Document for is Mediterranean Sea, Bio-Geo-Chemical, L4, monthly means, daily gapfree and climatology Satellite Observations (Near Real Time), OCEANCOLOUR_MED_BGC_L4_NRT_009_142, Issue 4.1, Mercator Ocean International, https://documentation.marine.copernicus.eu/QUID/CMEMS-OC-QUID-009-141to144-151to154.pdf (last access: 14 May 2026), 2025.
Coll, M., Piroddi, C., Steenbeek, J., Kaschner, K., Ben Rais Lasram, F., Aguzzi, J., Ballesteros, E., Bianchi, C. N., Corbera, J., Dailianis, T., Danovaro, R., Estrada, M., Froglia, C., Galil, B. S., Gasol, J. M., Gertwagen, R., Gil, J., Guilhaumon, F., Kesner-Reyes, K., Kitsos, M.-S., Koukouras, A., Lampadariou, N., Laxamana, E., López-Fé de la Cuadra, C. M., Lotze, H. K., Martin, D., Mouillot, D., Oro, D., Raicevich, S., Rius-Barile, J., Saiz-Salinas, J. I., San Vicente, C., Somot, S., Templado, J., Turon, X., Vafidis, D., Villanueva, R., and Voultsiadou, E.: The biodiversity of the Mediterranean Sea: estimates, patterns, and threats, PLoS ONE, 5, e11842, https://doi.org/10.1371/journal.pone.0011842, 2010.
Copernicus Climate Change Service, Climate Data Store: ERA5 hourly data on single levels from 1940 to present, Copernicus Climate Change Service (C3S) Climate Data Store (CDS) [data set], https://doi.org/10.24381/cds.adbb2d47, 2023.
Copernicus Emergency Management Service: River discharge and related historical data from the European Flood Awareness System, Joint Research Center, Copernicus Emergency Management Service (2019), User guide, https://confluence.ecmwf.int/display/CEMS/GloFAS+User+Guide (last access: 5 May 2025), 2025.
Costanza, R., de Groot, R., Sutton, P., van der Ploeg, S., Anderson, S. J., Kubiszewski, I., Farber, S., and Turner, R. K.: Changes in the global value of ecosystem services, Global Environ. Change, 26, 152–158, https://doi.org/10.1016/j.gloenvcha.2014.04.002, 2014.
Cozzi S. and Giani, M.: River water and nutrient discharges in the Northern Adriatic Sea: Current importance and long term changes, Cont. Shelf Res., 31, 1881–1893, https://doi.org/10.1016/j.csr.2011.08.010, 2011.
Earle, M. D.: Nondirectional and Directional Wave Data Analysis Procedures, NDBC Technical Document 96-01, National Data Buoy Center, Stennis Space Center, MS, USA, 43 pp., https://www.ndbc.noaa.gov/wavemeas.pdf (last access: 19 May 2026), 1996.
Emery, W. J. and Thomson, R. E.: Data Analysis Methods in Physical Oceanography, 2nd edn., Elsevier, Amsterdam, 638 pp., ISBN 978-0-12-387782-6, 1998.
EU Copernicus Marine Service Product: Mediterranean Sea High Resolution and Ultra High Resolution Sea Surface Temperature Analysis, Mercator Ocean International [data set], https://doi.org/10.48670/moi-00172, 2024a.
EU Copernicus Marine Service Product: Mediterranean Sea Physics Analysis and Forecast, Mercator Ocean International [data set], https://doi.org/10.48670/mds-00359, 2024b.
EU Copernicus Marine Service Product: Mediterranean Sea Biogeochemistry Analysis and Forecast, Mercator Ocean International [data set], https://doi.org/10.48670/mds-00358, 2024c.
EU Copernicus Marine Service Product: Mediterranean Sea, Bio-Geo-Chemical, L4, monthly means, daily gapfree and climatology Satellite Observations (Near Real Time), Mercator Ocean International [data set], https://doi.org/10.48670/moi-00298, 2025.
Falcieri, F. M., Benetazzo, A., Sclavo, M., Russo, A., and Carniel, S.: Po River plume pattern variability investigated from model data, Cont. Shelf Res., 87, 84–95, https://doi.org/10.1016/j.csr.2013.11.001, 2014.
Fano Marine Center: High-resolution in-situ observation from the meteo-oceanographic buoy Fortunae offshore of Fano, CNR-IRBIM, UNIVPM DISVA [data set], https://fanomarinecenter.eu/it/ricerca/boa-meteo-marina (last access: 17 May 2025), 2025.
Feudale, L., Teruzzi, A., Salon, S., Bolzon, G., Lazzari, P., Di Biagio, V., Álvarez, E., Amadio, C., and Cossarini, G.: EU Copernicus Marine Service Quality Information Document for Mediterranean Sea Biogeochemical Analysis and Forecasting Product, MEDSEA_ANALYSISFORECAST_BGC_006_014, Issue 3.2, Mercator Ocean International, https://documentation.marine.copernicus.eu/QUID/CMEMS-MED-QUID-006-014.pdf (last access: 14 May 2026), 2024.
Gualtieri, L., Goglio, A. C., Clementi, E., Grandi, A., Moulin, A., Giurato, M., Aydogdu, A., Pistoia, J., Miraglio, P., Sadighrad, E., Mariani, A., and Drudi, M.: EU Copernicus Marine Service Quality Information Document for the Mediterranean Sea Physics Analysis and Forecast, MEDSEA_ANALYSISFORECAST_PHY_006_013, Issue 2.5, Mercator Ocean International, https://documentation.marine.copernicus.eu/QUID/CMEMS-MED-QUID-006-013.pdf (last access: 14 May 2026), 2024.
Goudeau, M.-L. S., Grauel, A.-L., Bernasconi, S. M., and de Lange, G. J.: Provenance of surface sediments along the southeastern Adriatic coast off Italy: An overview, Estuar. Coast. Shelf Sci., 134, 45–56, https://doi.org/10.1016/j.ecss.2013.09.009, 2013.
Hersbach, H., Bell, B., Berrisford, P., Biavati, G., Horányi, A., Muñoz Sabater, J., Nicolas, J., Peubey, C., Radu, R., Rozum, I., Schepers, D., Simmons, A., Soci, C., Dee, D., and Thépaut, J.-N.: ERA5 hourly data on single levels from 1940 to present, Copernicus Climate Change Service (C3S) Climate Data Store (CDS) [data set], https://doi.org/10.24381/cds.adbb2d47, 2023.
IOC, SCOR, and IAPSO: The international thermodynamic equation of seawater – 2010: Calculation and use of thermodynamic properties, Intergovernmental Oceanographic Commission, Manuals and Guides No. 56, UNESCO, Paris, France, 196 pp., https://www.teos-10.org/pubs/TEOS-10_Manual.pdf (last access: 12 February 2025), 2010.
IPCC: Chapter 4: Sea Level Rise and Implications for Low-Lying Islands, Coasts and Communities, in: The Ocean and Cryosphere in a Changing Climate: Special Report of the Intergovernmental Panel on Climate Change, Cambridge University Press, 321–446, https://doi.org/10.1017/9781009157964.006, 2022.
IPCC: Climate Change 2023: Synthesis Report. Contribution of Working Groups I, II and III to the Sixth Assessment Report of the Intergovernmental Panel on Climate Change, edited by: Core Writing Team, Lee, H., and Romero, J., IPCC, Geneva, Switzerland, 35–115, https://doi.org/10.59327/IPCC/AR6-9789291691647, 2023.
IRBIM-CNR: High-resolution in-situ observations from the meteo-oceanographic Meda station offshore of Senigallia, CNR-IRBIM [data set], https://gr.irbim.cnr.it/grafana/d/ddN5kDf7k/senigallia-meda?orgId=1&from=now-30d&to=now&timezone=browser (last access: 17 May 2025), 2025.
Lecci, R., Drudi, M., Grandi, A., and Clementi, E.: EU Copernicus Marine Service Product User Manual for the Mediterranean Sea Physics Analysis and Forecast, MEDSEA_ANALYSIS FORECAST_PHY_006_013, Issue 2.4, Mercator Ocean International, https://documentation.marine.copernicus.eu/PUM/CMEMS-MED-PUM-006-013.pdf (last access: 14 May 2026), 2024a.
Lecci, R., Salon, S., Bolzon, G., and Cossarini, G.: EU Copernicus Marine Service Product User Manual for Mediterranean Sea Biogeochemical Analysis and Forecasting Product, MEDSEA _ANALYSISFORECAST_BGC_006_014, Issue 2.4, Mercator Ocean International, https://documentation.marine.copernicus.eu/PUM/CMEMS-MED-PUM-006-014.pdf (last access: 14 May 2026), 2024b.
Ludwig, W., Dumont, E., Meybeck, M., and Heussner, S.: River discharges of water and nutrients to the Mediterranean and Black Sea: Major drivers for ecosystem changes during past and future decades?, Prog. Oceanogr., 80, 199–217, https://doi.org/10.1016/j.pocean.2009.02.001, 2009.
Mazzetti, C., Carton de Wiart, C., Gomes, G., Russo, C., Decremer, D., Ramos, A., Grimaldi, S., Disperati, J., Ziese, M., Schweim, C., Sanchez Garcia, R., Jacobson, T., Salamon, P., and Prudhomme, C.: River discharge and related historical data from the European Flood Awareness System, v5.0, European Commission, Joint Research Centre [data set], https://doi.org/10.24381/cds.e3458969, 2023.
McDougall, T. J. and Barker, P. M.: Getting started with TEOS-10 and the Gibbs Seawater (GSW) Oceanographic Toolbox, SCOR/IAPSO WG127, 28 pp., ISBN 978-0-646-55621-5, https://www.teos-10.org/pubs/Getting_Started.pdf (last access: 10 May 2026), 2011.
Penna, P., Moro, F., and Falco, P.: Real-time in-situ observation from the meteo-oceanographic buoy Fortunae offshore of Fano, CNR-IRBIM, UNIVPM DISVA, https://gr.irbim.cnr.it/grafana/d/afF9UzKVk/fano-meda-fmc?kiosk&orgId=1 (last access: 15 May 2025), 2025a.
Penna, P., Moro, F., and Giuliani, G.: Real-time in-situ observation from the meteo-oceanographic Meda station offshore of Senigallia, CNR-IRBIM, UNIVPM DISVA, https://www.irbim.cnr.it/sitoss-dettagli/stazione-meteo-marina-senigallia/ (last access: 17 May 2025), 2025b.
Pisano, A., Fanelli, C., Ciani, D., Tronconi, C., Cesarini, C., La Padula, F., and Buongiorno Nardelli, B.: EU Copernicus Marine Service Product User Manual for the Mediterranean Sea High Resolution and Ultra High Resolution Sea Surface Temperature Analysis, SST_MED_SST_L4_NRT_OBSERVATIONS_010_004, Issue 5.0, Mercator Ocean International, https://documentation.marine.copernicus.eu/PUM/CMEMS-SST-PUM-010-004-012.pdf (last access: 14 May 2026), 2024a.
Pisano, A., Fanelli, C., Ciani, D., Tronconi, C., Cesarini, C., La Padula, F., and Buongiorno Nardelli, B.: EU Copernicus Marine Service Quality Information Document for the Mediterranean Sea High Resolution and Ultra High Resolution Sea Surface Temperature Analysis, SST_MED_SST_L4_NRT_OBSERVATIONS_010_004, Issue 5.0, Mercator Ocean International, https://documentation.marine.copernicus.eu/QUID/CMEMS-SST-QUID-010-004-006-012-013.pdf (last access: 14 May 2026), 2024b.
Tan, X., Wu, X., Huang, Z., Fu, J., Tan, X., Deng, S., Liu, Y., Yew Gan, T., and Liu, B.: Increasing global precipitation whiplash due to anthropogenic greenhouse gas emissions, Nat. Commun., 14, 2796, https://doi.org/10.1038/s41467-023-38510-9, 2023.
Thyng, K. M., Greene, C. A., Hetland, R. D., Zimmerle, H. M., and DiMarco, S. F.: True colors of oceanography: Guidelines for effective and accurate colormap selection, Oceanography, 29, 9–13, https://doi.org/10.5670/oceanog.2016.66, 2016.
Wang, J., Wang, Z., Wang, Y., Liu, S., and Li, Y.: Current situation and trend of marine data buoy and monitoring network technology of China, Acta Oceanol. Sin., 35, 1–10, https://doi.org/10.1007/s13131-016-0815-z, 2016.
Wright, L. D. and Nichols, C. R. (Eds.): Tomorrow's Coasts: Complex and Impermanent, Coastal Research Library, vol. 27, Springer, Cham, https://doi.org/10.1007/978-3-319-75453-6, 2019.
Zscheischler, J., Westra, S., van den Hurk, B. J. J. M., Seneviratne, S. I., Ward, P. J., Pitman, A., AghaKouchak, A., Bresch, D. N., Leonard, M., Wahl, T., and Zhang, X.: Future climate risk from compound events, Nat. Clim. Change, 8, 469–477, https://doi.org/10.1038/s41558-018-0156-3, 2018.