the Creative Commons Attribution 4.0 License.
the Creative Commons Attribution 4.0 License.
 | 30 Sep 2026 | OSR10 | Chapter 4.1
Impact of Storm Louis on two Spanish harbours: a multi-platform approach
Pablo Lorente
Garbiñe Ayensa
Marta De Alfonso
Samuel Galán
Pilar Gil
Fernando Manzano
Anna Magdalena Matulka
Pedro Montero
Verónica Morales-Márquez
Begoña Pérez-Gómez
Cristina Pérez-Íñigo
Susana Pérez-Rubio
M. Isabel Ruiz
Storm Louis struck southwestern Europe between 22 and 26 February 2024, producing severe metocean conditions that led to significant disruptions in transportation networks, widespread power outages, and one confirmed fatality. This high-impact event exemplified the growing threat that deep extratropical cyclones pose to European coastal infrastructure. The synoptic-scale characteristics of Storm Louis were examined using ERA5 reanalysis data, revealing a marked Azores High–Iceland Low pressure dipole configuration, indicative of the canonical manifestation of the positive phase of the North Atlantic Oscillation. A strong SW–NE pressure gradient gave rise to persistent and anomalously intense northwesterly maritime-polar winds over the northeastern Atlantic Ocean and the Iberian Peninsula that induced significant wave heights above 8 m. The concurrent impact on two geographically distant Spanish ports – Langosteira in the northwestern Iberian (NWI) region and Tarragona in the northeastern Iberian (NEI) region – was evaluated using a multi-platform observational framework that integrates in situ measurements from four moored buoys and two tide gauges with remotely sensed data provided by two high-frequency radar (HFR) systems. In the NWI (NEI) area, multiple observed wind and wave parameters associated with Storm Louis exceeded the 99.9th (99th) historical percentiles, based on the available 11-year observational record period spanning 2014–2024. Analysis of high-frequency sea level oscillations, recorded by tide gauges at both ports during Storm Louis, revealed contrasting wave-induced agitation responses between the Langosteira and Tarragona harbours, despite exceedance of their respective historical 99th percentile threshold. The former experienced a moderate but prolonged (33 h long) event peaking at 0.68 m with minimal storm surge influence, while the latter underwent a shorter (16 h long), more intense peak of 1.77 m, also decoupled from storm surge. Over the 2014–2024 period, the relationship between offshore wave parameters and inner-harbour agitation was explored to isolate the open-ocean conditions most strongly associated with critical in-port sea states likely to compromise maritime operations. Results revealed significantly high linear correlations between offshore wave height conditions and harbour agitation (R = 0.88 for Langosteira, R = 0.75 for Tarragona). However, Tarragona harbour exhibited a more complex, bimodal directional response: peak agitation events were predominantly associated with moderate offshore wave heights (< 3 m) propagating from the southernmost sector, underscoring the harbour's marked sensitivity to wave incidence angle and its role in amplifying internal hydrodynamic response. Finally, HFR wave data, validated against buoy observations, reliably captured storm-induced waves, highlighting their value for real-time extreme-hazard assessment and climate-resilient port infrastructure.
- Article
(3413 KB) - Full-text XML
- BibTeX
- EndNote


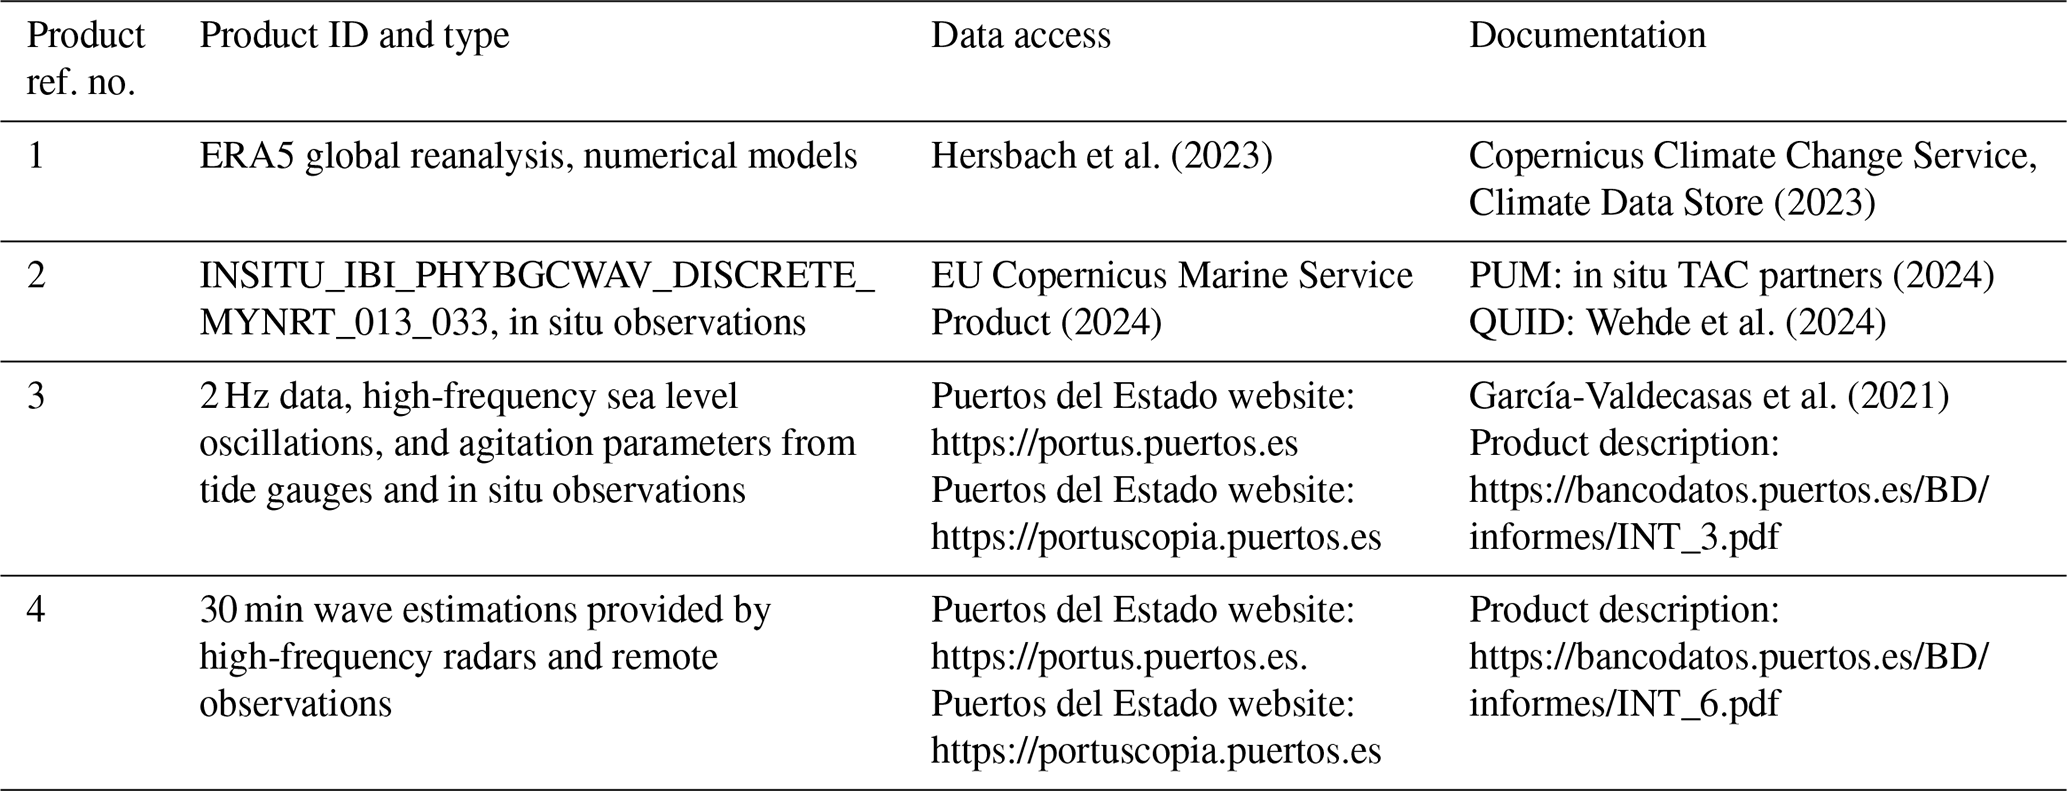
Table 1Products from the Copernicus Marine Service and other complementary datasets used in this study, including the Product User Manual (PUM) and QUality Information Document (QUID). For complementary datasets, the link to the product description, data access, and scientific references are provided. Last access for all web pages cited in this table: 21 July 2025.
The genesis of deep extratropical cyclones over central Europe is governed by a complex interplay of synoptic-scale atmospheric and oceanic factors (Mohr et al., 2020). These systems commonly emerge when warm, moisture-laden air advected from the Mediterranean or North Atlantic converges with cold and dry continental air masses of Arctic or Siberian origin. The resulting sharp thermal and moisture gradients create atmospheric instability: as the warm air ascends and the colder air descends, a low-pressure centre forms, making the region susceptible to highly dynamic and rapidly evolving weather conditions. Such systems are often associated with intense windstorms; heavy precipitation; and, in some cases, catastrophic flooding, particularly during the winter season (Álvarez-Fanjul et al., 2022; Owen et al., 2021; Jacobeit et al., 2006; Wanner et al., 2004).
The socio-economic relevance of extreme extratropical cyclones has become increasingly prominent in recent decades, particularly in the context of anthropogenic climate change altering their frequency, intensity, and spatial distribution (Khodayar et al., 2025; Cao and Su, 2025; Kleespies et al., 2024; Konisky et al., 2015). These high-impact events have exposed the structural vulnerabilities of western Europe, highlighting the substantial risk posed to critical infrastructure, human assets, and regional economies (Leal Filho et al., 2024; Mateos et al., 2023; Forzieri et al., 2018). For instance, Storm Kyrill (17–19 January 2007) produced hurricane-force winds across large areas of Europe, resulting in 47 fatalities and generating the highest insured storm losses recorded in Europe to date (Kettle, 2023; Fink et al., 2009). Similarly, Storm Klaus (23–24 January 2009) caused 26 direct fatalities while impacting northern Iberia and southern France, with more than 715 000 insurance claims filed and total losses exceeding USD 6.0 billion, ranking it the costliest weather-related disaster globally that year (Liberato et al., 2011; Aon-Benfield, 2010). Storm Gloria (19–24 January 2020) caused several casualties and multi-million USD worth of damages in susceptible coastal areas of eastern Spain (Álvarez-Fanjul et al., 2022). These events illustrate the mounting economic burden of windstorms under current climatic conditions and underscore the urgency of improved risk assessment, adaptation strategies, and early warning systems.
Severe sea states associated with extreme storm events can significantly disrupt port operations and damage coastal infrastructure, particularly in vulnerable locations such as deltas, low-lying areas, and erosion-prone shorelines (Lucio et al., 2024). Given their strategic role as logistic hubs within maritime transport networks, international supply chains, and global trade, ports are critical economic assets (Verschuur et al., 2022). Consequently, storm-induced disruptions can result in substantial financial losses, not only from direct damages and operational delays but also from reputational impacts in an increasingly competitive global marketplace (Verschuur et al., 2023).
In recent years, extensive research has focused on assessing the vulnerability of port infrastructure to extreme weather, advancing climate risk analyses and formulating adaptation strategies within the Spanish port system (Fernández-Pérez et al., 2024; Portillo Juan et al., 2022; Izaguirre et al., 2021; Camus et al., 2019; Sánchez-Arcilla et al., 2016). At the global scale, a comprehensive survey by Asariotis et al. (2017), encompassing port authorities in 29 countries across all world regions, reported that approximately 70 % of respondents had experienced weather-related disruptions. These included impacts on operations (76 %), delays (60 %), and physical damage (45 %). The most frequently cited climatic stressors – ranked in decreasing order – were strong winds, heavy precipitation, storm surges, fog, and wave penetration.
While high wind speeds can severely hinder crane operations and cargo handling efficiency within port terminals (Piñeres-Castillo and Mojica-Herazo, 2024), the operability of vessels is predominantly governed by the energy and directionality of incident offshore waves penetrating into the port basin, where they interact with complex bathymetry, harbour geometries, and structural elements (Romano-Moreno et al., 2022; Sierra et al., 2015, 2023). The resulting intra-harbour wave dynamics – commonly referred to as wave agitation – can significantly degrade operational efficiency and compromise safety margins. Excessive wave agitation amplifies vessel motions at berth, increasing the risk of mooring line failures and vessel–structure collisions, with potential damage to both ships and port infrastructure (Díaz-Hernández et al., 2021).
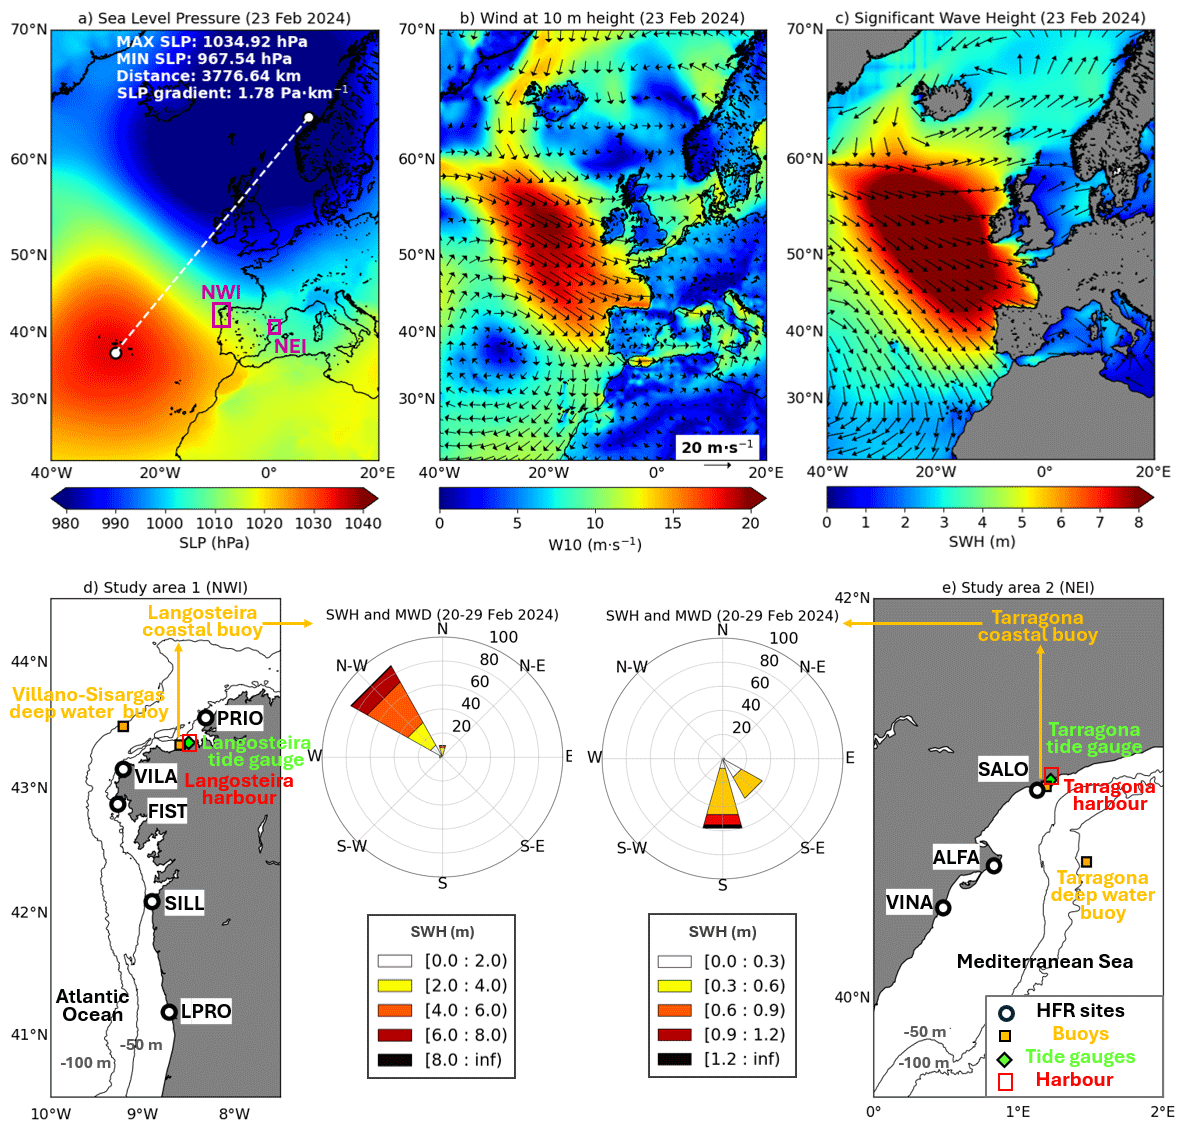
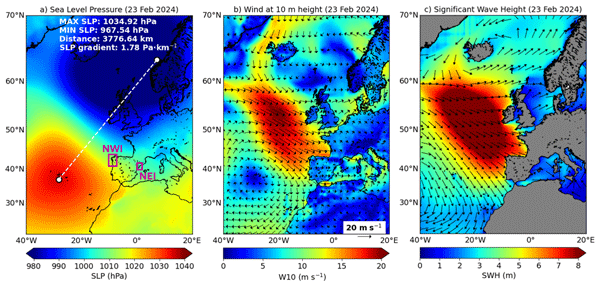
Figure 1(a–c) Synoptic-scale metocean conditions during Storm Louis as derived from ERA5 (product ref. no. 1, Table 1): daily maps of sea level pressure (SLP), wind at 10 m height (W10), and significant wave height (SWH) for 23 February 2024 (peak intensity of Storm Louis). (d–e) Study areas: northwestern Iberia (NWI) and northeastern Iberia (NEI) regions, respectively. The location of each ocean sensor – product ref. nos. 2, 3, and 4 (Table 1) – employed in this work is depicted. The orange squares, green diamonds, and white dots denote the location of moored buoys, tide gauges, and high-frequency radar (HFR) sites, respectively. The red boxes denote the harbour's location. Isobath depths are labelled every 50 m. Wave roses illustrate the mean incoming wave direction (MWD) and SWH during a 10 d period (20–29 February 2024) – product ref. no. 2 (Table 1).
In this context, the precise monitoring and comprehensive understanding of extreme-weather-related hazards are essential not only for the implementation of effective prevention strategies and the informed management of port operations, but also for strengthening the socio-ecological resilience of coastal communities (Linnenluecke et al., 2012). The present study focuses on the characterization of Storm Louis, which was associated with a deep low-pressure system (Fig. 1a) that traversed the North Atlantic, delivering severe weather conditions across large areas of western Europe between 22 and 26 February 2024. The storm was marked by intense rainfall and powerful winds (Fig. 1b), with sustained gusts exceeding 20 m s−1 that caused widespread disruptions, including transportation delays, power outages, and one fatality reported in France. In Spain, the event was officially classified by the State Meteorological Agency (AEMET) as a high-impact storm, reflecting wind gusts locally exceeding 140 km h−1 and the generation of extreme sea states (AEMET, 2025). From an oceanographic standpoint, the northwesterly winds accompanying the storm generated pronounced swell, with significant wave heights in the range of 6–8 m and local maxima exceeding 8 m (Fig. 1c), which severely impacted the Galician and Cantabrian coastlines (NW Iberia region) and, more specifically, Langosteira harbour (Figs. 1d and A1a). Additionally, harsh metocean conditions were also observed in NE Iberia: strong southeasterly winds (above 12 m s−1, Fig. 1b) induced high waves that easily penetrated into Tarragona harbour due to its mouth orientation (Figs. 1e and A1b). While these conditions may have challenged port operations at the entrance, no operational disruptions were officially reported along the piers.
The signature of Storm Louis was investigated through a multi-platform observational framework, integrating both in situ instruments (four directional wave moored buoys and two tide gauges) and remote sensing technology (two high-frequency radar networks, hereinafter HFR) – to capture the storm's concurrent impact on two geographically distant Spanish harbours, located in the northwestern and northeastern Iberian areas, respectively (NWI and NEI, in Fig. 1a). A key novelty of this work lies in the integrated use of these complementary observational platforms, which allows for a comprehensive, cross-scale characterization of storm-driven harbour impacts (Davidson et al., 2019; Tintoré et al., 2019). This approach enabled a detailed assessment of the relationship between offshore wave characteristics and the resulting sea state within each harbour domain. The analysis aimed to identify which open-ocean conditions are most likely to trigger hazardous port conditions, potentially disrupting maritime operations and compromising the cost–time efficiency of port logistics (Lorente et al., 2024; Romano-Moreno et al., 2022; Díaz-Hernández et al., 2021; Sierra et al., 2015, 2023).
As a secondary objective, the performance of both HFR networks in accurately monitoring extreme offshore wave conditions during Storm Louis was quantitatively assessed. While this land-based remote sensing technology has achieved global recognition for its capability to deliver reliable, near-real-time, two-dimensional surface current maps (Roarty et al., 2019; Rubio et al., 2017), its application to wave field characterization remains relatively limited within operational oceanography, with most studies confined to academic research settings (Morales-Márquez et al., 2024; Saviano et al, 2022; Lorente et al., 2022; López and Conley, 2019; Wyatt et al., 2005; Wyatt, 1986). To address this gap, a skill assessment was conducted by comparing HFR-derived wave parameters against in situ wave measurements from moored buoys located within the HFR coverage area. This evaluation aimed to enhance confidence in the use of HFR networks for monitoring extreme wave events, thereby supporting their integration into operational coastal hazard forecasting and maritime risk management frameworks (Basañez et al., 2019; Atan et al., 2015, 2016).
This work is structured as follows. Section 2 outlines the observational and modelled data sources. Section 3 describes the methodology adopted. Results are presented and discussed in Sect. 4. Finally, principal conclusions are drawn in Sect. 5.
All modelled and observational datasets employed in this study are summarized in Tables 1 and 2 and are briefly described below. While some in situ instruments were deployed prior to 2014, the observational time series were standardized to the 2014–2024 period for consistency reasons, as the collection of directional wave data by the Langosteira coastal buoy started on June 2013 (Table 3).
Table 2Complementary information about the data sources used in this study. The temporal resolution column corresponds to the processed datasets employed in the analysis and do not reflect the native resolution of the original, raw data. SLP, W10, SWH, MWP, PWP, CWP, and MWD stand for sea level pressure, wind at 10 m height, significant wave height, mean wave period, peak wave period, centroid wave period, and incoming mean wave direction, respectively.
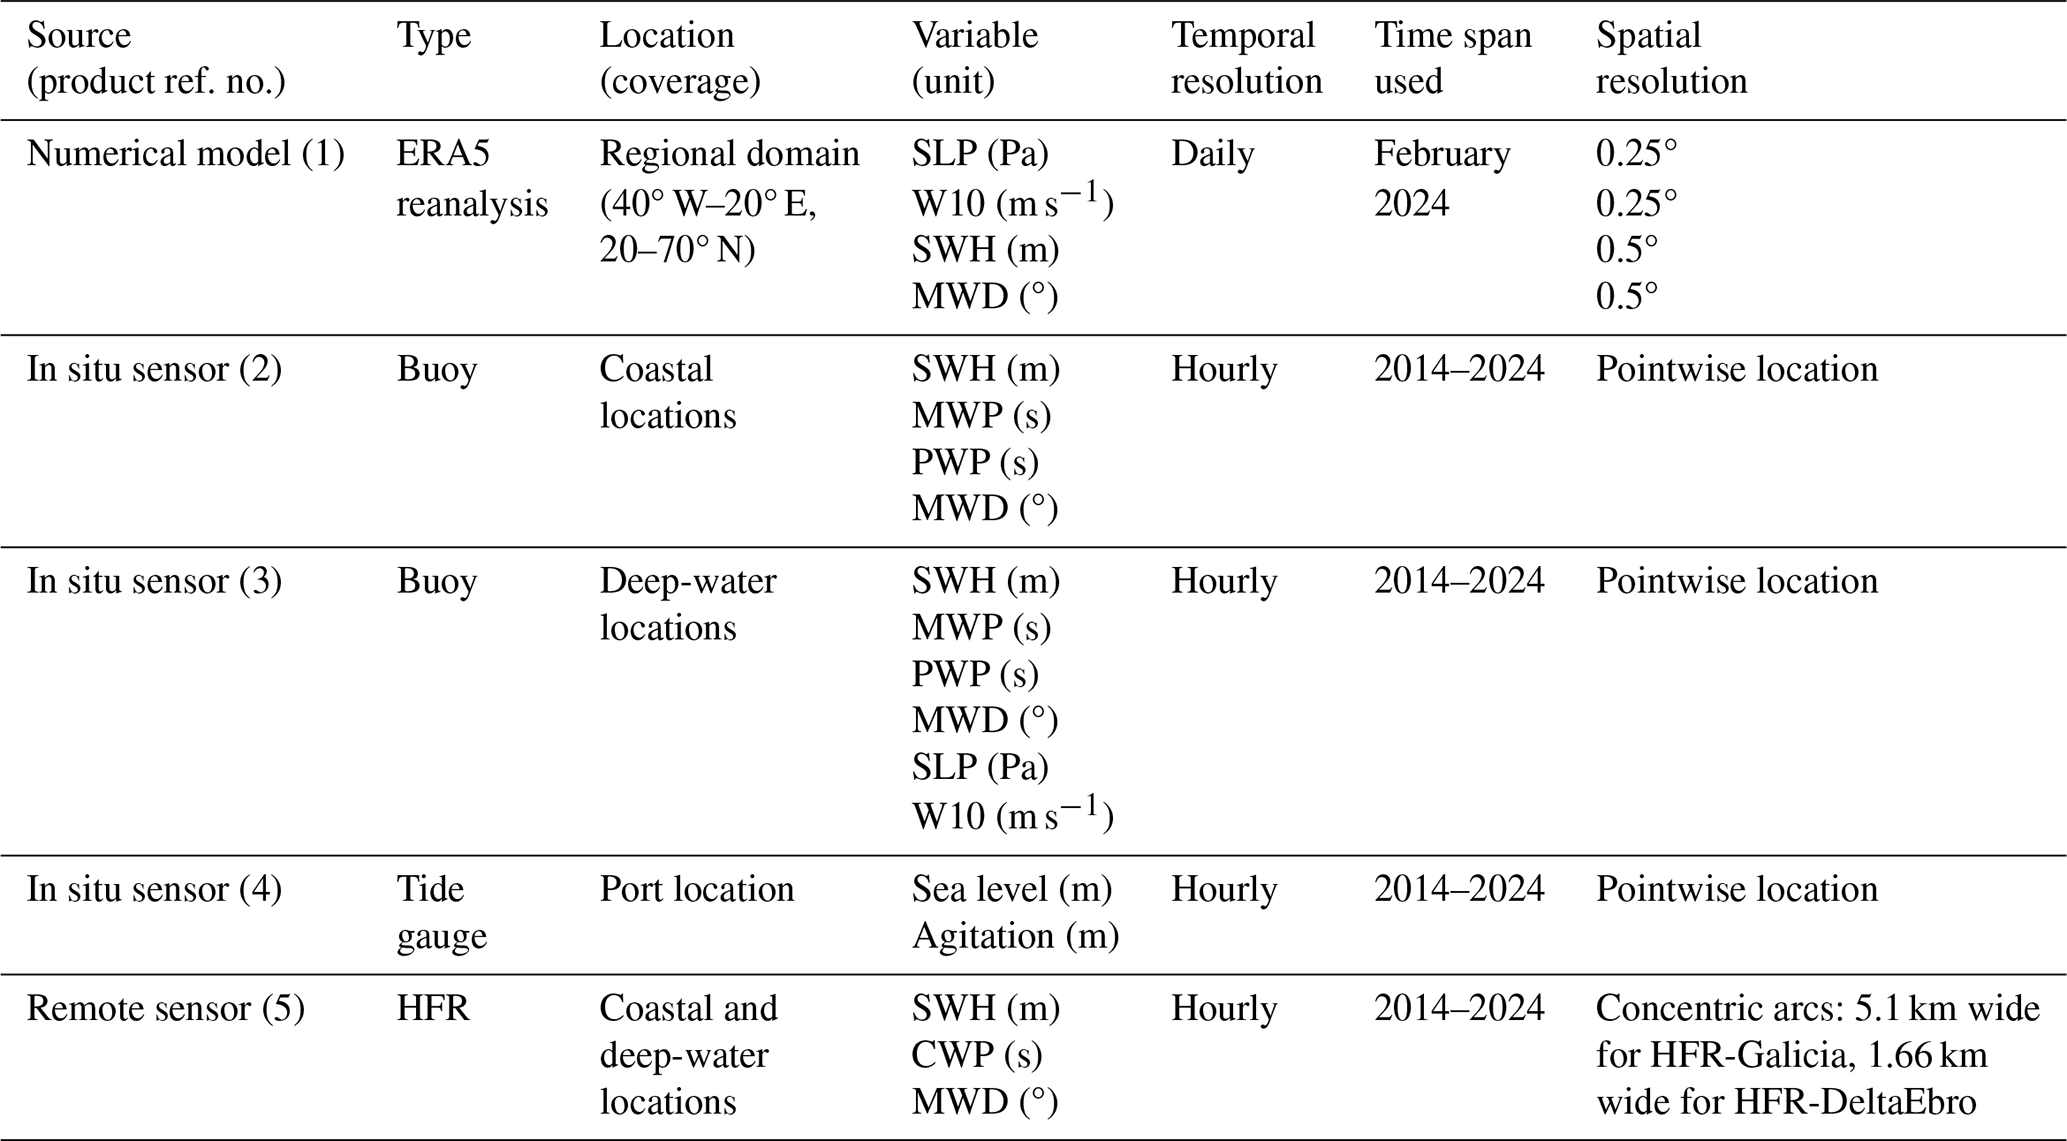
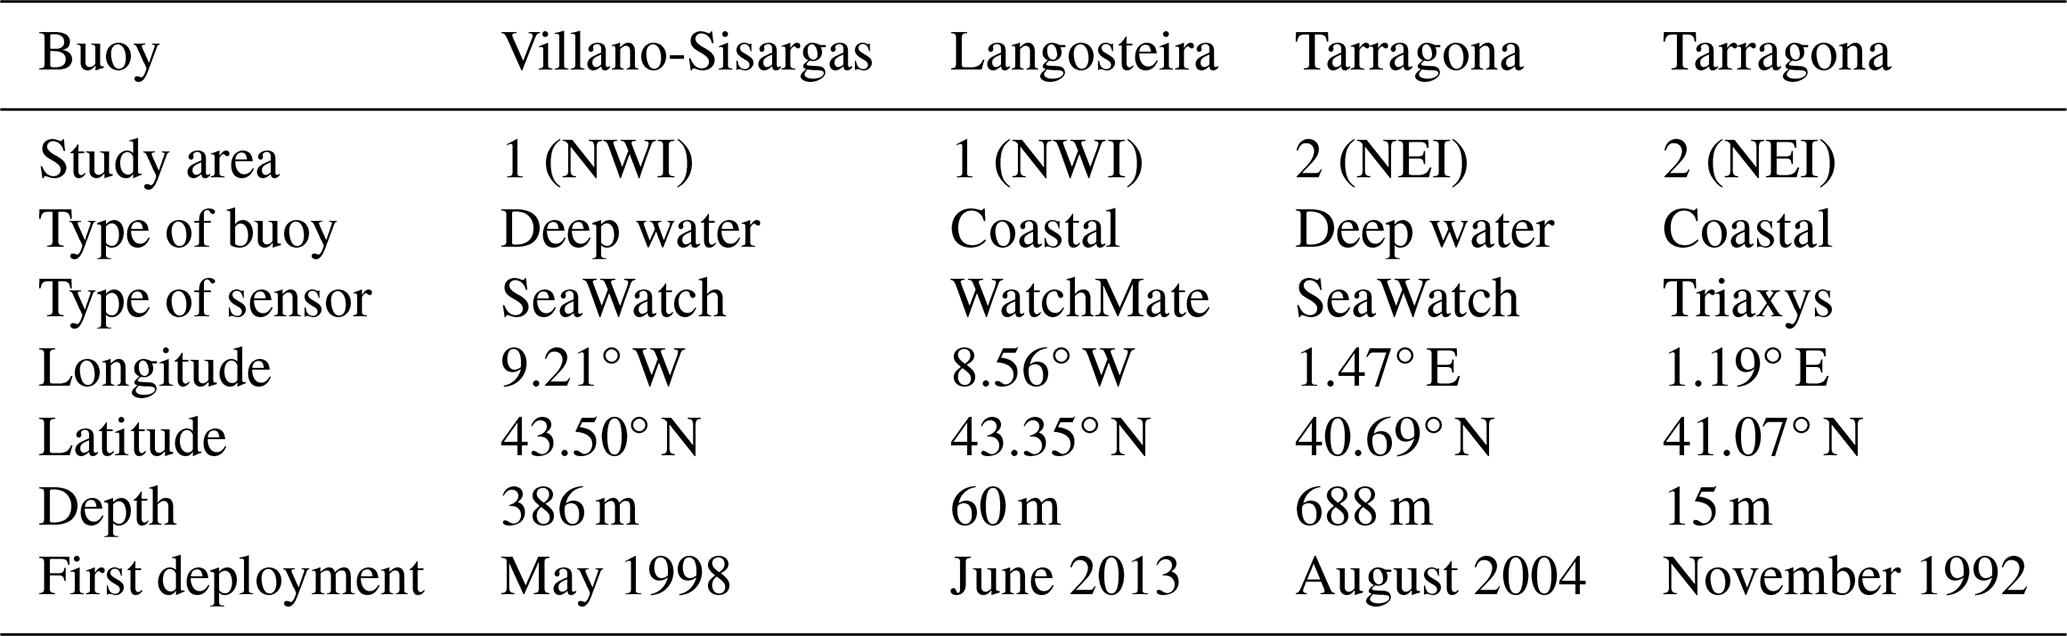
Table 3Technical description of the four in situ moored buoys used in the present study.
2.1 ERA5 reanalysis
ERA5, the fifth-generation reanalysis for the global climate and weather produced by the European Centre for Medium-Range Weather Forecasts (ECMWF), provides high-resolution, consistent, and quality-controlled datasets extending back to 1940 (product ref. no. 1 in Table 1). ERA5 offers hourly estimates of a wide range of atmospheric and oceanic variables, which are regridded, respectively, to a regular 0.25° and 0.5° horizontal grid. Synoptic-scale analyses of daily-averaged fields of sea level pressure (SLP), 10 m wind speed (W10), significant wave height (SWH), and mean wave direction (MWD) were conducted over the North Atlantic domain (40° W–20° E, 20–70° N) to characterize the dominant metocean features during the peak phase of Storm Louis (Table 2, no. 1).
2.2 In situ moored buoys
Two deep-water and two coastal moored buoys, operated by Puertos del Estado, were utilized in this study (Figs. 1d–e and A1). These in situ observational platforms provide quality-controlled, hourly-averaged measurements of a range of oceanographic parameters (product ref. no. 2 in Table 1), including SWH, MWD, wave period at spectral peak (or peak wave period, PWP), and mean wave period (MWP) (Table 2, no. 2 and no. 3). Additionally, deep-water moored buoys also provide hourly-averaged estimations of atmospheric parameters (SLP and wind). Comprehensive technical specifications for each buoy are detailed in Table 3.
The quality control, defined by the Copernicus Marine Service in situ team (Copernicus Marine In situ Team, 2020), was based on a battery of automatic checks performed in real time to flag and subsequently filter inconsistent values: the spike test, stuck value check, and rate of change over time, among others.
2.3 Tide gauges
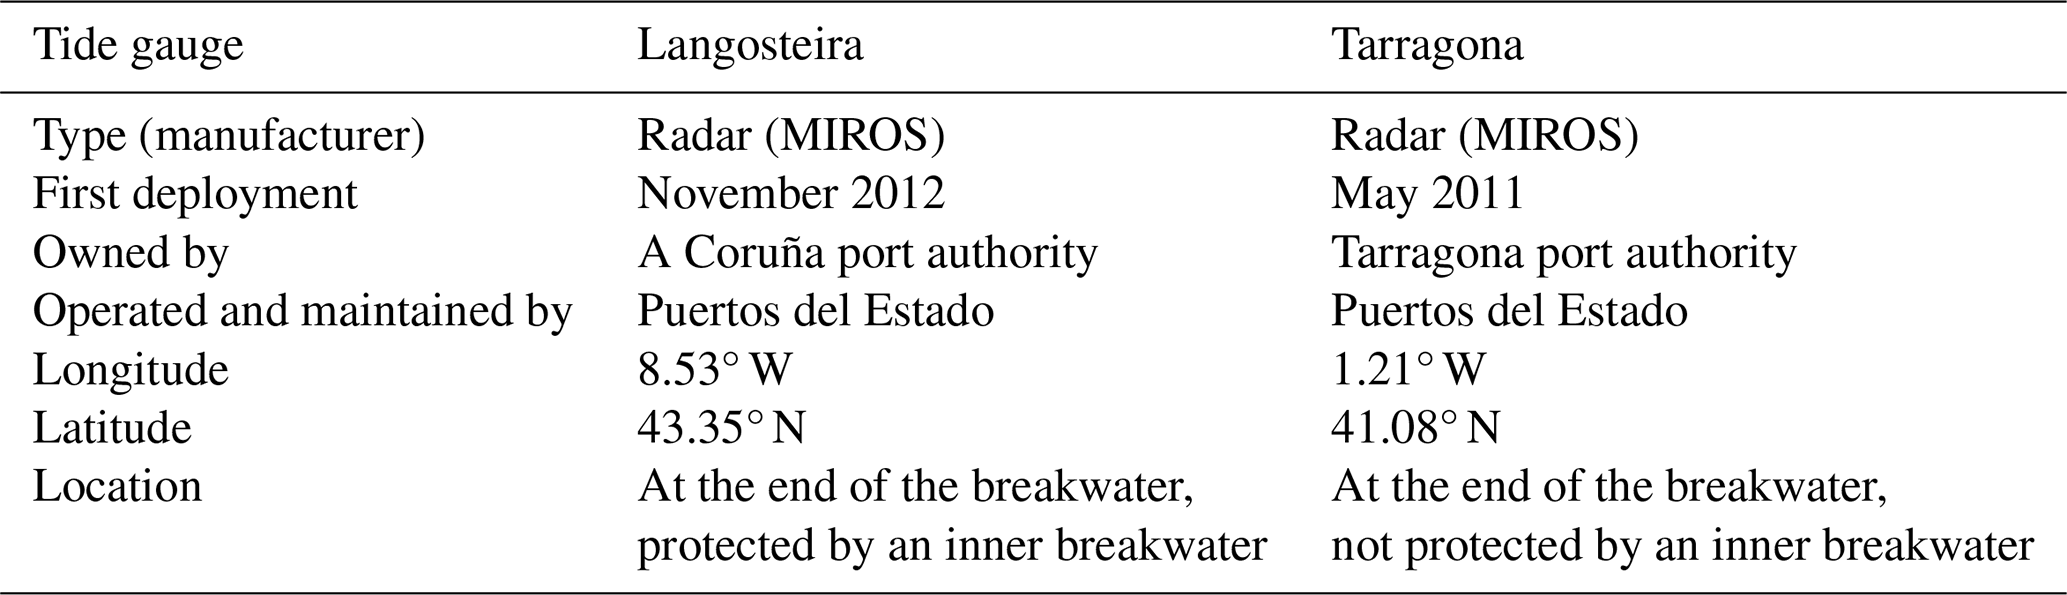
Two radar tide gauges, manufactured by Miros and operated by Puertos del Estado as part of the REDMAR network (Pérez et al., 2014), have been deployed at the mouth of Langosteira (Figs. 1d and A1a) and Tarragona (Figs. 1e and A1b) harbours since November 2012 and May 2011, respectively (Table 4). These sensors deliver quality-controlled sea level measurements at a sampling rate of 2 Hz (product ref. no. 3, Table 1), facilitating the analysis of high-frequency oscillations such as meteotsunamis and infragravity waves (García-Valdecasas et al., 2021). Complementarily, 20 min averaged estimates of port agitation – defined as port-scale oscillations induced by incoming wind waves with periods shorter than 30 s – were derived using an eighth-order Butterworth high-pass digital filter with a cut-off frequency of 1/30 Hz. The resulting agitation time series were subsampled to hourly intervals (Table 2, no. 3) for subsequent analysis:
- i.
The agitation time series were analysed over the period of 20–29 February 2024 to evaluate harbour response under extreme weather conditions. Complementarily, hourly storm surge estimates (i.e. meteorological residuals) were examined to assess their potential contribution to wave-induced agitation during Storm Louis.
- ii.
The agitation time series were analysed over the 11-year observational record period spanning 2014–2024 to investigate the relationship between offshore energetic wave conditions and the sea state within both harbours, with a focus on the directional dependencies influencing wave penetration and the resulting agitation response.
Table 4Technical description of the two tide gauges used in the present study.
2.4 High-frequency radars (HFRs)
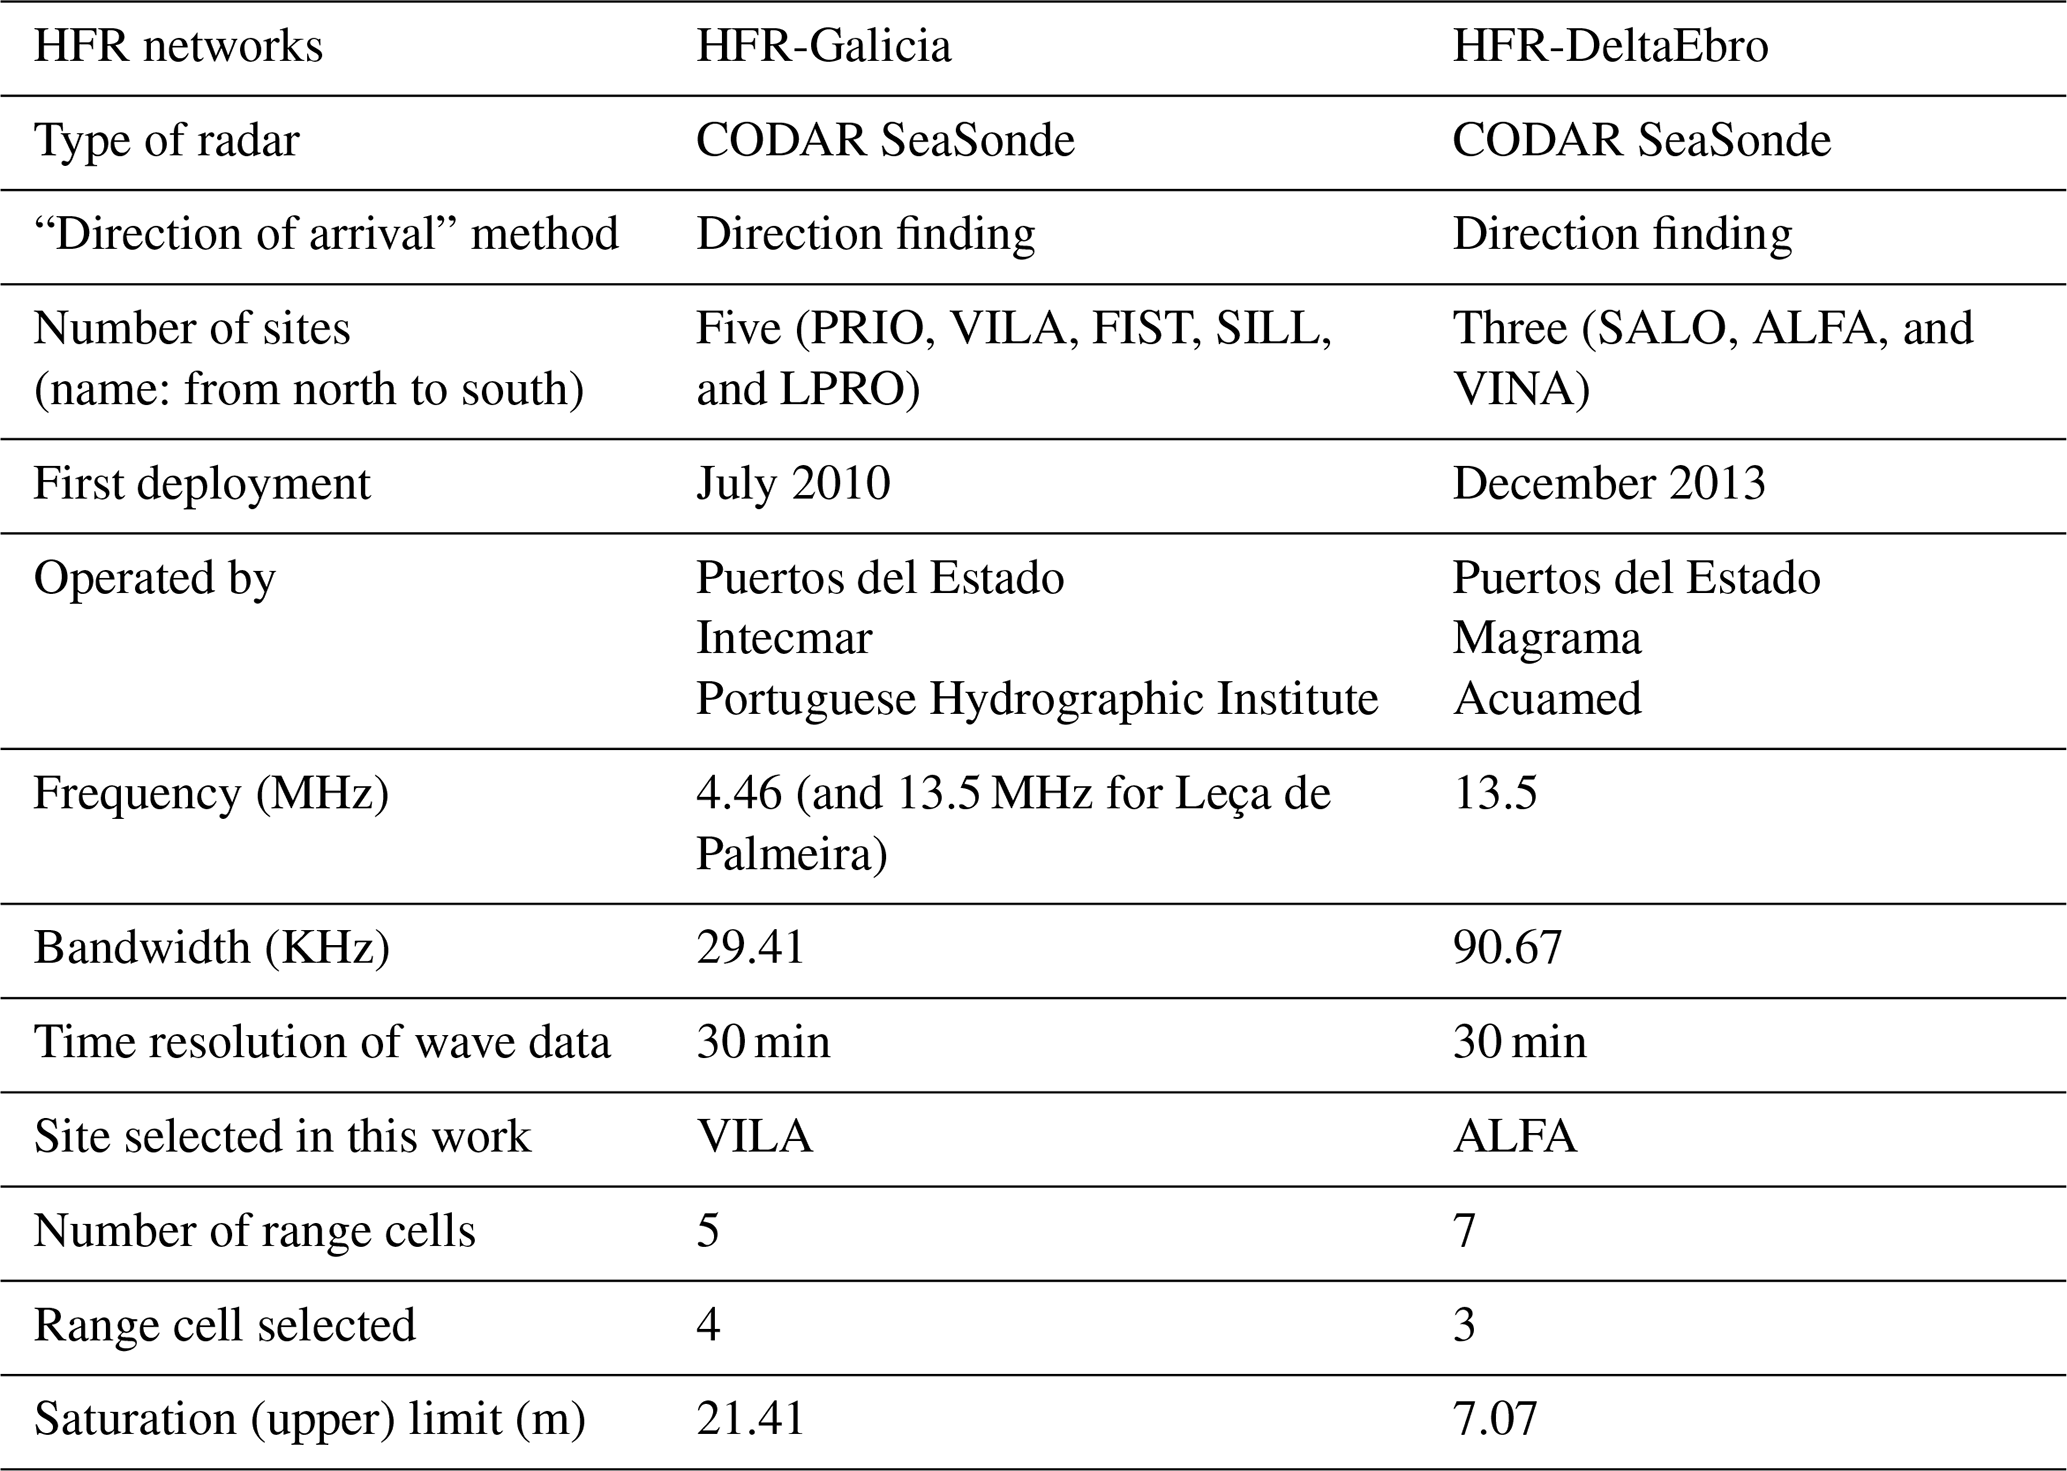
Two “direction-finding” SeaSonde HFR networks (Barrick et al., 1977), manufactured by CODAR Ocean Sensors, were employed in this study (Table 5). While the first one (composed of five sites) was deployed along the northwestern Iberian Peninsula (HFR-Galicia) in July 2010, the second one (formed by three sites) was installed in the northeastern Iberian Peninsula (HFR-DeltaEbro) in December 2013. The geographical distribution of the radar stations is shown in Fig. 1d and e, respectively.
Table 5Technical description of the two high-frequency radar (HFR) systems used in the present study. Official names registered in the European HFR Node are shown.
In both study regions, the HFR installations provide wide and unobstructed coverage, ensuring stable and reliable directional solutions. In the case of the HFR-Galicia network, all HFR sites are installed at lighthouse locations, which offer elevated, exposed positions with a clear line of sight over the ocean and minimal physical obstructions. In the HFR-DeltaEbro network, the HFR sites are deployed within a protected natural area, where infrastructure is limited and the surrounding environment is well preserved, resulting in minimal electromagnetic or physical interference. These site characteristics ensure favourable geometric configurations and stable directional performance for wave retrieval in both regions.
Each network provides half-hourly wave observations (product ref. no. 4, Table 1) – including SWH, centroid wave period (CWP), and MWD – retrieved in near real time across multiple annular rings (circular concentric range arcs) extending radially from each onshore radar site (Fig. A2). For this study, HFR-derived wave measurements were subsampled to 60 min intervals (Table 2, no. 4) to ensure temporal consistency across datasets, enabling not only the investigation of wave conditions during Storm Louis but also a robust long-term skill assessment over the 2014–2024 period.
3.1 Characterization of Storm Louis
To elucidate the driving mechanisms underlying the development of Storm Louis, the prevailing atmospheric conditions were briefly examined at the synoptic scale, with particular emphasis on daily mean fields of SLP and W10. This analysis aimed to identify the large-scale barometric patterns, pressure gradients, and wind structures that contributed to the storm's intensification, thereby enabling a better understanding of the meteorological forcing responsible for the observed oceanographic impacts, especially within the affected harbour environments.
Recognizing the interconnected nature of hydrodynamic variables, an isolated analysis of individual extremes was deemed inadequate to capture the full spatial and temporal footprint of Storm Louis. Instead, a percentile-based statistical framework was employed to characterize the tail behaviour of key environmental variables, including W10, SWH, and MWP, among others. The 1st, 5th, 25th, 50th, 75th, 90th, 95th, 99th, and P99.9th historical percentiles (P1, P5, P25, P50, P75, P90, P95, P99, and P99.9, hereinafter) were derived from an 11-year (2014–2024) observational dataset to contextualize storm Louis within its broader climatological distribution (Coles, 2001). These high-impact thresholds may serve as operational benchmarks for impact-based analysis, facilitating the identification of critical exceedance frequencies relevant to risk assessment and port operational management. Notably, similar percentile-based thresholds have previously been proposed in the context of coastal storm characterization by Harley (2017), Morales-Márquez et al. (2020), and Fanti et al. (2023). In the specific case of port agitation, historical percentiles were intended as purely statistical indicators of anomalous harbour response rather than direct representations of formal operational limits applied by port authorities. Hourly estimations of storm surge components (meteorological residuals) were analysed to assess their potential contribution to the pronounced increase in harbour agitation observed during Storm Louis. This evaluation aimed to determine whether elevated water levels played a significant role in amplifying the port response under storm conditions. In this context, connected extremes are of particular concern for harbour operability. Their combined impacts can interact nonlinearly, resulting in synergistic effects that pose a greater threat to port infrastructure than isolated extreme events (Velpuri et al., 2023).
The long-term relationship between energetic offshore wave conditions (SWH, MWP, and MWD) and port agitation was analysed to assess directional dependencies and harbour response under extreme-forcing scenarios, as the direction of the most energetic incoming waves may be critical to harbour impacts. Scatter plots were thereby computed to infer the dependence between port agitation and offshore SWH data.
In addition, the monthly distribution of extreme hourly agitation events – defined as values exceeding the P90, P95, and P99 thresholds – was derived from the 11-year observational time series provided by the Langosteira (NWI) and Tarragona (NEI) tide gauges. This analysis aimed to identify potential seasonal patterns or preferential timing in the occurrence of high-agitation conditions, thereby providing insight into whether certain phases of the annual cycle are more prone to operational disruptions due to extreme metocean forcing.
3.2 HFR: fundamentals and data treatment
The HFR land-based remote sensing technology is based on measurements of the radio-wave-backscattered signal from ocean surface gravity waves in the 3–30 MHz range of the electromagnetic spectrum (Crombie, 1955). CODAR SeaSonde “direction-finding” HFR networks measure the return signal continuously over all angles, exploiting the directional properties of a collocated three-element receive antenna system to infer the direction of the incoming signals (Barrick et al., 1977).
While fine-resolution maps of the surface circulation are obtained from the Doppler shift of the predominant first-order peaks in the sea-echo Doppler spectrum, wave parameters are deduced from the weaker and noisier second-order peaks. The second-order scattering-based methods rely significantly on echo quality, which varies with sea state and radar frequency (Wyatt et al., 2005). The relative contribution of the second-order spectrum increases with both the radar frequency and the wave height since wave data are dependent upon the occurrence of both Bragg and larger surface gravity waves. There is a minimum threshold for sea states at a given radar frequency in which reliable wave parameters can be determined. Below such a sensitivity threshold, the lower-energy second-order spectrum is closer to the noise floor and more likely to be contaminated with spurious contributions that might result in wave height overestimation or limited temporal continuity in wave measurements (Tian et al., 2017; Lipa et al., 2022; Lipa and Nyden, 2005). During extreme weather events, there is also a limiting factor for HFR accuracy as the wave height increases and exceeds the saturation limit defined (on an inverse proportion) by the radar transmit frequency. If the radar spectrum saturates, the first- and second-order peaks merge, and interpretation of the spectra becomes impossible with existing methods (Forney et al., 2015). It is worth mentioning that theoretical upper performance thresholds for each HFR system (Table 5) were not exceeded during Storm Louis.
The HFR directional wave spectrum and derived parameters (SWH, CWP, and MWD) can be determined from the weaker second-order sea-echo Doppler spectrum by adopting two main approaches: full integral inversion or fitting with a model of ocean wave spectrum (Lipa and Nyden, 2005). A variety of inverse techniques have been developed over the last few decades (Barrick et al., 1977; Wyatt, 1990; Hisaki, 1996). The wave parameters used in this study, based on 30 min averaged backscatter data, were obtained directly by CODAR radar proprietary software: SeaSonde Radial Suite Software Release 7 (R7). This wave-processing tool performs a least squares fitting technique between the second-order radar spectrum and a Pierson–Moskowitz with cardioid directional function model. Specifically, SeaSonde HFR networks measure a wave period that represents the centroid of the model being fitted to the second-order Doppler spectrum (Lipa and Nyden, 2005), hence hereafter referred to as the centroid wave period (CWP).
HFR wave data were collected in near real time, assuming homogeneity over the entirety of each range cell (RC). Specifically, each site including the HFR-Galicia system has five individual RCs (5.1 km wide), which extend radially from an origin at the onshore radar site to a distance 25.5 km offshore (Fig. A2a). Each site from HFR-DeltaEbro presents seven RCs (1.66 km wide), which extend radially from an origin at the onshore radar site to a distance 11.62 km offshore (Fig. A2b). While the returned signal might be too weak for the outermost RCs, shallow-water effects can become significant for innermost RCs, also impacting on radar sea echo (Lipa et al., 2008). Therefore, we selected the intermediate RC that recorded the highest percentage of valid data, based on the same quality control procedures previously applied to the in situ wave observations. Accordingly, RC3 from the VILA site (HFR-Galicia) and RC4 from the ALFA site (HFR-DeltaEbro) were selected for comparison with in situ wave observations from Villano-Sisargas and Tarragona moored buoys, respectively, in order to evaluate the HFRs' accuracy in capturing extreme offshore wave conditions (Fig. A2). The selected sites were those closest to their corresponding deep-water moored buoys and/or those that exhibited the highest wave data availability throughout the lifecycle of Storm Louis.
Finally, the statistical metrics used in the present study to compare two datasets included the mean, the standard deviation (σ), the root mean squared error (RMSE), and the Pearson correlation coefficient (R) (Emery and Thompson, 2001).
4.1 Analysis of Storm Louis
The large-scale synoptic conditions associated with Storm Louis were characterized using daily-averaged ERA5 reanalysis data for SLP, W10, and SWH (Fig. 1a–c). The prevailing SLP pattern featured a classic dipole structure, consisting of a persistent subtropical high (∼ 1035 hPa) over the southwestern North Atlantic and a deep low (∼ 968 hPa) centred over northeastern Europe (Fig. 1a). This configuration, commonly referred to as the Azores High–Icelandic Low dipole, is a key expression of the North Atlantic Oscillation, a dominant mode of atmospheric variability modulating storm tracks and weather extremes across the North Atlantic sector (Hurrell and Deser, 2009). During the peak phase of the storm (23 February 2024), the pressure gradient exceeded 1.7 Pa km−1 and was oriented along a southwest–northeast axis, promoting sustained northwesterly winds with velocities surpassing 18 m s−1 over the northeastern Atlantic (Fig. 1b). These intense winds generated high-energy swell systems with SWH exceeding 8 m (Fig. 1c).
To place the magnitude of Storm Louis in context, these values can be compared with those reported for the exceptional Storm Gloria in January 2020 (Álvarez-Fanjul et al., 2022). During Gloria, wind speeds also exceeded 18 m s−1, while SWH and MWP ranged between 4.5–7.6 m and 7–9 s, respectively (Lorente et al., 2021). The similarity in wind forcing and SWH values suggests that Storm Louis may be considered an event of comparable meteo-oceanic impact.
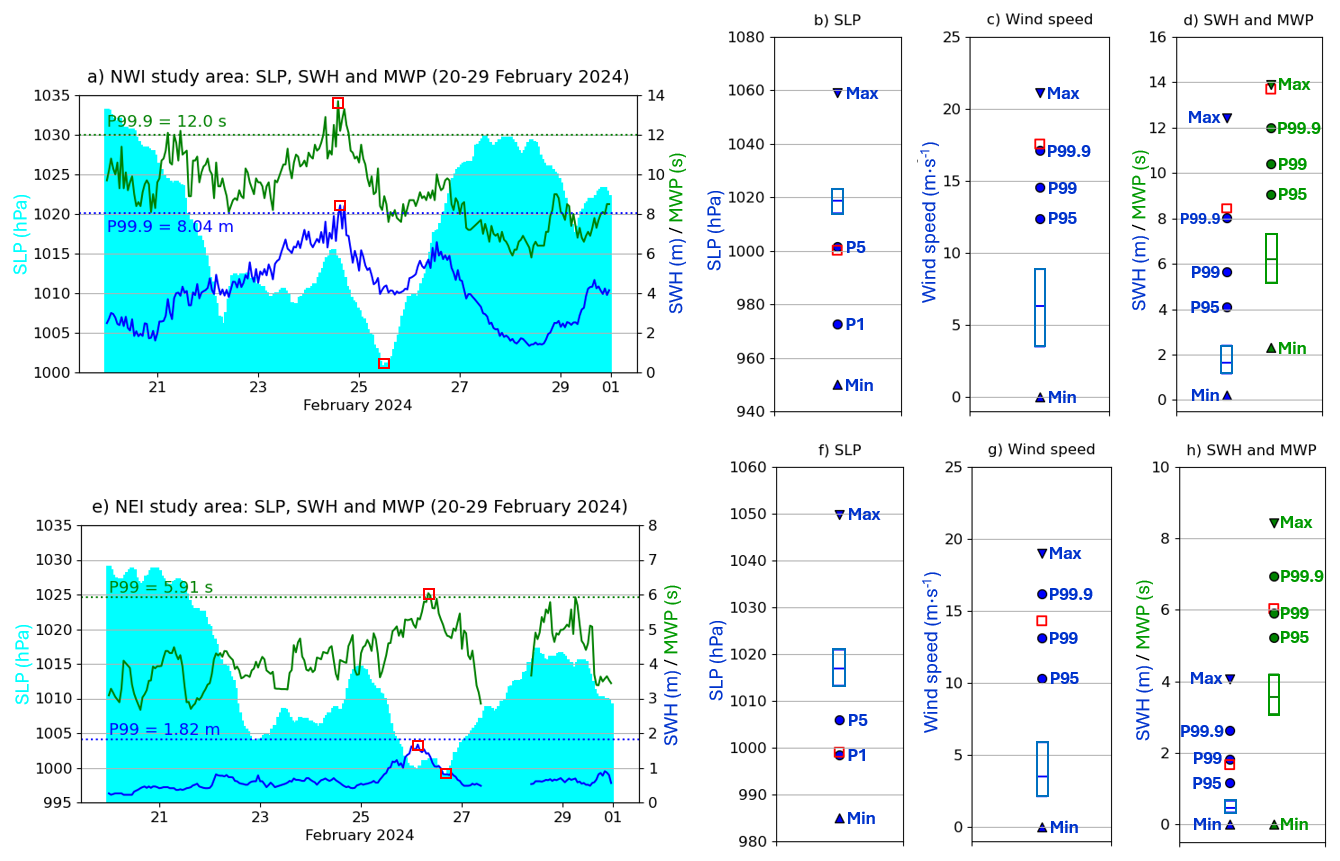
Figure 2(a) Hourly time series of SLP (from Villano-Sisargas buoy: cyan bars), SWH (from Langosteira buoy: blue line), and MWP (from Langosteira buoy: green line) – product ref. no. 2 in Table 1 – during Storm Louis in the NWI area. The P99.9 thresholds are indicated by the dotted blue and green lines, respectively. The red squares represent peaks of SWH and MWP and the minimum value of SLP. (b–d) Retrospective analysis for the 2014–2024 period: the minimum value of SLP and peaks of wind speed (from Villano-Sisargas buoy) during Storm Louis, along with peaks of SWH and MWP (from Langosteira buoy), are indicated with the red squares. In each box, the central mark is P50, and the edges of the box are the P25 and P75 thresholds. (e) Hourly time series of SLP (from Tarragona deep-water buoy), SWH (from Tarragona coastal buoy), and MWP (from Tarragona coastal buoy) – product ref. no. 2 in Table 1 – during Storm Louis in the NEI area. (f–h) Retrospective analysis for the 2014–2024 period: the minimum value of SLP and peaks of wind speed (from Tarragona deep-water buoy) during Storm Louis, along with peaks of SWH and MWP (from Tarragona coastal buoy), are indicated with the red squares.
In particular, the NWI study area (Fig. 1d) and Langosteira harbour (Fig. A1a) experienced substantial wave impact and atmospheric pressure anomalies. The Villano-Sisargas deep-water buoy recorded a cumulative SLP drop of 33 hPa between 20–25 February, reaching a minimum of 1000 hPa (Fig. 2a), a value slightly below the P5 threshold derived from the 2014–2024 reference period (Fig. 2b). Concurrently, peak offshore wind speeds reached 17.57 m s−1, exceeding the local P99.9 percentile (Fig. 2c). The Langosteira coastal buoy detected extremely energetic sea states from the northwest (Fig. 1d), with a peak SWH of 8.44 m and a peak MWP of 13.7 s recorded on 24 February (Fig. 2a). Notably, the P99.9 threshold of SWH (8.04 m) was occasionally exceeded during 2 non-consecutive hours, while the observed MWP moderately surpassed the P99.9 level (12.0 s), nearly matching the all-time maximum value of 13.9 s recorded during the 2014–2024 reference period (Fig. 2d).
Severe oceanographic conditions were also observed in the NEI study area (Fig. 1e). Near Tarragona harbour (Fig. A1b), the deep-water buoy recorded an SLP minimum of 999 hPa (Fig. 2e), approaching the P1 threshold for the region (Fig. 2f). Offshore wind speeds peaked at 14.29 m s−1, exceeding the local P99 (Fig. 2g). The Tarragona coastal buoy recorded high waves coming from the southernmost sector (Fig. 1e), with SWH and MWP peaking at 1.67 m and 6.04 s, respectively, during the early hours of 26 February (Fig. 2e). These values were close to or marginally above the P99 thresholds for the corresponding wave parameters (Fig. 2h).
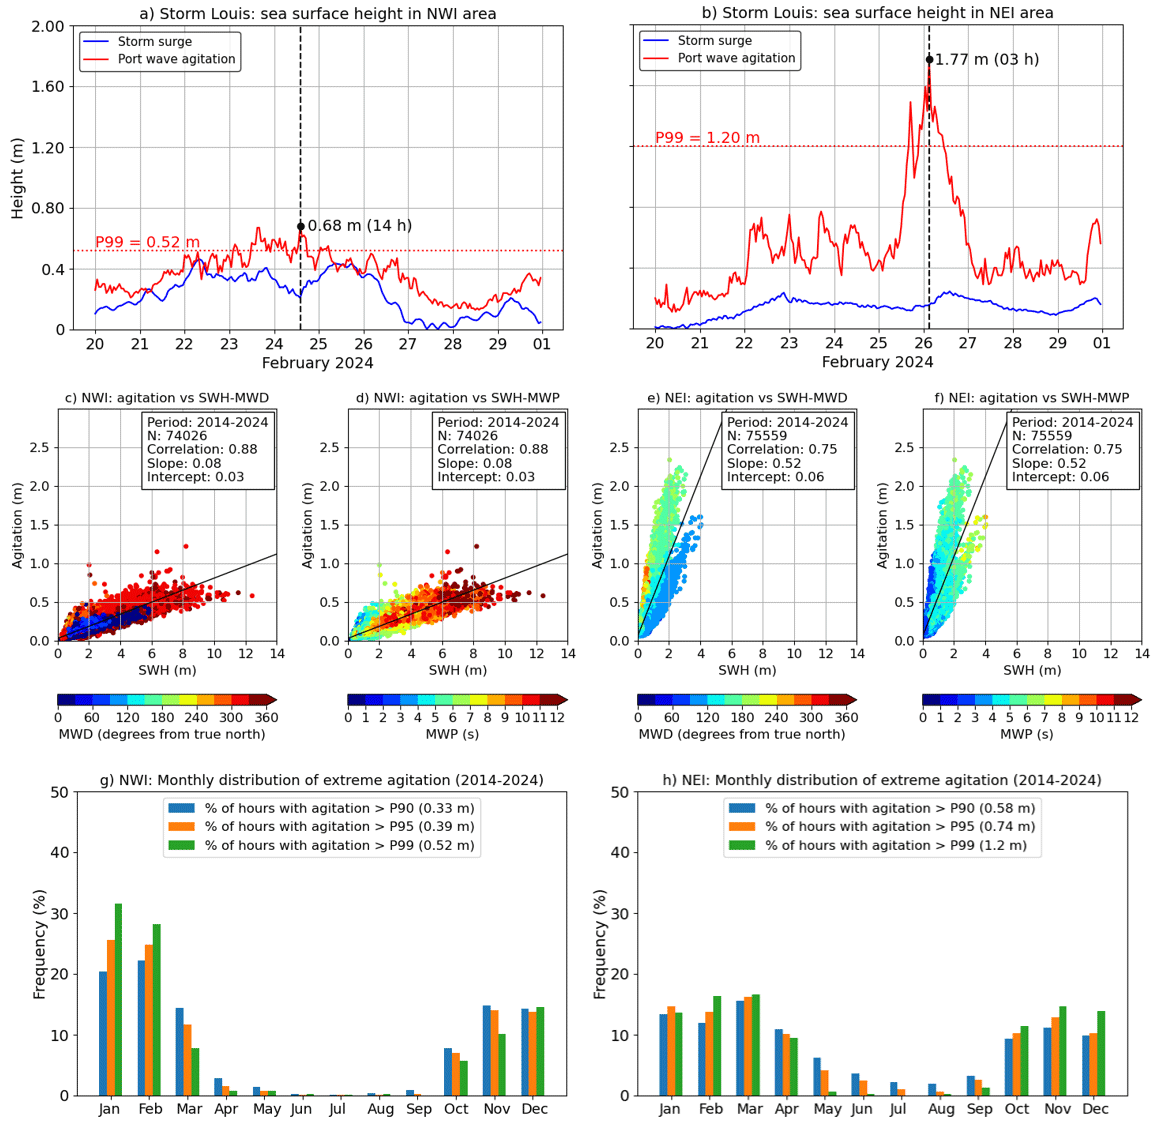
Figure 3Hourly time series of storm surge (meteorological residual) and port wave agitation (product ref. no. 3 in Table 1) recorded during Storm Louis (20–29 February 2024) by the (a) Langosteira and (b) Tarragona tide gauges (Fig. 1a). The 99th percentile (P99) thresholds for agitation are indicated by the dashed red lines. Scatter plots relating port agitation (product ref. no. 3 in Table 1) to coastal wave conditions (product ref. no. 2 in Table 1) during the 2014–2024 period for Langosteira (c–d) and (b) Tarragona harbours (e–f). Hourly data from the Langosteira coastal buoy and Langosteira tide gauge were used for Langosteira harbour (NWI area), while hourly observations from the Tarragona coastal buoy and Tarragona tide gauge were employed for Tarragona harbour (NEI area). Statistical metrics are marked in the white boxes. Monthly distribution of extreme port agitation (product ref. no. 3 in Table 1) events from 2014 to 2024, expressed as the percentage of hours exceeding the 90th (P90), 95th (P95), and 99th (P99) percentiles at (g) Langosteira and (h) Tarragona harbours.
4.2 Sea state within two harbours
Hourly time series of the storm surge component (meteorological residuals) and port wave agitation, measured during the full lifecycle of Storm Louis at the Langosteira (NWI area) and Tarragona (NEI area) tide gauges, are presented in Fig. 3a and b, respectively. While both sites experienced high wave agitation above historical P99 thresholds, the intensity and temporal structure of these events differed substantially. The Langosteira tide gauge displayed a moderate but prolonged agitation episode, reaching a peak of 0.68 m on the afternoon of 24 February (Fig. 3a). The P99 threshold for the 2014–2024 period (set to 0.52 m) was surpassed slightly for 33 non-consecutive hours. The storm surge component remained relatively subdued throughout the event, with fluctuations mostly below 0.50 m and no clear peak coinciding with the maximum agitation. By contrast, the Tarragona tide gauge captured an intense and short-lived event, peaking at 1.77 m early on 26 February 2024 (Fig. 3b). The local P99 threshold for the 2014–2024 period (set to 1.20 m) was far exceeded for 16 consecutive hours. The storm surge signal at the Tarragona tide gauge remained modest, with magnitudes generally under 0.3 m, exhibiting minimal correlation with the agitation peak, consistent with a wave-driven dynamic.
These contrasting behaviours can be interpreted within a multi-scale framework linking large-scale wave generation to local harbour response. Wave energy generated in the North Atlantic required a finite amount of time to propagate toward the regional offshore domains and underwent directional evolution before interacting with each harbour. At the local scale, harbour agitation did not respond instantaneously to offshore wave forcing; rather, it was strongly modulated by site-specific factors, including directional sensitivity, wave transformation processes at the harbour entrance, and intrinsic response times associated with wave–structure interactions. Processes such as diffraction and reflection within the harbour basins played a key role in shaping both the magnitude and the temporal persistence of the observed agitation, thereby explaining the pronounced differences between the two sites despite their exposure to the same synoptic-scale storm event.
Hourly scatter plot analyses conducted over the 11-year study period (2014–2024) revealed a strong statistical correlation between offshore wave conditions and internal harbour agitation across both study sites (Fig. 3c–f). Linear regression analysis of the SWH against harbour agitation yielded significantly high correlation coefficients, specifically R = 0.88 for Langosteira harbour and R = 0.75 for Tarragona harbour. In the case of Langosteira harbour (Fig. 3c–d), a total of 743 hourly records exceeded the P99 agitation threshold (0.52 m). Of these, 100 % were associated with MWP above 6 s and incident wave directions within the prevailing sector of 295–360° (clockwise from true north). By contrast, the scatter plot for Tarragona harbour exhibited a more complex, bimodal directional response (Fig. 3e–f). Despite the highest offshore SWH (> 3 m) and MWP (> 7 s) values being observed from wave directions between 90 and 120°, these did not correspond to peak agitation events within the port basin. Instead, agitation events exceeding 2 m were predominantly driven by moderate offshore wave heights (∼ 2–3 m), associated with MWP values in the range 5–7 s, penetrating from the southernmost sector (150–210°). This indicates a pronounced sensitivity of the harbour's internal hydrodynamics to wave approach angles, likely modulated by local bathymetric features and structural configurations at the port entrance (Fig. 3c and e, respectively).
In addition, the monthly distribution of extreme-wave-induced agitation was assessed over an 11-year period (2014–2024), as shown in Fig. 3g–h. A pronounced seasonal signal was evident in Langosteira harbour, with peak exceedance frequencies occurring during the boreal winter months (Fig. 3g). Specifically, January through March exhibit the most severe agitation conditions: cumulative exceedance percentages over the 3-month period reached approximately 57 %, 61 %, and 68 % of total hours above the P90, P95, and P99 thresholds, respectively. As the annual cycle advances, a marked decline in exceedance frequency is observed, reaching near-negligible levels between June and August. This attenuation coincides with the seasonal minimum in offshore wave energy flux. From September onwards, there is a gradual resurgence in the frequency of agitation exceedance, with a secondary peak observed in October through December. This bimodal distribution suggests that, in addition to the primary forcing by winter storm activity, transitional swell events and associated synoptic-scale disturbances during the late autumn months contribute substantially to Langosteira harbour agitation.
By contrast, the monthly distribution at Tarragona harbour revealed a more evenly spread regime for extreme agitation (Fig. 3h). High exceedance percentages were evident during the first 4 months of the year, particularly in March, where the percentages across all thresholds approached 16 %–17 %. Unlike Langosteira harbour, where agitation was heavily concentrated in January and February, Tarragona harbour exhibited a more gradual onset and decay of agitation activity during the winter-to-spring transition. From June to September, the proportion of hourly agitation exceeding any threshold fell below 5 %, marking a seasonal minimum consistent with the calm summer wave climate typical of the western Mediterranean Sea. A second rise in extreme agitation was observed in the final quarter of the year. November and December, in particular, exhibited a high proportion of hours exceeding the P99 threshold, reaching nearly 15 %. These outcomes underscore Tarragona harbour's sensitivity to storm events, particularly those originating from southern or southeastern sectors, which are known to be energetically effective in exciting agitation in this specific port geometry.
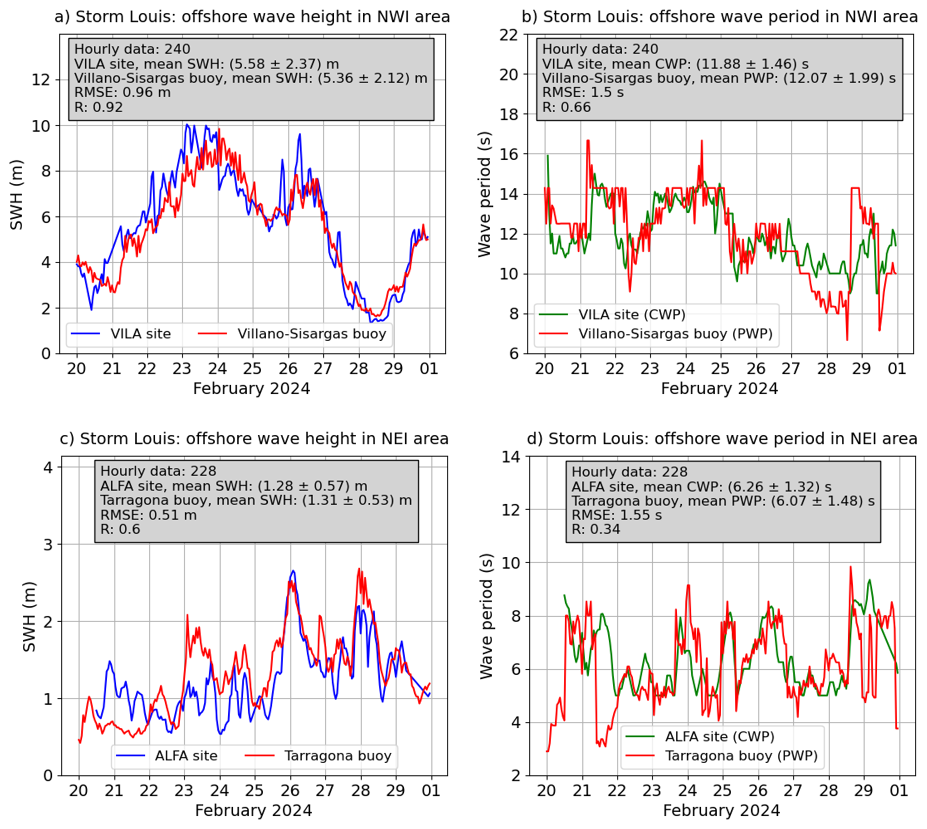
Figure 4Comparison of hourly estimations of offshore significant wave height (SWH; a, c) and centroid/peak wave period (CWP/PWP; b, d) provided by high-frequency radar (HFR) sites (product ref. no. 4 in Table 1) against in situ buoy observations (product ref. no. 2 in Table 1) during Storm Louis in the northwestern Iberia (NWI; a, b) and northeastern Iberia (NEI; c, d) areas. Hourly data from the Villano-Sisargas deep-water buoy and VILA site were used for the NWI area, while hourly observations from the Tarragona deep-water buoy and ALFA site were employed for the NEI area. Statistical metrics are indicated in the grey boxes. For the sake of proper interpretation and comparison, the reader should note that the y-axis scales differ between the NWI area and NEI area.
4.3 Remote wave monitoring with two HFR networks
A quantitative skill assessment of HFR-derived wave estimates during Storm Louis was performed. In the NWI region, time series from the VILA site and the Villano-Sisargas deep-water buoy exhibited strong visual agreement throughout the extreme event (Fig. 4a). The correlation coefficient for SWH is high (R = 0.92), with an RMSE of 0.96 m, indicating a high degree of coherence. Both sensors captured the initial wave growth from 21 February, the primary energy peak between 24–25 February, and a secondary crest around 26–27 February. The VILA site slightly overestimated SWH maxima relative to the buoy, particularly during the storm's mature phase, although both records converge during the storm's decay stage. The concurrent wave period time series in the NWI area showed moderate agreement (R = 0.66, Fig. 4b), with the HFR-derived CWP and buoy PWP estimates both resolving the rise to values above 14 s during the 21–22 February surge, a brief drop around 23 February, and a sustained 13–15 s regime during the storm's main phase. The HFR data tend to smooth out high-frequency fluctuations, leading to an underestimation (∼ 1 s) of the maximum buoy-reported wave periods (16–17 s) and an overestimation during the waning stage of the storm. It is worth mentioning that SeaSonde HFR networks measure a wave period (CWP) that represents the centroid of the model being fitted to the second-order Doppler spectrum (Lipa and Nyden, 2005). Thus, HFR centroid periods always dropped between PWP and MWP collected at the Villano-Sisargas buoy. This fact is relevant to properly interpret the skill metrics obtained from comparison, which was conducted against PWP.
By contrast, wave field dynamics in the NEI sector exhibited lower overall energy levels. Both the ALFA site and the Tarragona deep-water buoy recorded relatively calm conditions until 23 February, followed by a marked intensification and a first peak on 26 February. After a rapid decline, a new peak reaching 2.6 m was observed on 28 February (Fig. 4c). Agreement is weaker in this region, with a correlation coefficient of 0.60 and an RMSE of 0.51 m. Wave period estimates in the NEI region (Fig. 4d) demonstrated poorer agreement (R = 0.34 and RMSE = 1.55 s). The buoy data exhibited pronounced high-frequency variability, with wave periods ranging from 3 to 10 s. However, the HFR-derived CWP was smoother, capturing the dominant 5–8 s wave band during 24–26 February but underrepresenting both short-period (< 4 s) and long-period (> 9 s) oscillations by up to 2 s.
Overall, the results confirm that HFR networks effectively captured the general evolution and magnitude of extreme-storm-induced wave fields, exhibiting consistently higher skill in the estimation of SWH compared to wave period. Performance was notably better in the NWI region, likely reflecting the combination of higher incident wave energy and more comprehensive radar coverage. This spatially dependent variability in performance is consistent with the results reported by Saviano et al. (2022), who documented similar HFR–buoy skill contrasts under differing wave energy regimes and bathymetric conditions. These findings underscore both the potential and the limitations of HFR technology for real-time wave monitoring under severe weather conditions, particularly in high-energy offshore environments.
Additionally, a comprehensive long-term validation of HFR-derived wave parameters provided by the VILA site was conducted using in situ measurements from the Villano-Sisargas deep-water buoy over an 11-year concurrent period (2014–2024). The scatter analysis of SWH (Fig. A3a) demonstrated strong agreement between the two sensors, with a significantly high correlation coefficient (R = 0.87), a moderately low RMSE of 0.82 m, and a best-fit regression slope near unity (1.02). The negligible intercept (−0.01 m) and close clustering along the 1 : 1 reference line further confirm the HFR system's ability to capture both the magnitude and the variability of SWH over extended timescales. By contrast, the comparison of wave periods (Fig. A3b) yielded a moderate yet statistically significant correlation coefficient (R = 0.71) accompanied by a higher RMSE of 1.61 s. The best-fit slope of 0.61 and intercept of 4.25 s indicate a systematic divergence between the HFR-derived CWP and the buoy-derived PWP. Specifically, the HFR tends to underestimate high-period events, while overestimating lower-period regimes, reflecting inherent methodological differences in how each system resolves wave spectral characteristics. For MWD (Fig. A3c), the scatter distribution is more dispersed, with a reduced slope (0.52), an intercept of 135.28°, and an RMSE of 33.97°. Despite a moderate correlation (R = 0.66), the observed bias and compression of the directional range suggest limitations in the angular resolution of the HFR system, particularly at longer ranges where reduced Bragg scattering coherence may degrade directional accuracy.
These outcomes, which are in accordance with previous statistical results reported in the literature (Atan et al., 2015; Long et al., 2011), collectively demonstrate that the VILA site provided robust long-term estimates of SWH, moderately reliable wave period data, and qualitatively accurate but less precise wave direction estimates. The performance differences across parameters reflect known limitations of HFR networks in estimating wave direction and longer-period waves, especially under complex sea states or reduced HFR return conditions. Although the unimodal Pierson–Moskowitz spectral model has proven suitable for wind- and swell-dominated conditions, its applicability may be limited in complex metocean environments characterized by multimodal sea states (Lipa et al., 2022). It is also important to note that the substantial separation between the deep-water buoy locations and the selected RCs – 22.52 km for HFR-Galicia (Fig. A2a) and 47.39 km for HFR-DeltaEbro (Fig. A2b) – constitutes a potential source of discrepancy that may affect the derived skill metrics and partially accounts for the observed differences in performance between the two study areas. Moreover, the assumption of spatial homogeneity within each circular RC in CODAR SeaSonde HFR systems may further contribute to the observed discrepancies, particularly in intricate coastal environments where pronounced bathymetric variability and wave transformation processes – such as refraction, dissipation, and breaking – play a dominant role (Wyatt et al., 2005).
The projected rise in both the frequency and the intensity of extreme extratropical cyclones presents a growing threat to the resilience of European coastal infrastructure (Little et al., 2023). These powerful storm systems can generate severe metocean conditions, including high winds, heavy precipitation, and dynamic sea level fluctuations. Among the most vulnerable components of coastal infrastructure are ports, which serve as critical hubs in the global maritime transport network and are essential to international trade and economic stability (Verschuur et al., 2022). As mean sea levels continue to rise due to climate change, the impact of storm surges and extreme wave events is expected to intensify. In particular, wave-induced port agitation poses a significant operational hazard, as energetic wave conditions can severely disrupt internal basin dynamics, impair docking manoeuvers, and reduce overall port efficiency even in the absence of structural damage. Such phenomena can lead to both temporary and, in some cases, permanent inundation of port facilities, disrupting operations, damaging equipment and structures, and incurring significant economic costs (Verschuur et al., 2023). The combined effect of these hazards underscores the urgent need for adaptive measures and resilient design in coastal and port infrastructure planning.
This study investigates the meteorological and oceanographic features of Storm Louis, a high-impact deep low-pressure system that affected large areas of western Europe during 22–26 February 2024. This extreme metocean event was characterized by a pronounced Azores High–Icelandic Low dipole pattern, a canonical manifestation of the positive phase of the North Atlantic Oscillation, which imposed an intensified southwest–northeast pressure gradient exceeding 1.7 Pa km−1. This synoptic configuration facilitated persistent and anomalously strong northwesterly wind over the northeastern Atlantic Ocean (with peaks above 17.57 m s−1), generating high-energy wave systems (with SWH and MWP values exceeding 8 m and 13 s, respectively) that significantly impacted the western European coastline.
Two Spanish harbours – Langosteira in the NWI region and Tarragona in the NEI region – were used as case studies to examine the storm's impact. A multi-platform observational analysis, combining in situ observations from four moored buoys and two tide gauges with remotely sensed data from two HFR networks, was performed to evaluate the relationship between open-ocean wave parameters and the wave-induced agitation within the harbour domain. In the NWI (NEI) area, multiple observed wind and wave parameters associated with Storm Louis exceeded the 99.9th (99th) historical percentiles, based on the available 11-year observational record period spanning 2014–2024.
The analysis of high-frequency sea level oscillations during Storm Louis revealed differences in harbour agitation between the Langosteira and Tarragona tide gauges, despite both exceeding their respective historical P99 thresholds. Langosteira experienced a moderate but prolonged event peaking at 0.68 m, with minimal storm surge influence, while Tarragona underwent a shorter, more intense peak of 1.77 m, also decoupled from storm surge. This heterogeneity in storm response between both harbours may be attributable to (i) differences in mouth orientation relative to the predominant incident wave direction and (ii) the contrasting exposure levels of the tide gauge locations. Specifically, the Tarragona tide gauge is situated in an exposed position at the harbour entrance, at the seaward terminus of the main breakwater (Fig. A1b), which makes it more susceptible to incoming wave energy. By contrast, the Langosteira tide gauge is located in a more protected position, behind a secondary breakwater (Fig. A1a), resulting in significantly lower agitation levels during the same storm event. This outcome highlights the critical functional role of secondary defensive structures – such as inner or secondary breakwaters – in mitigating wave-induced agitation. Long-term data (2014–2024) showed strong correlations between offshore wave height conditions and harbour agitation (R = 0.88 for Langosteira, R = 0.75 for Tarragona), though Tarragona port exhibited a more complex, directionally sensitive response. Peak agitation events were predominantly associated with moderate offshore wave heights (below 3 m) propagating from the southernmost sector, underscoring the harbour's marked sensitivity to wave incidence angle and its role in amplifying internal hydrodynamic response. In addition to directional sensitivity – largely controlled by the configuration of the breakwaters and the harbour entrance – other structural features not analysed in this study, such as the basin layout (including basin shape, dimensions, and depth), have also been shown to influence how incoming waves from different directions are transmitted and amplified within a port (Casas-Prat and Sierra, 2012). Seasonally, agitation in Langosteira harbour was sharply concentrated in winter, especially January–March, with negligible summer activity, whereas Tarragona port displayed a more evenly distributed pattern with notable secondary peaks in late autumn, particularly December. Furthermore, the threshold values defining P90, P95, and especially P99 are significantly higher in Tarragona, indicating that Tarragona port experiences generally higher agitation magnitudes than Langosteira port. This analysis of agitation exceedance over time emphasizes the importance of integrating seasonal variability into port management practices and engineering design frameworks, ensuring that they reflect the fluctuating intensity of metocean forcing throughout the year.
Beyond the event-scale analysis, this study contributes to the broader framework of climate-resilient port management by illustrating how compound metocean hazards and associated wave agitation may compromise critical harbour operations. The impacts observed at Langosteira and Tarragona harbours underscore the need for integrated multi-hazard early warning systems to support anticipatory decision-making and robust, evidence-based assessments of harbour operability. Such approaches align with the objectives of the EU Mission “Ocean and Waters”, which promotes the enhancement of long-term infrastructure resilience and the translation of scientific knowledge into operational tools for sustainable ocean governance under a changing climate (EU Mission Ocean and Waters, 2025).
In addition, the capacity of HFR technology to capture extreme wave conditions was evaluated through direct comparison with in situ buoy measurements. Results suggest that HFR networks are capable of reliably characterizing storm-induced offshore wave fields, supporting their broader adoption in operational monitoring frameworks. Complementarily, a long-term (2014–2024) validation of HFR-derived wave parameters from the VILA site against in situ data from the Villano-Sisargas deep-water buoy revealed strong agreement for SWH (R = 0.87) and moderate concordance for CWP (R = 0.71) but systematic biases due to methodological differences. MWD showed greater dispersion and reduced accuracy (R = 0.66), reflecting well-known HFR limitations, such as radio frequency interference under low-wave conditions. The considerable distance between the deep-water buoy locations and the selected RCs (shown in Fig. 2a) should also be acknowledged, as it may influence the accuracy and interpretation of the derived skill metrics. The sensitivity of wave parameter estimates to the aforementioned low-frequency noise could be mitigated through the implementation of a multi-frequency HFR system. By alternating the transmit frequency from 5 to 13 MHz during low to moderate sea states – typically occurring in NWI during late spring and summer – measurement performance across a broad range of SWH may be substantially improved (Wyatt and Green, 2009).
In summary, the present study underscores the importance of integrated observational platforms for real-time extreme-hazard assessment and highlights the critical need to develop climate-resilient port infrastructure capable of withstanding intensifying ocean–atmosphere extremes.
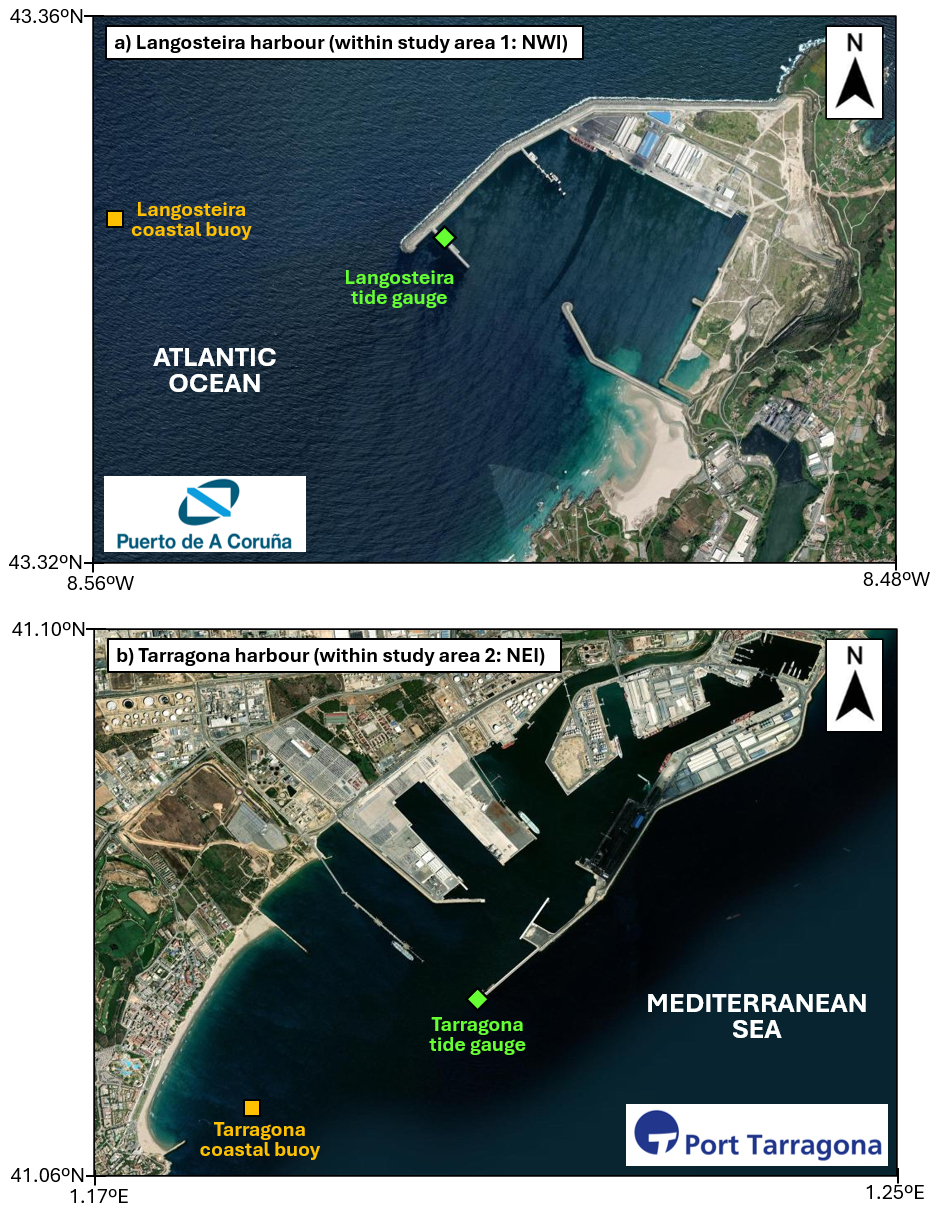
Figure A1Aerial snapshot showing the geometry of two Spanish harbours: (a) Langosteira harbour (which belongs to the A Coruña port authority), located in the northwestern Iberia (NWI) area, and (b) Tarragona harbour, situated in the northeastern Iberia (NEI) area. The orange squares and green diamonds denote the location of coastal moored buoys and tide gauges, respectively. Map by © ArcgGis.
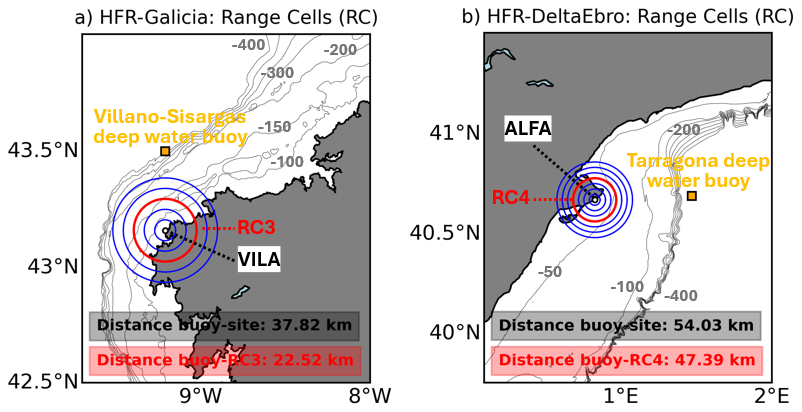
Figure A2Spatial distribution of the concentric range cells (RCs) extending radially from the onshore origin at (a) the VILA site (HFR-Galicia system) and (b) the ALFA site (HFR-DeltaEbro system). Wave data derived from HFR (product ref. no. 4 in Table 1) for the selected RC (highlighted in red) were compared with in situ measurements (product ref. no. 2 in Table 1) from moored buoys (indicated by orange squares). Isobath depths are labelled every 100 m. Distances between moored buoys, their respective sites, and selected RCs are shown in the lower boxes.
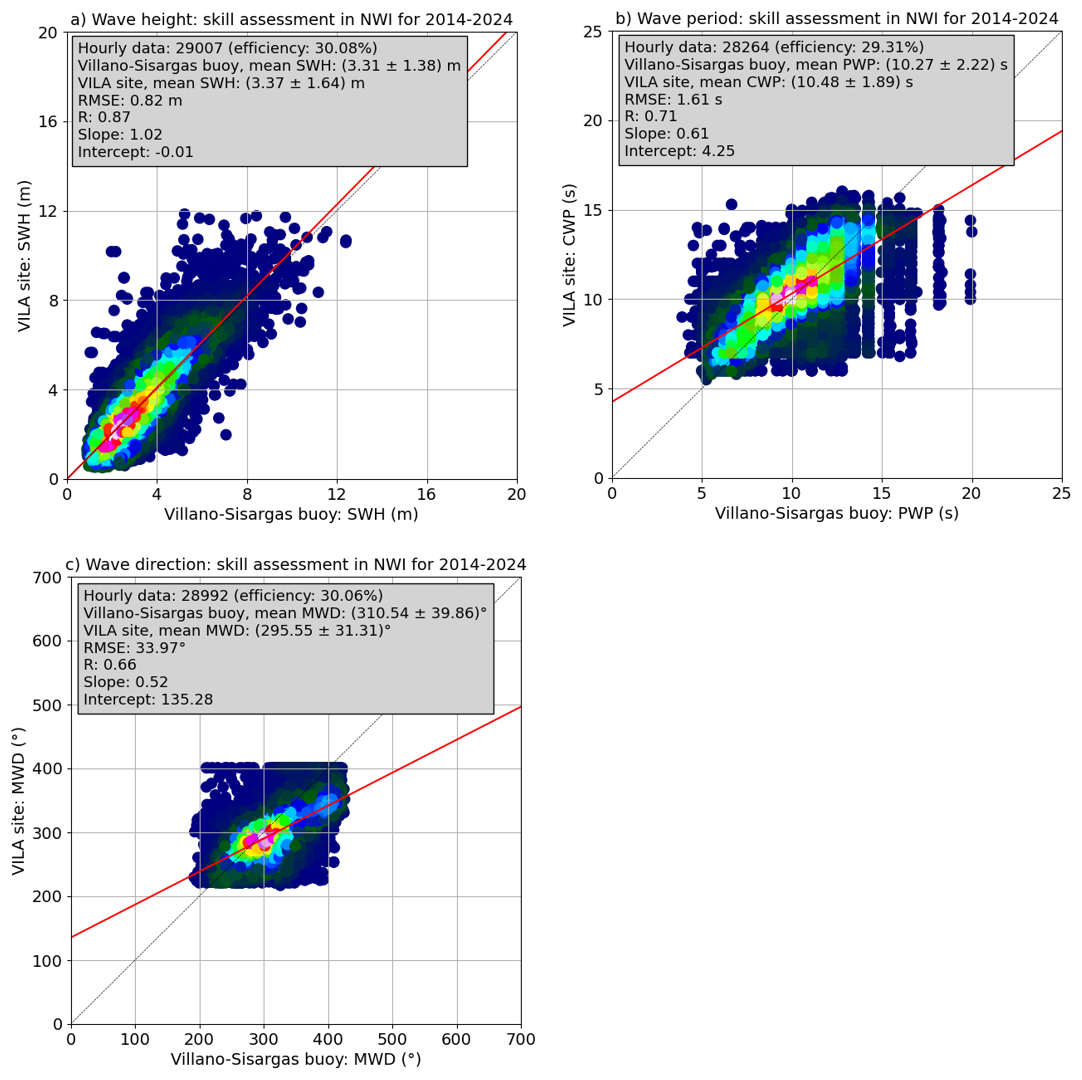
Figure A3Long-term skill assessment of VILA site wave data at range cell 3 (RC3) (product ref. no. 4 in Table 1) compared with in situ observations provided by the Villano-Sisargas deep-water buoy (product ref. no. 2 in Table 1) for the concurrent 11-year period (2014–2024): best linear fit (solid red line) of scatter plot between hourly observations of (a) significant wave height (SWH), (b) period (centroid and peak wave period – CWP and PWP, respectively), and (c) mean wave direction (MWD), where angles less than 60° were adjusted by adding 360° to improve visibility and facilitate linear regression. The dotted black line represents the result of perfect agreement with a slope of 1.0 and an intercept of 0. Statistical metrics are presented in the grey box.
The model and observation products used in this study from both the Copernicus Marine Service and other sources are listed in Table 1.
PL, GA, PM, SG, CPI, MA, VMM, PG, FM, AMM, BPG, SPR, and MIR conducted the pilot study through fruitful discussions in the framework of working team meetings. PL designed the experiment, analysed the data, created the figures, and prepared a first version of the draft with inputs from all co-authors. MA, SM, and CPI conducted a bibliographic revision of extreme metocean events that had previously occurred in the study areas. PG, AMM, and MIR prepared the ERA5 dataset. FM extracted time series from the Puertos del Estado internal database and prepared diverse in situ sensor datasets. BPG proposed the agitation study in both ports and analysed the corresponding tide gauge records. SPR analysed the atmospheric driving mechanisms during the event. MIR applied quality control to the historical time series of wave parameters from coastal moored buoys. PM and GA prepared datasets from the VILA site, while VMM did so for the ALFA site. Finally, all authors participated in the drafting and revision of the paper through successive iterations.
The contact author has declared that none of the authors has any competing interests.
The Copernicus Marine Service offering is regularly updated to ensure it remains at the forefront of user requirements. In this process, some products may undergo replacement or renaming, leading to the removal of certain product IDs from the catalogue. If readers have any questions or require assistance regarding these modifications, please feel free to reach out to the Copernicus Marine Service user support team for further guidance. They will be able to provide the necessary information to address concerns and find suitable alternatives.
Publisher's note: Copernicus Publications remains neutral with regard to jurisdictional claims made in the text, published maps, institutional affiliations, or any other geographical representation in this paper. The authors bear the ultimate responsibility for providing appropriate place names. Views expressed in the text are those of the authors and do not necessarily reflect the views of the publisher.
The authors are grateful to the Copernicus Marine Service for providing the data and INTECMAR–Consellería do Mar–Xunta de Galicia and the Hydrographic Institute of Portugal for the strong cooperation in jointly operating the HFR-Galicia network.
This paper was edited by Marta Marcos and reviewed by two anonymous referees.
AEMET: https://www.aemet.es/es/web/conocermas/borrascas/2023-2024/estudios_e_impactos/louis, last access: 26 December 2025.
Álvarez-Fanjul, E., Pérez Gómez, B., de Alfonso Alonso-Muñoyerro, M., Lorente Jiménez, P., García Sotillo, M., Lin-Ye, J., Aznar Lecocq, R., Ruíz Gil de la Serna, M., Pérez Rubio, S., Clementi, E., Coppini, G., García-León, M., Fernandes, M., García Valdecasas, J., García Valdecasas, J. M., Santos Muñoz, D., Luna Rico, M. Y., Mestres, M., Molina, R., Tintoré, J., Mourre, B., Masina, S., Mosso, C., Reyes, E., and Santana, A.: Western Mediterranean record-breaking storm Gloria: An integrated assessment based on models and observations, in: Copernicus Ocean State Report, issue 6, edited by: von Schuckmann, K., Journal of Operational Oceanography, 1–220, https://doi.org/10.1080/1755876X.2022.2095169, 2022.
Aon-Benfield: Annual global climate and catastrophe report, Impact Forecasting 2009, Chicago, Illinois, http://www.aon.com/attachments/reinsurance/200912_ab_if_impact_forecasting_2009_report.pdf, last access: 26 December 2025.
Asariotis, R., Benamara, H., and Mohos-Naray, V.: Port industry survey on climate change impacts and adaptation, United Nations Conference on Trade and Development (UNCTAD), Research Paper, 18, 1–66, https://doi.org/10.13140/RG.2.2.28176.66569, 2017.
Atan, R., Goggins, J., Hartnett, M., Nash, S., and Agostinho, P.: Assessment of Extreme Wave Height Events in Galway Bay Using High Frequency Radar (CODAR) Data, Renewable Energies Offshore, 49–56, https://doi.org/10.1201/b18973-8, 2015.
Atan, R., Goggins, J., and Nash, S.: A Detailed Assessment of the Wave Energy Resource at the Atlantic Marine Energy Test Site, Energies, 9, 967, https://doi.org/10.3390/en9110967, 2016.
Barrick, D. E., Evans, M. W., and Weber, B. L.: Ocean surface currents mapped by radar, Science, 198, 138–144, https://doi.org/10.1126/science.198.4313.138, 1977.
Basañez, A., Lorente, P., Montero, P., Álvarez-Fanjul, E., and Pérez-Muñuzuri, V.: Quality assessment and practical interpretation of the wave parameters estimated by HF Radars in NW Spain, Remote Sens., 12, 598, https://doi.org/10.3390/rs12040598, 2019.
Camus, P., Tomás, A. Díaz-Hernández, G., Rodríguez, B., Izaguirre, C., and Losada, I.J.: Probabilistic assessment of port operation downtimes under climate change, Coastal Engineering, 147, 12–24, https://doi.org/10.1016/j.coastaleng.2019.01.007, 2019.
Cao, X. and Su, Z.: Do Extreme Weather Events Increase Public Concern, Knowledge, and Attention to Climate Change in China?, British Journal of Political Science, 55, e10, https://doi.org/10.1017/S0007123424000565, 2025.
Casas-Prat, M. and Sierra, J. P.: Trend analysis of wave direction and associated impacts on the Catalan coast, Climatic Change, 115, 667–691, https://doi.org/10.1007/s10584-012-0466-9, 2012.
Coles, S.: An Introduction to Statistical Modelling of Extreme Values, Springer-Verlag, https://doi.org/10.1007/978-1-4471-3675-0, 2001.
Copernicus Climate Change Service, Climate Data Store: ERA5 hourly data on single levels from 1940 to present, Copernicus Climate Change Service (C3S) Climate Data Store (CDS), https://doi.org/10.24381/cds.adbb2d47, 2023.
Copernicus Marine In situ Team: Copernicus in Situ TAC, Real Time Quality Control for WAVES, Copernicus in situ TAC, Toulouse, France, 1–16, https://doi.org/10.13155/46607, 2020.
Crombie, D. D.: Doppler spectrum of sea echo at 13.56 Mc/S, Nature, 175, 681–682, https://doi.org/10.1038/175681a0, 1955.
Davidson, F., Alvera-Azcárate, A., Barth, A., Brassington, G. B., Chassignet, E. P., Clementi, E., De Mey-Frémaux, P., Divakaran, P., Harris, C., Hernandez, F., Hogan, P., Hole, L. R., Holt, J., Liu, G., Lu, Y., Lorente, P., Maksymczuk, J., Martin, M., Mehra, A., Melsom, A., Mo, H., Moore, A., Oddo, P., Pascual, A., Pequignet, A-C, Kourafalou, V., Ryan, A., Siddorn, J., Smith, G., Spindler, D., Spindler, T., Stanev, E. V., Staneva, J., Storto, A., Tanajura, C., Vinayachandran, P. N., Wan, L., Wang, H., Zhang, Y., Zhu, X., and Zu, Z.: Synergies in Operational Oceanography: The intrinsic need for sustained ocean observations, Front. Mar. Sci., 6, 450, https://doi.org/10.3389/fmars.2019.00450, 2019.
Díaz-Hernández, G., Rodríguez Fernández, B., Romano-Moreno, E., and Lara, J. L.: An improved model for fast and reliable harbour wave agitation assessment, Coastal Engineering, 170, 104011, https://doi.org/10.1016/j.coastaleng.2021.104011, 2021.
Emery, W. J. and Thompson, R. E.: Data Analysis Methods in Physical Oceanography, Elsevier Science, Amsterdam, 654 pp., ISBN 9780080477008, 2001.
EU Copernicus Marine Service Product: Atlantic Iberian Biscay Irish Ocean-In-Situ Near Real Time Observations, Mercator Ocean International [data set], https://doi.org/10.48670/moi-00043, 2025.
EU Mission Ocean and Waters: https://oceans-and-fisheries.ec.europa.eu/news/mission-ocean-and-waters-over-1000-initiatives-protect-and-restore-marine-and-freshwater-ecosystems-2025-06-02_en, last access: 26 December 2025.
Fanti, V., Ferreira, Ó., Kümmerer, V., and Loureiro, C.: Improved estimates of extreme wave conditions in coastal areas from calibrated global reanalyses, Commun. Earth Environ., 4, 151, https://doi.org/10.1038/s43247-023-00819-0, 2023.
Fernández-Pérez, A., Lara, J. L., Lucio, D., and Losada, I. J.: Compound climate change risk analysis for port infrastructures, Coastal Engineering, 193, 104560, https://doi.org/10.1016/j.coastaleng.2024.104560, 2024.
Fink, A. H., Brücher, T., Ermert, V., Krüger, A., and Pinto, J. G.: The European storm Kyrill in January 2007: synoptic evolution, meteorological impacts and some considerations with respect to climate change, Nat. Hazards Earth Syst. Sci., 9, 405–423, https://doi.org/10.5194/nhess-9-405-2009, 2009.
Forney, R., Roarty, H., and Glenn, S.: Measuring waves with a compact HF radar, OCEANS 2015 – MTS/IEEE Washington, Washington, DC, USA, 1–5, https://doi.org/10.23919/OCEANS.2015.7404428, 2015.
Forzieri, G., Bianchi, A., Batista e Silva, F., Marin Herrera, M. A., Leblois, A., Lavalle, C., Aerts, J. C. J. H., and Feyen, L.: Escalating impacts of climate extremes on critical infrastructures in Europe, Global Environmental Change, 48, 97–107, https://doi.org/10.1016/j.gloenvcha.2017.11.007, 2018.
García-Valdecasas, J., Pérez Gómez, B., Molina, R., Rodríguez, A., Rodríguez, D., Pérez, S., Campos, A., Rodríguez-Rubio, P., Gracia, S., Ripollés, L., Terrés Nicoli, J. M., de los Santos, F. J., and Álvarez-Fanjul, E.: Operational tool for characterizing high-frequency sea level oscillations, Nat. Hazards, 106, 1149–1167, https://doi.org/10.1007/s11069-020-04316-x, 2021.
Harley, M.: Coastal storm definition, in: Coastal storms: processes and impacts, edited by: Ciavola, P. and Coco, G., John Wiley and Sons, 1–21, https://doi.org/10.1002/9781118937099.ch1, 2017
Hersbach, H., Bell, B., Berrisford, P., Biavati, G., Horányi, A., Muñoz Sabater, J., Nicolas, J., Peubey, C., Radu, R., Rozum, I., Schepers, D., Simmons, A., Soci, C., Dee, D., and Thépaut, J.-N.: ERA5 hourly data on single levels from 1940 to present, Copernicus Climate Change Service (C3S) Climate Data Store (CDS) [data set], https://doi.org/10.24381/cds.adbb2d47, 2023.
Hisaki, Y.: Nonlinear inversion of the integral equation to estimate ocean wave spectra from HF radar, Radio Sci., 31, 25–39, https://doi.org/10.1029/95RS02439, 1996.
Hurrell, J. W. and Deser, C.: North Atlantic climate variability: The role of the North Atlantic Oscillation, J. Mar. Syst., 78, 28–41, https://doi.org/10.1016/j.jmarsys.2009.11.002, 2009.
In Situ TAC partners: EU Copernicus Marine Service Product User Manual for the Atlantic Iberian Biscay Irish Ocean-In-Situ Near Real Time Observations, INSITU_IBI_PHYBGCWAV_DISCRETE_MYNRT_013_033, Issue: 2.2, Mercator Ocean International, https://documentation.marine.copernicus.eu/PUM/CMEMS-INS-PUM-013-030-036.pdf (last access: 21 July 2025), 2024.
Izaguirre, C., Losada, I. J., Camus, P., Vigh, J. L., and Stenek, V.: Climate change risk to global port operations, Nat. Clim. Chang., 11, 14–20, https://doi.org/10.1038/s41558-020-00937-z, 2021.
Jacobeit, J., Philipp, A., and Nonnenmacher, M.: Atmospheric circulation dynamics linked with prominent discharge events in Central Europe, Hydrological Sciences Journal, 51, 946–965, https://doi.org/10.1623/hysj.51.5.946, 2006.
Kettle, A. J.: Storm Kyrill and the storms of mid-January 2007: Societal and Energy Impacts in Europe, Adv. Geosci., 58, 135–147, https://doi.org/10.5194/adgeo-58-135-2023, 2023.
Kleespies, M. W., Friedrich, T., Marg, O., Völker, C., and Schiwy, S.: Assessing the unseen consequences: influence of an extreme weather event on environmental perceptions and connection to nature, Environ. Sci. Eur., 36, 122, https://doi.org/10.1186/s12302-024-00950-5, 2024.
Khodayar, S., Kushta, J., Catto, J. L., Dafis, S., Davolio, S., Ferrarin, C. Flaounas, E., Groenemeijer, P., Hatzaki, M., Hochman, A., Kotroni, V., Landa, J., Láng-Ritter, I., Lazoglou, G., Liberato, M. L. R., Miglietta, M. M., Papagiannaki, K., Patlakas, P., Stojanov, R., and Zittis, G.: Mediterranean cyclones in a changing climate: A review on their socio-economic impacts, Reviews of Geophysics, 63, e2024RG000853, https://doi.org/10.1029/2024RG000853, 2025.
Konisky, D. M., Hughes, L., and Kaylor, C. H.: Extreme weather events and climate change concern, Clim. Change, 134, 533–547, https://doi.org/10.1007/s10584-015-1555-3, 2015.
Leal Filho, W., Abeldaño Zuñiga, R. A., Sierra, J., Dinis, M. A. P., Corazza, L., Nagy G. J., and Aina, Y. A.: An assessment of priorities in handling climate change impacts on infrastructures, Sci. Rep., 14, 14147, https://doi.org/10.1038/s41598-024-64606-3, 2024.
Liberato, M. L. R., Pinto, J. G., Trigo, I. F., and Trigo, R. M.: Klaus – an exceptional winter storm over northern Iberia and southern France, Weather, 66, 330–334, https://doi.org/10.1002/wea.755, 2011.
Linnenluecke, M. K., Griffiths, A., and Winn, M.: Extreme weather events and the critical importance of anticipatory adaptation and organizational resilience in responding to impacts, Bus. Strat. Environ., 21, 17–32, https://doi.org/10.1002/bse.708, 2012.
Lipa, B. J. and Nyden, B.: Directional wave information from the SeaSonde, IEEE J. Oceanic Eng., 30, 221–231, https://doi.org/10.1109/joe.2004.839929, 2005.
Lipa, B. J., Nyden, B., Barrick, D., and Kohut, J.: HF Radar Sea-Echo from Shallow Water, Sensors, 8, 4611–4635, 2008.
Lipa, B., Daugharty, M., Losekoot, M., and Fernandes, M.: Progress in Compact HF Radar Measurement of Bimodal Ocean Wave Parameters, Remote Sensing, 14, 2631, https://doi.org/10.3390/rs14112631, 2022.
Little, A. S., Priestley, M. D. K., and Catto, J. L.: Future increased risk from extratropical windstorms in northern Europe, Nat. Commun., 14, 4434, doi.10.1038/s41467-023-40102-6, 2023.
Long, R. M., Barrick, D., Largier, J. L., and Garfield, N.: Wave Observations from Central California: SeaSonde Systems and in Situ Wave Measurements, Journal of Sensors, 2011, 1–18, https://doi.org/10.1155/2011/728936, 2011.
Lopez, G. and Conley, D. C.: Comparison of HF Radar Fields of Directional Wave Spectra Against In Situ Measurements at Multiple Locations, Journal of Marine Science and Engineering, 7, 271, https://doi.org/10.3390/jmse7080271, 2019.
Lorente, P., Lin-Ye, J., García-León, M., Reyes, E., Fernandes, M., Sotillo, M. G., Espino, M., Ruiz, M. I., Gracia, V., Pérez, S., Aznar, R., Alonso-Martirena, A., and Álvarez-Fanjul, E.: On the Performance of High Frequency Radar in the Western Mediterranean During the Record-Breaking Storm Gloria, Front. Mar. Sci., 8, 645762, https://doi.org/10.3389/fmars.2021.645762, 2021.
Lorente, P., Aguiar, E., Bendoni, M., Berta, M., Brandini, C., Cáceres-Euse, A., Capodici, F., Cianelli, D., Ciraolo, G., Corgnati, L., Dadić, V., Doronzo, B., Drago, A., Dumas, D., Falco, P., Fattorini, M., Gauci, A., Gómez, R., Griffa, A., Guérin, C.-A., Hernández-Carrasco, I., Hernández-Lasheras, J., Ličer, M., Magaldi, M. G., Mantovani, C., Mihanović, H., Molcard, A., Mourre, B., Orfila, A., Révelard, A., Reyes, E., Sánchez, J., Saviano, S., Sciascia, R., Taddei, S., Tintoré, J., Toledo, Y., Ursella, L., Uttieri, M., Vilibić, I., Zambianchi, E., and Cardin, V.: Coastal high-frequency radars in the Mediterranean – Part 1: Status of operations and a framework for future development, Ocean Sci., 18, 761–795, https://doi.org/10.5194/os-18-761-2022, 2022.
Lorente, P., de Alfonso, M., Gil, P., Manzano, F., Matulka, A. M., Pérez-Gómez, B., Pérez-Rubio, S., and Ruiz, M. I.: Monitoring the record-breaking wave event in Melilla harbour (SW Mediterranean Sea), in: 8th edition of the Copernicus Ocean State Report (OSR8), edited by: von Schuckmann, K., Moreira, L., Grégoire, M., Marcos, M., Staneva, J., Brasseur, P., Garric, G., Lionello, P., Karstensen, J., and Neukermans, G., Copernicus Publications, State Planet, 4-osr8, 19, https://doi.org/10.5194/sp-4-osr8-19-2024, 2024.
Lucio, D., Lara, J. L., Tomás, A., and Losada, I. J.: Probabilistic assessment of climate-related impacts and risks in ports, Reliability Engineering and System Safety, 251, 110333, https://doi.org/10.1016/j.ress.2024.110333, 2024.
Mateos, R. M., Sarro, R., Díez-Herrero, A., Reyes-Carmona, C., López-Vinielles, J., Ezquerro, P., and Monserrat, O.: Assessment of the socio-economic impacts of extreme weather events on the coast of southwest Europe during the period 2009–2020, Applied Sciences, 13, 2640, https://doi.org/10.3390/app13042640, 2023.
Mohr, S., Wilhelm, J., Wandel, J., Kunz, M., Portmann, R., Punge, H. J., Schmidberger, M., Quinting, J. F., and Grams, C. M.: The role of large-scale dynamics in an exceptional sequence of severe thunderstorms in Europe May–June 2018, Weather Clim. Dynam., 1, 325–348, https://doi.org/10.5194/wcd-1-325-2020, 2020.
Morales-Márquez, V., Orfila, A., Simarro, G., and Marcos, M.: Extreme waves and climatic patterns of variability in the eastern North Atlantic and Mediterranean basins, Ocean Sci., 16, 1385–1398, https://doi.org/10.5194/os-16-1385-2020, 2020.
Morales-Márquez, V., Dumas, D., and Guérin, C. A.: HF radar estimation of ocean wave parameters: Second-order Doppler spectrum versus Bragg wave modulation approach, Coastal Engineering, 198, 104719, https://doi.org/10.1016/j.coastaleng.2025.104719, 2024.
Owen, L. E., Catto, J. L., Stephenson, D. B., and Dunstone, N. J.: Compound precipitation and wind extremes over Europe and their relationship to extratropical cyclones, Weather and Climate Extremes, 33, 100342, https://doi.org/10.1016/j.wace.2021.100342, 2021.
Pérez, B., Payo, A., López, D., Woodworth, P. L., and Alvarez Fanjul, E.: Overlapping sea level time series measured using different technologies: an example from the REDMAR Spanish network, Nat. Hazards Earth Syst. Sci., 14, 589–610, https://doi.org/10.5194/nhess-14-589-2014, 2014.
Piñeres-Castillo, A. P. and Mojica-Herazo, J. C.: A Review of Wind Impact on Container Port Operations: Current Technologies, Strategies and Future Perspectives, The 2nd International Symposium on Intelligent Systems and Future Networks (ISFN 2024) 28–30 October 2024, Leuven, Belgium, Procedia Computer Science, 251, 783–788, https://doi.org/10.1016/j.procs.2024.11.185, 2024.
Portillo Juan, N., Negro Valdecantos, V., and del Campo, J. M.: Review of the Impacts of Climate Change on Ports and Harbours and Their Adaptation in Spain, Sustainability, 14, 7507, https://doi.org/10.3390/su14127507, 2022.
Roarty, H., Cook, T., Hazard, L., George, D., Harlan, J., Cosoli, S., Wyatt, L., Álvarez Fanjul, E., Terrill, E., Otero, M., Largier, J., Glenn, S., Ebuchi, N., Whitehouse, B., Bartlett, K., Mader, J., Rubio, A., Corgnati, L., Mantovani, C., Griffa, A., Reyes, E., Lorente, P., Flores-Vidal, X., Saavedra-Matta, K. J., Rogowski, P., Prukpitikul, S., Lee, S.-H., Lai, J.-W., Guerin, C.-A., Sánchez, J., Hansen, B., and Grilli, S.: The Global High Frequency Radar Network, Front. Mar. Sci., 6, 164, https://doi.org/10.3389/fmars.2019.00164, 2019.
Romano-Moreno, E., Diaz-Hernandez, G., Lara, J. L. Tomás, A., and Jaime, F. F.: Wave downscaling strategies for practical wave agitation studies in harbours, Coast. Eng., 175, 104140, https://doi.org/10.1016/j.coastaleng.2022.104140, 2022.
Rubio, A., Mader, J., Corgnati, L., Mantovani, C., Griffa, A., Novellino, A., Quentin, C., Wyatt, L., Schulz-Stellenfleth, J., Horstmann, J., Lorente, P., Zambianchi, E., Hartnett, M., Fernandes, C., Zervakis, V., Gorringe, P., Melet, A., and Puillat, I.: HF radar activity in European coastal seas: next steps towards a panEuropean HF radar network, Front. Mar. Sci., 20, 8, https://doi.org/10.3389/fmars.2017.00008, 2017.
Sánchez-Arcilla, A., Sierra, J.P., Brown, S., Casas-Prat, M., Nicholls, R. J., Lionello, P., and Conte, D.: A review of potential physical impacts on harbours in the Mediterranean Sea under climate change, Reg. Environ. Change, 16, 2471–2484, https://doi.org/10.1007/s10113-016-0972-9, 2016.
Saviano, S., Biancardi, A. A., Uttieri, M., Zambianchi, E., Cusati, L. A., Pedroncini, A., Contento, G., and Cianelli, D.: Sea Storm Analysis: Evaluation of Multiannual Wave Parameters Retrieved from HF Radar and Wave Model, Remote Sens., 14, 1696, https://doi.org/10.3390/rs14071696, 2022.
Sierra, J. P., Casas-Prat, M., Virgili, M., Mösso, C., and Sánchez-Arcilla, A.: Impacts on wave-driven harbour agitation due to climate change in Catalan ports, Nat. Hazards Earth Syst. Sci., 15, 1695–1709, https://doi.org/10.5194/nhess-15-1695-2015, 2015.
Sierra, J. P., Sánchez-Arcilla, A., Gironella, X., Gracia, V., Altomare, C., Mösso, C., González-Marco, D., Gómez, J., Barceló, M., and Barahona, C.: Impact of climate change on berthing areas in ports of the Balearic Islands: adaptation measures, Front. Mar. Sci., 10, 1124763, https://doi.org/10.3389/fmars.2023.1124763, 2023.
Tian, Z., Wen, B., Jin, L., and Tian, Y.: Radio frequency interference suppression algorithm in spatial domain for compact high-frequency radar, IEEE Geosci. Remote Sens. Lett., 15, 102–106, 2017.
Tintoré, J., Pinardi, N., Álvarez-Fanjul, E., Aguiar, E., Álvarez-Berastegui, D., Bajo, M., Balbin, R., Bozzano, R., Nardelli, B. B., Cardin, V., Casas, B., Charcos-Llorens, M., Chiggiato, J., Clementi, E., Coppini, G., Coppola, L., Cossarini, G., Deidun, A., Deudero, S., D'Ortenzio, F., Drago, A., Drudi, M., El Serafy, G., Escudier, R., Farcy, P., Federico, I., Fernández, J. G., Ferrarin, C., Fossi, C., Frangoulis, C., Galgani, F., Gana, S., García Lafuente, J., Sotillo, M. G., Garreau, P., Gertman, I., Gómez-Pujol, L., Grandi, A., Hayes, D., Hernández-Lasheras, J., Herut, B., Heslop, E., Hilmi, K., Juza, M., Kallos, G., Korres, G., Lecci, R., Lazzari, P., Lorente, P., Liubartseva, S., Louanchi, F., Malacic, V., Mannarini, G., March, D., Marullo, S., Mauri, E., Meszaros, L., Mourre, B., Mortier, L., Muñoz-Mas, C., Novellino, A., Obaton, D., Orfila, A., Pascual, A., Pensieri, S., Pérez Gómez, B., Pérez Rubio, S., Perivoliotis, L., Petihakis, G., de la Villéon, L. P., Pistoia, J., Poulain, P.-M., Pouliquen, S., Prieto, L., Raimbault, P., Reglero, P., Reyes, E., Rotllan, P., Ruiz, S., Ruiz, J., Ruiz, I., Ruiz-Orejón, L. F., Salihoglu, B., Salon, S., Sammartino, S., Sánchez Arcilla, A., Sánchez-Román, A., Sannino, G., Santoleri, R., Sardá, R., Schroeder, K., Simoncelli, S., Sofianos, S., Sylaios, G., Tanhua, T., Teruzzi, A., Testor, P., Tezcan, D., Torner, M., Trotta, F., Umgiesser, G., von Schuckmann, K., Verri, G., Vilibic, I., Yucel, M., Zavatarelli, M., and Zodiatis, G.: Challenges for Sustained Observing and Forecasting Systems in the Mediterranean Sea, Front. Mar. Sci., 6, 568, https://doi.org/10.3389/fmars.2019.00568, 2019.
Velpuri, M., Das, J., and Umamahesh, N. V.: Spatio-temporal compounding of connected extreme events: Projection and hotspot identification, Environmental Research, 235, 116615, https://doi.org/10.1016/j.envres.2023.116615, 2023.
Verschuur, J., Koks, E. E., and Hall, J. W.: Ports' criticality in international trade and global supply-chains, Nat. Commun., 13, 4351, https://doi.org/10.1038/s41467-022-32070-0, 2022.
Verschuur, J., Koks, E. E., Li, S., and Hall, J. W.: Multi-hazard risk to global port infrastructure and resulting trade and logistics losses, Commun. Earth Environ., 4, 5, https://doi.org/10.1038/s43247-022-00656-7, 2023.
Wanner, H., Beck, C., Brázdil, R., Casty, C., Deutsch, M., Glaser, R., Jacobeit, J., Luterbacher, J., Pfister, C., Pohl, S., Sturm, K., Werner, P. C., and Xoplaki, E.: Dynamic and socioeconomic aspects of historical floods in Central Europe, Erdkunde, 58, 1–16, http://www.jstor.org/stable/25647628 (last access: 21 July 2025), 2004.
Wehde, H., Schuckmann, K. V., Pouliquen, S., Grouazel, A., Bartolome, T., Tintoré, J., De Alfonso Alonso-Muñoyerro, M., Carval, T., Racapé, V., and the INSTAC team: EU Copernicus Marine Service Quality Information Document for the Atlantic Iberian Biscay Irish Ocean- In-Situ Near Real Time Observations, INSITU_IBI_PHYBGCWAV_DISCRETE_MYNRT_013_033, Issue 2.4, Mercator Ocean International, https://documentation.marine.copernicus.eu/QUID/CMEMS-INS-QUID-013-030-036.pdf (last access: 17 June 2025), 2024.
Wyatt, L. R.: The Measurement of the Ocean Wave Directional Spectrum from HF Radar Doppler Spectra, Radio Science, 21, 473–485, https://doi.org/10.1029/RS021i003p00473, 1986.
Wyatt, L. R.: A Relaxation Method for Integral Inversion Applied to HF Radar Measurement of the Ocean Wave Directional Spectrum, International Journal of Remote Sensing, 11, 1481–1494, https://doi.org/10.1080/01431169008955106, 1990.
Wyatt, L. R. and Green, J. J.: Measuring High and Low Waves with HF Radar, in: Proceedings of OCEAN_EUROPE, Bremen, Germany, 11–14 May 2009, 1–5, https://doi.org/10.1109/OCEANSE.2009.5278328, 2009.
Wyatt, L. R., Liakhovetski, G., Graber, H. C., and Haus, B. K.: Factors Affecting the Accuracy of SHOWEX HD Radar Wave Measurements, J. Atmos. Ocean. Tech., 22, 847–859, https://doi.org/10.1175/JTECH1728.1, 2005.