the Creative Commons Attribution 4.0 License.
the Creative Commons Attribution 4.0 License.
 | 30 Sep 2026 | OSR10 | Chapter 4.4
How extreme river discharge events shape coastal biogeochemical dynamics: the 2024 northern Adriatic case

Stefano Querin
Carolina Amadio
Giorgio Bolzon
Laura Feudale
Stefano Piani
Simone Spada
Gianpiero Cossarini
In 2024, the northern Adriatic Sea experienced marked levels of eutrophication, as indicated by unusually high surface chlorophyll concentrations observed by remote sensing and in-situ measurements. In addition, exceptionally high Po river discharges, in the form of repeated and intense events, were recorded from March to June and in October.
We used Copernicus Marine Service satellite and model products for the Mediterranean Sea, together with a high-resolution (500 m) Italian coastal model, to quantify chlorophyll anomalies in the area with respect to 1999–2022 climatology and investigated the marine ecosystem functioning in connection with river discharges, phosphate input and sea surface temperature as key drivers. We found that chlorophyll values exceeded 100 % above climatological levels in early spring, followed by sustained anomalies in summer and autumn. Primary production remained elevated from the early spring onward, with a significant anomaly peaking in early summer, concurrent with renewed Po river discharges and rising sea surface temperatures.
Our findings highlight the central importance of riverine freshwater and nutrient inputs in controlling the northern Adriatic ecosystem, in combination with circulation and thermal variability. Moreover, this study shows how forecasting systems play a pivotal role in monitoring eutrophication and potential biomass accumulation in the context of episodic river extremes and increasing climate variability, with high-resolution coastal modeling providing additional valuable insights into spatial patterns and localized eutrophication dynamics.
- Article
(5755 KB) - Full-text XML
- BibTeX
- EndNote


A Region of Freshwater Influence (ROFI) is a coastal area where riverine freshwater inputs drive stratification cycles, circulation structures and biogeochemical processes such as nutrient and carbon cycles. Typical features of these areas are marked salinity and nutrient gradients, buoyant plumes associated with higher productivity, and variability in the water column structure from seasonal to interannual scale (Simpson, 1997; Horner-Devine et al., 2015).
The northern Adriatic Sea (hereafter: NAS), the shallowest marginal region in the Mediterranean Sea (with mean depth of 35 m), is a ROFI area mainly under the influence of Po river (e.g., Raicich, 1996; Giani et al., 2012; Lipizer et al., 2014). The Po river, with a catchment area of 74000 km2, has a mean discharge of 1500 m3 s−1 (i.e., the third highest values among the rivers flowing into the Mediterranean Sea) and shows a negative trend in discharge values, due both to climate change and to the increased use of river dams for irrigation and other purposes (e.g. Marini and Grilli, 2023), in addition to high annual and seasonal variability (e.g., Montanari et al., 2023). Other rivers further contribute to the freshwater inputs into the NAS to a lesser extent (e.g., Adige, Brenta, Piave and Isonzo have mean discharges in the 100–300 m3 s−1 range; Ludwig et al., 2009; Cozzi and Giani, 2011; Verri et al., 2018). These freshwater inputs influence the cyclonic circulation which characterises the upper layer of the NAS, fueling the southward coastal current along the western coast (Western Adriatic Current, WAC, e.g., Raicich, 1996). On the eastern side of the area, a weaker and saltier Eastern Adriatic Current (EAC) flows northward along the eastern coast (e.g., Poulain, 2001).
The NAS is also subject to strong ecological impacts of human activities (e.g., agriculture, fishery, aquaculture) and between the 1970s and the mid-1980s it experienced a marked increase in eutrophication, which culminated in the occurrence of episodic hypoxia (e.g. Djakovac et al., 2015). In the following years, the NAS has undergone an oligotrophication phase (e.g. Mozetič et al., 2010; Ricci et al., 2024), ascribed both to the decreased river discharges and to a reduced anthropogenic pressure, associated with decreased phosphorus loads, mainly due a specific regulation on the production of detergents (Italian Ministerial Decree no. 413 of 13 September 1988; e.g., Cozzi and Giani, 2011; Marini and Grilli, 2023).
Given its proven sensitivity to climate and anthropogenic pressures, the NAS represents a key area for long-term environmental monitoring in the Mediterranean Sea. In this context, phytoplankton chlorophyll can be used as a valuable proxy for marine eutrophication (Descriptor 5 of the Marine Strategy Framework Directive; Ferreira et al., 2011; European Commission, 2020), reflecting variations in key drivers (e.g., nutrient availability, water column stability, and anthropogenic input) and undesirable changes in environmental conditions (e.g., excessive biomass accumulation, oxygen depletion). A continuous monitoring of both chlorophyll and Po river discharges (e.g., Mozetič et al., 2010; Vona et al., 2025), is therefore essential to assess the ecosystem health and to detect early signs of renewed occurrence of eutrophication or ecosystem regime shifts.
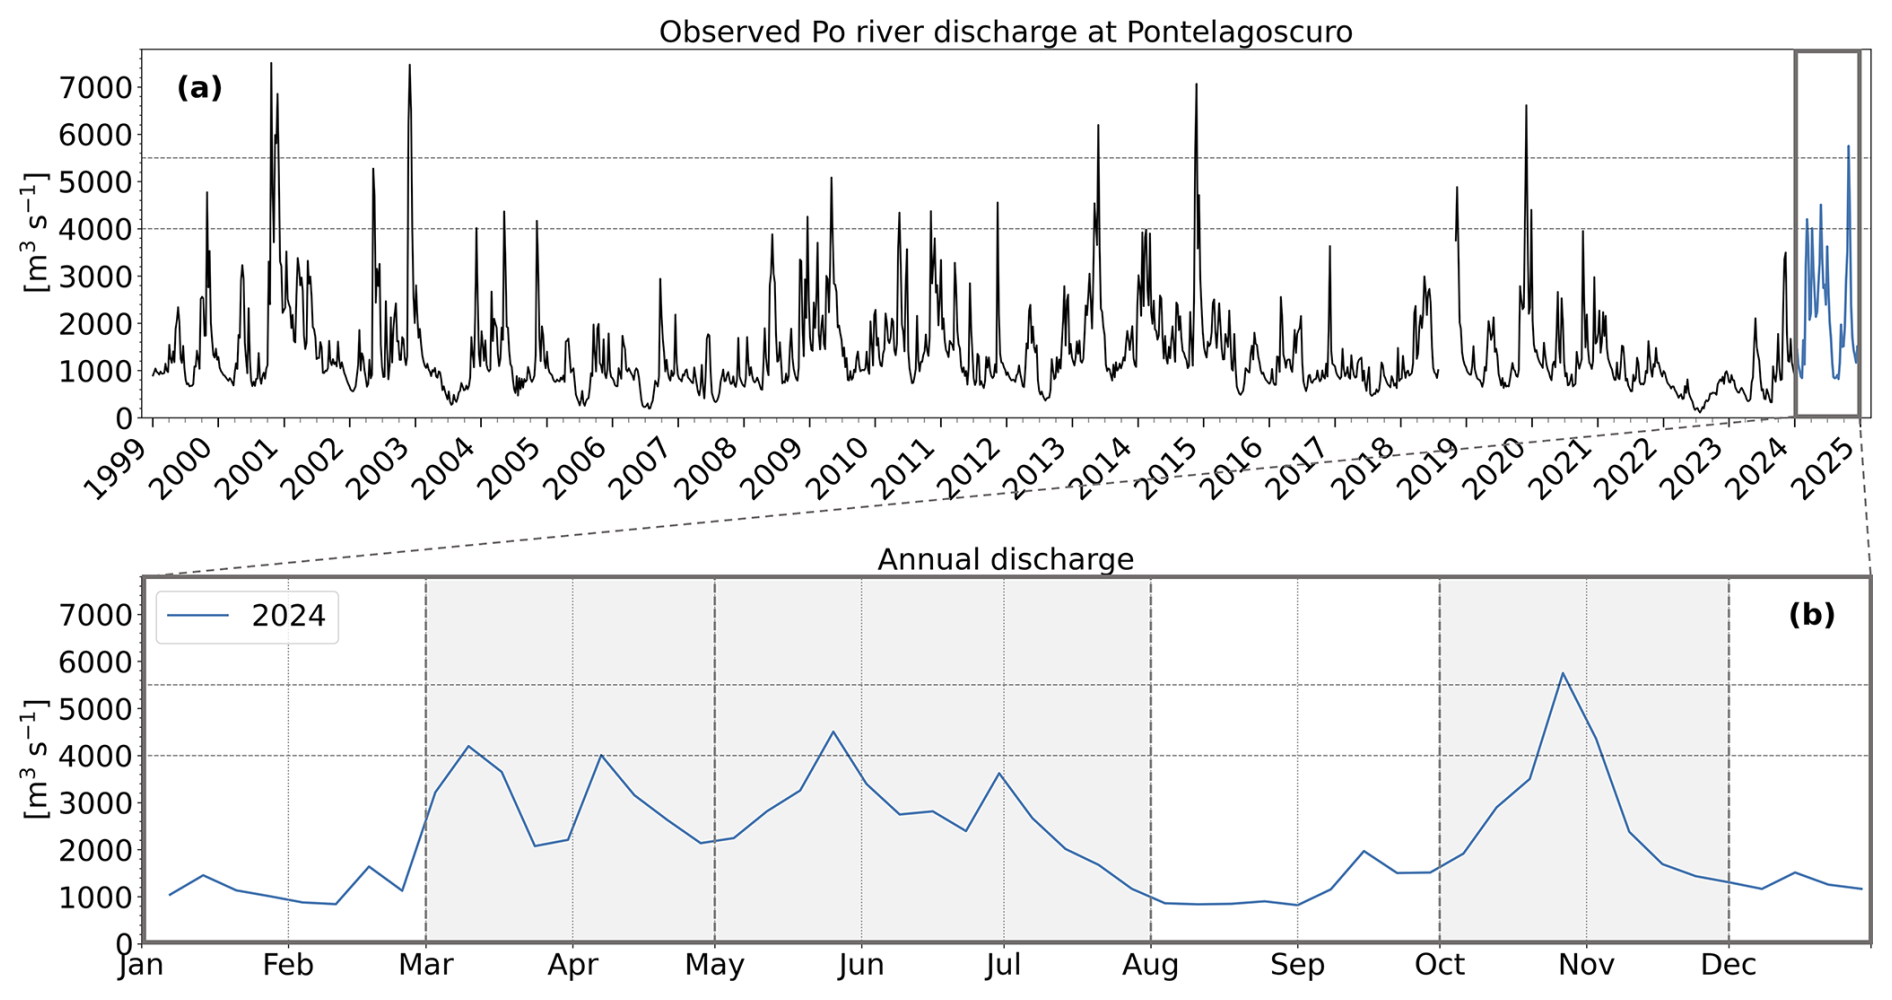
Figure 1Po river discharge at Pontelagoscuro station (Product 7), weekly averaged: in 1999–2024 (a) and zoomed in 2024 (b). In both panels, horizontal dotted lines indicate reference values for maximum weekly discharges in 2024 spring-early summer (i.e., 4000 m3 s−1) and autumn period (i.e., 5500 m3 s−1). In panel (b), shaded areas between vertical gray dotted lines identify time periods of high discharges in 2024 (i.e., March–April, May–July, October–November).
In this perspective, 2024 was an unusually wet year in the Po basin, especially in the first half of the year (Figs. 1 and A1, in the Appendix). Observations at Pontelagoscuro station (i.e., 44°53′10′′ N, 11°36′16′′ E) indicate that the Po river experienced consistently above-average discharges from March through July and again in October (https://www.arpa.veneto.it/temi-ambientali/idrologia/file-e-allegati/bollettini-risorsa-idrica/2024, last access: 5 May 2026). In particular, the hydrological status in March–May period was classified as “severe wetness” by the Italian Po River Basin Authority, on the basis of the Standardized Flow Index, estimated within the range +1.5 and +2 (in comparison with historical 1991–2020 data, https://www.adbpo.it/wp-content/uploads/2024/06/Situazione_Idrologica_dettagliata_agg06062024-2.pdf, last access: 5 May 2026) and on 21–22 October a red hydraulic alert was issued in eastern Emilia Romagna region (i.e., the coastal land of the Po river basin), as the river level surpassed level 3 (∼ 2.5 m), prompting local flood warnings (https://allertameteo.regione.emilia-romagna.it/singola-allerta/-/asset_publisher/FZPQSb6AzKtJ/Allerta-Bollettino/id/2838139, last access: 5 May 2026).
With respect to the reference period considered in this paper, i.e., 1999–2022, the annual Po river discharge was approximately 50 % higher. As shown in Fig. 1, four weekly peaks around 4000 m3 s−1 (two in spring and two in the early summer) characterized the first half of 2024, and one above 5500 m3 s−1 was detected in the autumn period (Fig. 1b). Similar values of weekly discharges in the spring-early summer occurred only 6 times in the last 25 years (i.e., in 2002, 2004, 2009, 2010, 2013, 2014, Fig. 1a), but only as single events during one year. Discharges larger than the 2024 value in autumn occurred only 4 times (i.e., 2000, 2002, 2014, 2019, same figure), and only in two cases accompanied by one event of high discharges in the spring-early summer period (i.e., 2002 and 2014). Consequently, 2024 can be considered a very anomalous year concerning Po river discharges in terms of absolute values, number of events and timing during the year.
At the same time, higher-than-usual chlorophyll values in the NAS were observed by remote sensing measurements (e.g., Fig. S11.4 in the report by Copernicus Climate Change Service, 2025). Moreover, coastal in situ data collected in the area showed much higher than usual values of chlorophyll (i.e., higher than 10 mg Chl m−3) in 15 April–23 May period and, at even higher level, in 24 October–19 November period), highlighting the anomalous characteristics of the events (https://www.arpae.it/it/temi-ambientali/mare/report-e-bollettini/bollettini-mare, last access: 5 May 2026). The summer of 2024 was also marked by other anomalous phenomena: extensive mucilage events were reported along the western and eastern coasts of the NAS (e.g., Vilibić et al., 2025). Such events have become rare since the eutrophication period of the 1980s, and a direct, unequivocal link between mucilage formation and exceptional spring discharges of the Po river can not be straightforwardly established. This is because mucilage development results from multiple concurring processes, including the massive release of polysaccharide excrections by phytoplankton, under prolonged calm and sunny conditions, in strongly stratified waters (Precali et al., 2005), sometimes following intense phytoplankton blooms (e.g., Cozzi et al., 2004). Nonetheless, its occurrence in 2024 may represent another indication of the NAS system's anomalous behaviour during that year.
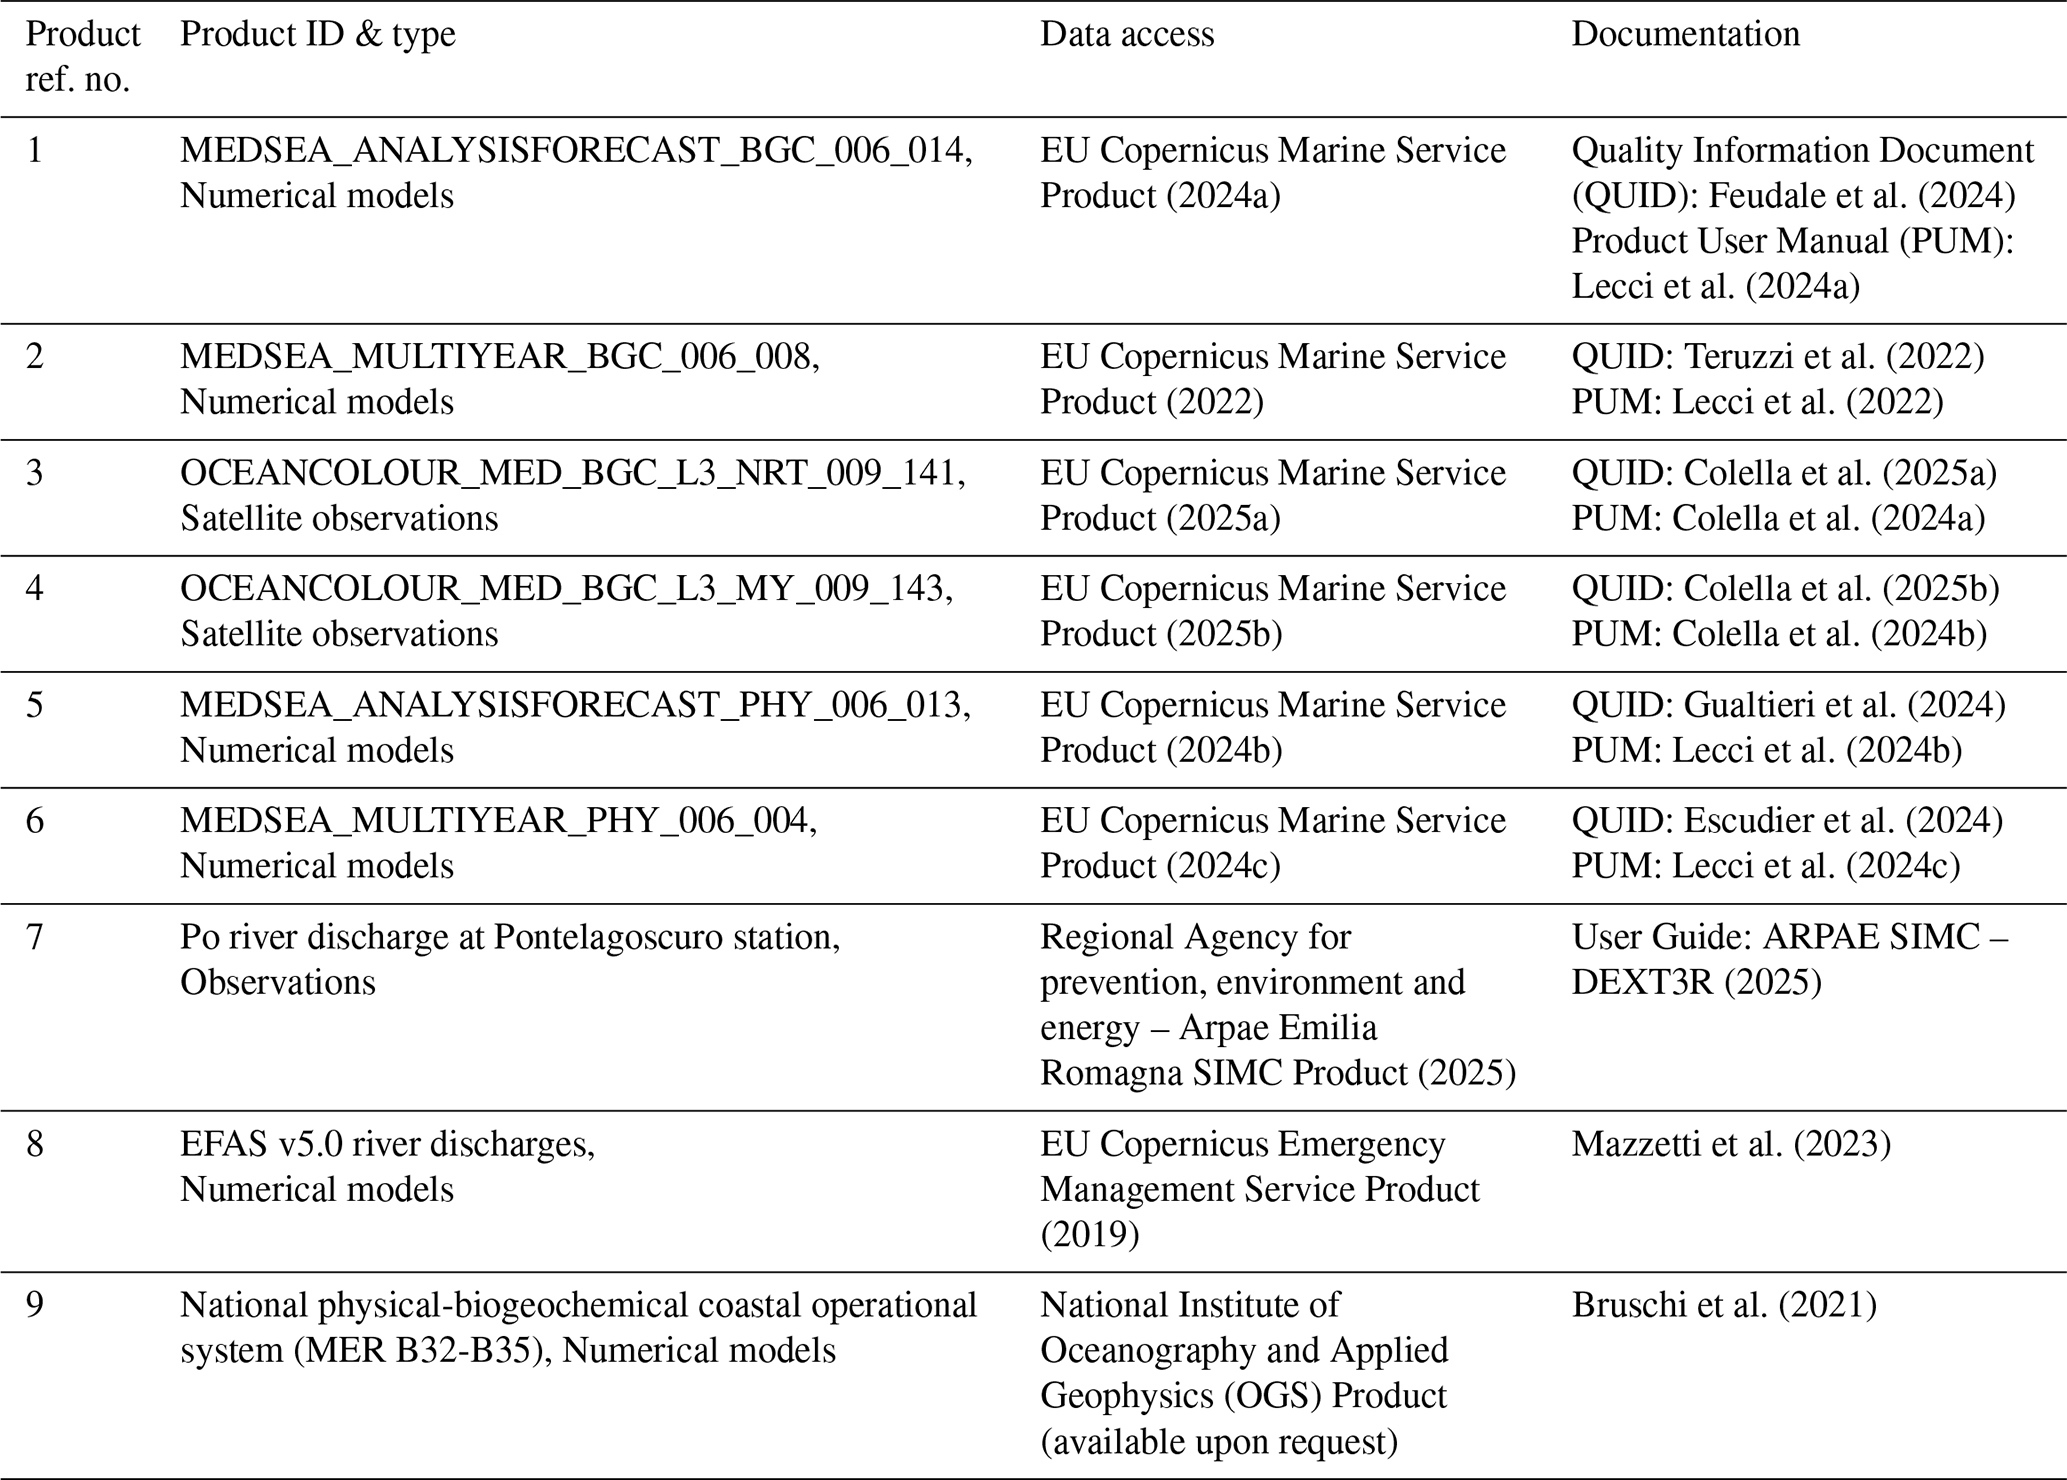
In this study we used Copernicus Marine Service (CMS) Mediterranean satellite and modeling products, plus other external products (please see the Table 1), to: (i) quantify the anomaly of the 2024 coastal chlorophyll in the NAS ROFI area with respect a reference period (1999–2022) encompassing the Ocean Colour era; (ii) investigate the relationships of the events of high positive anomalies of chlorophyll with the Po river discharge and other drivers (e.g., sea surface temperature). Moreover, we used a high resolution (500 m) Italian operational system to better characterize the eutrophication spatial patterns. Figure 2 shows an example of 2024 daily surface chlorophyll in the NAS ROFI area under the Po influence (boxes in the figure), according to the CMS satellite (Fig. 2a), CMS model (Fig. 2b) and Italian HR model (Fig. 2c).
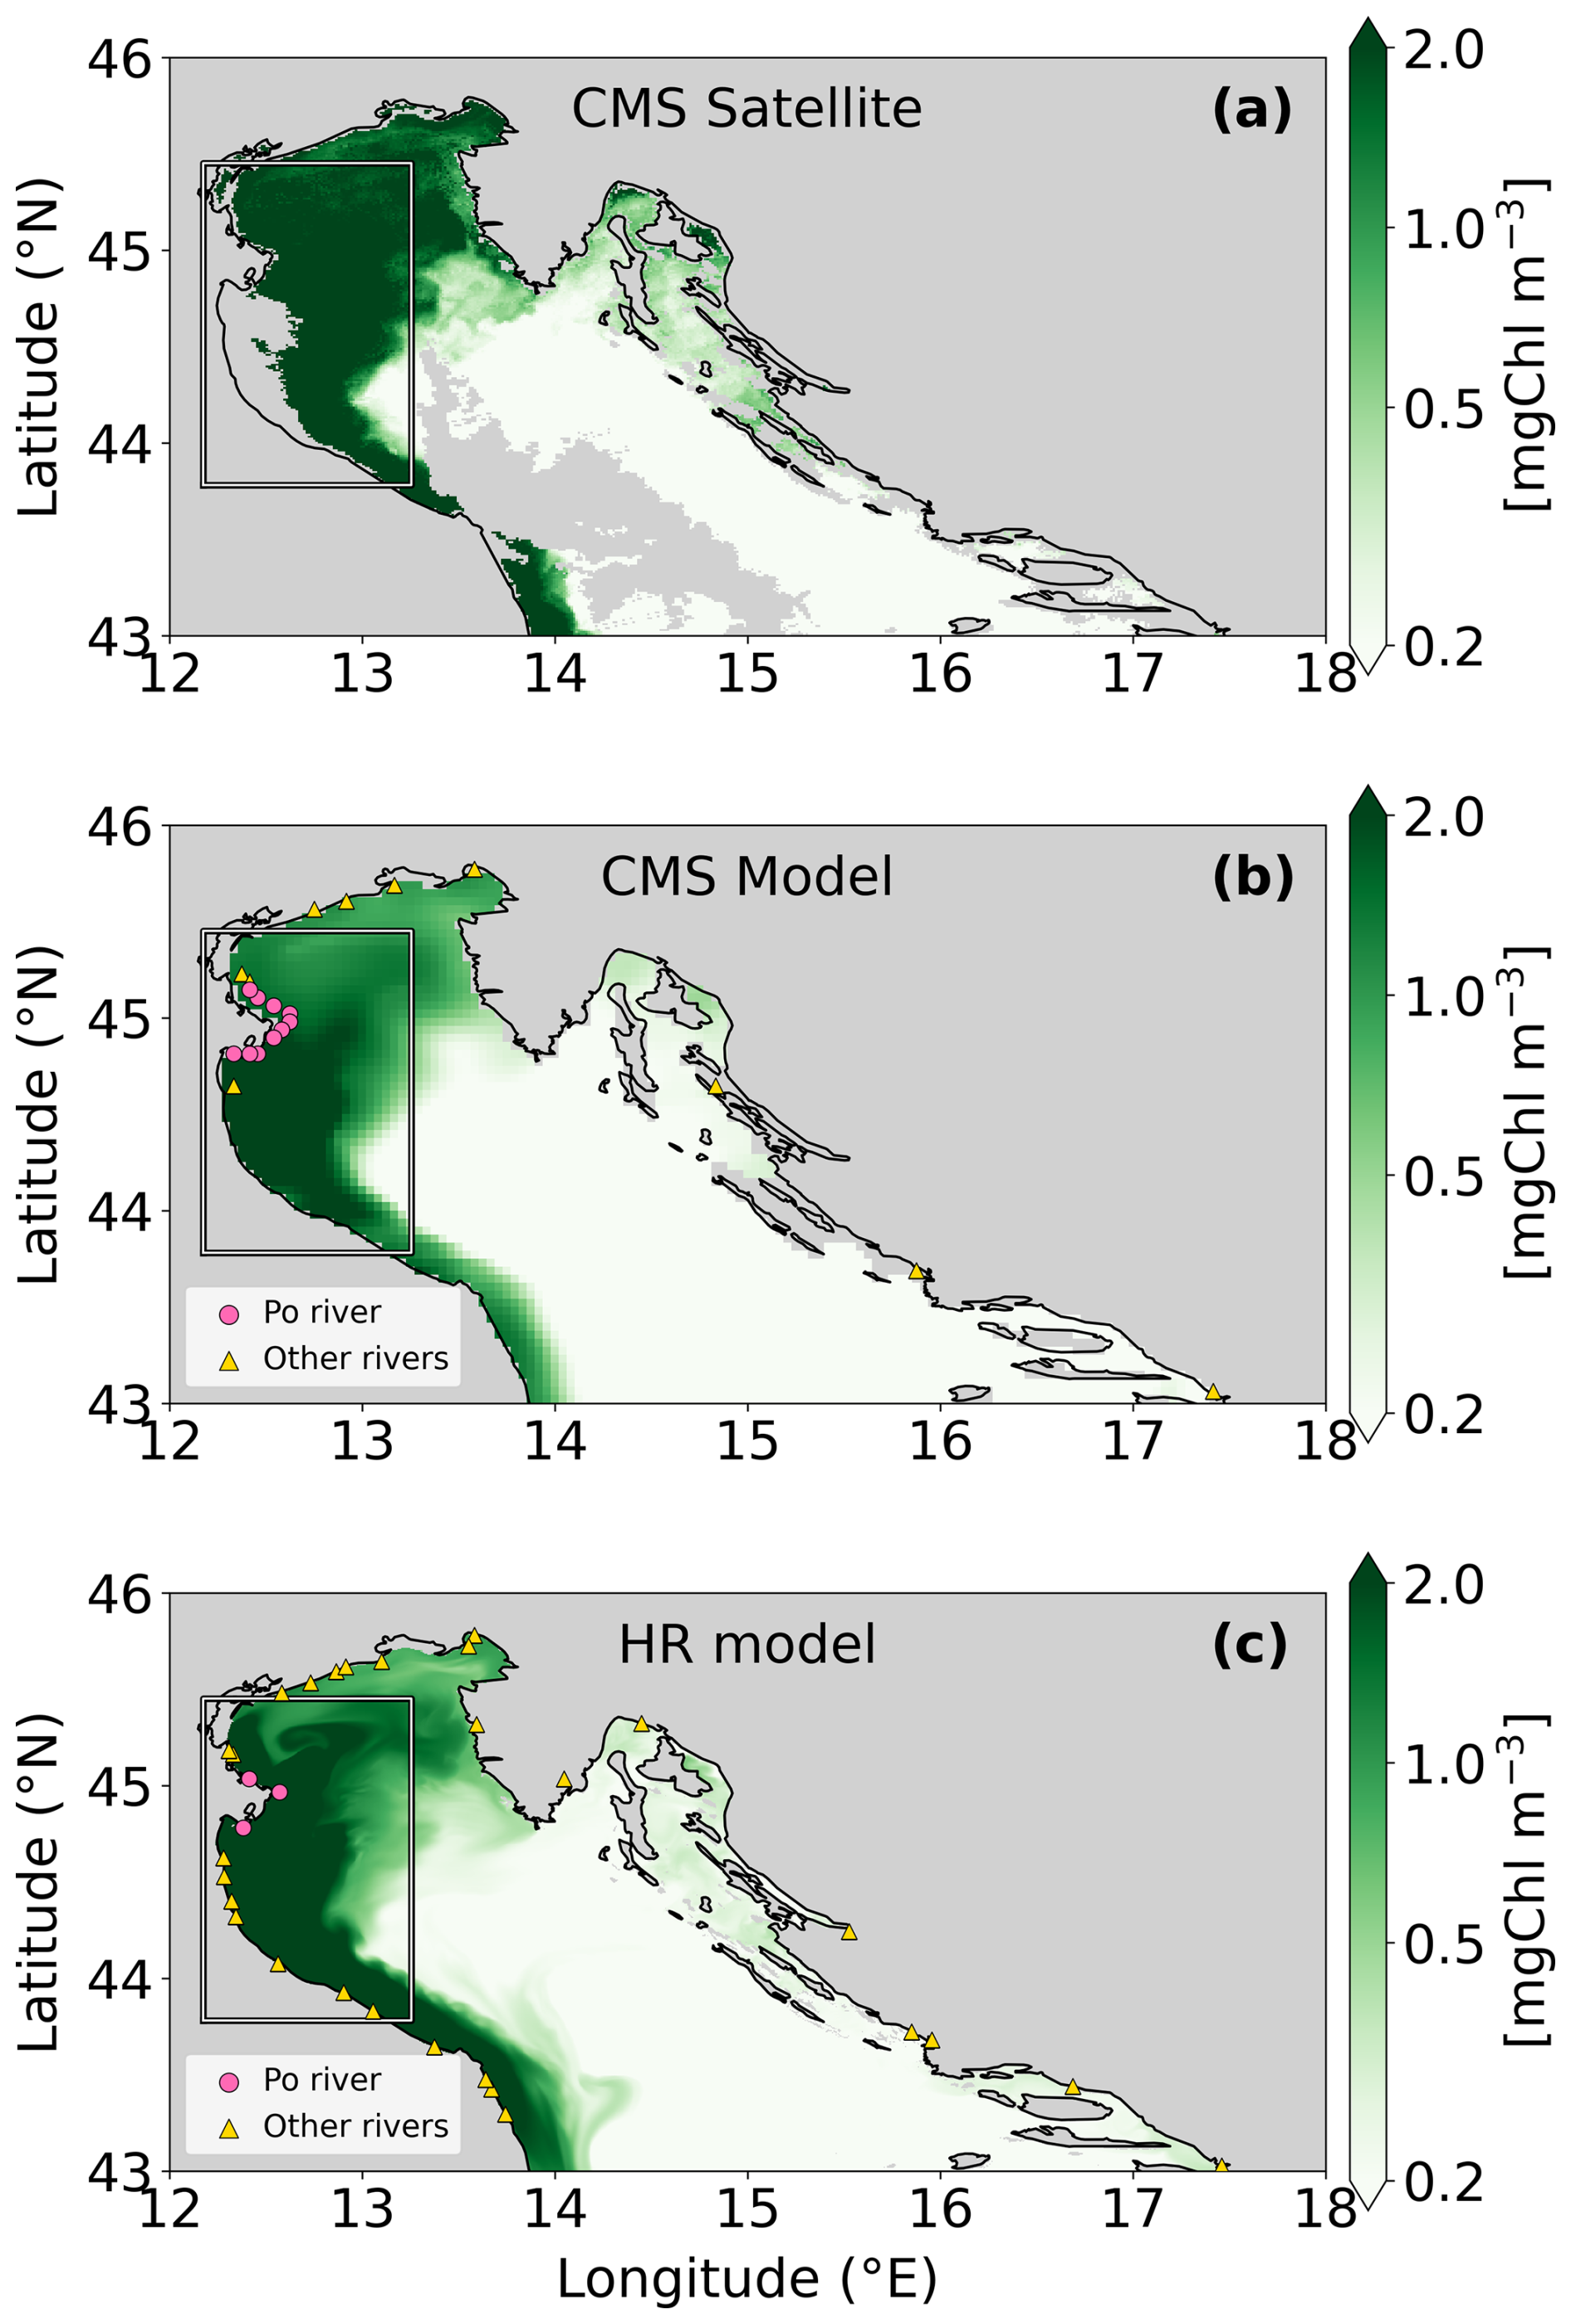
Figure 2Surface coastal chlorophyll in the northern Adriatic Sea, according to Copernicus Marine Service Med OCTAC L3 NRT satellite chlorophyll (a, Product 3), Copernicus Marine Service Med-MFC NRT model (b, Product 1) and the National high-resolution coastal operational system (c, Product 9), on 4th November 2024 as an example. The box contour identifies the Po ROFI region as the study area. Implemented positions of river discharge input in models are indicated by pink circles in the case of the Po river and by yellow triangles for the others.
Section 2 illustrates in detail all the products used, their main features and internal dependencies (Sect. 2.1), as well as the data analysis methods we adopted (Sect. 2.2). The section Results shows our evaluation of 2024 chlorophyll anomaly with respect to the reference period for both satellite and model CMS products (Sect. 3.1) and then our analysis of the ecosystem functioning during the 2024 year (Sect. 3.2). Discussion and conclusions Section includes our general interpretation of the events and their possible impacts on marine ecosystem also in the perspective of future climate change.
2.1 Products used and dependencies
To analyse the anomalous events in the NAS ROFI area in 2024, compared with previous years, we used the state-of-the-art models and data available at the highest temporal and spatial resolution, both for the physics and for the biogeochemistry.
CMS Med-MFC Analysis and Forecast and Reanalysis daily products (° of horizontal resolution) were used for the physics (Products 5 and 6, respectively) and for the biogeochemistry (Products 1 and 2). Modelled chlorophyll concentrations in Products 1 and 2 account for weekly data assimilation of CMS OCTAC L3 satellite chlorophyll, both in near-real time and as consistent reprocessed time series (Products 3 and 4, respectively), and such satellite data are also included in this study, in comparison with modelled data.
Moreover, Analysis and Forecast physical and biogeochemical products (i.e., Products 5 and 1) currently implement daily river discharges from Copernicus Emergency Management Service (CEMS) EFAS v5 system (Product 8), providing for the first time a long-term, high frequency forcing for the freshwater input and the nutrient loads of NAS marine environment. We thus used Po river discharges from EFAS v5 to characterise the riverine input in 2024 in this study. Within the EFAS system framework, modelled data for the Po river are calibrated on observational data at Pontelagoscuro station (Product 7), and modelled and observational time series in 2024 actually show very similar statistics and temporal dynamics, despite some differences (i.e., an EFAS underestimation of river discharges in March and April and after the October peak and an overestimation of the values in September, Fig. A1 in Appendix).
Finally, to provide an even higher resolution description of the spatial patterns associated with coastal dynamics, we used a novel Italian operational marine prediction system (at 500 m horizontal resolution, hereafter: HR model; Product 9), which is an evolution of that one presented in Bruschi et al., 2021. The new system employs CMS Med-MFC products as boundary conditions, assimilates weekly chlorophyll coming from the same CMS OCTAC satellite and implements daily river discharges from EFAS v5.
It should be specified that both CMS and HR biogeochemical products feature the Biogeochemical Flux Model (BFM) to simulate the chlorophyll concentration, as the sum of the chlorophyll component of four phytoplankton functional types (i.e., diatoms, nanophytoplankton, picophytoplankton, and dinoflagellates). Chlorophyll concentrations and phytoplankton functional types are extensively validated in CMS Med-MFC products (Cossarini et al., 2021; Teruzzi et al., 2022; Coppini et al., 2023; Feudale et al., 2024) and the same configuration is used in the HR model system.
2.2 Methods for data analysis
To avoid potential temporal mismatches given by the weekly frequency on Tuesday of OCTAC data assimilation by the CMS near-real-time model, the analysis of both satellite and modelled chlorophyll was carried out with weekly frequency. We also maintained the weekly basis in the reconstruction of their climatological reference (i.e., long-term average) 1999–2022, and in the 2024 time series of their possible drivers (i.e., river discharge, sea surface temperature, nutrient concentration) and impacts (i.e., net primary production).
On the other hand, a monthly timescale is used to assess differences between the climatology and 2024 conditions for river discharges and ecosystem variables other than chlorophyll. This choice reflects the fact that the physical and biogeochemical reanalyses (i.e., Products 6 and 2, respectively) were driven by monthly climatological datasets for river discharges and nutrient inputs. To mitigate potential systematic biases introduced by the use of climatological forcing in reanalyses, a bias correction was applied based on the overlapping period (2023–2024) between reanalyses and corresponding NRT datasets (not shown).
To quantify the anomaly of 2024 chlorophyll with respect to the 1999–2022 climatology: (i) we identified the time periods in which 2024 weekly chlorophyll values were above the climatology; (ii) we quantified the anomaly in each period as the weekly mean difference between 2024 values and the climatological ones. In particular, we expressed the anomaly as a percentage, computed as the difference between the cumulative 2024 values and the climatological values, normalized by the corresponding climatological values:
3.1 Anomaly of the 2024 events
Figure 3 shows the weekly time series of CMS Med OCTAC L3 satellite chlorophyll (Fig. 3a) and Med-MFC model surface chlorophyll (Fig. 3b) as values spatially averaged in the NAS ROFI area (box in Fig. 2) in 1999–2022, as the reference period for the climatology, and the corresponding weekly time series in 2024 compared with the weekly climatology (Fig. 3c, d).
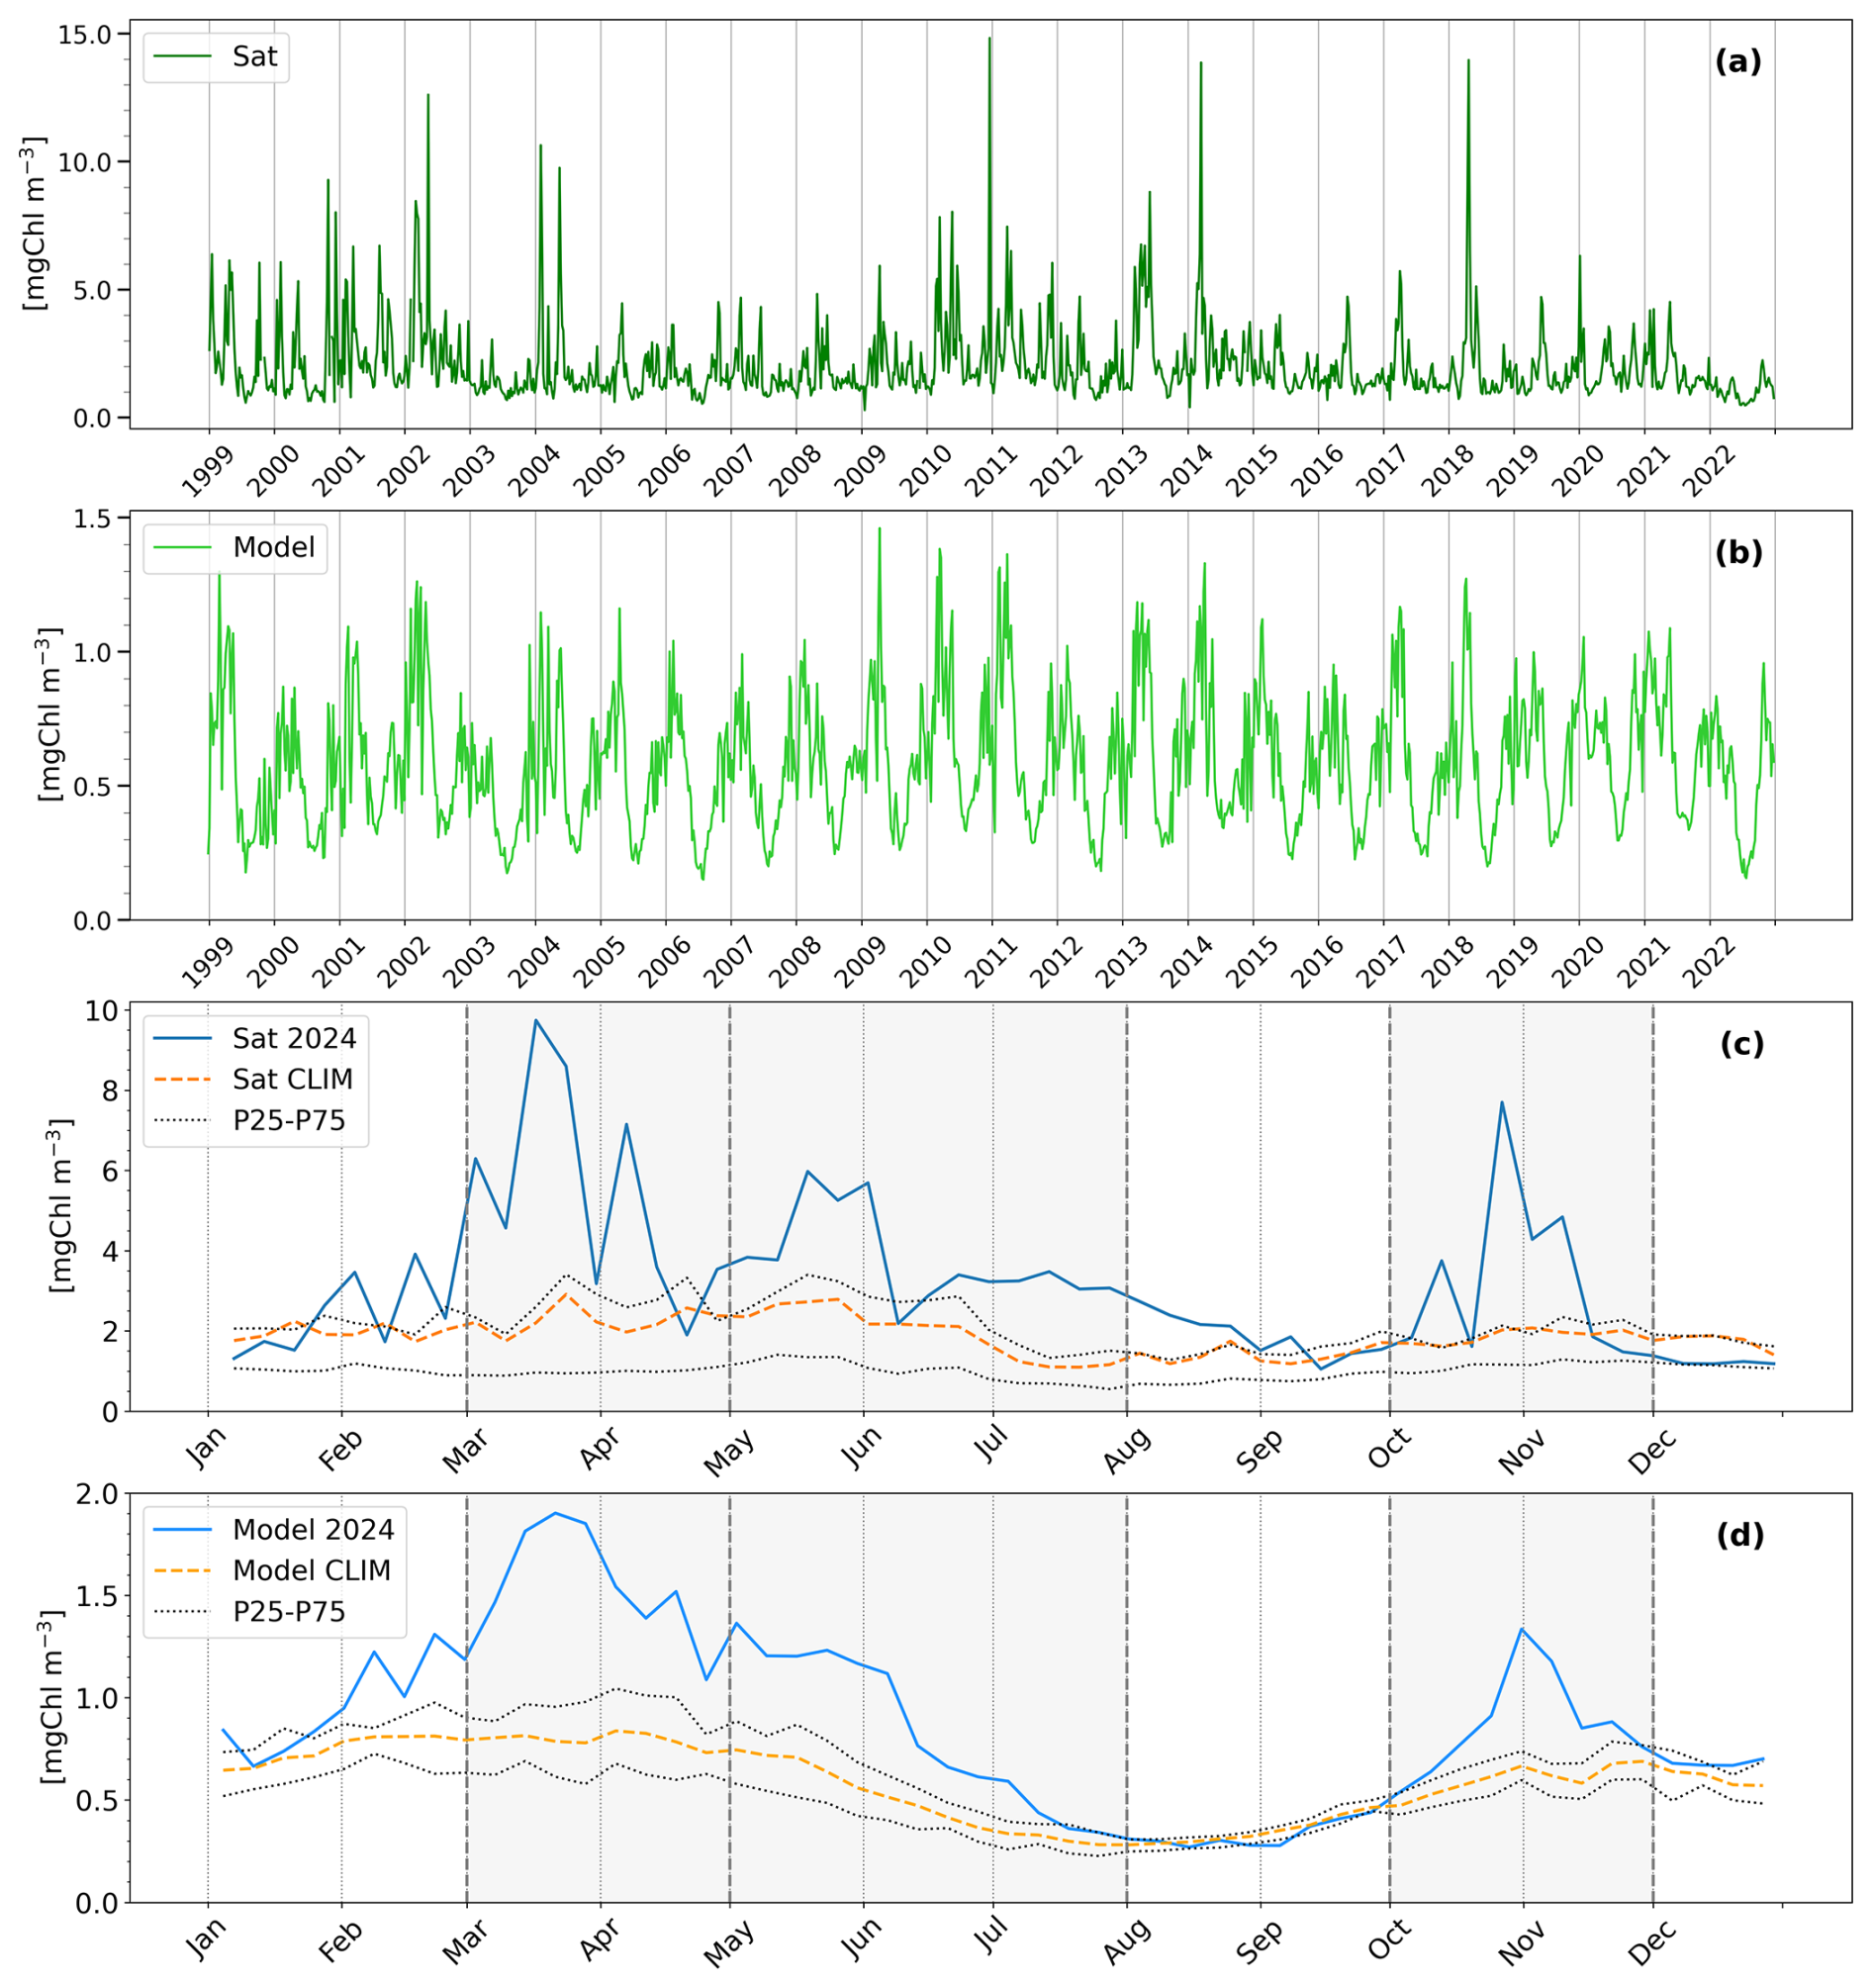
Figure 3Weekly time series as spatial averages in the NAS box (defined in Fig. 2) for: Copernicus Marine Service Med OCTAC L3 satellite chlorophyll (Product 4) and Med-MFC model chlorophyll at surface (Product 2) in 1999–2022 (a and b, respectively), and in 2024 (Products 3 and 1, c, d). Dotted lines in panels (c) and (d) indicate the 1999–2022 weekly mean as the reference climatology (orange line), plus weekly 25th and 75th percentile (black lines). Time periods of interest (i.e., March–April, May–July, October–November) are also indicated as shaded areas between vertical gray dotted lines.
We identified March–April, May–July, and October–November months as prolonged time periods of chlorophyll values above the climatology both for the satellite and for the model.
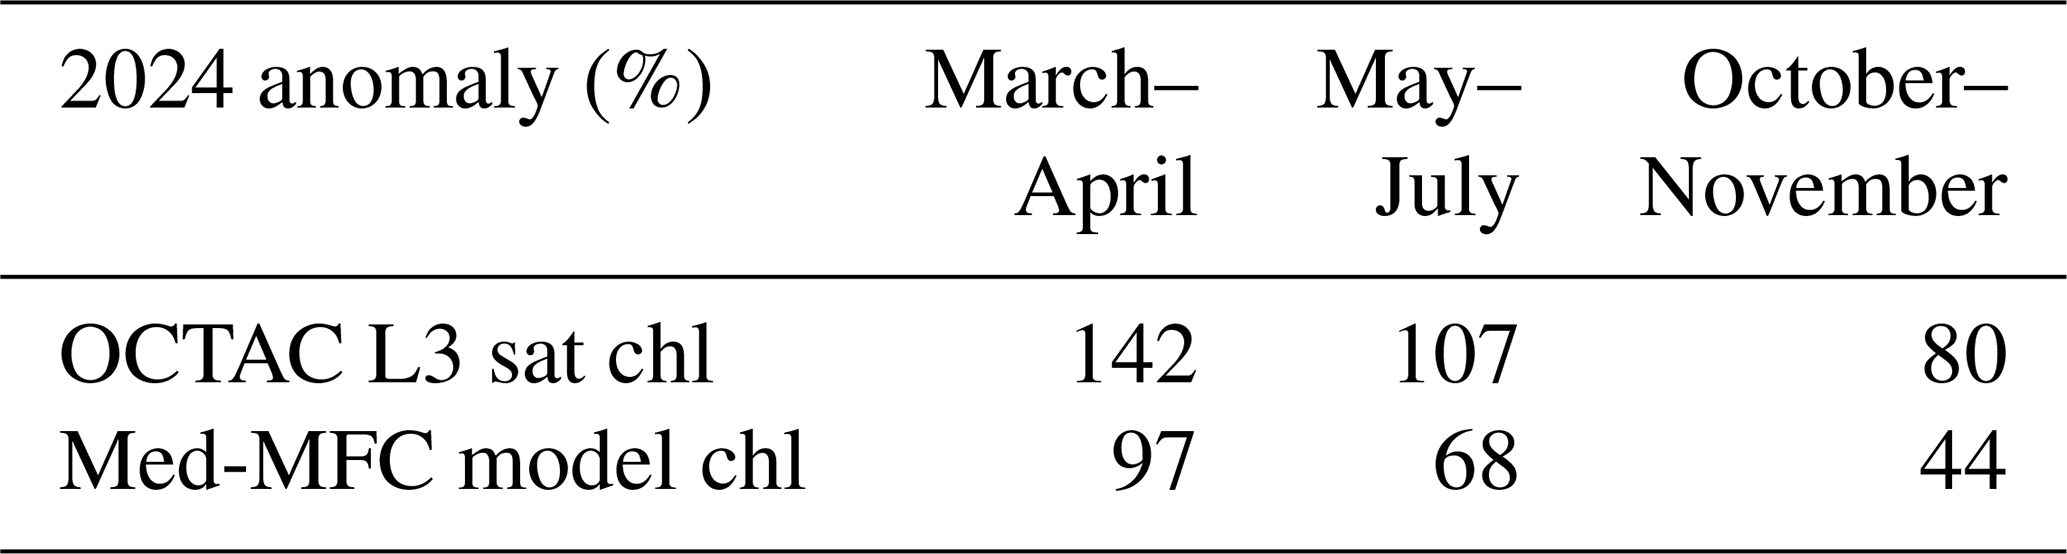
Despite biases in the absolute values of the chlorophyll time series from the model compared to satellite observations, which are discussed in Sect. 4, the model is consistent with observations in predicting the periods of the highest river discharges (Fig. 1b) in correspondence with the highest chlorophyll anomalies (Figs. 3c, d, respectively). In fact, we estimated that the highest chlorophyll anomaly in 2024, computed as the mean difference with the 1999–2022 climatology within each period, was in early spring (i.e., March–April months), when the anomaly is equal or higher than 100 % both for OCTAC satellite and for model (Table 2). In late spring-early summer (i.e., May–July) and in autumn (i.e., October–November) the anomaly values were progressively lower, and approximately equal to 100 % for OCTAC satellite and 70 % for modelled chlorophyll in the first case and 80 % and 45 %, respectively, in the second case.
Table 22024 anomaly of chlorophyll from CMS Med OCTAC satellite (Product 3) and Med-MFC model (Product 1), as estimates of percentage increase with respect to the 1999–2022 climatology, in early spring, late spring–early summer and autumn.
3.2 Analysis on ecosystem functioning during 2024 events
Figure 4 shows the time series of selected forcings that potentially contributed to the 2024 anomalously high chlorophyll events, i.e., Po river discharges according to the EFAS v5 system (Fig. 4a), and CMS modelled sea surface temperature (Fig. 4b) and surface phosphate (Fig. 4c) spatially averaged in the NAS ROFI area (box in Fig. 2). Additional information on the ecosystem status (i.e., vertical stratification of the water column, nitrate concentration, zooplankton grazing and water turbidity) is reported in Fig. A3, in the Appendix.
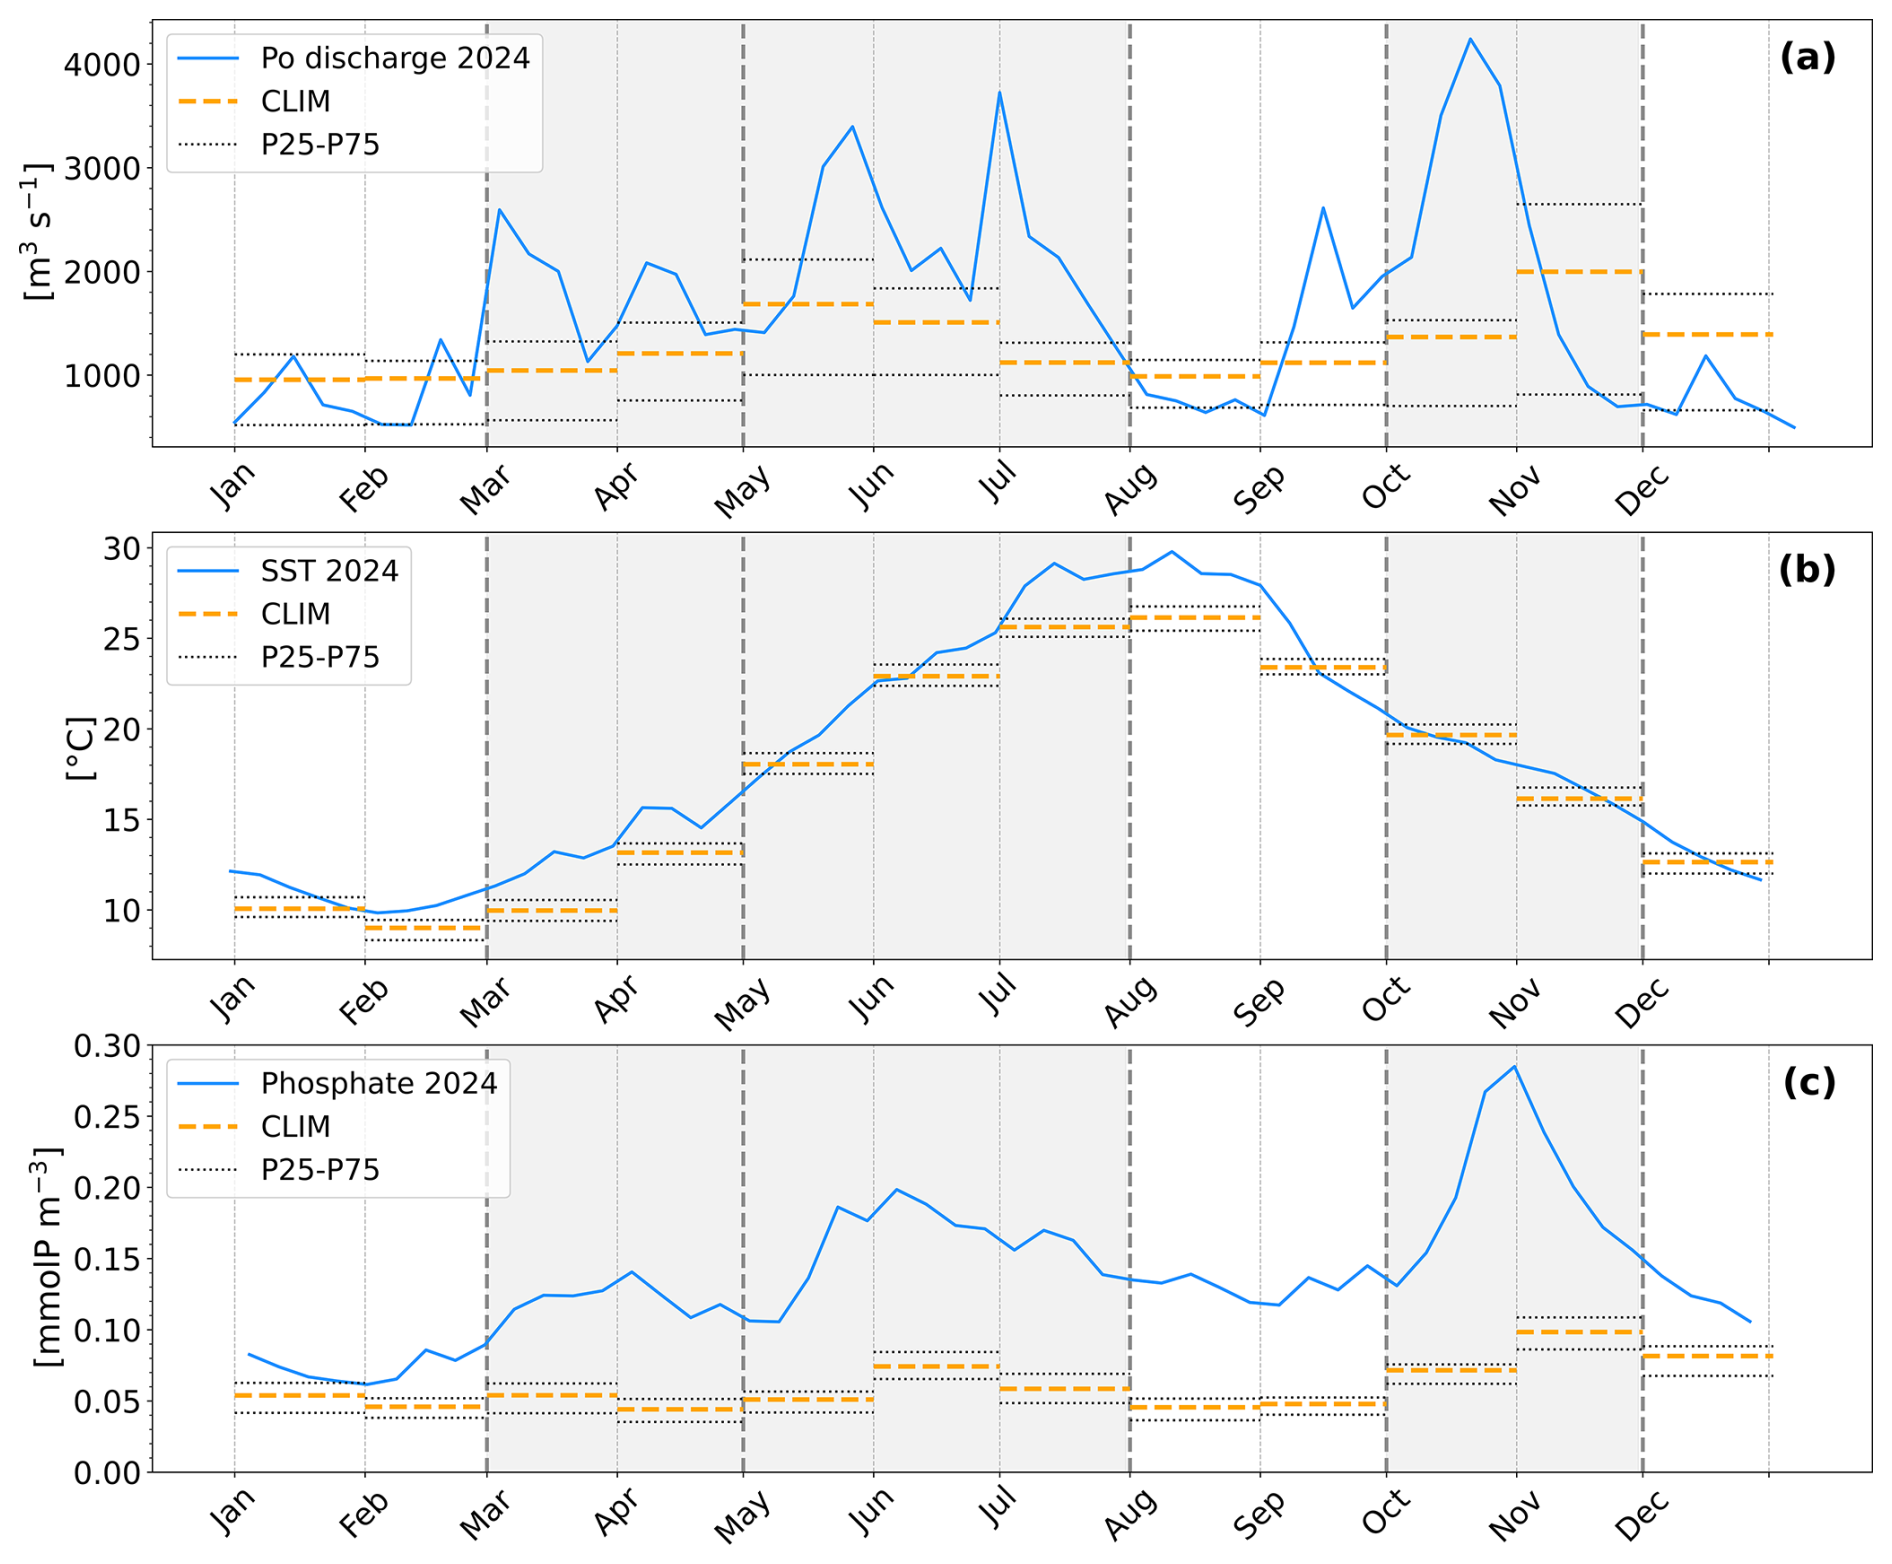
Figure 42024 weekly time series (blue lines) and 1999–2022 climatology (dotted lines, orange for monthly mean, black for 25th and 75th percentile) of modelled variables: (a) Po river discharges at Pontelagoscuro (Product 8), and (b) sea surface temperature (Products 5 and 6, respectively) and (c) surface phosphate concentration (Products 1 and 2), spatially averaged in NAS box (Fig. 2). Phosphate climatology included the bias-correction illustrated in Sect. 2.2. Time periods of interest (March–April, May–July, October–November) are indicated as shaded areas between vertical gray dotted lines.
As mentioned in Sect. 2.1, EFAS v5 river discharges (Fig. 4a) show higher-than-climatology values in the periods selected as the months with high chlorophyll values (i.e., March–April, May–July, October–November). The discharges in the first two and the last months of 2024 appear instead quite in line with climatological values.
A January–February positive anomaly in sea surface temperature (Fig. 4b), connected with low values of mixed layer depth, occurred earlier than usual (Fig. A3a in the Appendix), represents a preconditioning factor of stratification in the area. During the same period, an enrichment in phosphate (the limiting nutrient in the area) was observed (Fig. 4c), whereas nitrate remained closer to climatological values (Fig. A3b). In early spring, the additional supply of phosphate (Fig. 4c) and the increasing temperatures (temperature in the range 11–16 °C, i.e., 2–3 °C above the climatology; Fig. 4b), likely further enhanced by concurrent surface turbidity (Fig. A3d in the Appendix), promoted the large increase in chlorophyll shown in Fig. 3c, d.
The further nutrient input associated with the Po river discharges in May and June drove instead a lower increase in chlorophyll both in model and satellite data.We attribute it to enhanced grazing pressure (as reported in Fig. A3c, in the Appendix) or higher carbon-to-chlorophyll ratio due to photoacclimation (since the photosynthetically active radiation is maximum in June–July period, e.g., Lazzari et al., 2021).
Residual phosphate remained above the climatology in August, and it increased again after the occurrence of higher discharges in September and, above all, the maximum flow in October, when the autumn peak of chlorophyll is observed (Fig. 3c, d). Since the marine ecosystem becomes light-limited in autumn, we identify this feature as the main responsible for the relatively low values of chlorophyll in its autumn peak with respect to the very high values of nutrient concentration in the same period. The phosphate not used is then transported out of the NAS box along the coast (Fig. A2b, d in Appendix) and the marine ecosystem progressively converges toward the baseline climatological winter conditions.
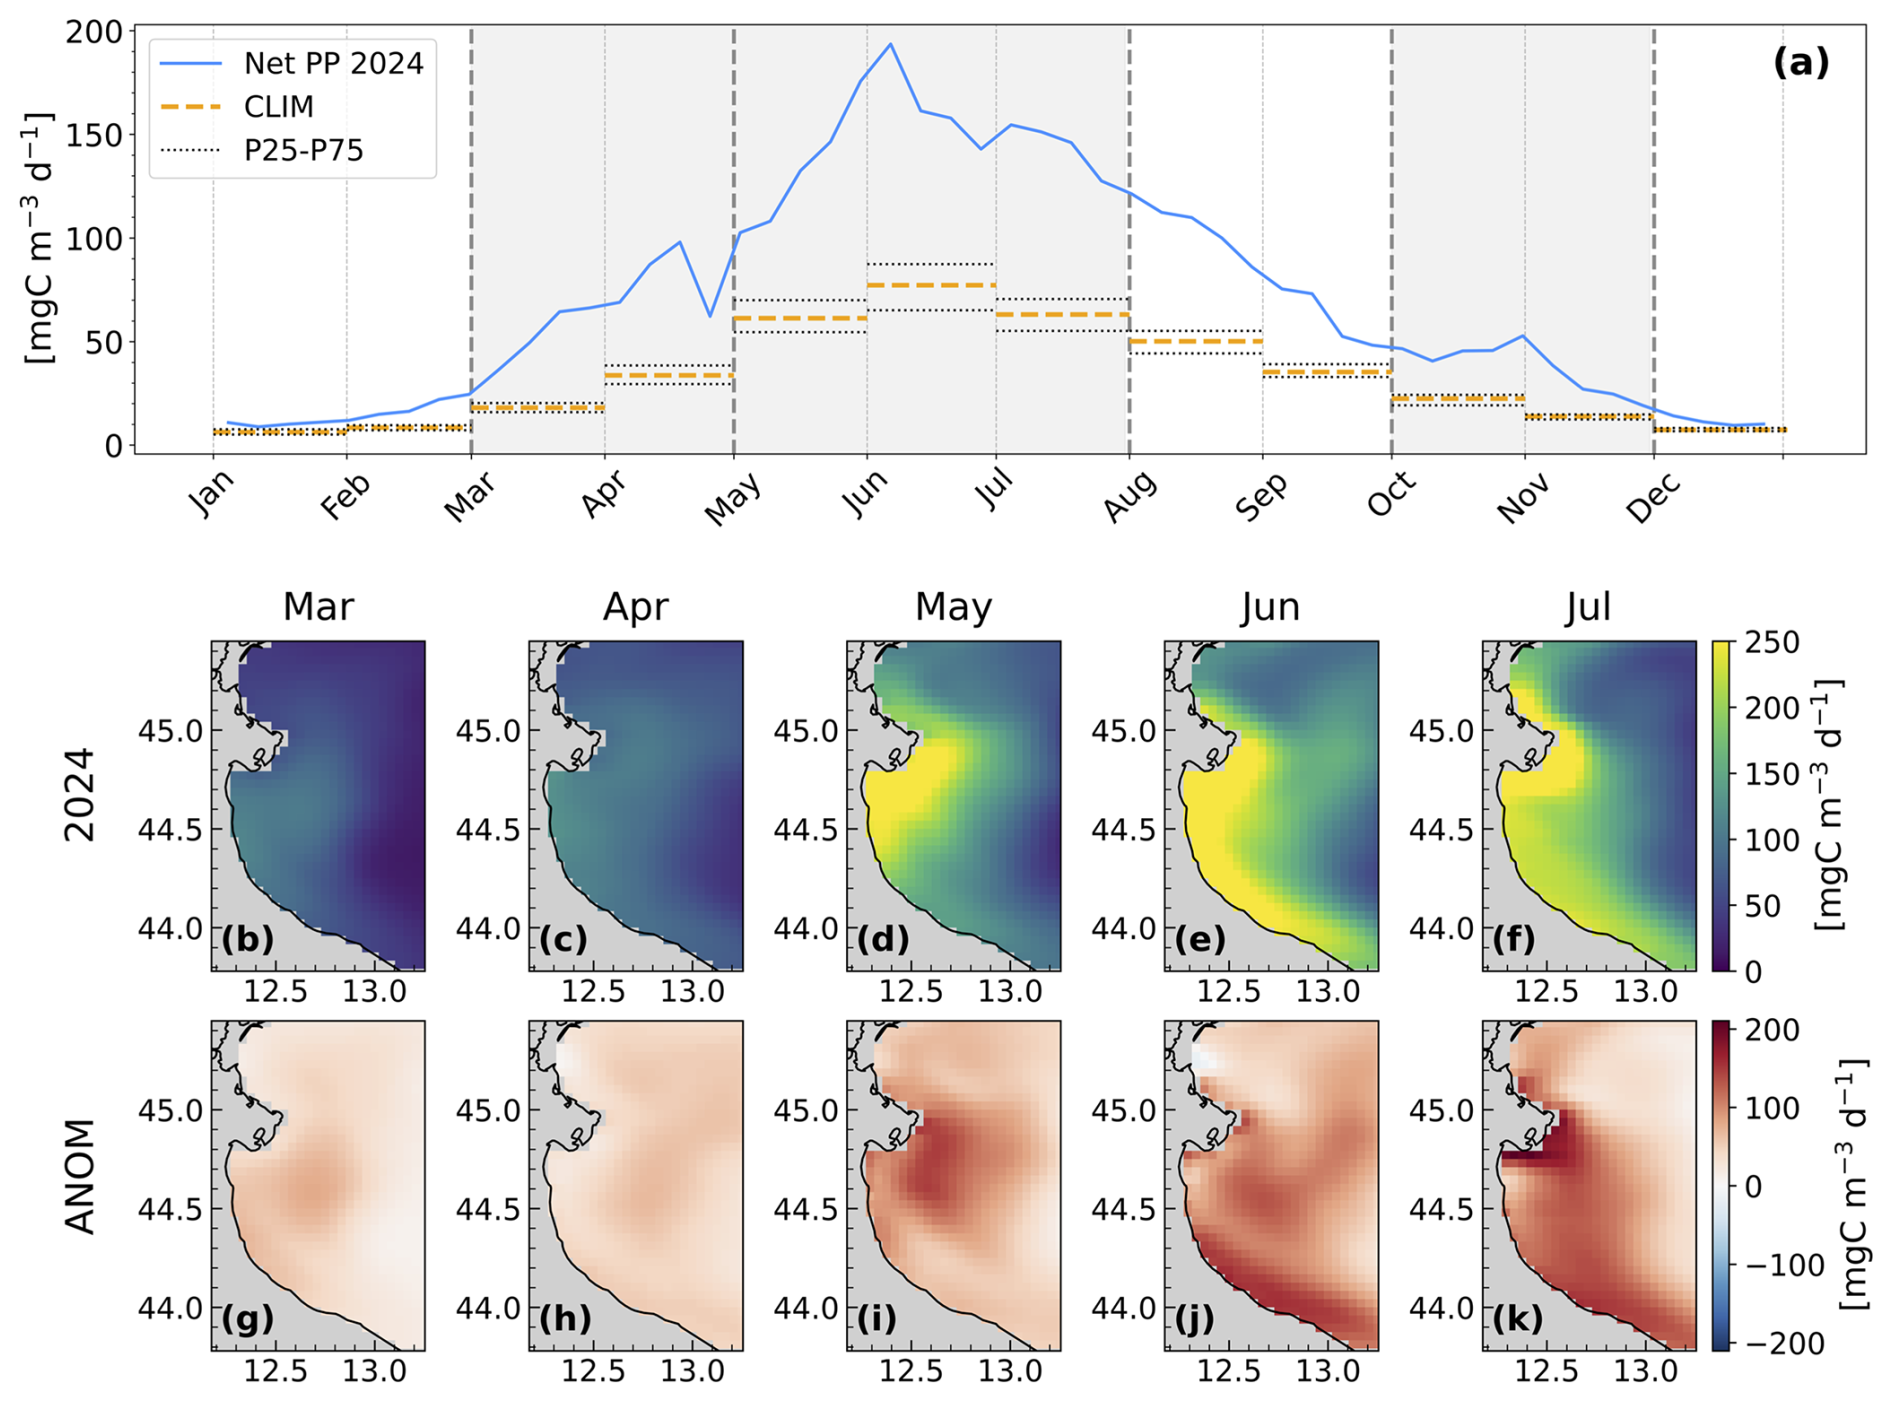
Figure 5CMS modelled surface net primary production in the NAS box (Fig. 2) as: (a) spatially averaged weekly time series in 2024 (blue line, Product 1) compared with 1999–2022 monthly bias-corrected climatology (Product 2) (orange dotted line for the mean, black for 25th and 75th percentile); monthly mean maps between March and July (b–f) and corresponding monthly anomalies according to the 1999–2022 bias-corrected climatology (Product 2) (g–k).
In 2024, the surface net primary production, as an indicator for eutrophication impacts on the marine ecosystem, is always above the monthly climatology (Fig. 5a), especially in early summer, in association with the repeated Po river discharges and the high temperatures. The monthly mean maps for 2024 show that the increase was initially localised southward of the Po river mouths (indicated in Fig. 2b) in March (Fig. 5b, g), and subsequently expanded to a broader area, intensifying further during April and May months (Fig. 5c–d, h–i). We ascribe the decreasing values in June to the southward transport along the coast (Fig. 5e, j). Finally, the effect of the late June–July Po river discharges, along with the high temperatures (2–3 °C above the climatology), is a further increase of net primary production near the Po river mouths.
The analysis carried out so far highlighted that both chlorophyll patterns displayed by CMS satellite and model system (Fig. 2a, b), as well as modelled net primary production maps and anomalies (Fig. 5b–k) in the NAS area display strong coastal-offshore gradients and fronts, down to mesoscale (i.e., O(10 km) in the NAS area).
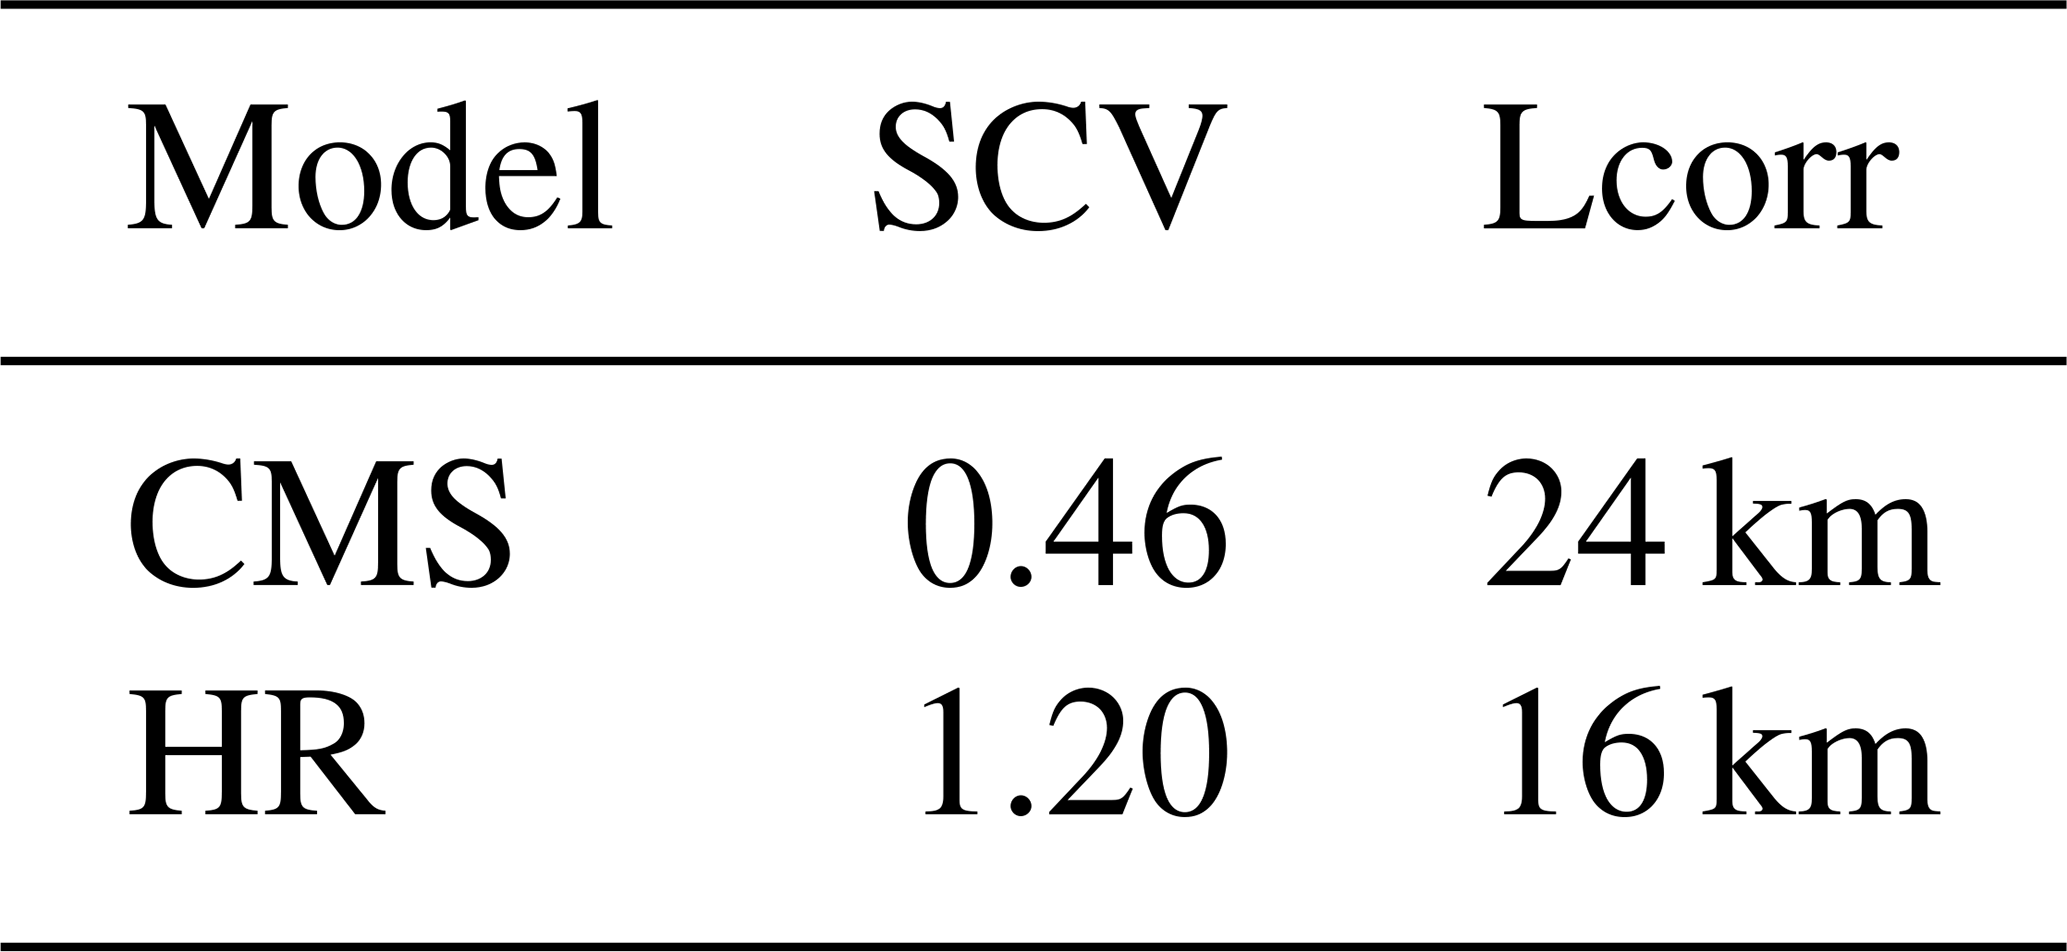
To better quantify the spatial variability of coastal processes and Po river plume we benefitted from the novel HR model system developed for Italian seas like the Adriatic Sea, with horizontal resolution of 500 m (Product 9), and used the chlorophyll maps within the box in Fig. 2b, c as a representative example of simulated patterns. The Po river plume extension toward the Istrian coast actually appears simulated more in detail by the HR model (Fig. 2c), as well as the coastal belt of high chlorophyll along the WAC. Indeed, the HR simulation captures horizontal variability at approximately twice the spatial detail of CMS, as quantified by the squared coefficient of variation and the characteristic correlation length scale (Table 3).
Table 3Statistics of spatial variability (SCV) and spatial scale (Lcorr) of the chlorophyll patterns of the two models CMS and HR (Fig. 2b, c, respectively). SCV is the squared coefficient of variation (i.e., the ratio between the spatial variance and the spatial squared mean), and LCorr is the correlation length of the patterns.
The present study investigated the anomalously high values of surface phytoplankton chlorophyll observed in the NAS in 2024, as a possible indicator of eutrophication state, benefitting from state-of-the-art modeling and observational CMS products on the Mediterranean Sea and a novel HR coastal model system (Fig. 2), with a particular focus on Po river discharges as the main driver of these anomalies (Figs. 1 and 4a).
On the long-term timescale, positive correlations between a negative trend in Po river outflow and a negative chlorophyll trend have been reported in the literature (e.g., Vona et al., 2025). On the other hand, our study aims to quantify the connection between anomalous chlorophyll events and anomalies in Po river discharge, as well as other environmental drivers, on a high-frequency timescale (e.g., weekly) relevant to phytoplankton processes. In this perspective, the newly added feature of daily river discharges from CEMS EFASv5 model system implemented in the latest releases of CMS Med-MFC products constitutes an essential requirement to simulate coastal dynamics at high temporal frequency. It is worth specifying that we based our analysis on the weekly scale, to avoid possibly flawed interpretations of the results due to the weekly assimilation of satellite chlorophyll. Another potential source of uncertainties in our estimations is related to the use of modelled Po river discharges instead of observations. In fact, the EFAS discharge time series at the Pontelagoscuro station displays good overall agreement with the observed series in terms of both magnitude and timing of discharge peaks (Fig. A1), despite an underestimation of the mean annual flow (mean discharge is approximately 10 % lower than observed) and of early spring peaks (EFAS values are about 25 % lower than observed).
Within our modeling framework, we estimated and quantified 2024 anomalies in surface chlorophyll in early spring, early summer and autumn months, with decreasing values across the three periods (i.e., from 100 % to 45 % chlorophyll anomaly), coherently with anomalies estimated from satellite. However, these latter ones show higher percentages (from 140 % to 80 %). While the CMS model is very consistent with satellite in terms of temporal evolution (Fig. 3), the biases in terms of absolute values are due to limitation in the assimilation procedure of very high values of chlorophyll (i.e., values higher than 3 standard deviations from climatological values are not assimilated; Teruzzi et al., 2021) and by potential limitation of the BFM model, whose 4 phytoplankton groups have been optimized to simulate trophic open sea conditions across the Mediterranean Sea (Salon et al., 2019), to reproduce very high values of specific phytoplankton groups which can occur only in coastal areas near the major rivers. On the other hand, satellite observations potentially exhibit high uncertainties according to values of the quality index which are higher than 3 in large areas in the daily maps of the events (not shown).
We actually interpreted the anomalies in chlorophyll values in light of the anomalies in Po discharge (Fig. 4a) values, and to the associated nutrient loads, represented by the concentrations of CMS modelled phosphate as the limiting nutrient in the Mediterranean Sea and in the NAS (Fig. 4c). Moreover, the high levels of phosphate with respect to climatology (Fig. 4c), as well as the high temperatures (Fig. 4b) and an earlier-than usual and strong vertical stratification (Fig. A3 in the Appendix), already present in January and February 2024, further enhanced the spring peaks of chlorophyll. On the other hand, lower levels of light naturally present in autumn prevented high chlorophyll peaks, despite huge amounts of phosphate supplied by the Po river flood at the end of October, whose residual amount was transported southward from the coastal Western Adriatic Current (WAC).
We propose the use of net primary production as an indicator to assess potential disfunctioning of the coastal marine ecosystem in terms of accumulation of organic matter. Even if a detailed analysis is out of the scope of the present publication due to length constraints, the particulate organic matter produced during intense positive anomalies of net primary production with respect to the climatology, especially in early summer (Fig. 5), is either transported alongshore or settles on the seabed and undergoes remineralization. This process leads to oxygen depletion in the subsequent period. The model reproduces a northward evolution of the spatial extent of the impacted area (Fig. A4, in the Appendix), although simulated oxygen concentrations remain above the hypoxia levels observed during the 1980s and 1990s (e.g., Djakovac et al., 2015). Additionally, potential impacts on the marine ecosystem that extend beyond organic matter accumulation and associated oxygen consumption (e.g., effects on higher trophic levels and fisheries) should also be carefully assessed in future studies.
Although the CMS model has not been designed to simulate all the processes and substances associated with the formation and accumulation of mucilage aggregates observed in the NAS during summer 2024, our findings on marine ecosystem functioning are in agreement with Vilibić et al. (2025). They highlighted, in particular, the importance of the intense vertical stratification that started in February 2024 (also shown in Fig. A3, in the Appendix) as a potential preconditioning factor for mucilage events, further enhanced by high and repeated Po river discharges and elevated temperatures (2–3 °C above climatology, according to our estimates).
In the perspective of climate change, we indeed could expect a decrease in the Mediterranean river discharges in the late spring and early summer, due to a decrease in snowfall driven by increasing temperatures (as already observed, e.g., by Bozzoli et al., 2024), and an enhanced dependence on precipitations, especially on the short-term heavy ones (as also noticed by Cavallini et al., 2024). Po river might thus exhibit a different hydrological regime in the future, oscillating between extremely dry conditions (possibly further exacerbated by the increasing water withdrawals for irrigation; Montanari et al., 2023) and episodic extreme precipitation events (Zittis et al., 2021; Tojčić et al., 2024) with anomalous impacts in the coastal dynamics as described in the present paper and that might represent a threat for the marine coastal organisms resilience (Hassoun et al., 2025).
In presence of rapidly changing meteo-hydrological conditions (e.g. huge Po river discharge in October 2024), coastal forecasting systems able to provide near-real-time and reliable information on eutrophication-related ecosystem variables can be powerful resources for early warning alerts dedicated to the coastal environmental management and socioeconomic stakeholders (e.g. aquaculture farmers) and tools for assessing impact on ecosystem functioning. In particular, high spatial characterization of offshore-coastal gradients and frontal structures is a fundamental aspect to set-up prevention and containment measures. The novel Italian operational model, which can be considered a natural extension of the operational CMS Med-MFC system, featuring EFAS v5 river discharges as boundary conditions, has demonstrated the ability to reproduce finer spatial structures associated with the Po river plume and has the potential to provide a more accurate representation of coastal dynamics related to eutrophication.
The appendix includes selected additional figures supporting the discussion of the model results. In particular: the comparison between EFAS and observations for Po river discharges (Fig. A1), 2024 anomalies with respect to the long-term mean for other key environmental variables (Figs. A2 and A3) and the time evolution of oxygen depletion at 30 m depth in the area during the summer period (Fig. A4).
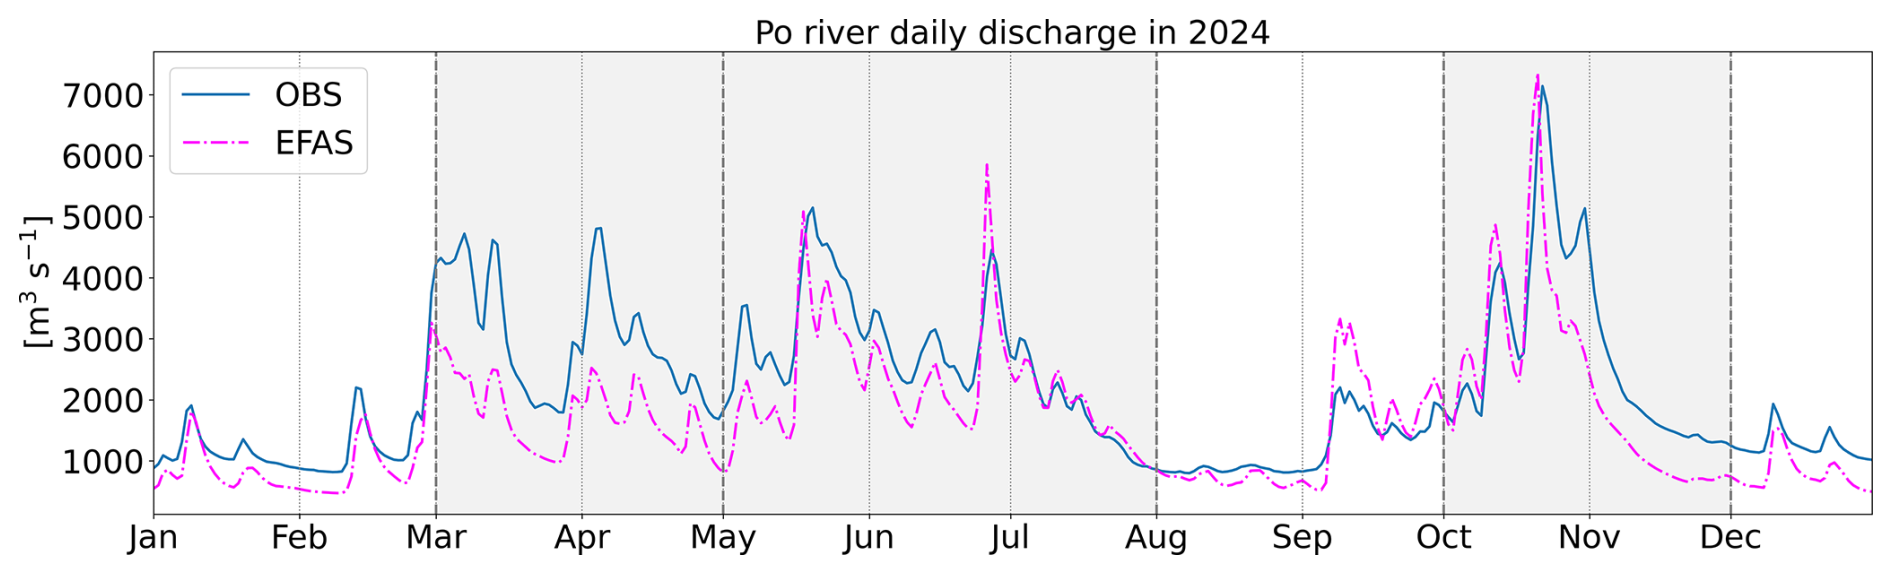
Figure A1Daily time series of Po river discharge in Pontelagoscuro station in 2024, according to observations (blue line, Product 7) and to Copernicus Emergency Management Systems (CEMS) EFAS v5 data (magenta dotted line, Product 8).
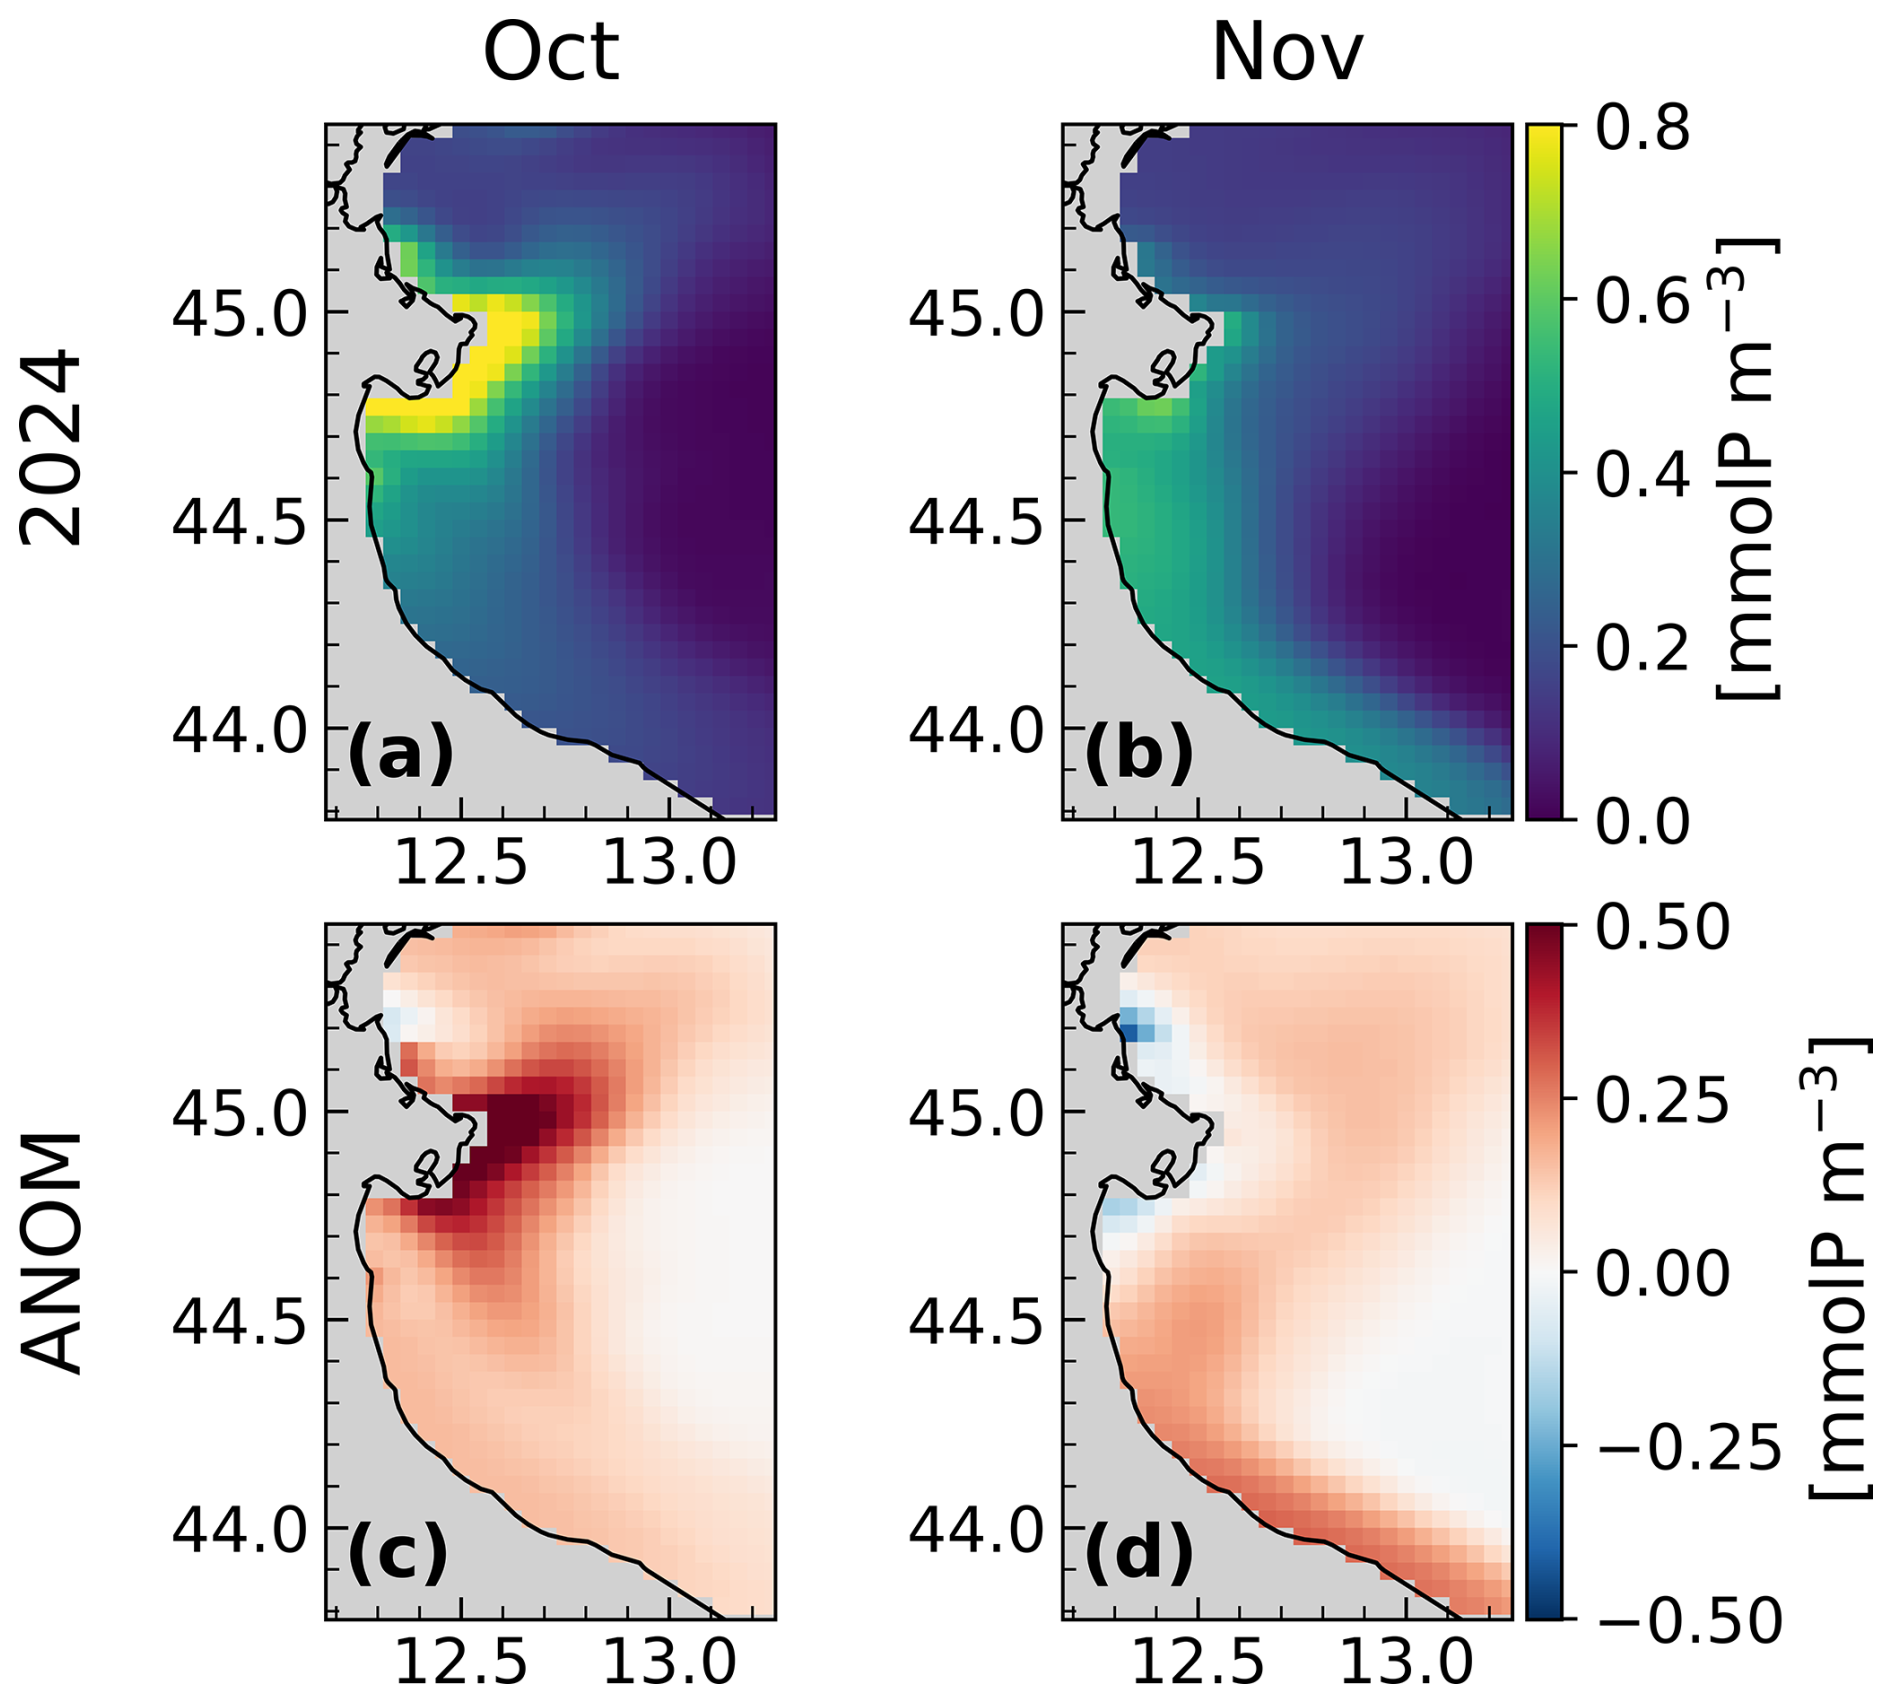
Figure A2Monthly maps of CMS modelled surface phosphate concentration (Product 1) in 2024 in October (a) and November (b) and corresponding anomalies with respect to the 1999–2022 bias-corrected climatology (Product 2) (c and d, respectively).
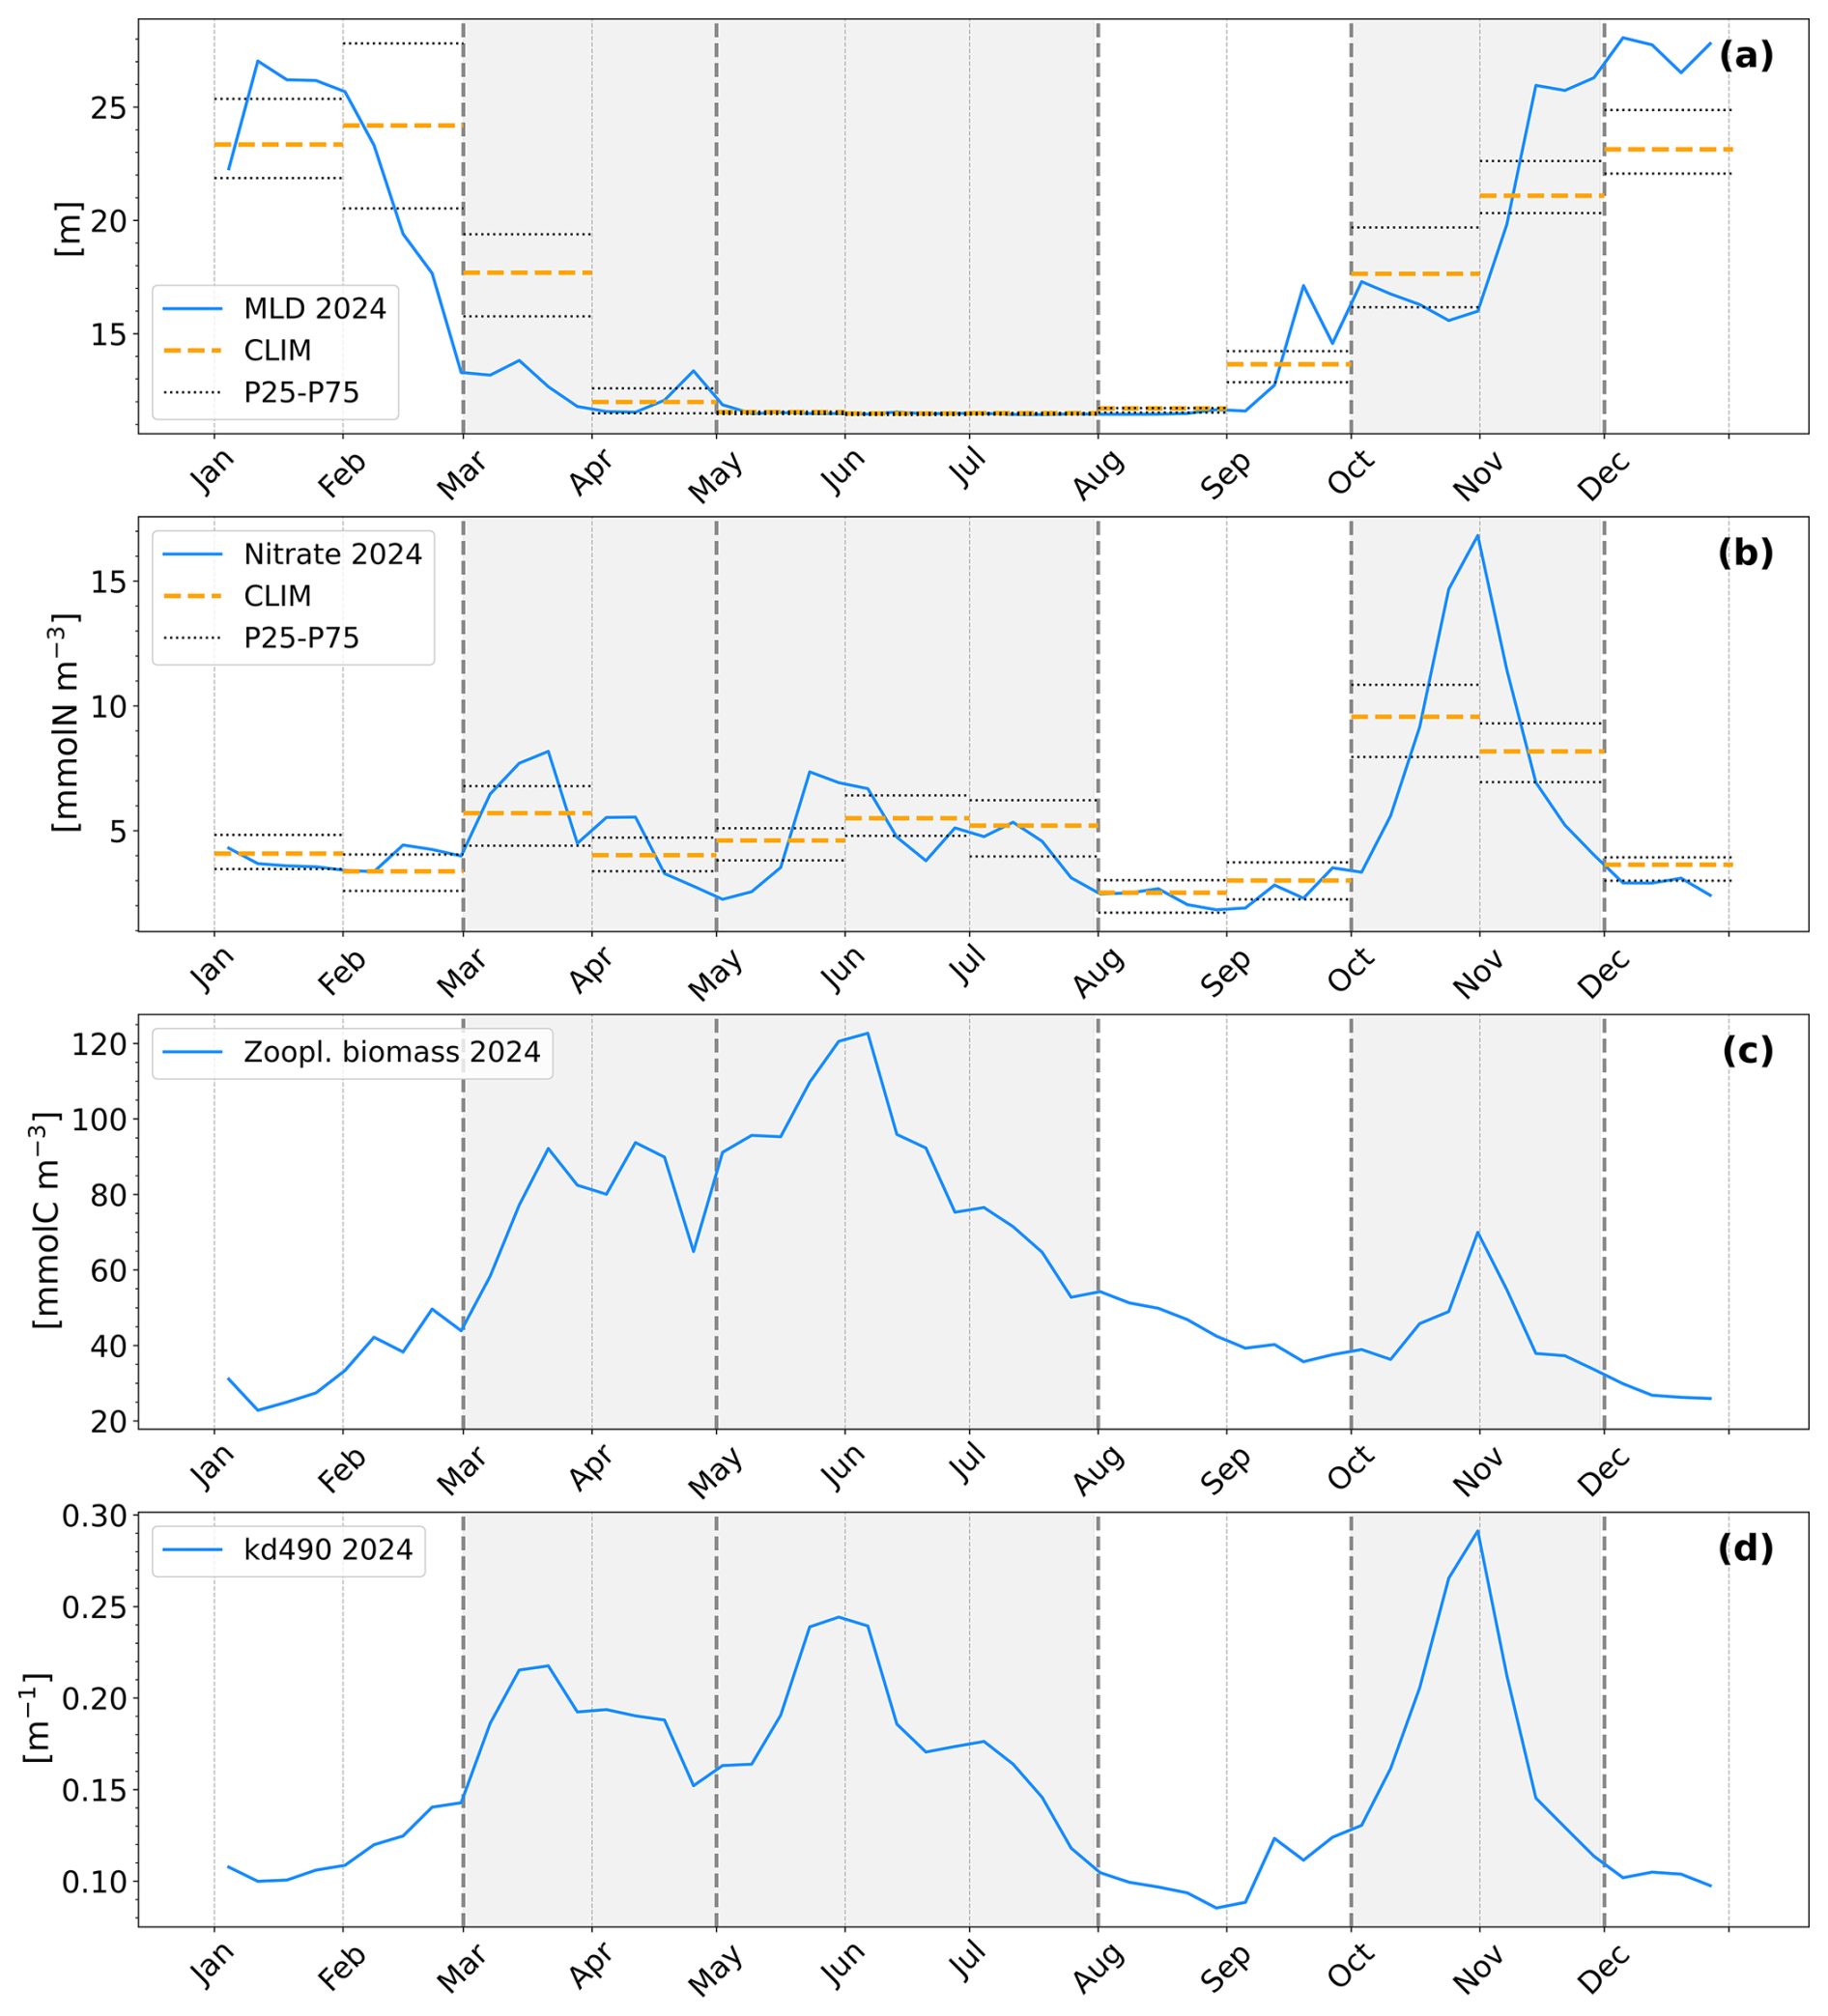
Figure A32024 weekly time series (blue lines) and 1999–2022 climatology (dotted lines, orange for monthly mean, black for 25th and 75th percentile) of modelled variables: (a) mixed layer depth (Products 5 and 6, respectively), (b) nitrate concentration at surface (Products 1 and 2, respectively), (c) zooplankton carbon biomass at surface (Product 1), and diffuse attenuation coefficient of the downwelling irradiance at 490 nm (Product 1), spatially averaged in NAS box (Fig. 2). Nitrate climatology included the bias-correction illustrated in Sect. 2.2. Time periods of interest (March–April, May–July, October–November) are indicated as shaded areas between vertical gray dotted lines.
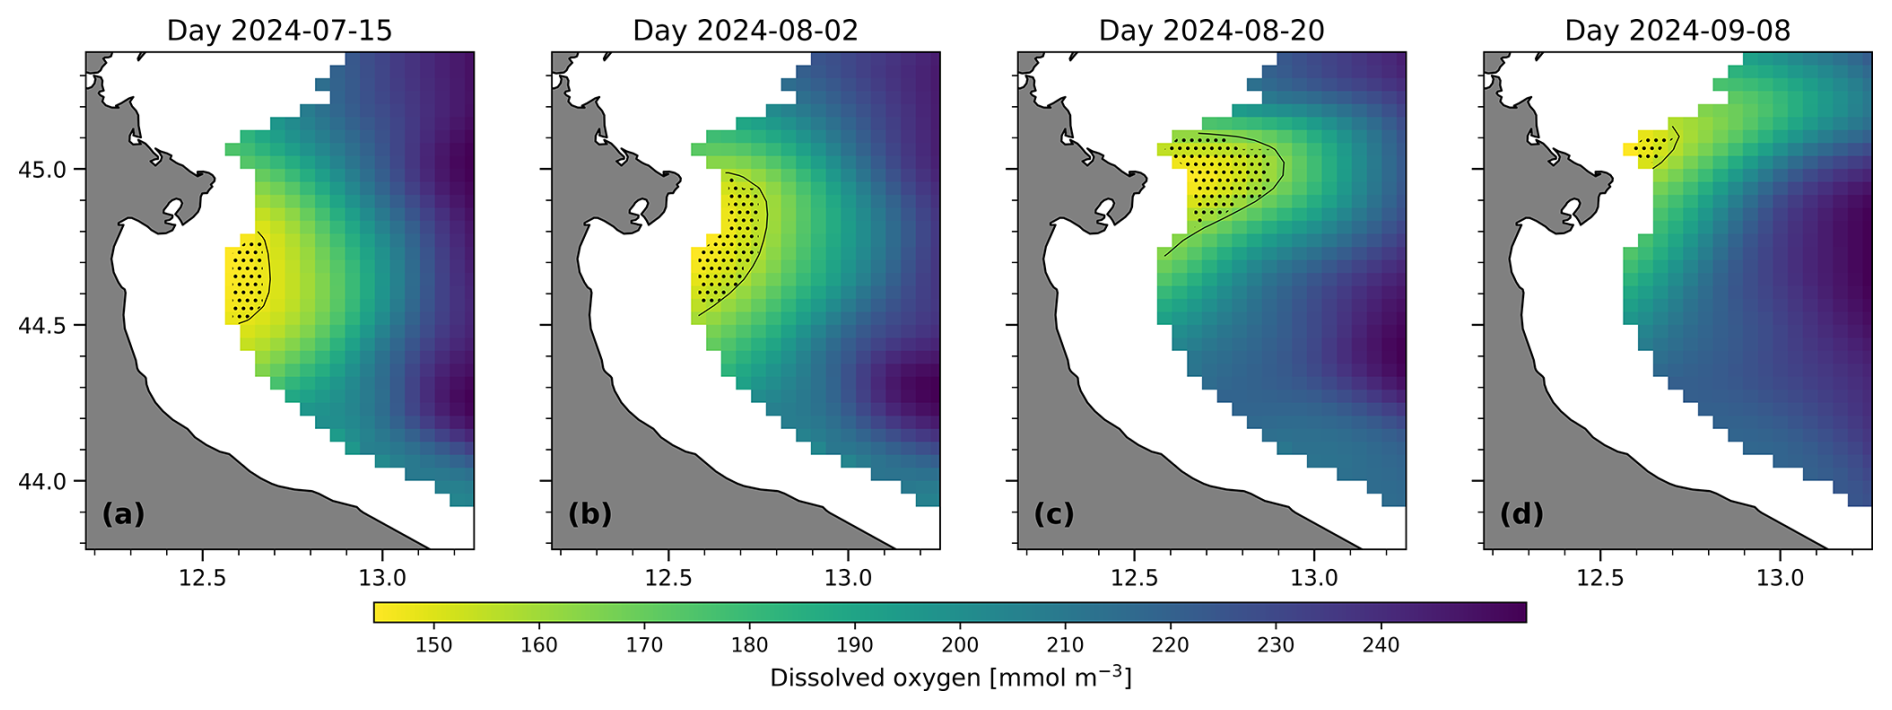
Figure A4Selected daily maps of dissolved oxygen concentration at 30 m depth in the period July–September 2024; shaded areas refer to values lower than the precautionary threshold of 5 mg L−1 (i.e. 156 mmol m−3) for oxygen depletion identification (Vaquer-Sunyer and Duarte, 2008). Data from Med-MFC Analysis and Forecast Biogeochemistry (Product 1).
Products 1–8 are publicly available datasets and can be found by following the references indicated in the Table 1 of the manuscript. Product 9 is available upon request.
VDB and GC conceived the idea. GB, SP, SS and SQ performed the simulations. LF and CA validated the simulations. VDB conducted the formal analysis. GC and SQ supervised the work. VDB and GC wrote the first draft, with contributions from all co-authors. All the authors discussed and reviewed the submitted manuscript.
The contact author has declared that none of the authors has any competing interests.
The Copernicus Marine Service offering is regularly updated to ensure it remains at the forefront of user requirements. In this process, some products may undergo replacement or renaming, leading to the removal of certain product IDs from the catalogue. If readers have any questions or require assistance regarding these modifications, please feel free to reach out to the Copernicus Marine Service user support team for further guidance. They will be able to provide the necessary information to address concerns and find suitable alternatives.
The European Commission is not responsible for any use that may be made of the Copernicus information or data it contains.
Publisher's note: Copernicus Publications remains neutral with regard to jurisdictional claims made in the text, published maps, institutional affiliations, or any other geographical representation in this paper. The authors bear the ultimate responsibility for providing appropriate place names. Views expressed in the text are those of the authors and do not necessarily reflect the views of the publisher.
This study has been conducted using EU Copernicus Marine Service Information. It has been also generated using Copernicus Emergency Management Service information [2024]. During the preparation of this manuscript, the authors used GPT-4o to check text grammar and spelling. Then, the authors reviewed and edited the content as needed and take full responsibility for the publication content.
This study has been partly funded by the Mediterranean Copernicus Monitoring and Forecast Center (Reference: 24252L05-COP-MFC MED-5500 issued by Mercator Ocean) within the framework of Marine Copernicus Service. Activities developed in the framework of Actions B32-B35 of the MER (Marine Ecosystem Restoration) project, funded by the NextGenerationEU program (Italian National Recovery and Resilience Plan, investment M2C4 – I3.5).
This paper was edited by Marilaure Grégoire and reviewed by two anonymous referees.
ARPAE SIMC – DEXT3R: ARPAE SIMC – DEXT3R User Guide (version 0.95), https://simc.arpae.it/dext3r/doc/GuidaDext3r.html, last access: 25 July 2025.
Bozzoli, M., Crespi, A., Matiu, M., Majone, B., Giovannini, L., Zardi, D., Brugnara, Y., Bozzo, A., Berro, D. C., Mercalli, L., and Bertoldi, G.: Long-term snowfall trends and variability in the Alps, Int. J. Climatol., 44, 4571–4591, https://doi.org/10.1002/joc.8597, 2024.
Bruschi, A., Lisi, I., De Angelis, R., Querin, S., Cossarini, G., Di Biagio, V., Salon, S., Solidoro, C., Fassina, D., Ancona, S., and Silvestri, C.: Indexes for the assessment of bacterial pollution in bathing waters from point sources: The northern Adriatic Sea CADEAU service, J. Environ. Manage., 293, 112878, https://doi.org/10.1016/j.jenvman.2021.112878, 2021.
Cavallini, E., Viaroli, P., Naldi, M., Saccò, M., Scibona, A., Barbieri, E., Franceschini, S., and Nizzoli, D.: Seasonal Variability and Hydrological Patterns Influence the Long-Term Trends of Nutrient Loads in the River Po, Water, 16, 2628, https://doi.org/10.3390/w16182628, 2024.
Colella, S., Böhm, E., Cesarini, C., Jutard, Q., and Brando, V. E.: EU Copernicus Marine Service Product User Manual for the Mediterranean Sea, Bio-Geo-Chemical, L3, daily Satellite Observations (Near Real Time), OCEANCOLOUR_MED_BGC_L3_NRT_009_141, Issue 5.0, Mercator Ocean International, https://documentation.marine.copernicus.eu/PUM/CMEMS-OC-PUM.pdf (last access: 25 July 2025), 2024a.
Colella, S., Böhm, E., Cesarini, C., Jutard, Q., and Brando, V. E.: EU Copernicus Marine Service Product User Manual for the Mediterranean Sea, Bio-Geo-Chemical, L3, daily Satellite Observations (1997–ongoing), OCEANCOLOUR_MED_BGC_L3_MY_009_143, Issue 5.0, Mercator Ocean International, https://documentation.marine.copernicus.eu/PUM/CMEMS-OC-PUM.pdf (last access: 25 July 2025), 2024b.
Colella, S., Brando, V. E., Di Cicco, A., D'Alimonte, D., Forneris, V., and Bracaglia, M.: EU Copernicus Marine Service Quality Information Document for the Mediterranean Sea, Bio-Geo-Chemical, L3, daily Satellite Observations (Near Real Time), OCEANCOLOUR_MED_BGC_L3_NRT_009_141, Issue 4.1, Mercator Ocean International, https://documentation.marine.copernicus.eu/QUID/CMEMS-OC-QUID-009-141to144-151to154.pdf (last access: 25 July 2025), 2025a.
Colella, S., Brando, V. E., Di Cicco, A., D'Alimonte, D., Forneris, V., and Bracaglia, M.: EU Copernicus Marine Service Quality Information Document for the Mediterranean Sea, Bio-Geo-Chemical, L3, daily Satellite Observations (1997-ongoing), OCEANCOLOUR_MED_BGC_L3_MY_009_143, Issue 4.1, Mercator Ocean International, https://documentation.marine.copernicus.eu/QUID/CMEMS-OC-QUID-009-141to144-151to154.pdf (last access: 25 July 2025), 2025b.
Copernicus Climate Change Service (C3S): European State of the Climate 2024, Copernicus Climate Change Service (C3S), https://doi.org/10.24381/14J9-S541, 2025.
Coppini, G., Clementi, E., Cossarini, G., Salon, S., Korres, G., Ravdas, M., Lecci, R., Pistoia, J., Goglio, A. C., Drudi, M., Grandi, A., Aydogdu, A., Escudier, R., Cipollone, A., Lyubartsev, V., Mariani, A., Cretì, S., Palermo, F., Scuro, M., Masina, S., Pinardi, N., Navarra, A., Delrosso, D., Teruzzi, A., Di Biagio, V., Bolzon, G., Feudale, L., Coidessa, G., Amadio, C., Brosich, A., Miró, A., Alvarez, E., Lazzari, P., Solidoro, C., Oikonomou, C., and Zacharioudaki, A.: The Mediterranean Forecasting System – Part 1: Evolution and performance, Ocean Sci., 19, 1483–1516, https://doi.org/10.5194/os-19-1483-2023, 2023.
Cossarini, G., Feudale, L., Teruzzi, A., Bolzon, G., Coidessa, G., Solidoro, C., Di Biagio, V., Amadio, C., Lazzari, P., Brosich, A., and Salon, S.: High-resolution reanalysis of the Mediterranean Sea biogeochemistry (1999–2019), Front. Mar. Sci., 8, 741486, https://doi.org/10.3389/fmars.2021.741486, 2021.
Cozzi, S. and Giani, M.: River water and nutrient discharges in the Northern Adriatic Sea: Current importance and long term changes, Cont. Shelf Res., 31, 1881–1893, https://doi.org/10.1016/j.csr.2011.08.010, 2011.
Cozzi, S., Ivančić, I., Catalano, G., Djakovac, T., and Degobbis, D.: Dynamics of the oceanographic properties during mucilage appearance in the Northern Adriatic Sea: Analysis of the 1997 event in comparison to earlier events, J. Marine Syst., 50, 223–241, https://doi.org/10.1016/j.jmarsys.2004.01.007, 2004.
Djakovac, T., Supić, N., Bernardi Aubry, F., Degobbis, D., and Giani, M.: Mechanisms of hypoxia frequency changes in the northern Adriatic Sea during the period 1972–2012, J. Marine Syst., 141, 179–189, https://doi.org/10.1016/j.jmarsys.2014.08.001, 2015.
Escudier, R., Clementi, E., Nigam, T., Aydogdu, A., Fini, E., Pistoia, J., Grandi, A., and Miraglio, P.: EU Copernicus Marine Service Quality Information Document for the Mediterranean Sea Physics Reanalysis, MEDSEA_MULTIYEAR_PHY_006_004, Issue 2.4, Mercator Ocean International, https://documentation.marine.copernicus.eu/QUID/CMEMS-MED-QUID-006-004.pdf (last access:25 July 2024), 2024.
EU Copernicus Emergency Management Service Product: River discharge and related historical data from the European Flood Awareness System, Joint Research Center, Copernicus Emergency Management Service, [data set], https://doi.org/10.24381/cds.e3458969, 2019.
EU Copernicus Marine Service Product: Mediterranean Sea Biogeochemistry Reanalysis, Mercator Ocean International [data set], https://doi.org/10.48670/mds-00374, 2022.
EU Copernicus Marine Service Product: Mediterranean Sea Biogeochemistry Analysis and Forecast, Mercator Ocean International [data set], https://doi.org/10.48670/mds-00358, 2024a.
EU Copernicus Marine Service Product: Mediterranean Sea Physics Analysis and Forecast, Mercator Ocean International [data set], https://doi.org/10.48670/mds-00359, 2024b.
EU Copernicus Marine Service Product: Mediterranean Sea Physics Reanalysis, Mercator Ocean International [data set], https://doi.org/10.48670/mds-00375, 2024c.
EU Copernicus Marine Service Product: Mediterranean Sea, Bio-Geo-Chemical, L3, daily Satellite Observations (Near Real Time), Mercator Ocean International [data set], https://doi.org/10.48670/moi-00297, 2025a.
EU Copernicus Marine Service Product: Mediterranean Sea, Bio-Geo-Chemical, L3, daily Satellite Observations (1997–ongoing), Mercator Ocean International [data set], https://doi.org/10.48670/moi-00299, 2025b.
European Commission: Commission staff working document: Review of the status of the marine environment in the European Union, SWD(2020) 61 final, Brussels, https://eur-lex.europa.eu/legal-content/EN/TXT/?uri=CELEX%3A52020SC0061 (last access: 5 May 2026), 2020.
Ferreira, J.G., Andersen, J.H., Borja, A., Bricker, S.B., Camp, J., da Silva, M.C., Garcés, E., Heiskanen, A.-S., Humborg, C., Ignatiades, L., Lancelot, C., Menesguen, A., Tett, P., Hoepffner, N., and Claussen, U.: Overview of eutrophication indicators to assess environmental status within the European Marine Strategy Framework Directive, Estuar. Coast. Shelf Sci., 93, 117–131, https://doi.org/10.1016/j.ecss.2011.03.014, 2011.
Feudale, L., Bolzon, G., Lazzari, P., Salon, S., Teruzzi, A., Di Biagio, V., Coidessa, G., Álvarez, E., Amadio, C., and Cossarini, G.: EU Copernicus Marine Service Quality Information Document for the Mediterranean Sea Biogeochemistry Analysis and Forecast, MEDSEA_ANALYSISFORECAST_BGC_006_014, Issue 3.2, Mercator Ocean International, https://documentation.marine.copernicus.eu/QUID/CMEMS-MED-QUID-006-014.pdf (last access: 25 July 2025), 2024.
Giani, M., Djakovac, T., Degobbis, D., Cozzi, S., Solidoro, C., and Umani, S. F.: Recent changes in the marine ecosystems of the northern Adriatic Sea, Estuar. Coast. Shelf Sci., 115, 1–13, https://doi.org/10.1016/j.ecss.2012.08.023, 2012.
Gualtieri, L., Goglio, A. C., Clementi, E., Grandi, A., Moulin, A., Giurato, M., Aydogdu, A., Pistoia, J., Miraglio, P., Sadighrad, E., Mariani, A., and Drudi, M.: EU Copernicus Marine Service Quality Information Document for the Mediterranean Sea Physics Analysis and Forecast, MEDSEA_ANALYSISFORECAST_PHY_006_013, Issue 2.5, Mercator Ocean International, https://documentation.marine.copernicus.eu/QUID/CMEMS-MED-QUID-006-013.pdf (last access: 25 July 2025), 2024.
Hassoun, A. E. R., Mojtahid, M., Merheb, M., Lionello, P., Gattuso, J.-P., and Cramer, W.: Climate change risks on key open marine and coastal mediterranean ecosystems, Sci. Rep., 15, https://doi.org/10.1038/s41598-025-07858-x, 2025.
Horner-Devine, A. R., Hetland, R. D., and MacDonald, D. G.: Mixing and Transport in Coastal River Plumes, Annu. Rev. Fluid Mech., 47, 569–594, https://doi.org/10.1146/annurev-fluid-010313-141408, 2015.
Lazzari, P., Salon, S., Terzić, E., Gregg, W. W., D'Ortenzio, F., Vellucci, V., Organelli, E., and Antoine, D.: Assessment of the spectral downward irradiance at the surface of the Mediterranean Sea using the radiative Ocean-Atmosphere Spectral Irradiance Model (OASIM), Ocean Sci., 17, 675–697, https://doi.org/10.5194/os-17-675-2021, 2021.
Lecci, R., Salon, S., Bolzon, G., and Cossarini, G.: EU Copernicus Marine Service Product User Manual for the Mediterranean Sea Biogeochemistry Reanalysis, MEDSEA_MULTIYEAR_BGC_006_008, Issue 3.2, Mercator Ocean International, https://documentation.marine.copernicus.eu/PUM/CMEMS-MED-PUM-006-008.pdf (last access: 25 July 2025), 2022.
Lecci, R., Salon, S., Bolzon, G., and Cossarini, G.: EU Copernicus Marine Service Product User Manual for the Mediterranean Sea Biogeochemistry Analysis and Forecast, MEDSEA_ANALYSISFORECAST_BGC_006_014, Issue 2.4, Mercator Ocean International, https://documentation.marine.copernicus.eu/PUM/CMEMS-MED-PUM-006-014.pdf (last access: 25 July 2025), 2024a.
Lecci, R., Drudi, M., Grandi, A., and Clementi, E.: EU Copernicus Marine Service Product User Manual for the Mediterranean Sea Physics Analysis and Forecast, MEDSEA_ANALYSISFORECAST_PHY_006_013, Issue 2.4, Mercator Ocean International, https://documentation.marine.copernicus.eu/PUM/CMEMS-MED-PUM-006-013.pdf (last access: 25 July 2025), 2024b.
Lecci, R., Drudi, M., Grandi, A., and Clementi, E.: EU Copernicus Marine Service Product User Manual for the Mediterranean Sea Physics Reanalysis, MEDSEA_MULTIYEAR_PHY_006_004, Issue 2.4, Mercator Ocean International, https://documentation.marine.copernicus.eu/PUM/CMEMS-MED-PUM-006-004.pdf (last access: 25 July 2025), 2024c.
Lipizer, M., Partescano, E., Rabitti, A., Giorgetti, A., and Crise, A.: Qualified temperature, salinity and dissolved oxygen climatologies in a changing Adriatic Sea, Ocean Sci., 10, 771–797, https://doi.org/10.5194/os-10-771-2014, 2014.
Ludwig, W., Dumont, E., Meybeck, M., and Heussner, S.: River discharges of water and nutrients to the Mediterranean and Black Sea: major drivers for ecosystem changes during past and future decades?, Prog. Oceanogr., 80, 199–217, https://doi.org/10.1016/j.pocean.2009.02.001, 2009.
Marini, M. and Grilli, F.: The role of nitrogen and phosphorus in eutrophication of the northern Adriatic Sea: history and future scenarios, Appl. Sci., 13, 9267, https://doi.org/10.3390/app13169267, 2023.
Mazzetti, C., Carton de Wiart, C., Gomes, G., Russo, C., Decremer, D., Ramos, A., Grimaldi, S., Disperati, J., Ziese, M., Schweim, C., Sanchez Garcia, R., Jacobson, T., Salamon, P., and Prudhomme, C.: River discharge and related forecasted data from the European Flood Awareness System, v5.0. European Commission, Joint Research Center (JRC) [data set], https://doi.org/10.24381/cds.9f696a7a, 2023.
Montanari, A., Nguyen, H., Rubinetti, S., Ceola, S., Galelli, S., Rubino, A., and Zanchettin, D.: Why the 2022 Po River drought is the worst in the past two centuries, Sci. Adv., 9, https://doi.org/10.1126/sciadv.adg8304, 2023.
Mozetič, P., Solidoro, C., Cossarini, G., Socal, G., Precali, R., Francé, J., Bianchi, F., De Vittor, C., Smodlaka, N., and Fonda Umani, S.: Recent trends towards oligotrophication of the northern Adriatic: evidence from chlorophyll a time series, Estuar. Coast., 33, 362–375, https://doi.org/10.1007/s12237-009-9191-7, 2010.
Poulain, P. M.: Adriatic Sea surface circulation as derived from drifter data between 1990 and 1999, J. Marine Syst., 29, 3–32, https://doi.org/10.1016/S0924-7963(01)00007-0, 2001.
Precali, R., Giani, M., Marini, M., Grilli, F., Ferrari, C. R., Pečar, O., and Paschini, E.: Mucilaginous aggregates in the northern Adriatic in the period 1999–2002: Typology and distribution, Sci. Total Environ., 353, 10–23, https://doi.org/10.1016/j.scitotenv.2005.09.066, 2005.
Raicich, F.: On the fresh balance of the Adriatic Sea, J. Marine Syst., 9, 305–319, https://doi.org/10.1016/S0924-7963(96)00042-5, 1996.
Regional Agency for prevention, environment and energy – Arpae Emilia Romagna SIMC Product: HydroMeteoClimate Service of Emilia-Romagna, Hydrological data extracted via DEXT3R, SIMC ARPAE portal, https://simc.arpae.it/dext3r/ (last access: 5 May 2026), 2025.
Ricci, F., Capellacci, S., Casabianca, S., Grilli, F., Campanelli, A., Marini, M., and Penna, A.: Variability of hydrographic and biogeochemical properties in the North-western Adriatic coastal waters in relation to river discharge and climate changes, Chemosphere, 361, 142486, https://doi.org/10.1016/j.chemosphere.2024.142486, 2024.
Salon, S., Cossarini, G., Bolzon, G., Feudale, L., Lazzari, P., Teruzzi, A., Solidoro, C., and Crise, A.: Novel metrics based on Biogeochemical Argo data to improve the model uncertainty evaluation of the CMEMS Mediterranean marine ecosystem forecasts, Ocean Sci., 15, 997–1022, https://doi.org/10.5194/os-15-997-2019, 2019.
Simpson, J. H.: Physical processes in the ROFI regime, J. Marine Syst., 12, 3–15, https://doi.org/10.1016/s0924-7963(96)00085-1, 1997.
Teruzzi, A., Bolzon, G., Feudale, L., and Cossarini, G.: Deep chlorophyll maximum and nutricline in the Mediterranean Sea: emerging properties from a multi-platform assimilated biogeochemical model experiment, Biogeosciences, 18, 6147–6166, https://doi.org/10.5194/bg-18-6147-2021, 2021.
Teruzzi, A., Di Biagio, V., Feudale, L., Bolzon, G., Lazzari, P., Salon, S., Teruzzi, A., Coidessa, G., and Cossarini, G.: EU Copernicus Marine Service Quality Information Document for the Mediterranean Sea Biogeochemistry Reanalysis, MEDSEA_MULTIYEAR_BGC_006_008, Issue 3.2, Mercator Ocean International, https://documentation.marine.copernicus.eu/QUID/CMEMS-MED-QUID-006-008.pdf (last access: 25 July 2025), 2022.
Tojčić, I., Denamiel, C., and Vilibić, I.: Kilometer-scale trends, variability, and extremes of the Adriatic far-future climate (RCP 8.5, 2070–2100), Front. Mar. Sci., 11, https://doi.org/10.3389/fmars.2024.1329020, 2024.
Vaquer-Sunyer, R. and Duarte C. M. : Thresholds of hypoxia for marine biodiversity, P. Natl. Acad. Sci. USA, 105, 15452–15457, https://doi.org/10.1073/pnas.0803833105, 2008.
Verri, G., Pinardi, N., Oddo, P., Ciliberti, S. A., and Coppini, G.: River runoff influences on the Central Mediterranean overturning circulation, Clim. Dynam., 50, 1675–1703, https://doi.org/10.1007/s00382-017-3715-9, 2018.
Vilibić, I., Terzić, E., Vrdoljak, I., Dominović Novković, I., Vodopivec, M., Ciglenečki, I., Djakovac, T., and Hamer, B.: Extraordinary mucilage event in the northern Adriatic in 2024 – A glimpse into the future climate?, Estuar. Coast. Shelf Sci., 317, 109222, https://doi.org/10.1016/j.ecss.2025.109222, 2025.
Vona, I., Colella, S., Sammartino, M., Brando, V. E., and Falcini, F.: Positive correlation between the Po River discharge and ocean colour trends of Chl and TSM in the Adriatic Sea, Front. Remote Sens., 6, https://doi.org/10.3389/frsen.2025.1574347, 2025.
Zittis, G., Bruggeman, A., and Lelieveld, J.: Revisiting future extreme precipitation trends in the Mediterranean, Weather and Climate Extremes, 34, 100380, https://doi.org/10.1016/j.wace.2021.100380, 2021.