the Creative Commons Attribution 4.0 License.
the Creative Commons Attribution 4.0 License.
 | 30 Sep 2026 | OSR10 | Chapter 4.2
Record low sea levels in the Bothnian Bay in November 2024

Milla M. Johansson
Andrew Twelves
Mika Rantanen
Priidik Lagemaa
Hedi Kanarik
Jani Särkkä
Urmas Raudsepp
Antti Westerlund
On 21 November 2024, there was an extreme event within the Bothnian Bay, a sub-basin of the Baltic Sea, when a record low sea level of −153 cm was measured at Kemi, at the northern end of the basin. This minimum was 34 cm lower than the previous minimum measured in 2022. We calculate that the estimated return period for this event is several thousands of years, based on the Kemi tide gauge time series from the 1970s to the day preceding the storm. When the new record low is included in the analysis, the estimated return period for this event is reduced to just 151 years. In this study we also investigate the accuracy of the Baltic Sea Monitoring and Forecasting Centre (BAL MFC) Near Real Time (NRT) physical system in predicting the storm event, and show that the accuracy of the forecast was good up to 3–4 d before the event. Longer lead-time forecasts failed to predict the record low sea level at Kemi, although they did indicate a decrease in sea level during the storm. During the 2024 event, north-easterly winds were measured at coastal weather stations with a maximum 10 min average speed of ∼ 28 m s−1 (with gusts of 32 m s−1). However, we find that the storm intensity alone likely does not explain the magnitude of the sea level extreme, with the exceptionally long duration and unusual track of the storm also playing large roles. This highlights the sensitivity of coastal risk assessment to natural variations in storm tracks, which have the potential to produce rare but high-impact events.
- Article
(2064 KB) - Full-text XML
- BibTeX
- EndNote


Extreme sea level events, both high and low, affect coastal areas in several ways. High sea levels may cause flooding, coastal erosion and damage to coastal infrastructure. Low sea levels can make shallow coastal fairways inaccessible for larger vessels, leading to delays in maritime traffic and cargo transport. Sea level variations in the Baltic Sea result from two types of processes: those that change the total water volume in the semi-enclosed basin, and those that redistribute water within it (e.g. Leppäranta and Myrberg, 2009; Weisse et al., 2021). The first category includes factors such as eustatic sea level rise, post-glacial land uplift, and water exchange with the North Sea. The second involves wind forcing, atmospheric pressure variations, seiches (internal oscillations), and tides.
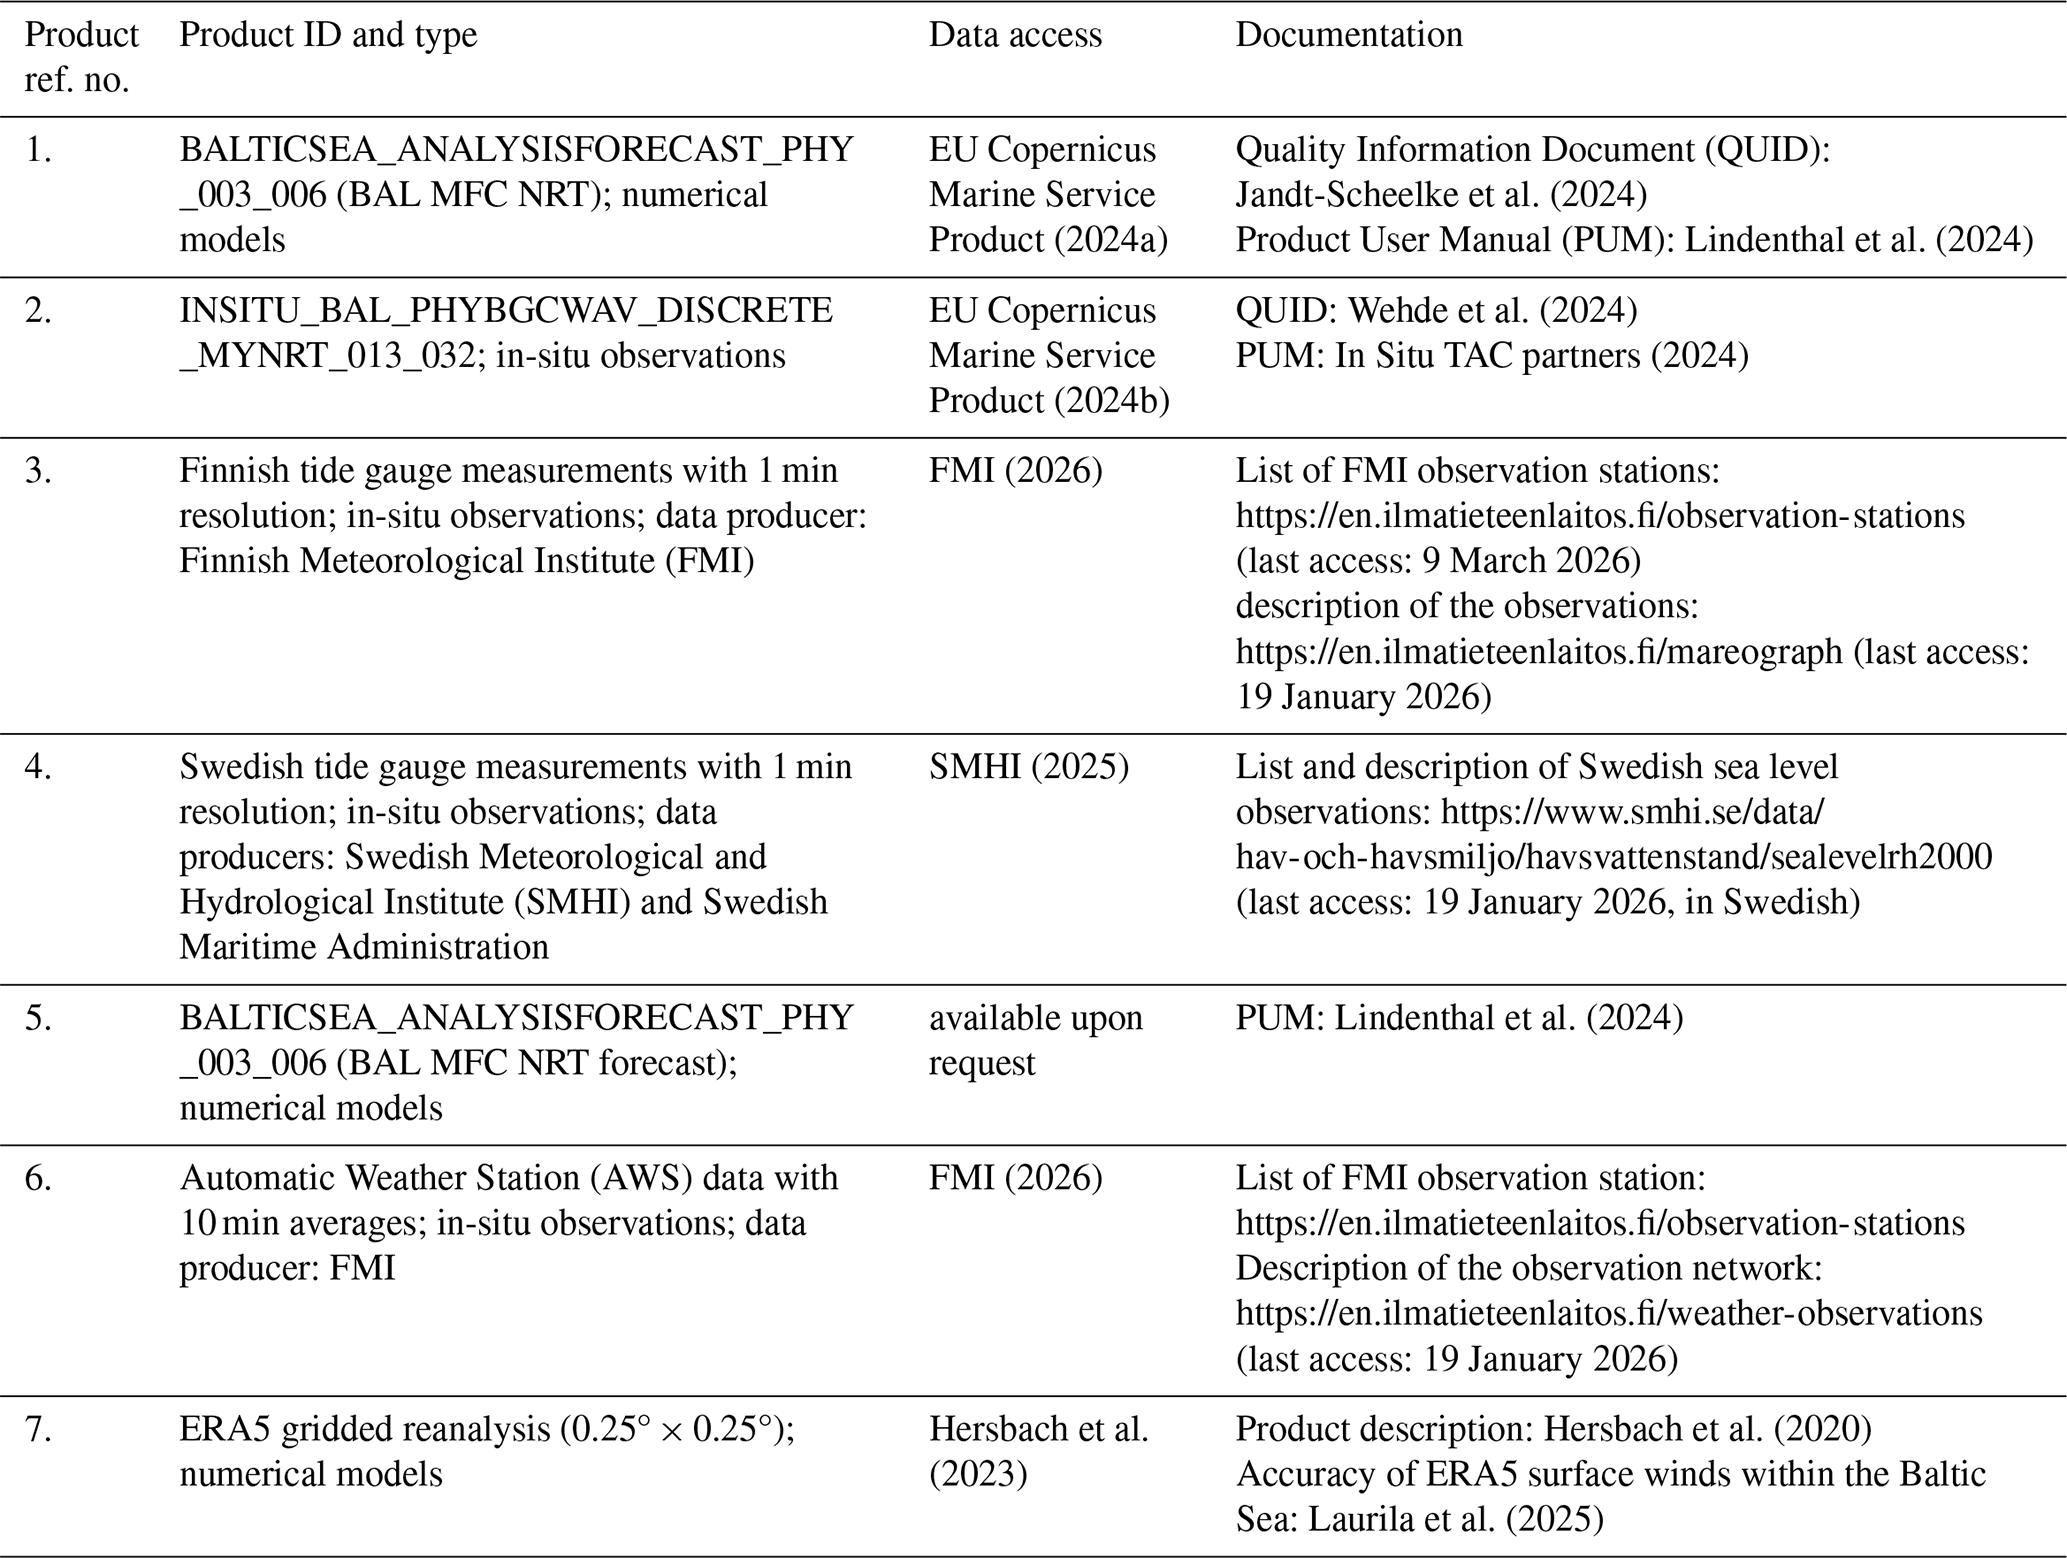
Table 1Copernicus Marine Service and other products used in this study, including information on data documentation.
Extreme high and low sea levels in the Baltic Sea occur as a result of several mutually interacting factors occurring at the same time. High sea level events typically have a preconditioning of increased total water volume in the Baltic Sea (e.g. Weisse et al., 2021; Rutgersson et al., 2022). Low sea level events on the other hand are more typical when the total water volume in the Baltic Sea is close to or below the long-term mean. Extremely low sea level events also require strong or storm-force winds pushing water away from the coast, together with an atmospheric pressure gradient resulting in a suitably oriented sea level gradient along the basin. Such extremes can be further amplified by a seiche oscillation or tidal variation occurring in a suitable phase; seiche is the dominant of these two components due to the small amplitude of tidal variation in the Baltic Sea, which is less than 5 cm in the Gulf of Bothnia (Medvedev et al., 2013).
Accurate prediction of low sea level events is extremely important for ensuring safe and efficient maritime traffic. Short-term forecasts (ranging from a few hours to a few days) support the real-time manoeuvring of vessels entering or leaving harbours, while mid-range forecasts (up to 10 d) can assist in planning cargo loads, allowing ships to access ports safely and on schedule. Sea level forecasts for the Baltic Sea are provided both by the Copernicus Marine Service Baltic Monitoring and Forecasting Centre (BAL MFC) and by national weather and oceanographic centres in the region. The BAL MFC physical Near Real Time (NRT, product ref. no. 1, Table 1) system is based on a setup of the Nucleus for European Modelling of the Ocean (NEMO; Madec and the NEMO System Team, 2023) for the North and Baltic Seas (Kärnä et al., 2021). It is generally able to reproduce sea surface height (SSH) with good accuracy (Jandt-Scheelke et al., 2024).
National sea level forecasting systems vary, from simple 2D systems through to complex 3D model systems. For instance, both the Finnish Meteorological Institute (FMI) and the Swedish Meteorological and Hydrological Institute (SMHI) operate national sea level forecasting systems built on NEMO-based modelling configurations, with many attributes (such as the resolution) resembling the BAL MFC system. However, customisations have been made so that national forecasts better serve the specific needs of their users. For example, FMI has tuned its own system to focus on results for the northern Baltic Sea, and runs its own water level forecast four times a day, in contrast to the twice-daily BAL MFC system. In addition, FMI uses a separate lightweight 2D water level ensemble that is run twice a day to supplement the information provided by the NEMO-based system. These sea level forecasts are used to support national weather warning systems that provide information on potentially dangerous weather phenomena. Cooperation within the Baltic Sea Operational Oceanographic System (BOOS, http://www.boos.org, last access: 9 March 2026) has also lead to a community product that combines the existing SSH forecasts to produce a Multi-Model Ensemble (MME, https://www.boos.org/multi-model-ensemble-of-forecast-products/, last access: 9 March 2026), offering a best estimate based on the weighted average of the forecasts, where each weighting is a function of the forecast accuracy over preceding days. A general description of the MME system can be found in Golbeck et al. (2015).
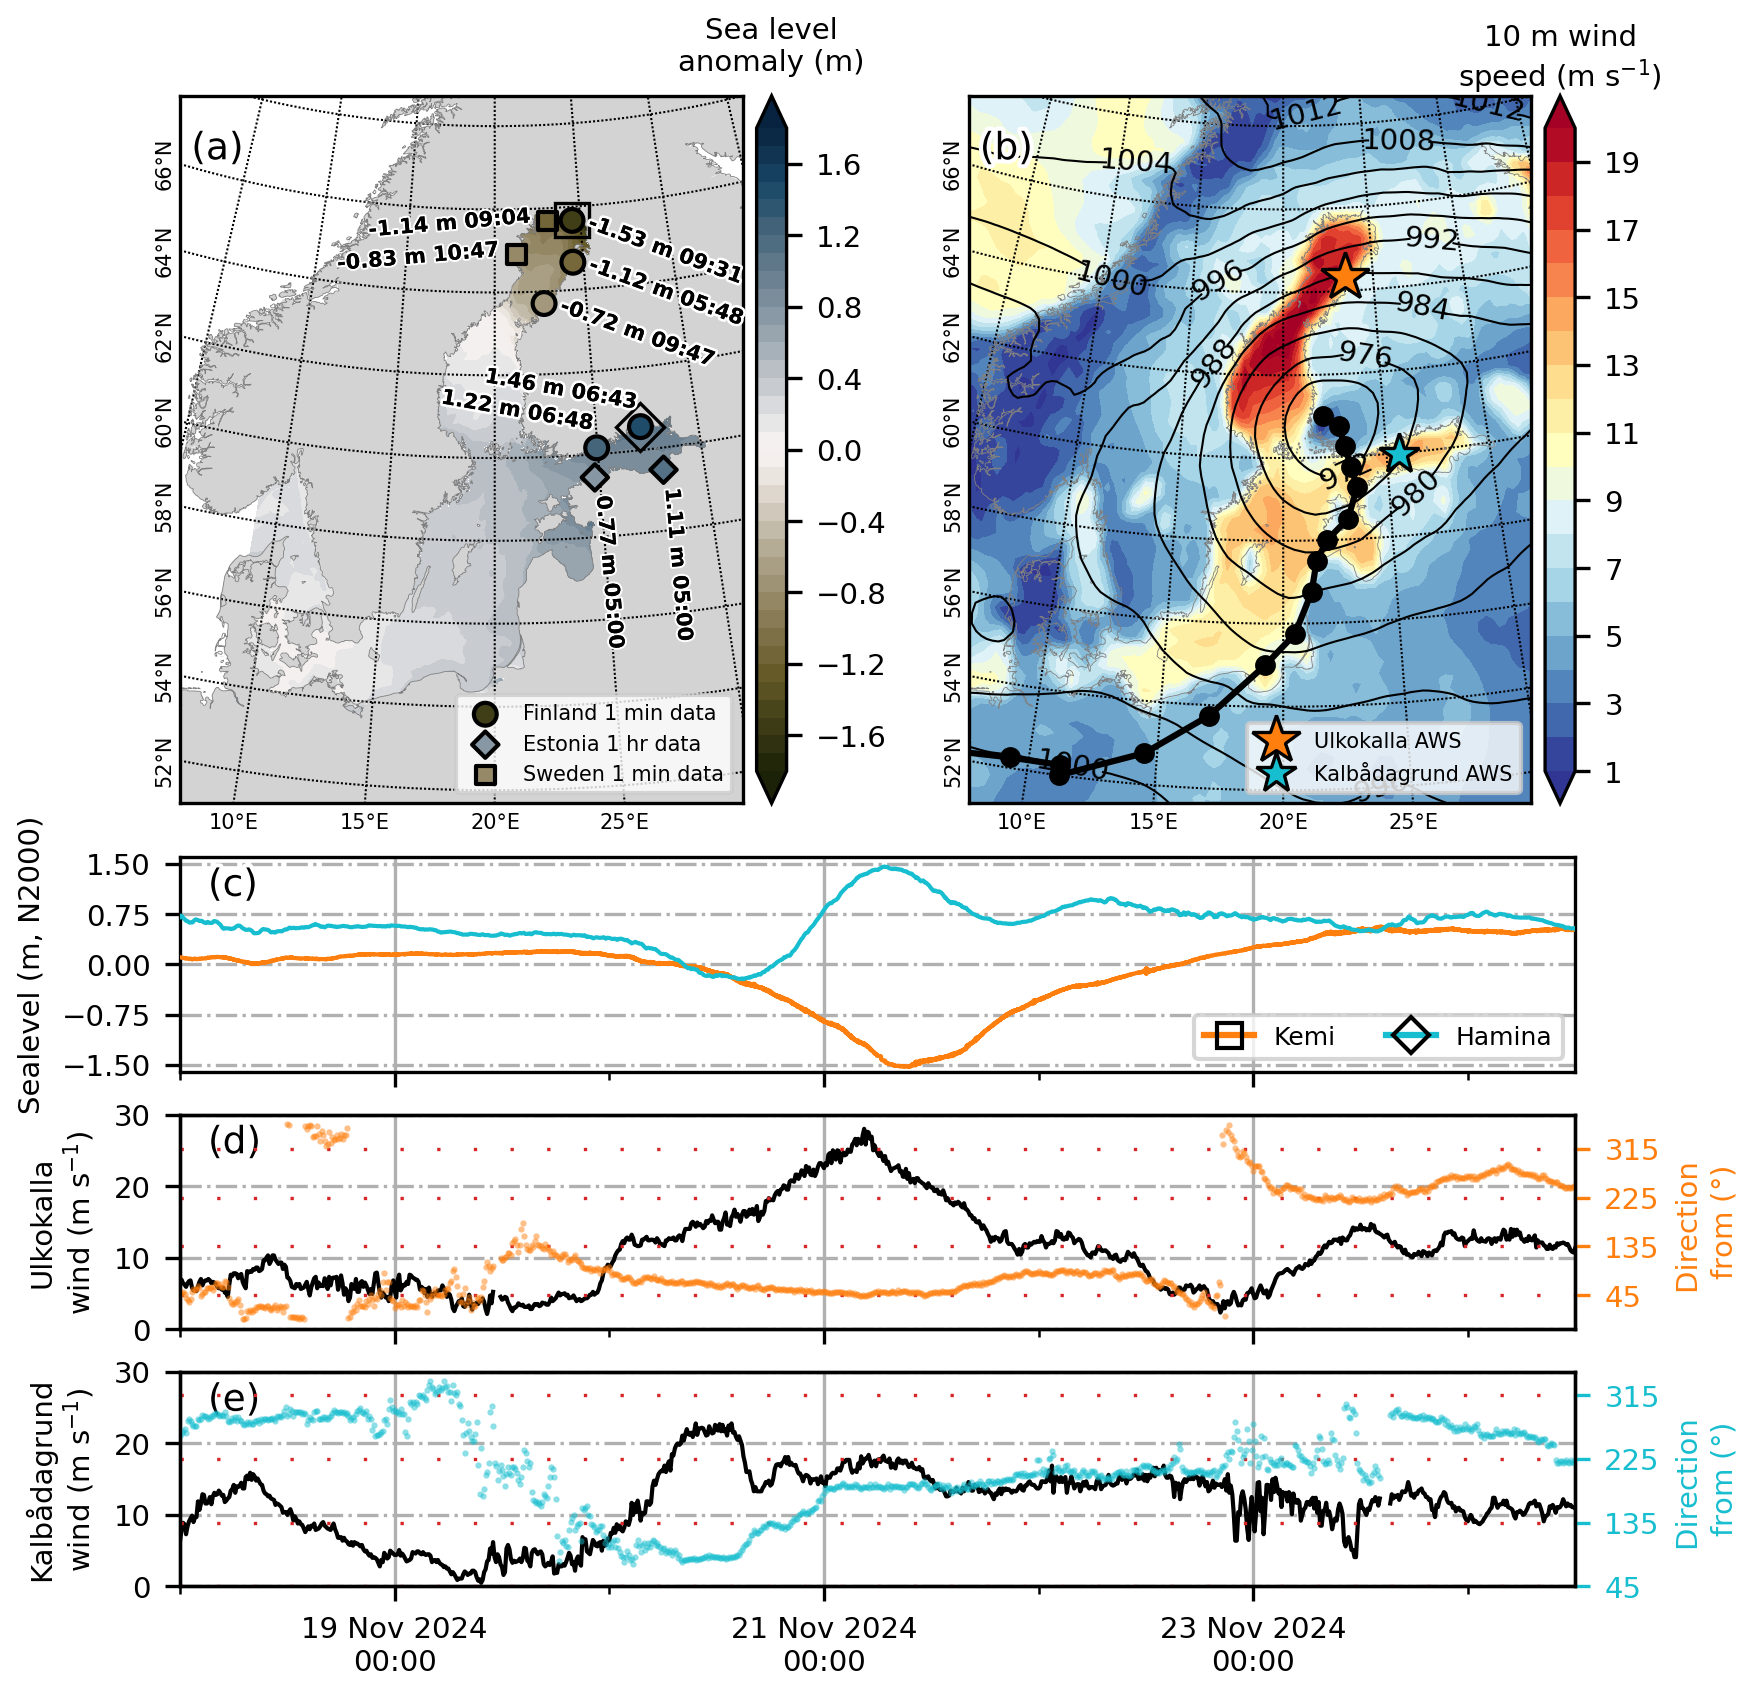
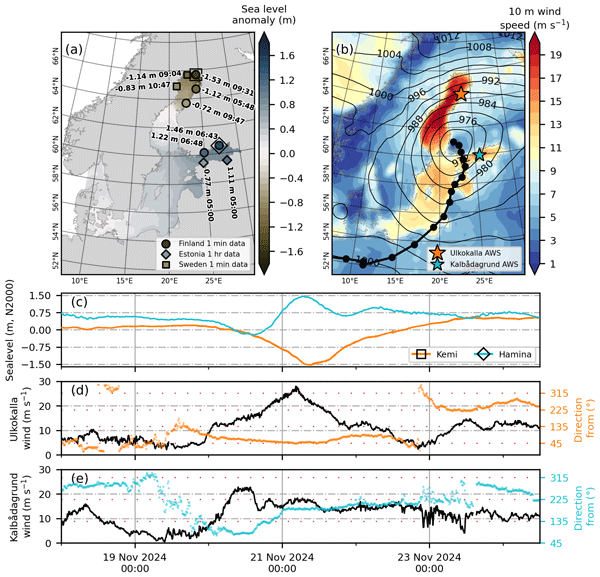
Figure 1(a) NEMO modelled sea level (shading) from the BAL-MFC NRT system, at 09:30 UTC on 21 November 2024, shown relative to the mean dynamic topography; overlaid with tide gauge data (from Finnish, Estonian or Swedish measurements as indicated on legend). Beginning at the westernmost station and following the coastline clockwise, the stations shown are Furuögrund, Kalix, Kemi, Raahe/Brahestad, Pietarsaari/Jakobstad, Helsinki, Hamina, Narva and Tallinn. Minimum measured sea levels on 21 November 2024 are shown in the Bothnian Bay, and maximum sea levels on 21 November 2024 are shown in the Gulf of Finland; in both cases the timing of the minimum/maximum is displayed next to the measured sea level values in the RH2000/N2000/EH2000 reference system. Panel (b) shows 10 m wind speed (shading) and mean sea level pressure (contours) from the ERA5 reanalysis at 21 November 2024 06:00 UTC. The track of the storm from 06:00 UTC on 19 November 2024 to 06:00 UTC on 21 November 2024 is shown with the black line, with the location of the centre marked every 3 h by a dot. Panel (c) shows a time series of observed sea levels from Kemi and Hamina (corresponding locations are marked with a square outline and a diamond outline respectively in panel a). Sea level values are shown in the N2000 height system with simultaneous wind measurements from Ulkokalla (d) and Kalbådagrund (e) AWS stations, locations marked in panel (b).
In this paper, we investigate the extremely low sea level event that occurred in the northernmost sub-basin of the Baltic Sea, the Bay of Bothnia, on 21 November 2024. A record low sea level of −153 cm (in relation to the N2000 height reference system) was measured at Kemi (Fig. 1), at the northern end of the bay. This minimum was 34 cm lower than the previous record set in 2022. During the event, north-easterly winds were measured with a maximum 10 min average speed ∼ 28 m s−1, with gusts of 32 m s−1, at Kalajoki Ulkokalla station. In addition, waves were high in the Bothnian Bay, with a significant wave height of 5 m measured in the central parts of the basin by FMI's operational wave buoy. This low sea level event led to disturbances to maritime traffic in the northern part of the Bothnian Bay. For example, ferry traffic from the mainland to Hailuoto island was halted for 18 h on 21 November. According to media reports, this was only the third time in the 56-year history of the Hailuoto ferry route that the ferry was out of use due to the sea level being too low (https://yle.fi/a/74-20126375, last access: 9 March 2026, in Finnish).
Here we study the meteorological and oceanographic conditions that led to this extreme low sea level event at the northern end of the Bay of Bothnia. We assess how well the present BAL MFC NRT system was able to predict it in advance, and use the extensive sea level time series from Kemi to evaluate the return period of the event.
We use tide gauge data from FMI, SMHI and Tallinn University of Technology (Taltech) stations in the Bothnian Bay and Gulf of Finland to study sea level variation during the event (product ref. no. 2, Table 1, locations shown in Fig. 1a). For the time of the storm we use additional data, with higher temporal resolution, from some of the Finnish (product ref. no. 3, Table 1) and Swedish (product ref. no. 4, Table 1) tide gauges. The tide gauge data are given in relation to the height systems N2000, RH2000, and EH2000, which are the national realisations of the common European height system EVRS. Of the FMI stations we consider Kemi (65°40′24′′ N, 24°30′54′′Ė), Raahe/Brahestad (64°39′59′′ N, 24°24′25′′ E), Pietarsaari/Jakobstad (63°42′31′′ N, 22°41′22′′ E), Helsinki (60°9′13′′ N, 24°57′22′′ E), and Hamina (60°33′46′′ N, 27°10′45′′ E). Of the SMHI stations we consider Furuögrund (64°54′57′′ N, 21°13′50′′ E) and Kalix Storön (65°41′ 49′′ N, 23°5′46′′ E); of the TalTech stations we consider Narva (59°27′47′′ N, 28°2′45′′ E) and Tallinn (59°26′58′′ N, 24°46′ 32′′ E).
To study the accuracy of the BAL MFC sea level forecast in predicting the extreme event, we use model outputs from the NRT physical system (product ref. no. 1 and no. 5, Table 1). This system is built on numerical simulations with the Nucleus for European Modelling of the Ocean (NEMO; Madec and the NEMO System Team, 2023), run on a 1 nautical mile resolution grid covering the North Sea as well as the Baltic Sea, with assimilation from multiple data sources (sea level not included). Extensive description and validation of an earlier version of the Baltic Sea domain (NEMO-Nordic) was provided by Kärnä et al. (2021); the updated version used here includes an upgrade of the NEMO code from version 4.0 to 4.2.1 and is archived at https://doi.org/10.5281/zenodo.14507734 (Swedish Meteorological and Hydrological Institute et al., 2024). In this study we use only the sea surface height from the NRT system, and compare forecasts starting every 12 h, up to a forecast lead-time of 6 d. As meteorological forcing, the model uses forecasts from the Meteorological Cooperation on Operational Numerical Weather Prediction (MetCoOp; Müller et al., 2017) for the first 66 h, and thereafter forecasts from the European Centre for Medium-Range Weather Forecasts (ECMWF, 2024) for the remaining days. The NRT system has been shown to successfully reproduce sea level at Kemi over a validation period from November 2020 to October 2022, with a bias of −1 cm relative to the tide gauge data, and a centred Root Mean Square Deviation (cRMSD) of 7 cm (Jandt-Scheelke et al., 2024).
We use wind data from automatic weather stations (AWS, product ref. no. 6, Table 1) together with ERA5 reanalysis (product ref. no. 7, Table 1) to evaluate the prevailing weather conditions during the storm. We present 10 min average wind speed and direction measured at 1 h intervals at Kalajoki Ulkokalla AWS (64°19′51′′ N, 23°26′47′′ E) in the Bothnian Bay and at Porvoo Kalbådagrund AWS (59°59′8′′ N, 25°35′56′′ E) in the Gulf of Finland (locations also in Fig. 1b). At Ulkokalla AWS, wind measurements are made at an elevation of 17 m above sea level on the treeless Ulkokalla islet, with the nearest mainland approximately 18 km to the southeast. At this station, wind measurements are slightly affected to the north by a building approximately 8 m high, located 30 m from the wind sensor (sector 340–20°), and to the north-northwest (330°) by a lighthouse about 12 m high, situated 40 m from the sensor. At Kalbådagrund AWS, wind measurements are made at an elevation of 32 m above the sea level, approximately 30 km south of the mainland. The observation instruments are located in a lighthouse tower, with the wind meter positioned southwest of the lighthouse helipad. ERA5 reanalysis data is used to support the analysis of the synoptic evolution and the track of the windstorm responsible for the sea level event. From ERA5, we use 10 m wind speed, wind gust, and mean sea level pressure at 3 h intervals, and download the data on a 0.25° × 0.25° resolution grid from the Copernicus Climate Data Store (https://cds.climate.copernicus.eu/, last access: 28 April 2025).
3.1 Observed sea levels in the Bothnian Bay and the Gulf of Finland
The extreme low sea level event occurred in the northernmost part of the Bothnian Bay on 21 November 2024, when sea ice in the bay was minimal. The primary cause of the event was a deepening low-pressure system that arrived in Finland from the southwest (SW) a day earlier, on 20 November 2024. While SW is one of the most common arrival directions for windstorms in Finland, such storms typically follow a more zonal (west-to-east) track and pass quickly over the country (Láng-Ritter et al., 2025). In this case, however, the windstorm followed an unusual track. The storm formed early on 19 November 2024 over Northwest Europe. After crossing northern Germany, it started to deepen and turned northward along the eastern coast of the Baltic Sea (Fig. 1b). The windstorm reached its lowest central pressure of 967 hPa (as per ERA5 reanalysis) on the next day, at 21:00 UTC 20 November 2024, when the centre of the storm made landfall on the Finnish coast.
Although the central pressure of the storm began to gradually rise on 21 November 2024, the storm itself remained nearly stationary over SW-Finland (Fig. 1b). Due to the slow movement and the orientation of the track, a prolonged and strong northeasterly wind prevailed over the Gulf of Bothnia. This effectively pushed seawater south-westward, resulting in an extremely low sea level of −153 cm at Kemi (Fig. 1). The measured minimum was 34 cm lower than the previous minimum measured in 2022. Other tide gauge stations in the northern end of the Bothnian Bay also showed low values (Fig. 1a), but Kemi was the only one of the stations with long-term measurements where a record for low sea level was measured. Measured mean sea levels at Föglö tide gauge, located in the Archipelago Sea (60°01′55′′ N, 20°23′05′′ E), have been shown to reliably represent the water volume of the Baltic Sea (e.g. Johansson and Kahma, 2016). During the week preceding the minimum event at Kemi on 21 November 2024, the mean sea level at Föglö was 24 cm (N2000). In the previous two extremely low sea level events at the Kemi tide gauge, −116 cm on 14 January 2016 and −119 cm on 13 December 2022, the respective weekly mean sea levels at Föglö tide gauge were 0 and −10 cm. This emphasises the strength of the 2024 event.
Concurrent with the low sea level event in the Bothnian Bay, the sea level rose moderately high in the eastern end of the Gulf of Finland. The sea level at Hamina reached +146 cm (still considerably less than the measured maximum of +213 cm). The low sea levels in the Bothnian Bay and the relatively high level in the eastern Gulf of Finland resulted in a record for the largest difference measured between the Kemi and Hamina tide gauges, reaching 294 cm (−152 cm at Kemi and +142 cm at Hamina) at 10:03 UTC on 21 November 2024. The high sea levels in Hamina were preceded by a situation where easterly winds were blowing in the Gulf of Finland, leading to a decreasing sea level, with a minimum value of −22 cm on the preceding day (20 November). This in turn induced a seiche, with a typical period of ∼ 27 h, in the Gulf of Finland. The eastwards return flow associated with this seiche, together with the winds shifting to blow from the SW in the Gulf of Finland after the centre of the storm had passed, induced the high sea level in the eastern part of the Gulf of Finland.
3.2 Forecast
We use sea level from the BAL MFC NRT physical product to assess the NRT system skill in forecasting this event. For the purposes of our analysis we extract the model output at the closest point to the tide gauge. We make the bias correction for the model output by first calculating the mean sea level in the tide gauge observations over the month of November; then calculating the mean sea level in the NRT system by averaging across the first 12 h in each of the November forecasts. We subtract the model mean from the observed mean to obtain the model bias and subtract this from the full time series in each forecast before proceeding with our analysis. Thus we correct each forecast based on the accuracy of forecasts both before and after; in practice, forecasting centres must make corrections based only on the accuracy of preceding forecasts. The exact protocol for this differs between different forecasting centres, and end users of the NRT product may also apply their own bias correction method. For this study, our main interest is in the impact of forecast lead-time on forecast accuracy, not on impacts from the choice of bias correction method.
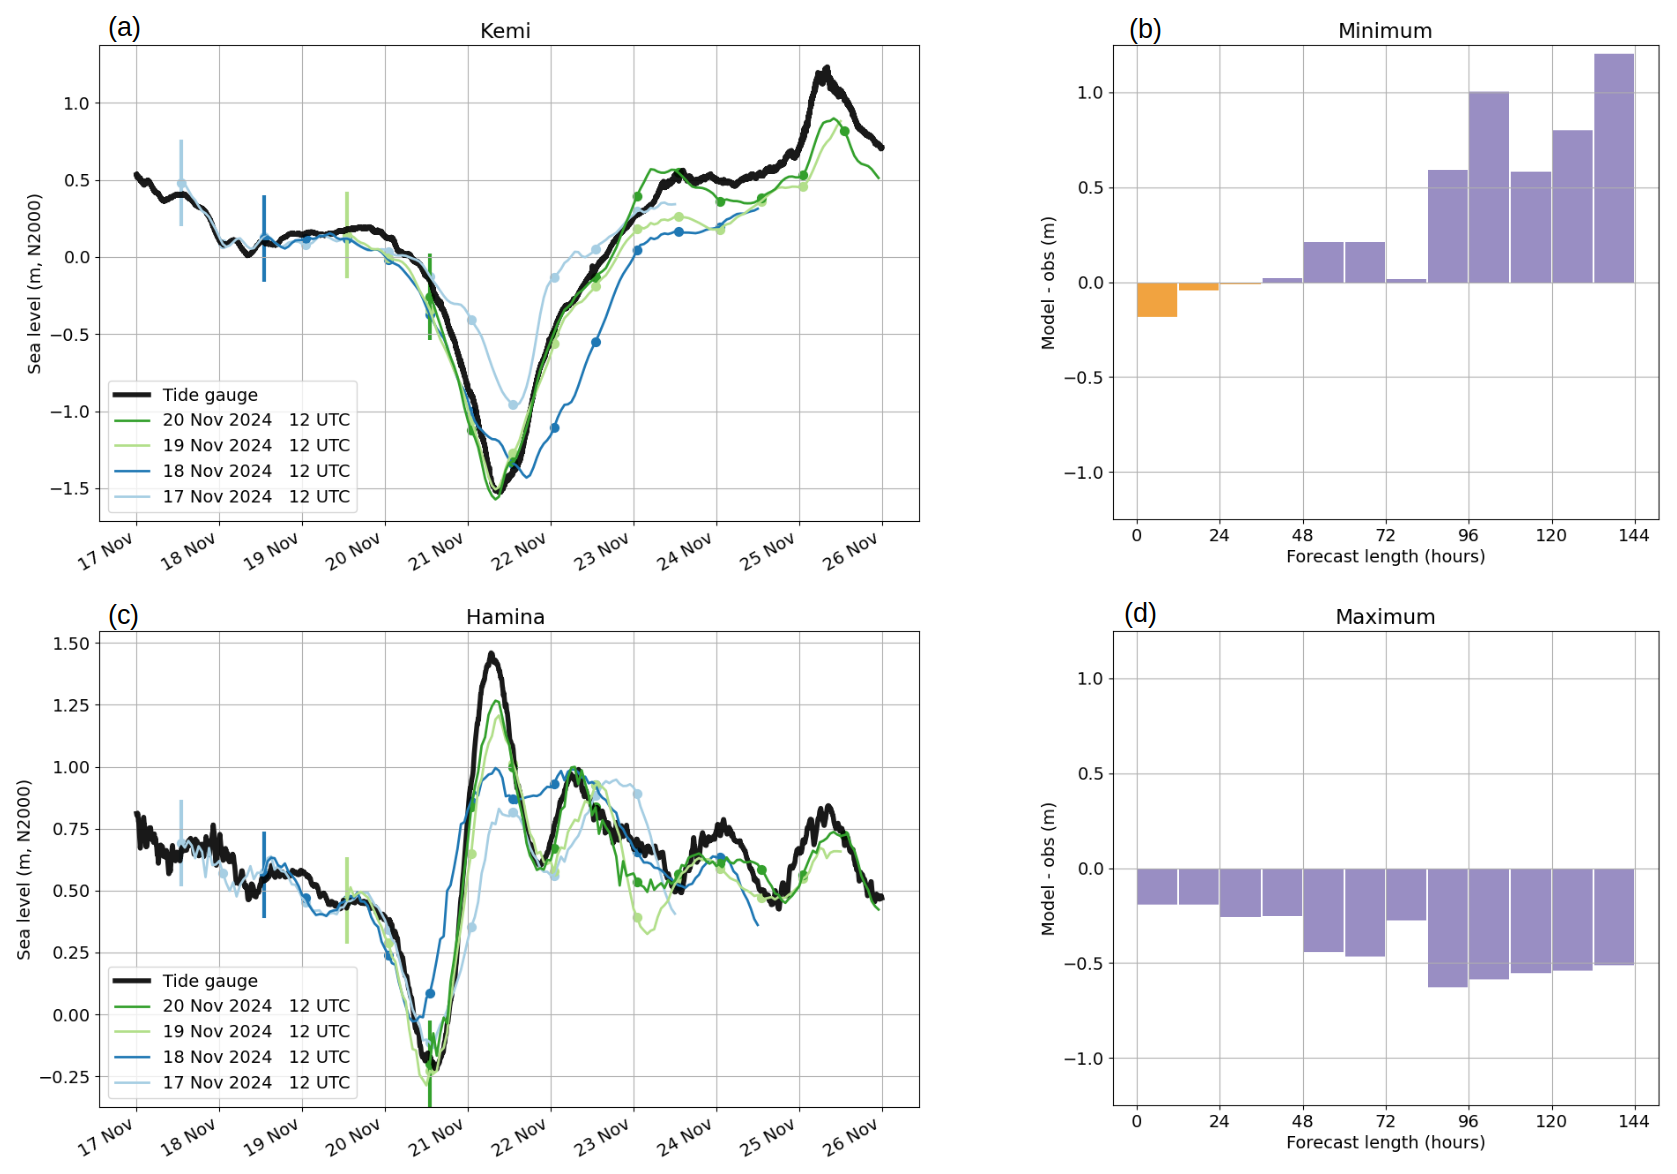
Figure 2Analysis of BAL MFC NRT forecast skill at Kemi (a, b) and at Hamina (c, d) during the November 2024 storm. In panels (a) and (c), the dark green, pale green, dark blue and pale blue lines show outputs from forecasts starting at noon on 20, 19, 18 and 17 November respectively; these correspond to the 12–24, 36–48, 60–72 and 84–96 h lead-time forecasts assessed at the time of the extreme sea levels. The first value in each forecast is indicated with a vertical line; each of the subsequent dots marks the end of a 12 h period. The thick black lines in panels (a) and (c) show the time series of observations from each tide gauge. In panels (b) and (d) we show the difference between each forecast and the tide gauge observations in the sea level minimum (b, Kemi) and the sea level maximum (d, Hamina) as a function of forecast lead-time, including all forecasts from the shortest (0–12 h) to the longest (132–144 h). Purple shading indicates that the model has underestimated the magnitude of the sea level extreme, orange shading indicates that the model has overestimated the magnitude of the sea level extreme.
In Fig. 2 we consider the time series from four of these forecasts in particular: those initialised at 12:00 UTC on 17, 18, 19 and 20 November. These four forecast runs correspond to forecast lead-times of 84–96, 60–72, 36–48, and 12–24 h respectively. We also show the model anomaly difference in forecasting the extreme sea levels on the morning of 21 November, as a function of each forecast lead-time from 0–12 to 132–144 h inclusive.
At Kemi (Fig. 2a–b), the 0–12 h forecast underestimates the sea level minimum, and thus overestimates the magnitude of the extreme, by approximately 19 cm. The forecasts at 12–24 and at 24–36 h also overestimate the peak, but by only 5 and 1 cm respectively. At forecast lead-times beyond 36 h, the model underestimates the peak, though only by 2 cm in the 36–48 h forecast. The forecasts at 48–60 and 60–72 h both underestimate the peak by approximately 19 cm; however the 72–84 h forecast shows a sharp improvement in forecast skill, only underestimating the peak by 2 cm. The accurate prediction of extreme sea level events in the Baltic Sea is very sensitive to the accuracy of the NWP systems in capturing the storm track. More information about the forecast accuracy of these NWP systems can be found in Haiden et al. (2024).
The NRT system generally performs worse in forecasting the maximum at Hamina (Fig. 2c–d) than the minimum at Kemi. The best forecast is that at lead-time 0–12 h, which underestimates the maximum by approximately 19 cm; all forecasts with longer lead-times perform worse. Again, the decrease in model skill is not monotonic, with the 72–84 h forecast substantially outperforming the forecast at 60–72 h. In all cases the forecast error takes the form of an underestimate of peak sea level.
3.3 Return periods
Return periods of sea levels are typically used to evaluate the probabilities of extreme events for coastal areas. Such estimates are valuable for coastal planning, for example to account for extreme high sea level events that would cause flooding. On the Finnish coast, return periods for high sea levels have been estimated by e.g. Räty et al. (2023) and Pellikka et al. (2018). Information on return periods for extreme low sea levels is harder to find, though such information would be valuable for planning of fairways, harbours etc. in shallow coastal areas – especially in areas where land uplift still dominates over eustatic sea level rise.
To estimate the return period for this storm-driven event in Kemi, we use observed annual sea level minima from the Kemi tide gauge for the period of 1977–2024. There do exist measurements from a longer period from the Kemi area, but we discount those prior to 1977, when the location of the tide gauge was moved from its original site inside the harbour; due to land uplift (among other reasons), this location was no longer able to properly measure the sea level variation.
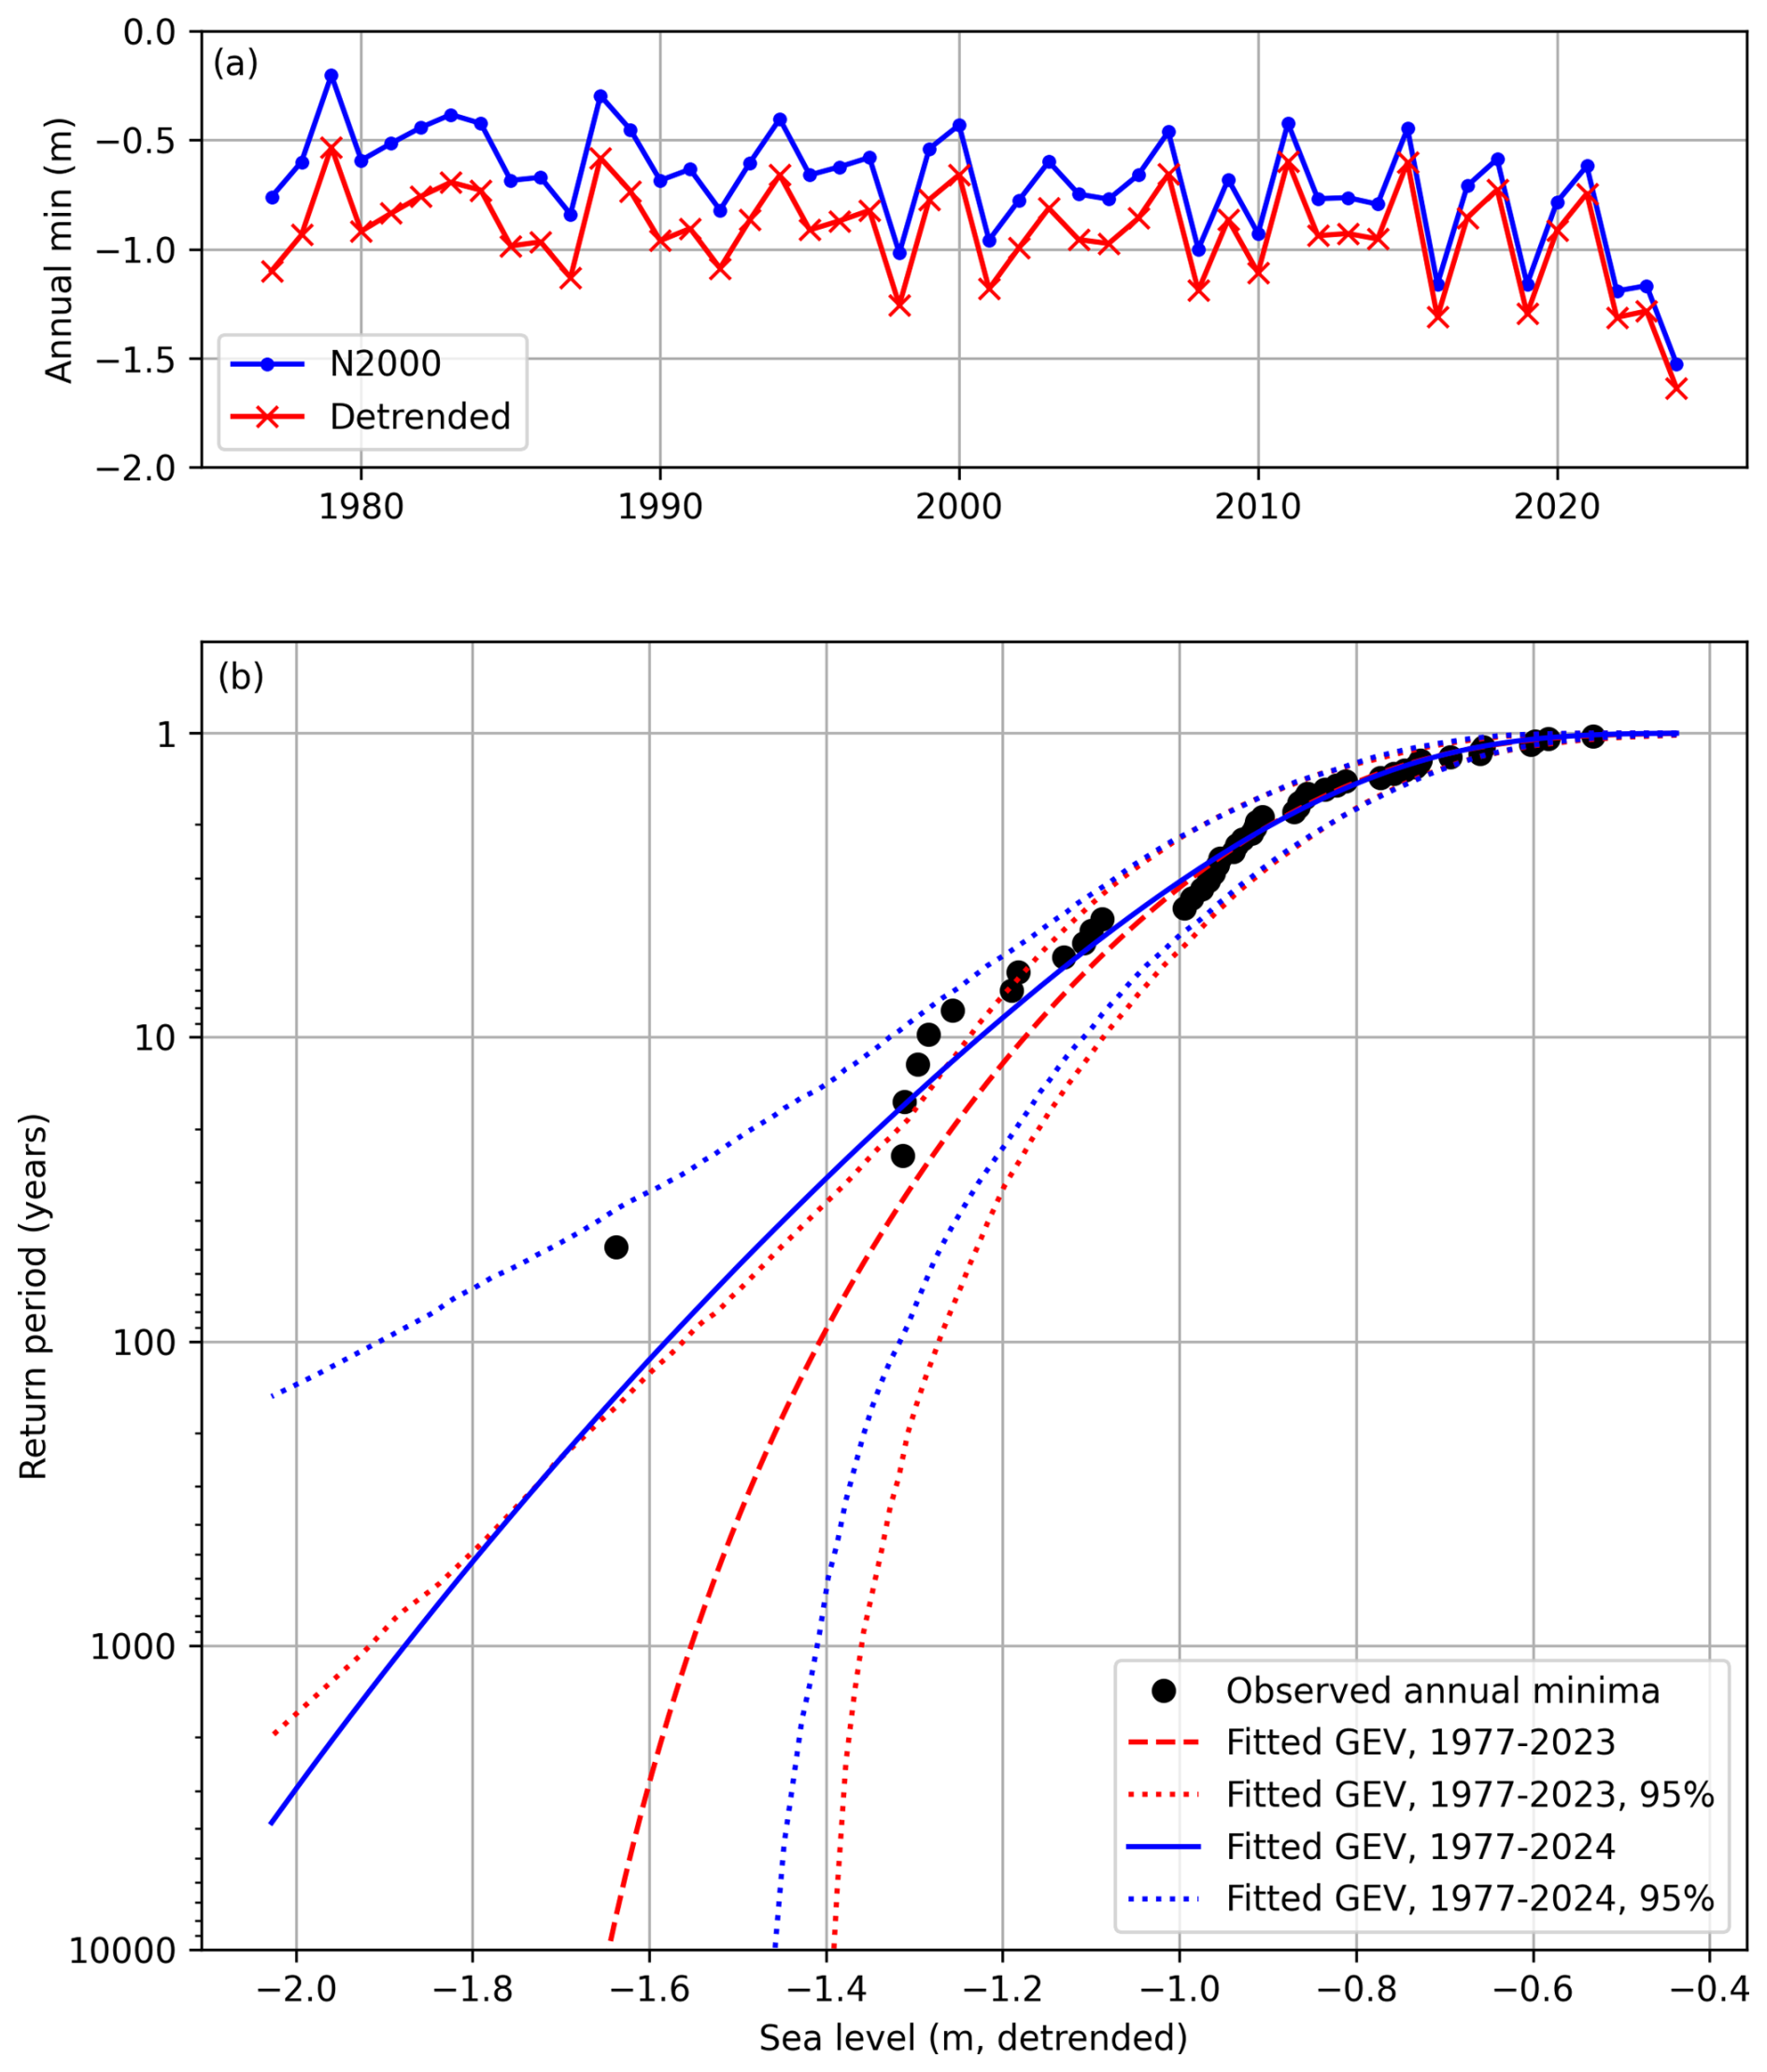
Figure 3(a) Time series of Kemi observed annual minima 1977–2024 in the N2000 height system, and detrended by removing the trend of annual mean sea levels in 1977–2024, to exclude the effect of long-term mean sea level change. In panel (b), cumulative probability distribution of the detrended annual minima is shown. Generalized Extreme Value (GEV) distributions were fitted to the values with the 2024 record value included in the fit (solid blue line), and without the 2024 value (dashed red line). The 95 % confidence intervals (dotted lines) are based on 1000 nonparametric bootstrap samples.
To exclude the effect of the long-term mean sea level trend, we detrend the data by removing the 1977–2024 trend of annual mean sea levels from the annual minima measured in the N2000 height system. We fit Generalized Extreme Value (GEV) distributions to the detrended annual minima; first including the 2024 record value on the fit, then excluding it (Fig. 3). We estimate the 95 % confidence intervals using a nonparametric bootstrap approach with 1000 resamples. There is a substantial difference in the estimated return period of the record-low Kemi minimum (−164 cm in the detrended data set) depending on whether the record-low value is included in the fit or not. If it is included, the estimated return period is 151 years, with the lower bound of the 95 % confidence interval at 38 years (Fig. 3). However, when the event is excluded, and the analysis is based only on annual minima from 1977–2023, the estimated return period increases to 7700 years, with the lower bound of the 95 % confidence interval at 140 years.
The long-term mean sea level in relation to the RH2000/N2000 height systems is decreasing in the Bothnian Bay, since land uplift is stronger than the eustatic mean sea level rise. Thus, extreme lows in sea level tend to get lower with time, even if the short-term variability and weather conditions remain unchanged. When analysing whether a given sea level event is in fact a “record low”, it is thus customary to refer the values to a time-changing long-term mean sea level estimate instead of RH2000/N2000. In Finland and Sweden, slightly different definitions for such mean sea level estimate (MSL) are used.
During the extreme low sea level event that took place on 21 November 2024 within the Bothnian Bay, Kemi tide gauge was the only long-term sea level station in the region that measured a record low value relative to MSL. However several other sea level stations in the Bothnian Bay did measure values close to their earlier record low values. At the Finnish tide gauge Oulu (located at 65°02′25′′ N, 25°25′06′′ E), between the Kemi and Raahe tide gauges, recording of the sea level stopped at 05:48 UTC, more than 3 h before the lowest value was reached at Kemi (09:31 UTC). This was due to the float in the tide gauge hitting the well bottom. The record value at Oulu is −131 cm with respect to MSL, measured on 19 January 1929. The observed decline in relative mean sea level during the past 100 years at Oulu has been 63 cm (Pellikka et al., 2023), as a result of land uplift after the last glaciation period, partially counteracted by eustatic mean sea level rise. Therefore, the record value of −131 cm in 1929 corresponds to about −70 cm in the present mean sea level at Oulu. This illustrates the fact that the Oulu tide gauge has now become so “elevated” compared to the mean sea level that it is unable to capture the lowest extremes. At Kalix Storön the sea level was 4 cm lower (relative to MSL) during the record low sea level event on 19 January 1998 compared to the value measured during the November 2024 event. There is also a newer tide gauge station, located north of Kalix Storön and operated by the Swedish Maritime Administration (Kalix-Kalrsborg Sjöv, 65°47′21′′ N, 23°18′02′′ E), where the measured sea level on 21 November 2024 was lower than at Kalix Storön. This lowest measured value was −126 cm in RH2000. However, the time series from this station only extends back to 2009, so here it is not possible to compare the November 2024 event to values measured in 1998. It is important to note that the north-easterly wind direction during the November 2024 event provided more optimal conditions to reach record low values on the Finnish side of the gulf than on the Swedish side.
Two significant factors behind the record value were the unusual track of the windstorm and its intensity. To get preliminary information about the severity of the storm, we analyse maximum daily wind gusts during the extended winter season (October–March, ONDJFM) from 1950/1951 to 2024/2025 using ERA5 reanalysis data. The maximum gust of 34.2 m s−1, occurring on 21 November 2024, was the highest value observed in the Bothnian Bay (marine areas north of 63° N) during this 75-year period. It is important to note, however, that this preliminary analysis does not fully capture the exceptional nature of the windstorm. The extremely low sea levels result not only from peak wind speeds but also from the duration and direction of the wind, in particular the prolonged northeasterly flow in this region. A more comprehensive analysis of the characteristics of the windstorm is beyond the scope of this paper and is left for future work.
At the time of the extreme low sea level event, the ice season had started in the Bothnian Bay, but ice cover was restricted to thin new ice in some coastal areas. Consequently, the event was not substantially influenced by the damping effect of sea ice. More information about the Baltic sea ice season 2024/2025 can be found at https://en.ilmatieteenlaitos.fi/ice-winter-2024-2025 (last access: 22 January 2026).
The accuracy of weather forecasts, and consequently oceanographic forecasts, generally decreases as the forecast lead-time increases. This particularly affects the prediction of extreme sea level events in the Baltic Sea, which are highly dependent on accurate forecasting of low-pressure system tracks over the sea area. The quality of the sea level forecast is assessed daily within the BAL MFC, and daily near-real-time validation is presented in the Product Quality Dashboard (https://pqd.mercator-ocean.fr/, last access: 9 March 2026). This shows that the overall cRMSD of the sea level analysis is generally below 5 cm, while the cRMSD of the sea level forecast increases by approximately 1 cm per forecast day. However forecast errors can be significantly larger than the overall cRMSD during extreme events.
The accuracy of the NEMO-Nordic system in reproducing the observed sea level variations can be estimated from the best-estimate short-range forecasts, in which the weather forecast is assumed to be of the highest reliability. Kärnä et al. (2021) found that the best-estimate SSH from NEMO-Nordic tends to overestimate the magnitude (i.e. give a negative elevation anomaly relative to observations) for extreme low sea levels in the Bothnian Bay and underestimate the magnitude of extreme high sea levels in the Gulf of Finland. Our analysis shows the same pattern in the 12 h forecasts, with the magnitude of the record minimum at Kemi overestimated and the maximum at Hamina underestimated compared to observations. At Kemi this overestimation remains (but is reduced in magnitude) in the 24 and 36 h forecasts, beyond which the minimum is instead underestimated. However, for all forecast lead-times below 84 h, even this underestimated sea level extreme is beyond the previous record.
The worsening of the quality in the forecasts with lead times of 48–60 and 60–72 h compared to both shorter (< 44 h) and longer (> 72 h) forecast lead-times may be due to the shift of meteorological forcing from MetCoOp to ECMWF 66 h into the forecast. The discrepancies between the forecasts at 66 h lead-times have the potential to cause discontinuities in the description of meteorological conditions. Depending on the scale of the differences, it may take several hours for the forecast system to adapt to this change. Similar deterioration of forecast quality around forecast lead-times of 60–72 h has also been reported in the BAL MFC wave forecasts (Aguiar et al., 2024).
The requirements for forecast accuracy may vary depending on the use case. Weather centres typically issue warnings for potentially dangerous weather phenomena based on predefined thresholds. If the forecasting system can provide information with sufficient accuracy for the warning process, small deviations may not have a significant impact. For example, FMI issues warnings for both high and low sea levels along the Finnish coast. The threshold level for low sea level warning is based on the low sea level that has a return period of one year, calculated from the sea level statistics of the nearest tide gauge. The warning levels change yearly to account for land uplift and mean sea level rise. For Kemi, the low sea level warning level was −72 cm in 2024. Using our bias-correction method, all forecasts with lead times less than 96 h predict a sea level minimum below this threshold on the morning of the 21 November 2024. This suggests that early warnings could be given up to 4 d before the event, though the triggering of such an early warning system is dependent on the method chosen for bias correction.
There is large uncertainty associated with long return periods. Due to the relatively short measurement time series, they can be low-or high-biased depending on whether extreme events have occurred during the measurement period. The corresponding uncertainty in the return period of the November 2024 event at Kemi is large. When the 2024 record-low sea level event is included in our analysis, the estimated return period at Kemi is 151 years (lower bound 38 years). However, when the event is excluded, the return period estimate increases to 7700 years (lower bound 140 years). This emphasises the importance of considering confidence intervals when using the return periods of low probability events to inform coastal or near-shore planning and construction. The estimation of future low extremes is further complicated by the projected decrease of mean sea level in the Bothnian Bay (Pellikka et al., 2023), where the land uplift rate will likely exceed mean sea level rise throughout this century. A decreasing mean sea level implies an increase in the likelihood of low sea level events even more extreme than the one that occurred in November 2024. Pellikka et al. (2018) have studied the probabilities of extremely high sea level events in the future climate by combining mean sea level scenarios and observation-based probabilities of extremes, but corresponding studies for low sea level extremes on the Finnish coast have not been conducted thus far. Such studies may prove valuable, for instance in the planning of fairways and harbours that ensures safety of maritime traffic and smooth transport of goods in this region into the future.
Copernicus Marine products (product ref. no. 1 and 2, Table 1) are openly available through https://marine.copernicus.eu/ (last access: 10 February 2025) and the whole forecast length of the BAL MFC NRT forecast (product ref. no. 5) is available upon request from the authors or upon request via the Copernicus Marine website. Finnish wind (product ref. no. 6) and minute sea level data (product ref. no. 3) are publicly available from the FMI open data portal (https://en.ilmatieteenlaitos.fi/open-data, last access: 19 January 2026). Swedish 1 min sea level observations (product ref. no. 4) are available through SMHI's open data portal (https://www.smhi.se/data, last access: 17 February 2025). The ERA5 reanalysis (product ref. no. 6) is openly available through the Climate Data Store (https://cds.climate.copernicus.eu/, last access: 28 April 2025).
The study was initiated and overseen by LT, with support from HK. The analysis and the description of the storm event was performed by MJ, AT, MR and JS, the forecasting capability of the NRT model was analysed by PL and AT, and return periods were calculated and analysed by MJ. The original version of the manuscript was prepared and revised by all authors.
The contact author has declared that none of the authors has any competing interests.
The Copernicus Marine Service offering is regularly updated to ensure it remains at the forefront of user requirements. In this process, some products may undergo replacement or renaming, leading to the removal of certain product IDs from the catalogue. If readers have any questions or require assistance regarding these modifications, please feel free to reach out to the Copernicus Marine Service user support team for further guidance. They will be able to provide the necessary information to address concerns and find suitable alternatives.
Publisher's note: Copernicus Publications remains neutral with regard to jurisdictional claims made in the text, published maps, institutional affiliations, or any other geographical representation in this paper. The authors bear the ultimate responsibility for providing appropriate place names. Views expressed in the text are those of the authors and do not necessarily reflect the views of the publisher.
This research has been supported by the European Union through the Copernicus Marine Service Programme.
This paper was edited by Johannes Karstensen and reviewed by two anonymous referees.
Aguiar, D., Kanarik, H., Tuomi, L., and Jokiniemi, A.: Evaluating accuracy of Baltic Sea wave forecasts, Geophysica, 59, 3–19, https://www.geophysica.fi/pdf/geophysica_2024_59_1_003_aguiar.pdf (last access: 9 March 2026), 2024.
ECMWF: IFS documentation, CY49R1, Part V: Ensemble Prediction System, IFS Documentation CY49R1, ECMWF, https://doi.org/10.21957/956d60ad81, 2024.
EU Copernicus Marine Service Product: Baltic Sea Physics Analysis and Forecast, Mercator Ocean International [data set], https://doi.org/10.48670/moi-00010, 2024a.
EU Copernicus Marine Service Product: Baltic Sea – In Situ Near Real Time Observations, Mercator Ocean International [data set], https://doi.org/10.48670/moi-00032, 2024b.
FMI: Weather and Sea level Real-time observations, FMI's Open data service [data set], https://en.ilmatieteenlaitos.fi/download-observations (last access: 9 March 2026), 2026.
Golbeck, I., Li, X., Janssen, F., Brüning, T., Nielsen, J. W., Huess, V., Söderkvist, J., Büchmann, B., Siiriä, S. M., Vähä-Piikkiö, O., and Hackett, B.: Uncertainty estimation for operational ocean forecast products – a multi-model ensemble for the North Sea and the Baltic Sea, Ocean Dynam., 65, 1603–1631, https://doi.org/10.1007/s10236-015-0897-8, 2015.
Haiden, T., Janousek, M., Vitart, F., Tanguy, M., Prates, F., and Chevalier, M.: Evaluation of ECMWF forecasts, ECMWF Technical Memoranda, 918, ECMWF, https://doi.org/10.21957/52f2f31351, 2024.
Hersbach, H., Bell, B., Berrisford, P., Hirahara, S., Horányi, A., Muñoz-Sabater, J., Nicolas, J., Peubey, C., Radu, R., Schepers, D., Simmons, A., Soci, C., Abdalla, S., Abellan, X., Balsamo, G., Bechtold, P., Biavati, G., Bidlot, J., Bonavita, M., De Chiara, G., Dahlgren, P., Dee, D.,Diamantakis, M., Dragani, R., Flemming, J., Forbes, R., Fuentes, M., Geer, A., Haimberger, L., Healy, S., Hogan, R. J., Hólm, E., Janisková, M., Keeley, S., Laloyaux, P., Lopez, P., Lupu, C., Radnoti, G., de Rosnay, P., Rozum, I., Vamborg, F., Villaume, S., and Thépaut, J. N.: The ERA5 global reanalysis, Q. J. R. Meteorol. Soc., 146, 1999–2049, https://doi.org/10.1002/qj.3803, 2020.
Hersbach, H., Bell, B., Berrisford, P., Biavati, G., Horányi, A., Muñoz Sabater, J., Nicolas, J., Peubey, C., Radu, R., Rozum, I., Schepers, D., Simmons, A., Soci, C., Dee, D., and Thépaut, J.-N.: ERA5 monthly averaged data on single levels from 1940 to present, Copernicus Climate Change Service (C3S) Climate Data Store (CDS) [data set], https://doi.org/10.24381/cds.f17050d7, 2023.
In Situ TAC partners: EU Copernicus Marine Service Product User Manual for the Baltic Sea- In Situ Near Real Time Observations In situ products, INSITU_BAL_PHYBGCWAV_DISCRETE_MYNRT_013_032, Issue 2.2, Mercator Ocean International, https://documentation.marine.copernicus.eu/PUM/CMEMS-INS-PUM-013-030-036.pdf (last access: 15 May 2025), 2024.
Jandt-Scheelke, S., Panteleit, T., Verjovkina, S., Lagemaa, P., Spruch, L., and Morrison, H.: EU Copernicus Marine Service Quality Information Document for the Baltic Sea Physics Analysis and Forecast, BALTICSEA_ANALYSISFORECAST_PHY_003_006, Issue 8.0, Mercator Ocean International, https://documentation.marine.copernicus.eu/QUID/CMEMS-BAL-QUID-003-006.pdf (last access: 6 February 2025), 2024.
Johansson, M. M. and Kahma, K. K.: On the statistical relationship between the geostrophic wind and sea level variations in the Baltic Sea, Boreal Env. Res., 21, 25–43, 2016.
Kärnä, T., Ljungemyr, P., Falahat, S., Ringgaard, I., Axell, L., Korabel, V., Murawski, J., Maljutenko, I., Lindenthal, A., Jandt-Scheelke, S., Verjovkina, S., Lorkowski, I., Lagemaa, P., She, J., Tuomi, L., Nord, A., and Huess, V.: Nemo-Nordic 2.0: operational marine forecast model for the Baltic Sea, Geosci. Model Dev., 14, 5731–5749, https://doi.org/10.5194/gmd-14-5731-2021, 2021.
Láng-Ritter, I., Laurila, T. K., Mäkelä, A., Gregow, H., and Sinclair, V. A.: Classifying extratropical cyclones and their impact on Finland's electricity grid: insights from 92 damaging windstorms, Nat. Hazards Earth Syst. Sci., 25, 1697–1717, https://doi.org/10.5194/nhess-25-1697-2025, 2025.
Laurila, T. K., Laapas, M., Olsson, T., and Jylhä, K.: Wind speeds and gusts in Finland: a comparison of observations and ERA5 reanalysis, Boreal Env. Res., 30, 181–193, https://doi.org/10.60910/ber2025.q6kf-qp39, 2025.
Leppäranta, M. and Myrberg, K.: Physical oceanography of the Baltic Sea, Springer-Praxis books in geophysical sciences, Springer/Praxis Pub., Berlin, Chichester, UK, ISBN 978-3-540-79702-9, 2009.
Lindenthal, A., Nord, A., Ljungemyr, P., Fyrstedt, S., and Huess, V.: EU Copernicus Marine Service Product User for the Baltic Sea Physics Analysis and Forecast, BALTICSEA_ANALYSISFORECAST_PHY_003_006, Issue 1.2, Mercator Ocean International, https://documentation.marine.copernicus.eu/PUM/CMEMS-BAL-PUM-003-006-007.pdf (last access: 6 February 2025), 2024.
Madec, G. and the NEMO System Team: NEMO Ocean Engine Reference Manual, Zenodo, https://doi.org/10.5281/zenodo.8167700, 2023.
Medvedev, I. P., Rabinovich, A. B., and Kulikov, E. A.: Tidal oscillations in the Baltic Sea, Oceanology, 53, 526–538, https://doi.org/10.1134/S0001437013050123, 2013.
Müller, M., Homleid, M., Ivarsson, K., Køltzow, M. A. Ø., Lindskog, M., Midtbø, K. H., Andrae, U., Aspelien, T., Berggren, L., Bjørge, D., Dahlgren, P., Kristiansen, J., Randriamampianina, R., Ridal, M., and Vignes, O.: AROME-MetCoOp: A Nordic Convective-Scale Operational Weather Prediction Model, Wea. Forecasting, 32, 609–627, https://doi.org/10.1175/WAF-D-16-0099.1, 2017.
Pellikka, H., Leijala, U., Johansson, M. M., Leinonen, K., and Kahma, K. K.: Future probabilities of coastal floods in Finland, Cont. Shelf Res., 157, 32–42, https://doi.org/10.1016/j.csr.2018.02.006, 2018.
Pellikka, H., Johansson, M. M., Nordman, M., and Ruosteenoja, K.: Probabilistic projections and past trends of sea level rise in Finland, Nat. Hazards Earth Syst. Sci., 23, 1613–1630, https://doi.org/10.5194/nhess-23-1613-2023, 2023.
Räty, O., Laine, M., Leijala, U., Särkkä, J., and Johansson, M. M.: Bayesian hierarchical modelling of sea-level extremes in the Finnish coastal region, Nat. Hazards Earth Syst. Sci., 23, 2403–2418, https://doi.org/10.5194/nhess-23-2403-2023, 2023.
Rutgersson, A., Kjellström, E., Haapala, J., Stendel, M., Danilovich, I., Drews, M., Jylhä, K., Kujala, P., Larsén, X. G., Halsnæs, K., Lehtonen, I., Luomaranta, A., Nilsson, E., Olsson, T., Särkkä, J., Tuomi, L., and Wasmund, N.: Natural hazards and extreme events in the Baltic Sea region, Earth Syst. Dynam., 13, 251–301, https://doi.org/10.5194/esd-13-251-2022, 2022.
SMHI: Sea level observations from Swedish Meteorological and Hydrological Institute and Swedish Maritime Administration, SMHI's Open data service [data set], https://www.smhi.se/data/hav-och-havsmiljo/havsvattenstand/ (last access: 9 March 2026), 2025.
Swedish Meteorological and Hydrological Institute, Danish Meteorological Institute, Finnish Meteorological Institute, Federal Maritime and Hydrographic Agency, and TalTech (Tallin University of Technology): NEMO BAL MFC EIS-202411, Zenodo [code], https://doi.org/10.5281/zenodo.14507734, 2024.
Wehde, H., von Schuckmann, K., Pouliquen, S., Grouazel, A., Bartolome, T., Tintore, J., De Alfonso Alonso-Munoyerro, M., Carval, T., Racapé, V., and the INSTAC team: EU Copernicus Marine Service Quality Information Document for the Baltic Sea- In Situ Near Real Time Observations, INSITU_BAL_PHYBGCWAV_DISCRETE_MYNRT_013_032, Issue 2.4, Mercator Ocean International, https://documentation.marine.copernicus.eu/QUID/CMEMS-INS-QUID-013-030-036.pdf (last access: 15 May 2025), 2024.
Weisse, R., Dailidienė, I., Hünicke, B., Kahma, K., Madsen, K., Omstedt, A., Parnell, K., Schöne, T., Soomere, T., Zhang, W., and Zorita, E.: Sea level dynamics and coastal erosion in the Baltic Sea region, Earth Syst. Dynam., 12, 871–898, https://doi.org/10.5194/esd-12-871-2021, 2021.