the Creative Commons Attribution 4.0 License.
the Creative Commons Attribution 4.0 License.
 | 02 Jun 2025 | OPSR | Chapter 6.1
An introduction to operational chains in ocean forecasting
Liying Wan
Marcos Garcia Sotillo
Mike Bell
Yann Drillet
Roland Aznar
Stefania Ciliberti
Operating the ocean value chain requires the implementation of steps that must work systematically and automatically to generate ocean predictions and deliver ocean data information in standard format. This task, which represents the backbone of operational forecasting systems, implies the design of robust workflows that organize pre-processing of the upstream data, run the core models, and handle post-processing before the final delivery. Operational chains require dedicated computational resources to supply demanding modeling runs but also processing and analysis of big volumes of data in relation to the specific spatial scale and consistently for the forecast lead times. The monitoring of each step of the workflow through key performance metrics can support not only timely delivery but also identifying problems and troubleshooting. The paper illustrates the main challenges foreseen by operational chains in integrating complex numerical frameworks from the global to coastal scale and discusses existing tools that facilitate orchestration of operational chain components, including examples of existing systems and their consolidated capacity to provide high-quality and timely ocean forecasts.
- Article
(1547 KB) - Full-text XML
- BibTeX
- EndNote


Operational ocean forecasting systems integrate advanced numerical modeling, aimed at resolving ocean dynamics and processes from the global to coastal scale, and robust computational suites that are devoted to running models and orchestrating different data pre- and post-processing blocks, with the ultimate goal of providing high-quality and reliable ocean forecasts to enhance decision-making, monitoring, and planning for the sustainable use of ocean resources. In the last years, ocean observations – from remote sensing (Gould et al., 2013) and in situ (Le Traon et al., 2015) platforms – available for operational oceanography have increased in number, quality, and timeliness, making it possible to improve ocean models, to validate numerical ocean products, and to support monitoring activities (Tonani et al., 2015; Davidson et al., 2019). Data assimilation techniques, aimed at blending the observations into the model, have evolved numerically to provide the most accurate description of the past and the best initial conditions for the forecast. As computing power has increased, numerical solvers have evolved towards high-resolution models that can capture small-scale features enabling global, regional, and coastal simulations and predictions at higher resolution and over longer time spans. The numerical information produced is then processed to make it usable by operational applications and services. Some recent ocean modeling examples in support of operational ocean and coastal services are compiled in Sect. 4.2. Therefore, as shown in Chap. 4 of Alvarez Fanjul et al. (2022), the architecture of an operational ocean forecasting system includes pre-processing of ocean observations, quality control assessments, objective analysis, data assimilation, initial field generation, numerical forecasting, and data post-processing, together with the generation and dissemination of products. All these steps have influenced the evolution of forecasting systems from a technological point of view to accommodate the need to harmoniously interconnect complex steps towards final delivery to users. Section 2 provides an overview of the technical characteristics of processing suites that guarantee reliable operations and product provision.
The objective of an operational chain is to systematically and automatically perform a series of complex numerical steps to ensure the generation of ocean predictions and the delivery of related products to end users. The main phases of its workflow are pre-processing, modeling component runs, and post-processing. Figure 1 shows, as an example, the overall workflow of the chain implemented for the Global Ocean Forecasting System operated by NMEFC (China). Here, the main steps, as designed for the specific operational system, include data pre-processing, data assimilation, numerical simulation, and production for final delivery.
Pre-processing consists of accessing and preparing upstream data (i.e., observations, atmospheric forcings, and other model outputs to be used as boundary conditions) to be ingested by the modeling component. In the case of ocean observations, it is responsible for collection, transmission, analysis, and quality control. The time consumption of data assimilation depends on the amount of data used and on their complexity. Ocean models also need atmospheric forcing fields. Indeed, the performance of ocean operational forecasting systems is very sensitive to the type of atmospheric forcing used (Li et al., 2021), and atmospheric forecasting variables need to be collected and interpolated into the ocean model grid to compute wind stress, surface heat fluxes, or surface water exchanges. The time needed for the preparation of the atmospheric forcing, usually part of the first step of an operational suite, depends firstly on the (scheduled) atmospheric model forecast availability and secondly on the computational efficiency, as well as the computational efficiency in having the atmospheric forcing data ready to be used by the ocean model.
Other forcing data sources, such as freshwater inputs from river discharges, are progressively being included in ocean forecast models. Unlike in global ocean models, in regional models, this pre-processing block must include the preparation of the necessary data (usually from a global or basin model) that will be imposed as boundary conditions along the open boundaries of the regional domain.
Incorporating observations (from both satellites and in situ platforms) into an ocean model via data assimilation is desirable for operational forecasting (and reanalysis) systems to obtain accurate estimates of the ocean state (Tonani et al., 2015) and initial conditions for the forecast. Complex methodologies are developed and implemented in oceans forecasting chain that are strongly linked to the ocean model used, to the model resolution, and to the observations assimilated using different classes of data assimilation (Cummings et al., 2009)
Running an ocean model is the most complex and demanding part of the operational chain. Numerical models include physical parameterizations and solvers for the numerical integration of the Navier–Stokes equations. This complexity can be computationally demanding, so by employing parallel computing, we can distribute this workload across multiple cores. This allows us to run high-resolution ocean models faster. Hence, the use of multiple cores and parallelization is crucial in state-of-the-art ocean modeling.
Once the model run is complete, the resulting data must be post-processed by interpolating the numerical outputs (if needed) onto specific regular spatial grids and by applying procedures aimed at transforming the raw model data into a standardized format (e.g., CF-compliant; https://cfconventions.org, last access: 28 February 2025). Such post-processing must be executed afterwards as an independent process or in parallel while the model is running.
Finally, the ocean forecast products are released directly to users through different specific dissemination mechanisms (such as FTP, THREDDS, web services and API, and cloud-based solutions).
From a computational point of view, the execution of an operational chain may require significant computing resources, while the number of cores used must be such that the forecast is produced on time: they can therefore be executed in dedicated clusters, benefitting from heterogeneous computing capabilities by using CPU or GPU resources.
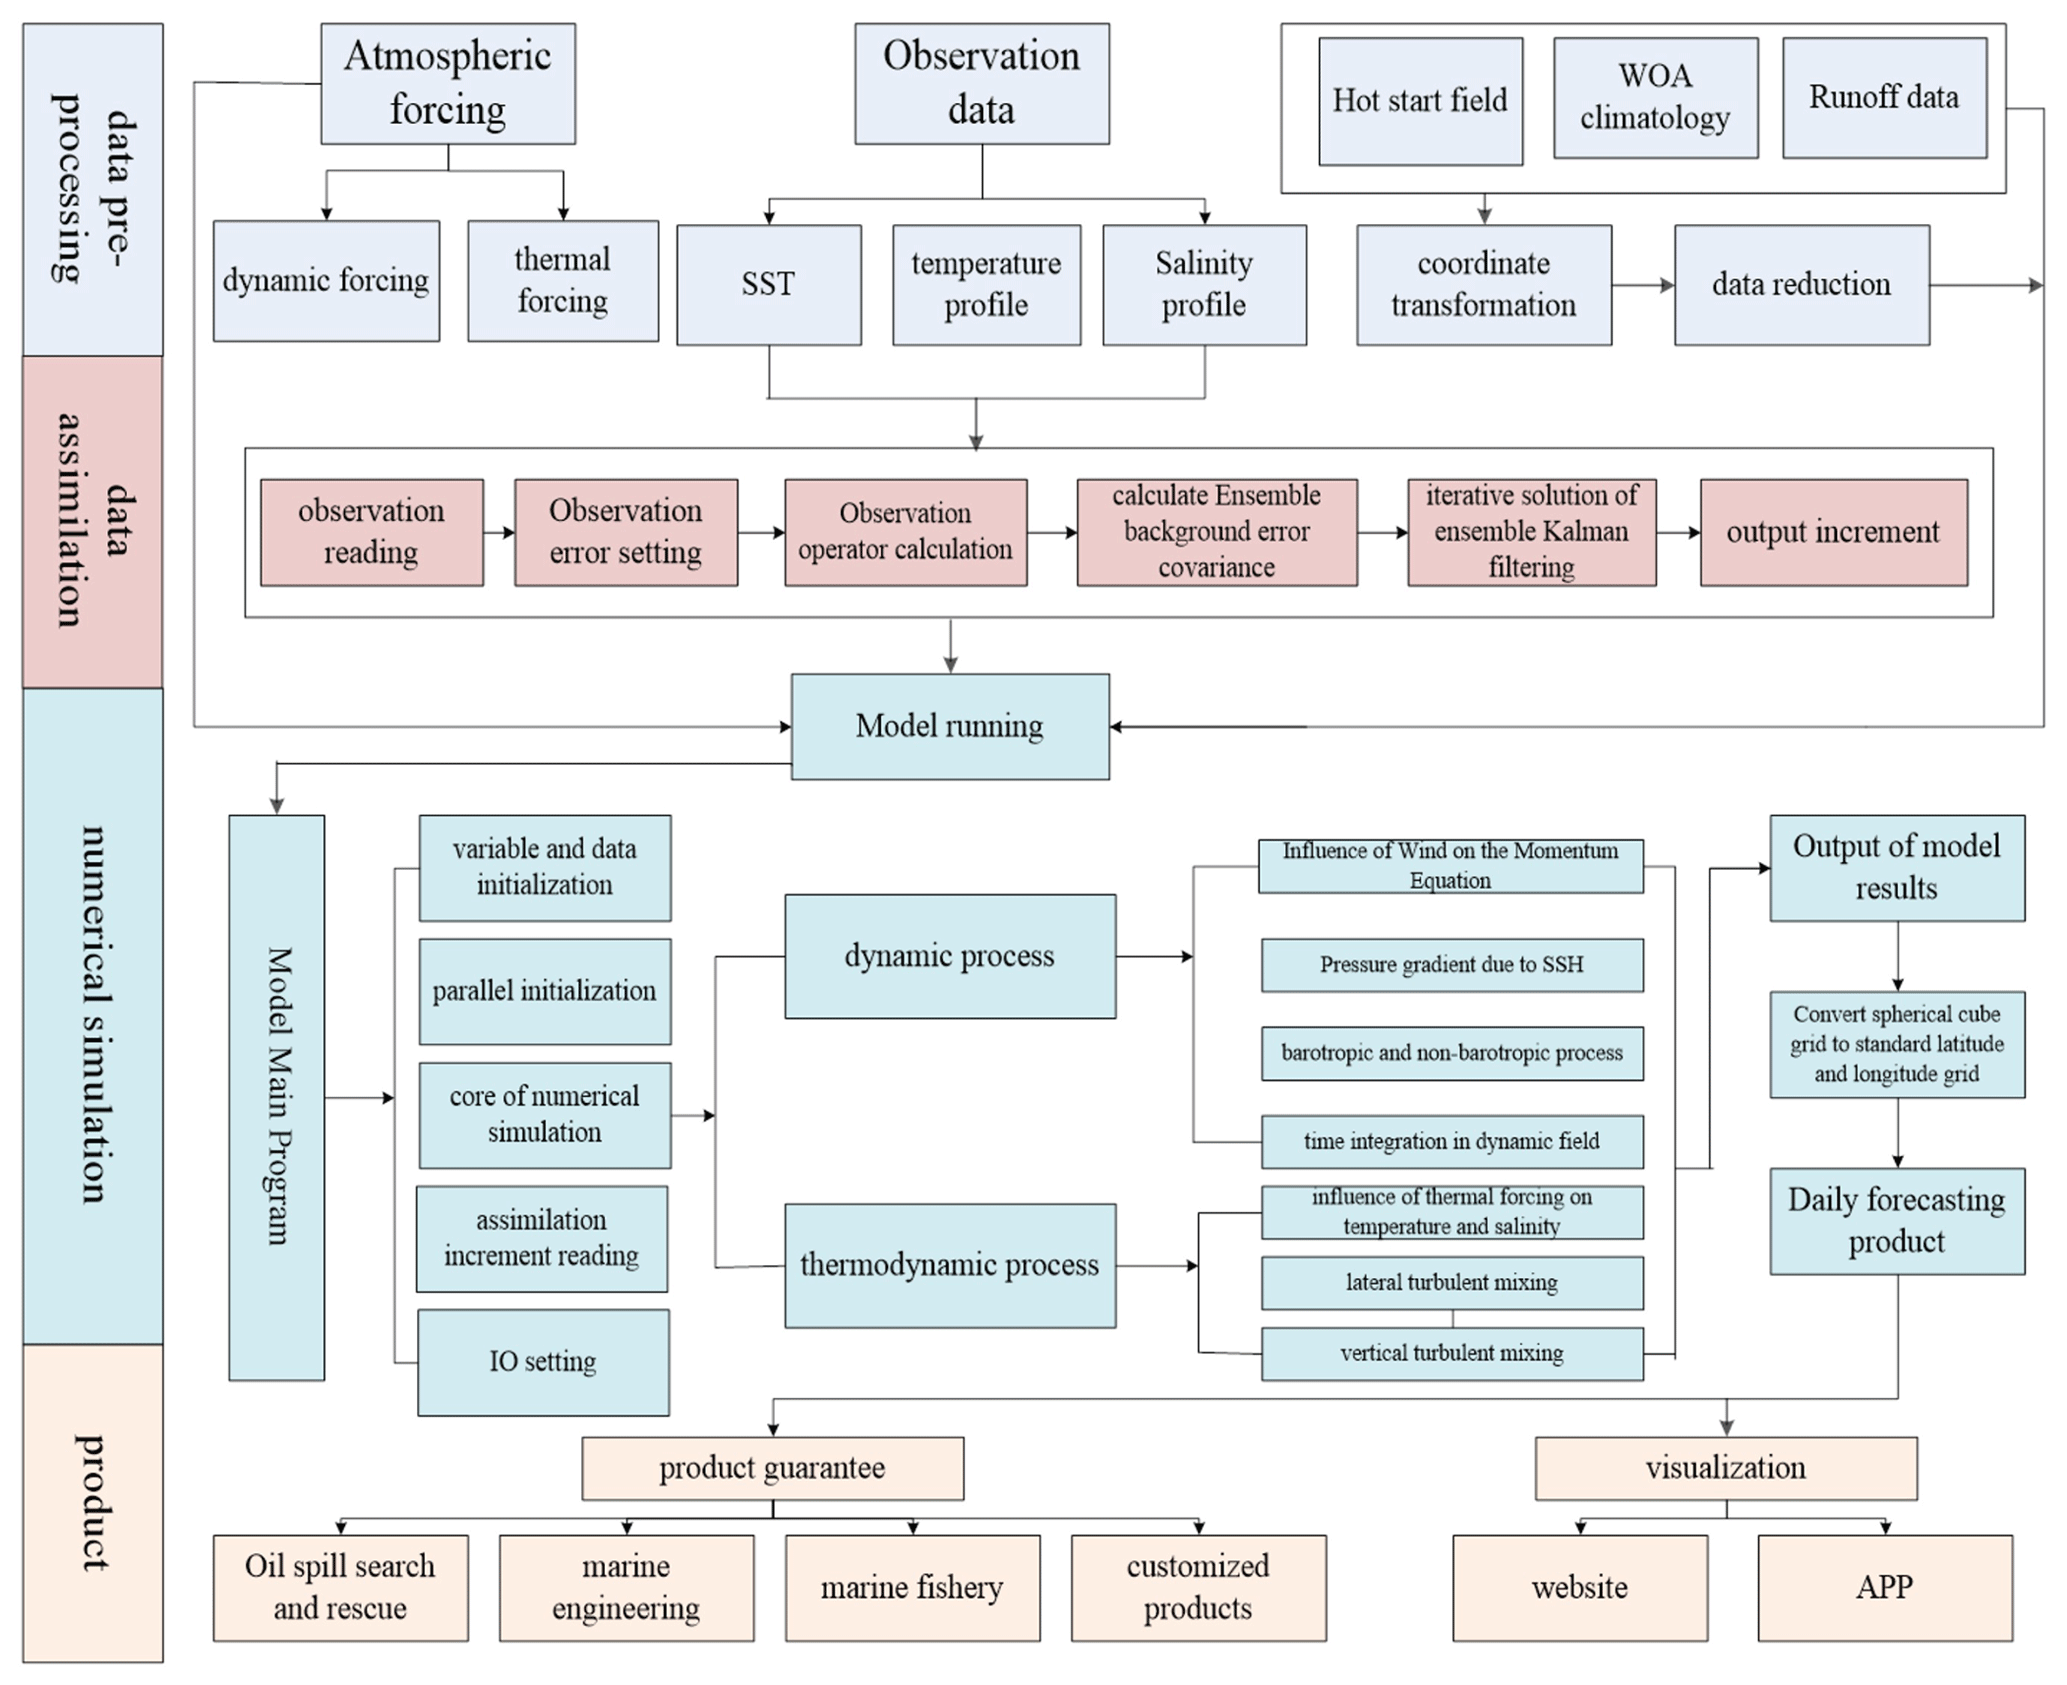
Figure 1Operational chain of an ocean forecasting system (example of a global system in NMEFC, China).
The operational chain is then required to orchestrate a complex sequence of tasks in a flexible and efficient way, allowing for monitoring and troubleshooting. When designing an operational chain, it is important to decide which programming language is most appropriate for coding each task belonging to each of the main steps: this choice depends on the characteristics of the numerical procedure to be adopted for solving a specific task. For example, for acquisition of upstream data from various external databases or data stores, the forecaster can adopt the following.
-
Bash or Shell scripting offers functions like wget or curl for accessing files made available by a provider, as well as cron for scheduling its execution.
-
Python codes are available for accessing data through web APIs (for example, the Copernicus Marine Toolbox that is a Python-based tool for accessing the Copernicus Marine Data Store) and for performing some initial basic manipulation (i.e., subsetting in space and time, interpolation to target grid).
The ocean model couple to data assimilation scheme is technically much more complex to run and there are also some compilation and performance requirements to be met. The operational chain is then instructed to launch a task that submits each model run to be executed directly on the dedicated core(s) or to a job scheduler that verifies resource availability. In addition, the ocean model itself is usually coded in a pre-defined programming language (such as Fortran, C/C, or other) and can be executed in parallel mode using MPI/OpenMP or GPU-based parallel paradigms (i.e., CUDA, OpenCL, OpenACC).
Data post-processing, product generation, and product delivery can usually be done in parallel during the model run time as independent tasks from the overall workflow: again, it can adopt procedures coded in Bash/Shell, Python, Julia, or other interpreted languages that can guarantee flexibility, simplicity, and preliminary data analysis tasks.
The operational chain workflow engine can be coded ad hoc to sequentially organize the tasks to be executed. A basic approach can be determined through the implementation of a software package that includes the following:
-
A main script, designed to collect the specific tasks and subtasks as requested by the operational chain
-
A list of scripts, each representing the task to execute
-
One or more specific scripts that are designed to track the status of the operational chain execution by creating logs to further support monitoring
The evolution of this approach towards systematic monitoring of the overall workflow and automatic detection of issues are represented by the adoption of a workflow manager. It is a tool that assists the forecaster in orchestrating complex sequences of tasks, including detection of anomalies during the execution and supporting the seamless processing of information. The workflow manager adopted by the Earth science community includes the following.
-
ECFLOW (https://confluence.ecmwf.int/display/ECFLOW, last access: 28 February 2025), developed by ECMWF
-
Cylc (https://cylc.github.io/, last access: 28 February 2025)
Others, extensively used by industry but also progressively chosen by forecasting centers, are the following.
-
Apache Airflow (https://airflow.apache.org, last access: 28 February 2025)
-
Prefect (https://www.prefect.io/, last access: 28 February 2025)
To ensure that an operational ocean forecasting system delivers accurate and timely products, it is necessary to identify metrics that can be implemented for measuring performances and that can support the resolution of potential anomalies and issues.
Based on the analysis performed in Ciliberti et al. (2023), the main properties of an operational forecasting system that can be used to monitor its performance are as follows.
-
Quality certifies that the delivered product or service consistently performs well and provides useful results. This can be measured by providing relevant metrics aimed at measuring the degree to which the forecast product matches the observation (through validation exercises).
-
Reliability refers to whether the user can rely on the forecast product to make decisions. As shown by the World Climate Service (https://www.worldclimateservice.com/2020/07/06/what-is-forecast-reliability/, last access: 28 February 2025), it is a measure of the quality of a probability forecast that varies between 0 % (i.e., the a posteriori observation is never in the forecast range) and 100 % (i.e., the a posteriori observation is always in the forecast range).
-
Timeliness is a measure of the time between the expectation that the information will be available and the time when it is actually available for use. To save time, it is usual to execute in parallel two or three parts of the operational chain. However, not all parts can run in parallel. Pre-processing and data assimilation should be finished before the ocean model starts running. In contrast, post-processing, product generation, and release can be done in parallel with model running. Timeliness management depends on characteristics of different cases or different user needs. With coupled and ensemble model development, it is difficult to have a strict time control.
-
Accessibility refers to the capacity for a user to get access to forecast product, including authentication and authorization (if needed).
-
Usability involves the adoption of standards for data and metadata to ensure that the product can be used well and is self-describing. Data with a defined file format, adequate documentation, and high quality can be used and reused. This metric can be measured through user surveys.
Timeliness management depends on characteristics of different cases or different user needs. With coupled and ensemble model development, it is difficult to have a strict time control (Liu et al., 2018).
The adoption of a workflow engine facilitates the monitoring phase of the operational chain workflow. Figure 2 illustrates an example of how an operational forecasting service needs to monitor all the components of a specific operational suite to generate the proper KPIs (key performance indicators) that should later be managed to ensure timely service. The example shows how all the elements previously discussed, such as pre-processing, model execution, and post-processing of raw model outputs, together with some time dedicated to the data push to catalogs and later storage, are included in this operational monitoring performed by the Copernicus Marine Iberia–Biscay–Irish Monitoring and Forecasting Center (IBI-MFC) for its operational suites. This control of the different components is recommended and helps operators to identify issues in the operational suites and in the environment that could potentially lead to incidents. Likewise, this monitoring by component helps to manage delays in the service related to different types of incidents. The operational KPIs for service timeliness that are usually used to verify that the service is meeting the timeliness requirements stated in its proposed service level agreement (SLA) are computed using the time statistics provided daily by these time control monitoring processes. This monitoring is also important to identify and manage temporary incidents or continuous problems that may result in service delays or product outages.
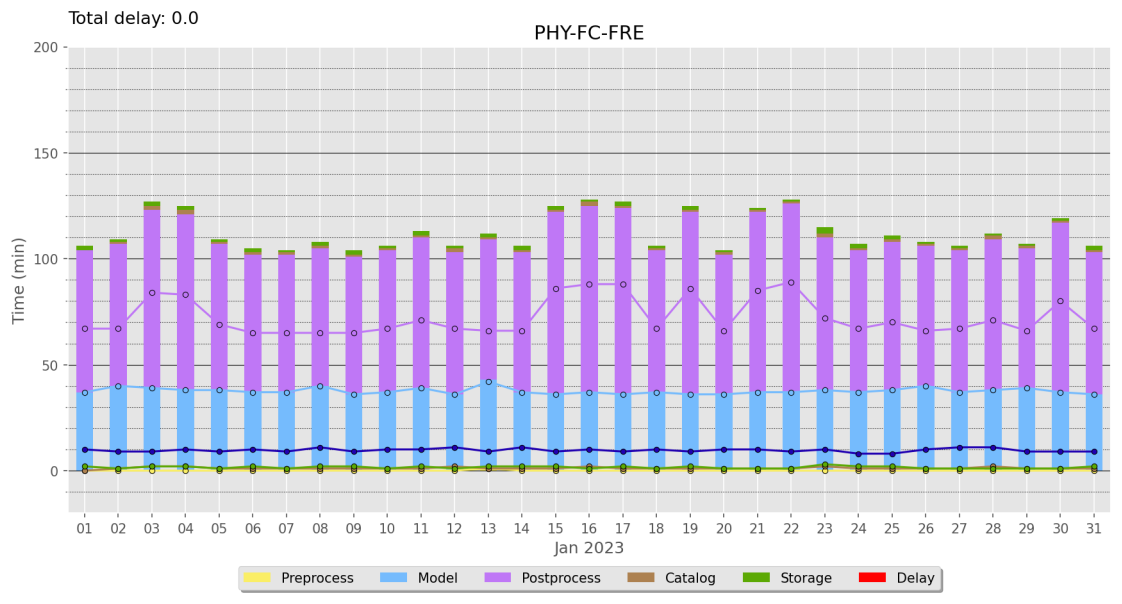
Figure 2Example from the Copernicus Marine IBI-MFC Service Monitoring. Monthly summary statistics (for January 2023) from the time control monitoring performed for the IBI physical forecast operational suite. Monitoring of all the operational suite components (i.e., input data pre-processing, model execution, post-processing of raw model outputs, and processes to push products into the catalogs and later storage) is included.
It is important to outline and summarize some general characteristics a user needs to consider in the setup of numerical ocean models for ocean forecasting.
-
Infrastructure aspects.
-
It is highly desirable that a model performs well on most of the most powerful HPCs available. In practice, this requires that the code is parallelized (using domain decomposition with MPI and/or OpenMP), is not excessively memory-bound (particularly on CPU machines), and supports the low-level parallel processing required by GPUs. This requires analysis of the scalability and portability of the code as well as the restartability and reproducibility of the numerical ocean model solution.
-
Workflow tools can support proper monitoring of the computing process workflow and facilitate troubleshooting as well as scalability of the operational configuration.
-
The network is an essential element in the infrastructure of an operational chain; it must allow an effective link between the distribution centers upstream and downstream of the production centers.
-
Storage must be linked to the HPC center to ensure effective back-up of production and enable production to be restarted if necessary.
-
-
Interfaces. To appropriately handle the spatiotemporal scale of the ocean process that requires reproduction, the following steps are necessary.
-
Select a proper state-of-the-art option for subgrid-scale parameterization: if the option is incompatible, the model should be able to generate an error message and stop.
-
Use state-of-the-art bathymetries for the setup of new configurations. The user should also be able to use and specify smoothing techniques that can be applied to avoid model instabilities while also taking into account the topographical peculiarities that can play a fundamental role, especially in coastal models.
-
Specify time-varying river inflows (i.e., discharges, nutrients) as inputs, generated from climatologies or from real-time data (e.g., from observations).
-
Specify surface fluxes of momentum, heat, and freshwater and ancillary data such as surface temperatures and surface wave fields.
-
Couple the model to models of other physical systems (e.g., atmospheric, sea ice, or wave models) through one or more of the standard coupling systems (e.g., OASIS, US system); in some cases (like with waves and sea ice) alternative or ad hoc coupling approaches should be provided.
-
Run biogeochemical (BGC) models as part of the overall integration (on line coupling) or generate data to run the BGC model in offline mode.
-
Interface the ocean model with data assimilation systems.
-
Generate restart and diagnostic files in a flexible manner.
-
-
Design and documentation. To meet quality assurance requirements, it is highly desirable that the model
-
has a clear design,
-
has a well-chosen modularity,
-
is easily readable,
-
is written in a familiar language (such as Fortran90 or Python),
-
has a user guide and a developer guide, and
-
can be further developed without excessive effort.
-
-
Sustained support. The model needs to be sustainably supported by a lead agency, a consortium of agencies, a committed user community, or a combination of the above. This support should aim to ensure the following.
-
The model's formulation is improved as the state of the art evolves.
-
Novel improvements are documented in peer-reviewed publications.
-
The code documentation is openly available and kept up to date.
-
The code is openly accessible or made available subject to “legal” agreement (which might include, e.g., a commitment by a new user to contribute to further developments and testing of source code).
-
New users are supported by instructions for setting up relatively simple configurations which can easily be compiled and run and outputs can be checked.
-
New releases of the code are properly version-controlled.
-
The methods by which the code is verified are described in its documentation.
-
The results from standard test cases are made publicly available (an aspiration at this stage).
-
The data and code are available from the websites, which are all mentioned in the paper:
-
Argos data: ftp://ftp.ifremer.fr/ifremer/argo/latest_data (Argo Program Office, 2025)
-
TOGA data: https://www.pmel.noaa.gov/gtmba/ (Global Tropical Moored Buoy Array, 2025)
-
SLA data: https://doi.org/10.48670/moi-00149 (CMEMS, 2022a)
-
SST data: https://doi.org/10.48670/moi-00165 (CMEMS, 2022b)
-
MERCATOR reanalysis: https://doi.org/10.48670/moi-00021 (CMEMS, 2022c)
Other data are available from the authors upon request.
All the co-authors share common authority and made contributions.
At least one of the (co-)authors is a member of the editorial board of State of the Planet. The peer-review process was guided by an independent editor, and the authors also have no other competing interests to declare.
Publisher's note: Copernicus Publications remains neutral with regard to jurisdictional claims made in the text, published maps, institutional affiliations, or any other geographical representation in this paper. While Copernicus Publications makes every effort to include appropriate place names, the final responsibility lies with the authors.
This work was supported by the National Key Research and Development Program of China (grant no. 2021YFC3101504) and the National Natural Science Foundation of China (grant no. 42176030).
Liying Wan was supported by the National Key Research and Development Program of China (grant no. 2021YFC3101504) and the National Natural Science Foundation of China (grant no. 42176030). Stefania Ciliberti, Roland Aznar, and Marcos Sotillo contributed to this publication as experts from the Copernicus Marine Service for the IBI region (funded within the framework of the Copernicus Marine Service EU (CMEMS) contracts 21002L6-COP-MFC IBI-5600 and 24252-COP-MFC-5000-Lot6). Mike Bell’s research has been supported by the Met Office Hadley Centre Climate Programme.
This paper was edited by Enrique Álvarez Fanjul and reviewed by two anonymous referees.
Alvarez Fanjul, E., Ciliberti, S., and Bahurel, P.: Implementing Operational Ocean Monitoring and Forecasting Systems, IOC-UNESCO, GOOS-275, https://doi.org/10.48670/ETOOFS, 2022.
Argo Program Office: Global Argo Centers and Programs, ftp://ftp.ifremer.fr/ifremer/argo/latest_data, last access: 12 March 2025.
Ciliberti, S. A., Alvarez Fanjul, E., Pearlman, J., Wilmer-Becker, K., Bahurel, P., Ardhuin, F., Arnaud, A., Bell, M., Berthou, S., Bertino, L., Capet, A., Chassignet, E., Ciavatta, S., Cirano, M., Clementi, E., Cossarini, G., Coro, G., Corney, S., Davidson, F., Drevillon, M., Drillet, Y., Dussurget, R., El Serafy, G., Fennel, K., Garcia Sotillo, M., Heimbach, P., Hernandez, F., Hogan, P., Hoteit, I., Joseph, S., Josey, S., Le Traon, P.-Y., Libralato, S., Mancini, M., Matte, P., Melet, A., Miyazawa, Y., Moore, A. M., Novellino, A., Porter, A., Regan, H., Romero, L., Schiller, A., Siddorn, J., Staneva, J., Thomas-Courcoux, C., Tonani, M., Garcia-Valdecasas, J. M., Veitch, J., von Schuckmann, K., Wan, L., Wilkin, J., and Zufic, R.: Evaluation of operational ocean forecasting systems from the perspective of the users and the experts, in: 7th edition of the Copernicus Ocean State Report (OSR7), edited by: von Schuckmann, K., Moreira, L., Le Traon, P.-Y., Grégoire, M., Marcos, M., Staneva, J., Brasseur, P., Garric, G., Lionello, P., Karstensen, J., and Neukermans, G., Copernicus Publications, State Planet, 1-osr7, 2, https://doi.org/10.5194/sp-1-osr7-2-2023, 2023.
Cummings, J., Bertino, L., Brasseur, P., Fukumori, I., Kamachi, M., Martin, M. J., Mocensen, K., Oke, P., Testut, C. E., and Verron, J., Weaver, A.: Ocean data assimilation systems for GODAE, Oceanography, 22.3, 96–109, 2009.
Davidson, F., Alvera-Azcárate, A., Barth, A., Brassington, G. B., Chassignet, E. P., Clementi, E., De Mey-Frémaux, P., Divakaran, P., Harris, C., Hernandez, F., Hogan, P., Hole, L.R., Holt, J., Liu, G., Lu, Y., Lorente, P., Maksymczuk, J., Martin, M., Mehra, A., Melsom, A., Mo, H., Moore, A., Oddo, P., Pascual, A., Pequignet, A.-C., Kourafalou, V., Ryan, A., Siddorn, J., Smith, G., Spindler, D., Spindler, T., Stanev, E. V., Staneva, J., Storto, A., Tanajura, C., Vinayachandran, P. N., Wan, L., Wang, H., Zhang, Y., Zhu, X., and Zu, Z.: Synergies in operational oceanography: the intrinsic need for sustained ocean observations, Frontiers in Marine Science, 6, 450, https://doi.org/10.3389/fmars.2019.00450, 2019.
E.U Copernicus Marine Service Information (CMEMS): Global Ocean Gridded L 4 Sea Surface Heights And Derived Variables Nrt, CMEMS [data set], https://doi.org/10.48670/moi-00149, 2022a.
E.U Copernicus Marine Service Information (CMEMS): Global Ocean OSTIA Sea Surface Temperature and Sea Ice Analysis, CMEMS [data set], https://doi.org/10.48670/moi-00165, 2022b.
E.U Copernicus Marine Service Information (CMEMS): Global Ocean Physics Reanalysis, CMEMS [data set], https://doi.org/10.48670/moi-00021, 2022c.
Global Tropical Moored Buoy Array: National Oceanic and Atmospheric AdministrationPacific Marine Environmental Laboratory, https://www.pmel.noaa.gov/gtmba/, last access: 12 March 2025.
Gould, J., Sloyan, B., and Visbeck, M.: In Situ Ocean Observations: A Brief History, Present Status, and Future Directions, Ocean Circulation and Climate, 103, 59–81, https://doi.org/10.1016/B978-0-12-391851-2.00003-9, 2013.
Le Traon, P.-Y., Antoine, D., Bentamy, A., Bonekamp, H., Breivik, L. A., Chapron, B., Corlett, G., Dibarboure, G., DiGiacomo, P., Donlon, C., Faugère, Y., Font, J., Girard-Ardhuin, F., Gohin, F., Johannessen, J. A., Kamachi, M., Lagerloef, G., Lambin, J., Larnicol, G., Le Borgne, P., Leuliette, E., Lindstrom, E., Martin, M. J., Maturi, E., Miller, L., Mingsen, L.; Morrow, R., Reul, N., Rio, M. H., Roquet, H., Santoleri, R., and Wilkin, J.: Use of satellite observations for operational oceanography: recent achievements and future prospects, J. Oper. Oceanogr., 8, s12–s27, https://doi.org/10.1080/1755876X.2015.1022050, 2015.
Li, M., Yu, X., and Li, Q.: Current status of US Navy operational ocean prediction system, Ship Science and Technology, 43, 181–185, 2021 (in Chinese).
Liu, N., Wang, H., Ling, T., and Zu Z.: Review and prospect of global operational ocean forecasting, Advances in Earth Sciences, 33, 131–140, https://doi.org/10.11867/j.issn.1001-8166.2018.02.0131, 2018 (in Chinese).
Tonani, M., Balmaseda, M., Bertino, L., Blockey, E., Brassington, G., Davidson, F., Drillet, Y., Hogan, P., Kurugano, T., Lee, T., Mehra, A., Paranathara, F., Tanajura, C. A. S., and Wang, H.: Status and future of global and regional ocean prediction systems, J. Oper. Oceanogr., 8, s201–s220, https://doi.org/10.1080/1755876X.2015.1049892, 2015.
- Abstract
- Introduction
- Technical characteristics of an operational chain for ocean forecasting
- Key performance metrics
- Other operational-chain-relevant aspects
- Code and data availability
- Author contributions
- Competing interests
- Disclaimer
- Acknowledgements
- Financial support
- Review statement
- References