the Creative Commons Attribution 4.0 License.
the Creative Commons Attribution 4.0 License.
 | 30 Sep 2024 | OSR8 | Chapter 2.4
Statistical analysis of global ocean significant wave heights from satellite altimetry over the past 2 decades
Alice Laloue
Malek Ghantous
Yannice Faugère
Alice Dalphinet
Lotfi Aouf
The analysis of global ocean surface waves and of long-term changes requires accurate time series of waves over several decades. Such time series have previously only been available from model reanalyses or from in situ observations. Now, altimetry provides a long series of observations of significant wave heights (SWHs) in the global ocean. The aim of this study is to analyse the climatology of significant wave heights and extreme significant wave heights derived from remote sensing in the global ocean and their long-term trends from 2002 to 2020 using different statistical approaches as the mean, the 95th percentile, and the 100-year return level of SWH. The mean SWH and the 95th percentile of SWH are calculated for two seasons: January, February, and March as well as July, August, and September and for each year. A trend is then estimated using linear regression for each cell in the overall grid. The 100-year return levels are determined by fitting a generalized Pareto distribution to all exceedances over a high threshold. The trend in 100-year return level is estimated using the transformed stationary approach, which, to our knowledge, is used for the first time to draw a global map based on altimetry. Predominantly large positive trends over 2002–2020 for both SWH and extreme SWH are mostly found in the Southern Hemisphere, including the South Atlantic, the Southern Ocean, and the southern Indian Ocean, which is consistent with previous studies. In the North Atlantic, SWH has increased poleward of 45° N, corroborating what was concluded in the Fifth IPCC Assessment Report; however, SWH has also largely decreased equatorward of 45° N in wintertime. The 100-year return levels of SWH have significantly increased in the North Atlantic and in the eastern tropical Pacific, where the cyclone tracks are located. Finally, in this study we find trends of SWH and 95th percentile of SWH over 2002–2020 to be much higher than those indicated in the literature for the period 1985–2018.
- Article
(3731 KB) - Full-text XML
- BibTeX
- EndNote


Increasing our understanding of global ocean surface waves, their variability, and their long-term interannual changes is important to climate research and to ocean and coastal applications. As mentioned in the Sixth IPCC Assessment Report, waves contribute to extreme sea level events (Mentaschi et al., 2017), flooding (Storlazzi et al., 2018), and coastal erosion (Barnard et al., 2017). They modify the ocean circulation and mediate air–sea (Donelan et al., 1997) and sea–ice interactions (Thomas et al., 2019).
The analysis of long-term and interannual changes in ocean surface waves requires accurate time series of waves spanning several decades. Thus far these records have only been available in global model reanalyses or from in situ observations. Unfortunately, observations from buoys can only provide local analyses and in situ wave observations are especially lacking in the Southern Hemisphere. Altimeters offer global and high-quality measurements of significant wave heights (SWHs) (Gommenginger et al., 2002). The growing satellite record of SWH now makes global and long-term analyses more accessible than ever before.
We use SWH observations from a multi-mission altimetric product over the period 2002–2020 to calculate global SWH and extreme SWH climatologies. Furthermore, trends in SWH and in extreme SWH are assessed. An identical analysis was performed with ERA5 (Hersbach et al., 2020) and WAVERYS (Law-Chune et al., 2021) reanalyses to compare with the literature. The multi-mission nature of our altimetric data, and their potential for bias, is then discussed in the context of long-term statistics.
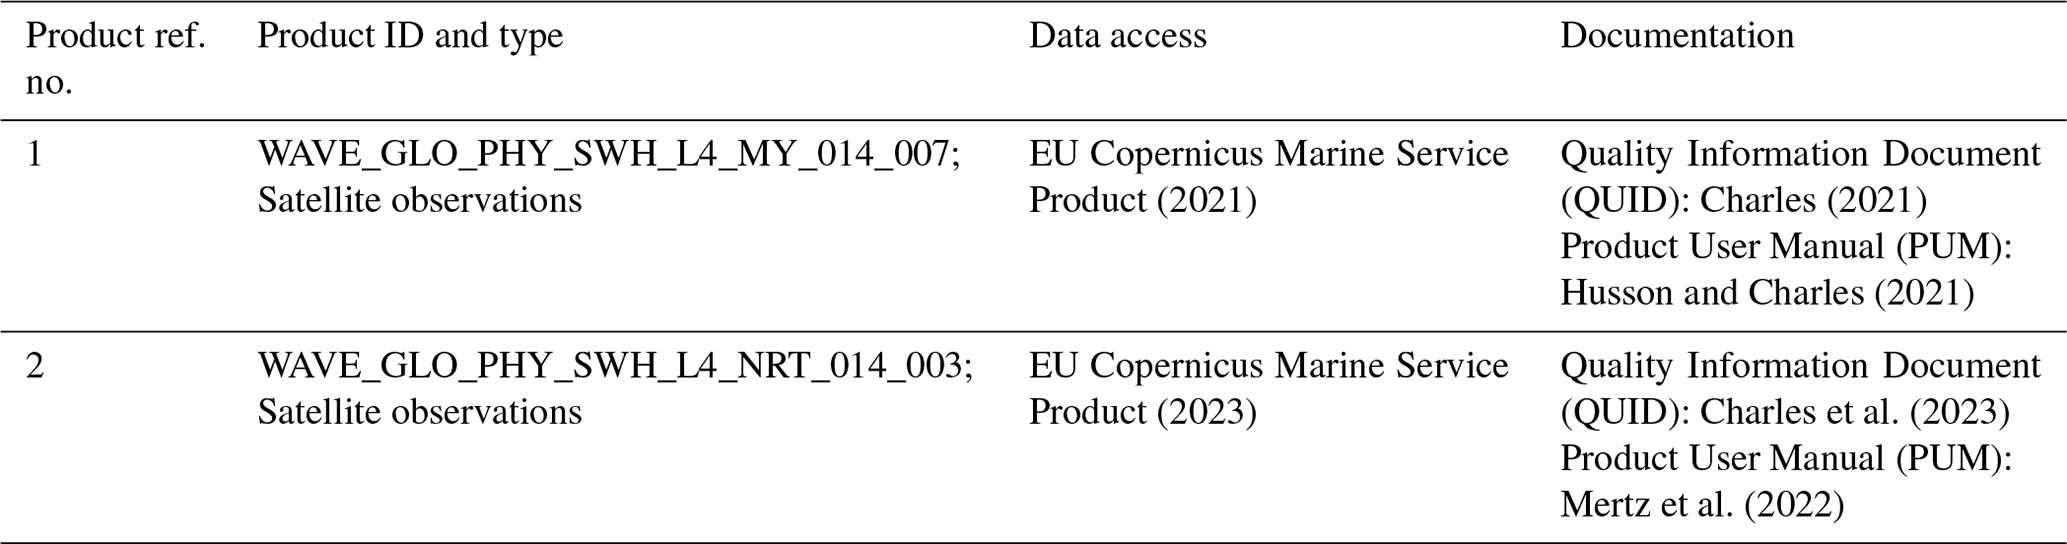
The level 4 (L4) altimetric time series of waves in the Copernicus Marine catalogue (Table 1, product reference 1) covers 19 years (2002–2020). It is based on Copernicus Marine Service multi-year L3 datasets and merges along-track measurements from seven different altimetric missions – Jason-1, Envisat, Jason-2, Cryosat-2, Saral/AltiKa, and CFOSat – and from up to four missions at the same time. Calibrated and filtered along-track measurements are then projected onto a 2° grid. Daily statistics (mean, maximum) are finally estimated for each grid cell.
We use this time series to calculate mean and extreme SWH climatologies and to assess long-term trends over the period 2002–2020. Meanwhile, the annual anomaly for 2022 is calculated as the difference between the climatology and the near-real-time time series (Table 1, product reference 2). The first part of our analysis is based on daily mean SWHs and 95th percentile (P95) daily maximum SWHs over the globe. The 95th percentile is the value where only 5 % of the values in the time series are over it. Data are resampled in monthly mean and percentiles of SWH for each grid cell. The climatological mean SWH and P95 are calculated for both January–February–March (JFM) and July–August–September (JAS) separately to take seasonal variability of waves into account.
Trends in daily mean SWH and in P95 daily maximum SWH were determined for each grid cell. We then focused on certain regions with significant trends. Trends were assessed using linear regressions, applied separately to the two seasonal datasets (JFM and JAS) as in Timmermans et al. (2020), and the significance of the resulting slopes was then tested at the 5 % level using a Wald test with a t distribution of the test statistic.
The second part of the analysis is focused on determining 100-year return levels that are likely to be exceeded, on average, once every hundred years (Goda, 2000) using the non-seasonal transformed stationary approach (Mentaschi et al., 2016) and on assessing their trends. Extreme value analysis (EVA) consists of modelling the SWH with a statistical distribution and estimating return levels associated with long return periods and small probabilities of occurrence. The EVA allowed us to study 100-year SWH with only a 19-year-long altimetric time series. All the values of SWH exceeding the 95th percentile and separated by at least 72 h were selected according to the peaks-over-threshold method. A generalized Pareto distribution (GPD) could then be fitted to the exceedances (see equation below). The return levels associated with the 100-year return period were estimated from this GPD.
with μ, ξ, and σ, which are the location, shape, and scale parameters.
The EVA has a major disadvantage in that it usually requires the time series to be stationary. The transformed stationary approach overcomes this issue by transforming the nonstationary altimetric time series y(t) into a stationary one x(t) through standardization (Eq. 1). The EVA is then applied to x(t), and the location μx and scale σx parameters of the GPD are estimated by maximizing the likelihood function. The reverse transformation (Eqs. 2, 3) is finally used to recover the time-varying parameters μy(t) and σy(t) associated with y(t), enabling us to obtain the nonstationary extreme SWH distribution and to assess its trend. The transformation from y(t) to x(t) and the reverse transformation of the shape, location, and scale parameters associated with the nonstationary series are given by
where Ty(t) and Sy(t) are the trend and the standard deviation of y(t), and μx, ξx, and σx are the parameters associated with the stationary series which are not dependent on time. To our knowledge, while this method has already been applied to ERA5 reanalysis (Takbash and Young, 2020), it has not been applied to altimetry at a global scale before. Thus, only results obtained using ERA5 can be compared with the literature. Finally, the same study was conducted for SWH from the ERA5 (Hersbach et al., 2020) and WAVERYS reanalyses (Law-Chune et al., 2021), as they allow for comparison with the literature (Timmermans et al., 2020) and the L4 altimetric time series.
Climatologies of SWH and of high SWH are shown in Figs. 1a and 2a, respectively. Energetic conditions in the Northern Hemisphere, driven by extratropical storms, occur predominantly in the midlatitudes, reaching up to 4.5–5.0 m on average in the North Atlantic and 4.0–4.5 m in the North Pacific during the JFM seasonal average. This contrasts with the seasonal average during JAS that reveals corresponding energetic conditions in the Indian Ocean and in the Southern Ocean up to 5.0–5.5 m, along with seasonal events such as the Asian monsoon, demonstrating higher wave height in the Arabian Sea and in the Bay of Bengal. The spatial structure of the P95 of SWH is consistent and shares similar patterns to those seen in Fig. 1, with greater magnitude. Indeed, the highest SWHs can locally reach up to 9.0–10.0 m in the North Atlantic, up to 8.0–9.0 m in the North Pacific (both in JFM), and up to 8.0–10.0 m in the Indian Ocean in JAS. Other energetic conditions associated with typhoons are also revealed in the Philippine Sea, leading to high SWH of up to 6.0 m in JAS. Smaller regional processes are also observed despite the poor spatial resolution of altimeters, such as waves of 4.0–5.0 m in the eastern Pacific driven by Tehuantepecer events in JFM.
Trends of SWH and of P95 of SWH are displayed Figs. 1c and 2c, respectively. Some of these trend patterns have already been described in previous studies (Young and Ribal 2019; Shimura et al., 2016). Overall, large and significant trends mostly appear in the Southern Hemisphere: in the Southern Ocean, in the sector south of Africa, and in the Indian Ocean south of Australia. Young and Ribal (2019) already highlighted the existence of a broad region of positive and significant trend in the 90th percentile of SWH across the Southern Ocean with altimetric data spanning 1985–2018. Patterns associated with positive trends in SWH and in the P95 of SWH south of Africa, south of Australia, and in the South Pacific seem to mostly coincide with this broad region, as well as the decreasing SWH in the Indian Ocean around 45° S. However, in contrast to Young and Ribal (2019), our trend in P95 of SWH in the North Atlantic is not as significant and positive. Moreover, significant trends are found in wintertime in forms of complex spatial patterns of increasing and decreasing wave heights in the North Atlantic and North Pacific. In agreement with Young and Ribal (2019), SWH in the North Pacific shows a distinct negative trend that is especially true in our case during wintertime. The negative trend of SWH in JFM in the western North Pacific also agrees with the decreasing winter wave heights in global climate models (Shimura et al., 2016). As in Timmermans et al. (2020), significant positive trends are also found in the North Atlantic and in the Gulf Stream region. Finally, the results depicted in Figs. 1 and 2 suggest that significant upper percentile trends are changing orders of magnitude faster than trends of mean SWH.
Anomalies of SWH and of P95 of SWH for 2022 are shown Figs. 1b and 2b, respectively. The average interannual variability of wintertime SWH is of the order of 0.13 m at tropical and subtropical latitudes and 0.30–0.40 m at midlatitudes, with regional excursions exceeding 0.40 m, while the interannual variability of extreme wave heights averages 0.33 m at tropical and subtropical latitudes and 0.70–0.80 m at midlatitudes, with regional excursions exceeding 0.85 m in summer in the typhoon region and 0.90 m in the Southern Ocean. Despite this high interannual variability, some SWH anomalies for 2022 are found to exceed it and seem consistent with long-term changes in SWH (Figs. 1c and 2c). Strong positive anomalies found in the North Atlantic and North Pacific around 60° N in winter and for both SWH and P95 of SWH mostly coincide with increasing SWH and P95 of SWH. While the negative anomalies in the North Atlantic and in the North Pacific may not exceed the interannual variability, they still partly coincide with corresponding trends.
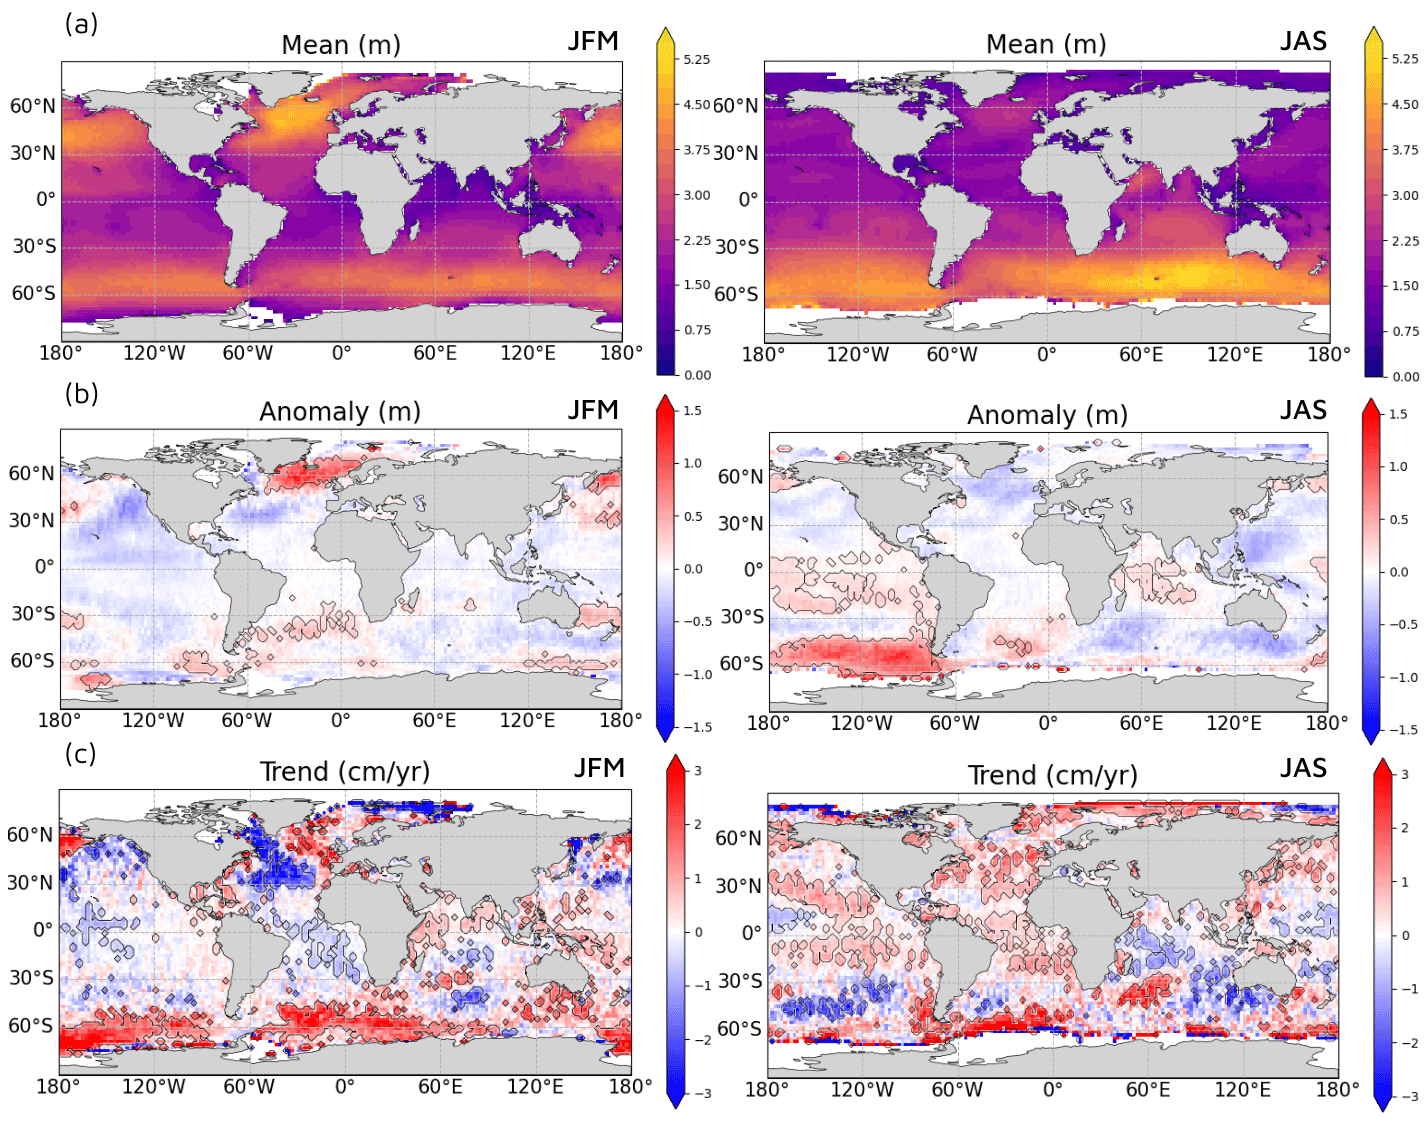
Figure 1SWH (a) climatology (2002–2020), (b) annual anomaly for 2022, and (c) annual trend (2002–2020) for both JFM (left column) and JAS (right column) from the L4 altimetric time series of daily mean SWH (product reference 1). Areas with an anomaly above 1.5 times the interannual variability are outlined in black. Areas with a trend statistically significant at the 95 % level are outlined in black.
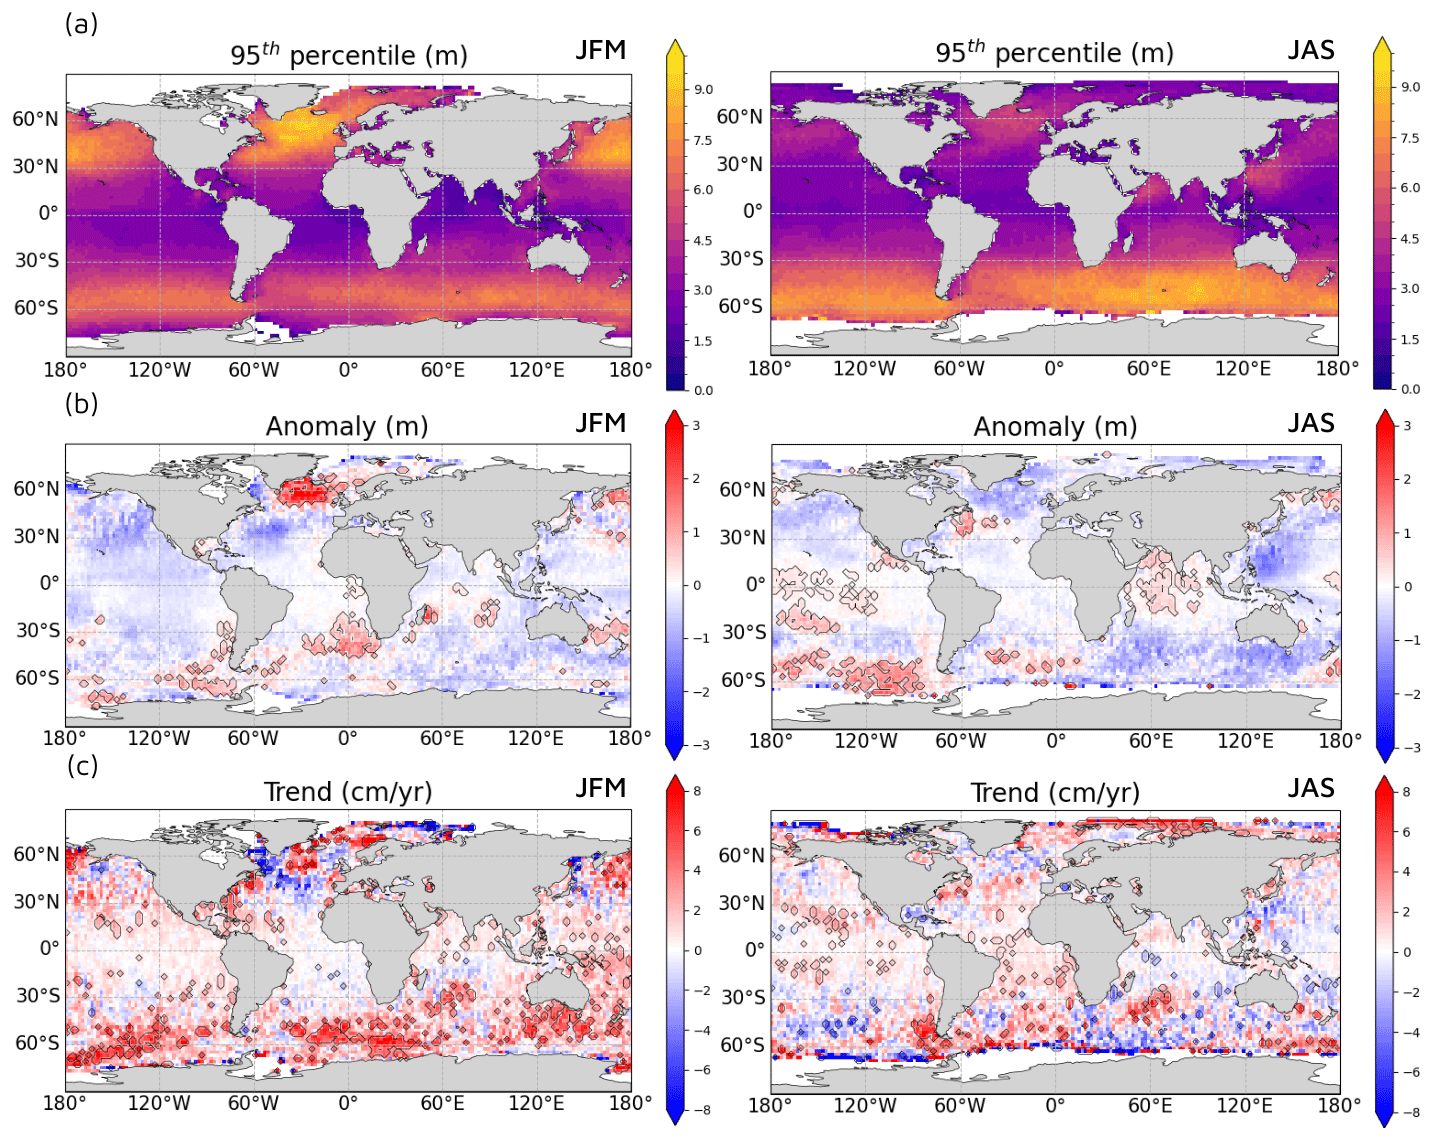
Figure 295th SWH percentile (a) climatology (2002–2020), (b) annual anomaly for 2022, and (c) annual trend (2002–2020) for both JFM (left column) and JAS (right column) from the L4 altimetric time series (product reference 1). Areas with an anomaly above 1.5 times the interannual variability are outlined in black. Areas with a trend statistically significant at the 95 % level are outlined in black.
The most energetic conditions on the map of 100-year return levels (see Fig. 3) can be found on a large scale in the North Atlantic and western North Pacific, driven by extratropical storms and typhoons, and on a smaller scale in the tropical eastern Pacific and Indian Ocean driven by hurricanes and tropical cyclones. As expected, the strongly positive trend patterns found in the Southern Hemisphere are consistent with those highlighted by the SWH and the P95 of SWH. However, while both SWH and P95 of SWH show decreasing trends in the North Atlantic in winter, the 100-year return level trends are largely positive. Certain regions also stand out with a very significant trend, in contrast to that observed in the P95 of SWH, such as the western North Pacific, the Gulf of Mexico, and the Caribbean Sea, which demonstrate strong negative trends contrary to what Takbash and Young (2020) found. On the other hand, as shown by Takbash and Young (2020), localized positive trends can also be found in the hurricane regions in the eastern tropical Pacific and in the typhoon regions; these increases were not visible in the trends in SWH and P95 of SWH.
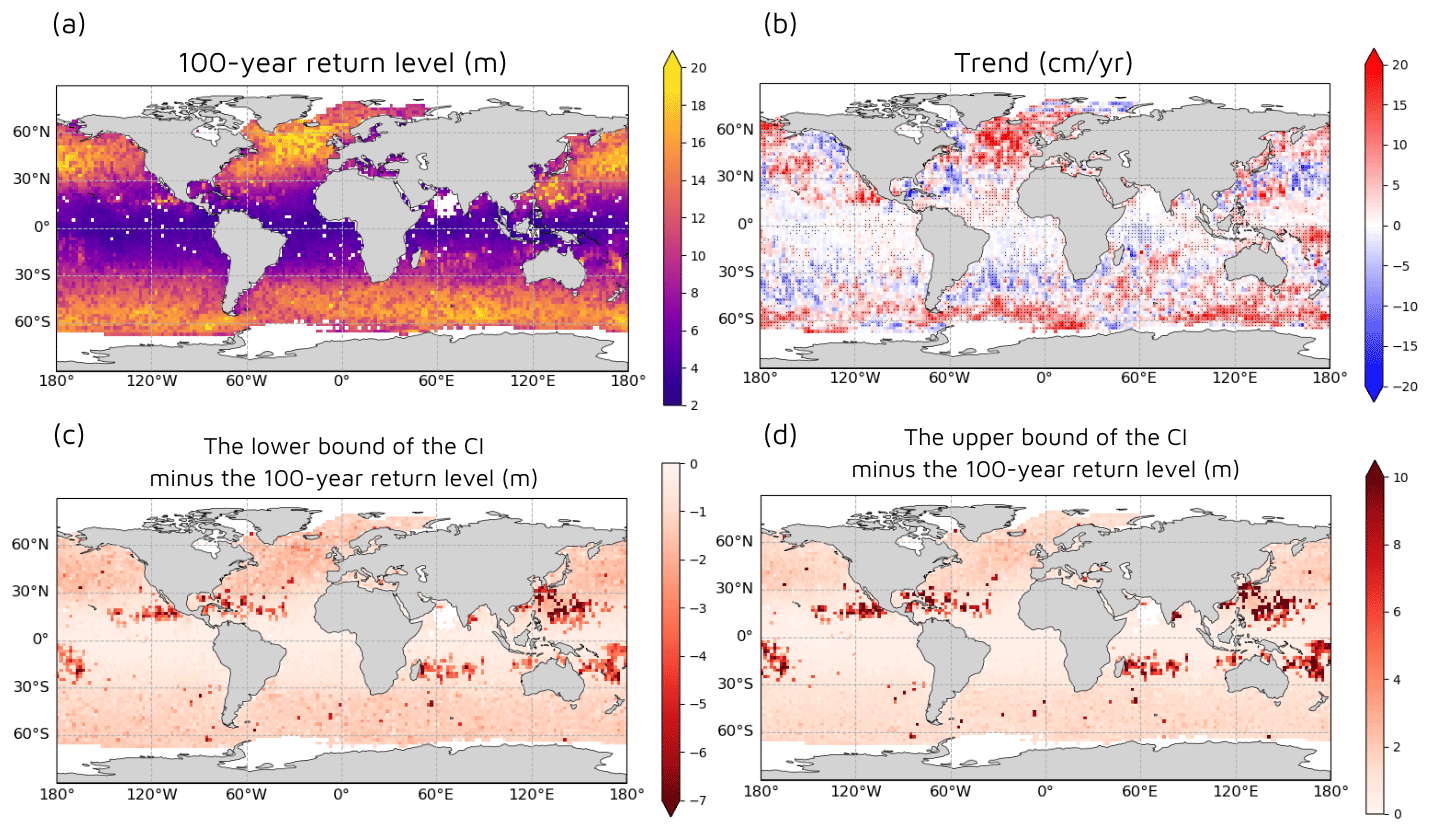
Figure 3(a) Average 100-year return levels and (b) their trends over 2005–2018 from the L4 altimetric time series (product reference 1) using the non-seasonal transformed stationary approach. Areas with a trend statistically significant at the 95 % level are indicated by grey dots. White pixels correspond to grid cells that do not meet the requirements for calculating return levels, such as the minimum number of points selected with the peaks-over-threshold method. (c, d) Difference between the 100-year return level and the lower and upper bounds of the 95 % confidence interval.
For comparison, the same figures were produced using ERA5 and WAVERYS data. Spatial patterns are mostly consistent among all three datasets. However, ERA5 and WAVERYS slightly underestimate the mean SWHs and their trends. ERA5 and WAVERYS overestimate the highest extreme waves and trends of P95 of SWH, especially in the Southern Hemisphere, but they underestimate 100-year return levels compared with altimetry as noted by Takbash and Young (2020).
In this study, we found large positive trends over 2002–2020 for both SWH and extreme SWH, mostly in the Southern Hemisphere, which are consistent with findings by Young and Ribal (2019). In the North Atlantic, SWH has increased north of 45° N, corroborating what was concluded in the Fifth IPCC Assessment Report (AR5), and in 2022, a large positive anomaly of SWH and extreme SWH was found in the same region. However, SWH has also largely decreased south of 45° N in JFM, contrary to Young and Ribal's (2019) findings. The 100-year return levels have significantly increased in the North Atlantic and in the eastern North Pacific, where the cyclone tracks are located. Finally, we found trends of SWH and P95 of SWH for JFM and JAS over 2002–2020 to be much higher than those indicated by Young and Ribal (2019) for the period 1985–2018.
The mean trends of SWH and P95 of SWH were estimated for regions where the trend in the grid cells was predominantly statistically significant in the multi-mission product (Fig. 4), such as in the North Atlantic (box 1), in the South Atlantic Ocean and Southern Ocean (box 2), and in the southern Indian Ocean (box 3). In JFM, the SWH increases by 1.8 ± 1.1 cm each year poleward of 45° N and decreases by 2.1 ± 0.76 cm each year equatorward of 45° N in the North Atlantic. In box 2, the SWH increases by 1.8 ± 0.41 cm each year in JFM and 1.2 ± 0.61 cm each year in JAS, and the P95 of SWH increases by 3.5 ± 1.9 cm each year in JFM. Finally, the P95 of SWH increases by 3.1 ± 1.7 cm per year in JFM in box 3.
Unfortunately, no uncertainty is provided for the SWH data from the multi-mission product, so only an uncertainty in the trend adjustment and annual statistics could be calculated. The major concern regarding the estimates of the trends of daily mean SWH and P95 daily maximum SWH is the fact that the number of satellites combined in the multi-mission product has increased over time (Charles, 2021). This concern was previously addressed by Young and Ribal (2019) in relation to their own multi-mission altimetric product. With more satellites, the number of along-track measurements available from which daily statistics are estimated and the number of days available increase. Consequently, daily statistics are more frequent and precise at the end of the period than at the beginning. For example, it is likely that more storms or extreme waves were sampled by the altimeters in the latter years of the period than in the former. The distribution of SWH is not Gaussian and is largely affected by extreme events, hence producing a spurious positive trend in SWH. In addition, due to the polar altimeter orbits, the number of observations also varies with latitude.
A series of tests were performed to evaluate the effect of the increasing number of satellites on the trends. A new L4 altimetric time series was created by combining only two satellites at a time to serve as a means of comparison for the L4 multi-mission product. This new product only extends to 2019, so the two products were compared over the period 2002–2019. The SWH trends that are statistically significant for both products are plotted in Fig. 4. The time series differ from each other starting from 2008 with the introduction of more satellites in the multi-mission product, whereupon the number of observations doubles (Fig. 3b, c, d). The mean SWH is not greatly affected by the number of satellites and the trends of mean SWH are almost identical. On the other hand, the P95 daily maximum SWH is sensitive to the increase in the number of observations and the multi-mission product overestimates its trends compared with the two-satellite product. More importantly, the sign of the trend does not change, the spatial patterns of the trend are mostly consistent between the products, and trends in the two-satellite product are contained within the uncertainty of trends in the multi-mission product. However, as the two-satellite product is more consistent over time, the long-term trends measured with it may be more accurate than those measured with the multi-mission product.
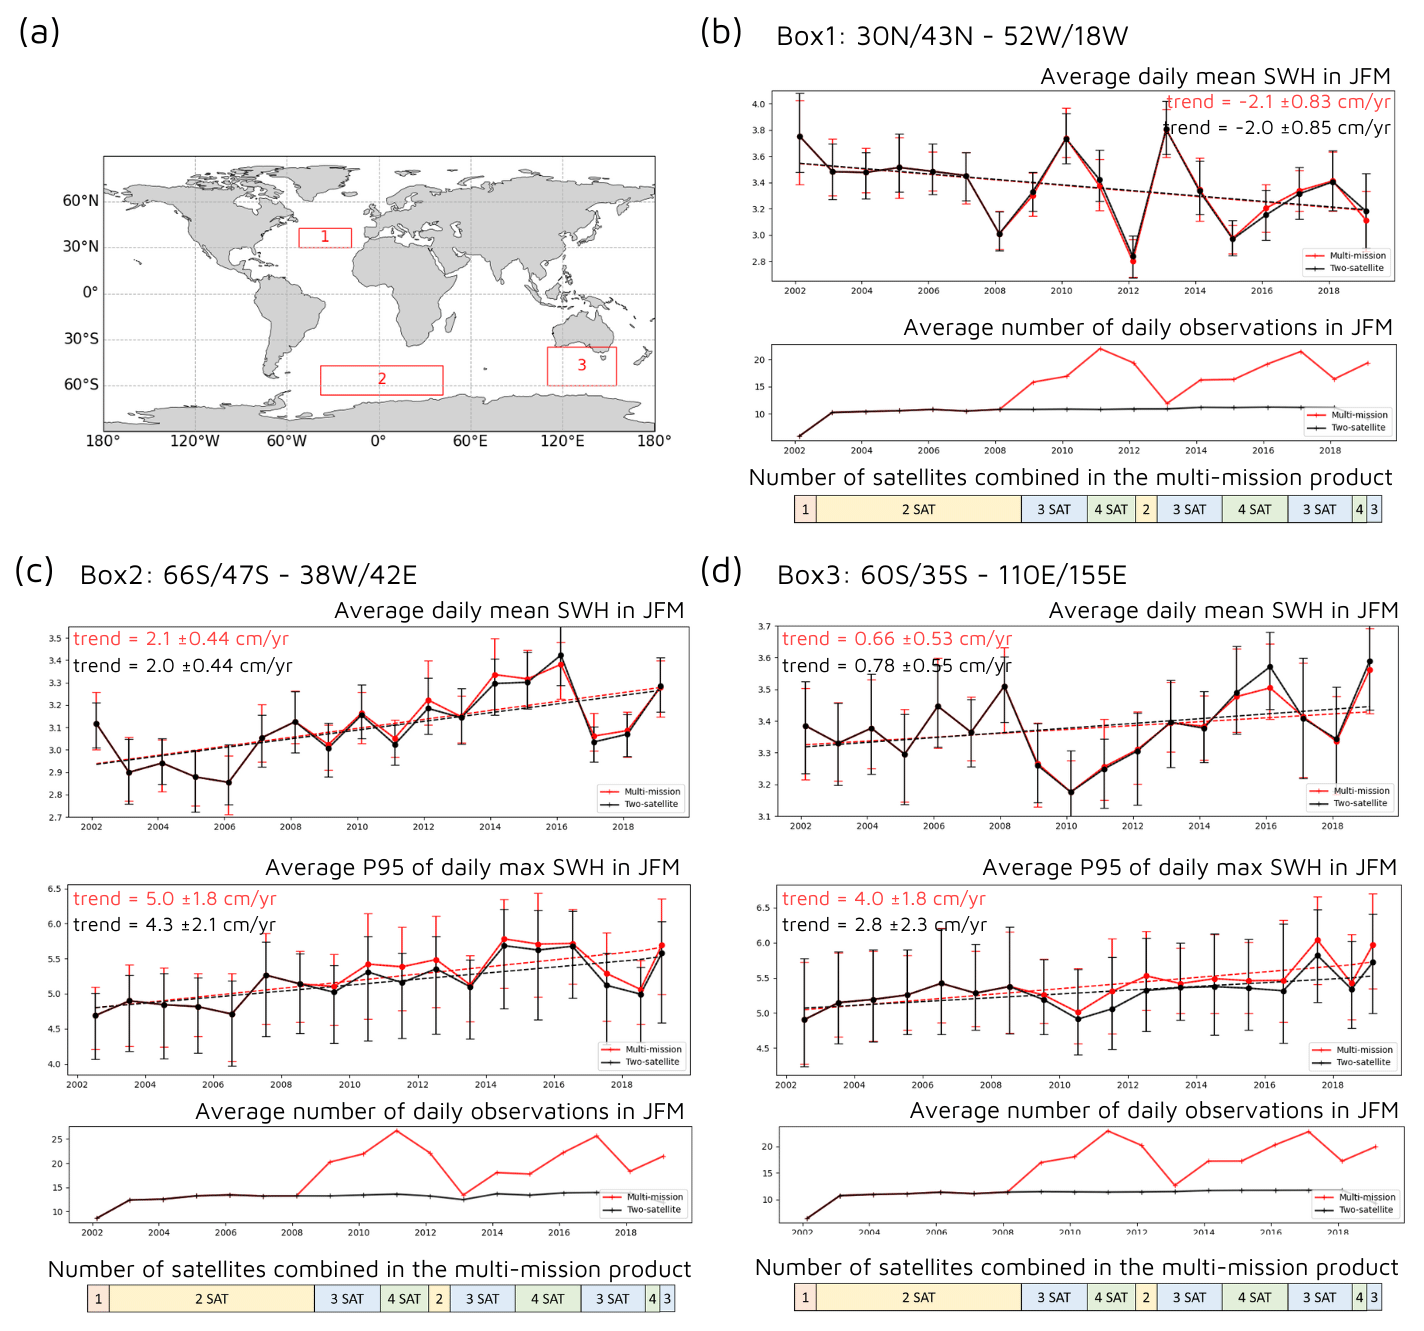
Figure 4Effects of the number of satellites on the long-term trends in L4 altimetric time series. (a) Boxes in which regional trends were computed. Box 1: 30–43° N, 52–18° W; box 2: 66–47° S, 38° W–42° E; box 3: 60–35° S, 110–155° E. (b–d) Time series of daily mean SWH, of P95 daily maximum SWH, and of the daily number of observations in JFM averaged on a yearly basis, associated with each box. The bootstrap 95 % confidence interval is represented with error bars. In red: the L4 multi-mission product (product reference 1); in black: L4 two-satellite product. Trends are represented by dashed lines when statistically significant for both products. Finally, the number of satellites combined in the multi-mission product is represented by coloured blocks as a function of time as in Charles (2021).
There is a strong positive trend in the Southern Hemisphere which has also been observed in other studies and in reanalyses. However, the altimeter observations have been calibrated and validated using in situ observations almost entirely located in the Northern Hemisphere and near coastlines (Charles and Ollivier, 2021), potentially biasing the altimetry record. Although the trends should themselves be robust, caution should nevertheless be exercised in interpreting this result until more Southern Hemisphere and open-ocean in situ observations can be included in the calibration.
Finally, the EVA gave us a good initial estimate of SWH extremes based on altimetry measurements, in line with the literature. However, these results must be treated with caution, as the altimeter series is very short (less than 20 years), so few measurements could be selected to estimate the GPD parameters. Similarly, the measurement period is not necessarily representative of a longer time series. This ultimately leads to large confidence intervals for the extreme values estimated. In addition, the transformed stationary approach used assumes that the GPD shape parameter is constant, which is valid in most cases but may prove false in some.
We have derived global ocean wave and extreme wave height climatologies and their trends for the period 2002–2020 based on the mean, the 95th percentile, and the 100-year return level of SWH from an L4 altimetric time series. To our knowledge, this is the first time that a global 100-year return level trend map has been drawn from an altimeter series using the transformed stationary method. The climatologies and trends computed from satellite altimetry were very similar to ERA5 and WAVERYS.
Over the last 2 decades, predominantly large positive 2022 anomalies of SWH and significant 2002–2020 trends are mostly found in the Southern Hemisphere. Large significant positive trends in mean SWH and P95 of SWH are found in the South Atlantic, the Southern Ocean, and the southern Indian Ocean (up to 1.2 ± 0.61 cm yr−1 for the SWH, up to 3.5 ± 1.9 cm yr−1 for the P95 of SWH). According to the AR5, as winds are likely to strengthen in the Southern Hemisphere, this trend could be confirmed in the future. SWH has increased above 45° N in the North Atlantic (1.76 ± 1.14 cm yr−1), corroborating what was concluded in the AR5 from ship observations and reanalysis-forced wave model hindcasts. In particular, a strong positive anomaly of SWH and P95 of SWH was found in this region in JFM 2022. However, contrary to Young and Ribal (2019), a strong decrease in SWH of nearly −2.1 ± 0.76 cm yr−1 has also been observed in the altimetric record over the last 19 years in JFM in the North Atlantic below 45° N. Moreover, all the trends of SWH and P95 of SWH calculated in this study for JFM and JAS over 2002–2020 are much greater than those indicated by Young and Ribal (2019) over the period 1985–2018. The global maps of SWH extremes highlight the regions heavily affected by storms, such as the western North Pacific, the North Atlantic, and the eastern tropical Pacific. Trends in 100-year return levels seem to indicate an increase in wave levels linked to this energetic activity.
The L4 altimetric time series merges between one and four missions at a time. While the number of satellites does not impact the sign of the trends, it can affect their magnitudes, indicating that there is a need for a long, global, and more homogeneous altimetric time series. Additionally, this study reveals the need for knowledge of uncertainties. A new product was generated as part of this study to assess the effect of the number of satellites on the results. The conclusions given above nevertheless remain unchanged.
The code can be retrieved by contacting the corresponding author by e-mail.
The data used in this study can be downloaded directly from the Copernicus Marine Service website. The exact product names are given in Table 1, and the associated DOIs are indicated in the references.
AL conceptualized the statistical analysis and carried it out. MG provided the two-satellite altimetric time series used in the discussion. MG, YF, AD, and LA supervised the study and provided guidance. AL prepared the manuscript with contributions from MG.
The contact author has declared that none of the authors has any competing interests.
The Copernicus Marine Service catalog is periodically updated to ensure that it remains at the cutting edge of quality and user needs. In the process, some of these products may then be removed, replaced or renamed.
Should you require assistance with any of these products, please do not hesitate to contact the user support team, who will be able to answer your questions and find suitable solutions.
Publisher’s note: Copernicus Publications remains neutral with regard to jurisdictional claims made in the text, published maps, institutional affiliations, or any other geographical representation in this paper. While Copernicus Publications makes every effort to include appropriate place names, the final responsibility lies with the authors.
This research has been supported by the Copernicus Marine Service.
This paper was edited by Joanna Staneva and reviewed by two anonymous referees.
Barnard, P. L., Hoover, D., Hubbard, D. M., Snyder, A., Ludka, B. C., Allan, J., Kaminsky, G. M., Ruggiero, P., Gallien, T. W., Gabel, L., McCandless, D., Weiner, H. M., Cohn, N., Anderson, D. L., and Serafin, K. A.: Extreme oceanographic forcing and coastal response due to the 2015–2016 El Niño, Nat. Commun., 8, 14365, https://doi.org/10.1038/ncomms14365, 2017.
Charles, E.: EU Copernicus Marine Service Quality Information Document for the Global Ocean L 4 Significant Wave Height From Reprocessed Satellite Measurements Product, WAVE_GLO_PHY_SWH_L4_MY_014_007, Issue 1.0, Mercator Ocean International, https://catalogue.marine.copernicus.eu/documents/QUID/CMEMS-WAV-QUID-014-007.pdf (last access: 21 July 2023), 2021.
Charles, E. and Ollivier, A.: EU Copernicus Marine Service Quality Information Document for the Global Ocean L3 Significant Wave Height From Reprocessed Satellite Measurements Product, WAVE_GLO_PHY_SWH_L3_MY_014_005, Issue 1.0, Mercator Ocean International, https://catalogue.marine.copernicus.eu/documents/QUID/CMEMS-WAV-QUID-014-005.pdf (last access: 27 July 2023), 2021.
Charles, E., Taburet, N., Husson, R., Philip, A., and Ghantous, M.: EU Copernicus Marine Service Quality Information Document for the Global Ocean L 4 Significant Wave Height From Nrt Satellite Measurements Product, WAVE_GLO_PHY_SWH_L4_NRT_014_003, Issue 1.5, Mercator Ocean International, https://catalogue.marine.copernicus.eu/documents/QUID/CMEMS-WAV-QUID-014-003.pdf, last access: 21 July 2023
Donelan, M. A., Drennan, W. M., and Katsaros, K. B.: The air–sea momentum flux in conditions of wind sea and swell, J. Phys. Oceanogr., 27, 2087–2099, https://doi.org/10.1175/1520-0485(1997)027<2087:tasmfi>2.0.co;2, 1997.
EU Copernicus Marine Service Product: Global Ocean L 4 Significant Wave Height From Reprocessed Satellite Measurements, Mercator Ocean International [data set], https://doi.org/10.48670/moi-00177, 2021.
EU Copernicus Marine Service Product: Global Ocean L 4 Significant Wave Height From Nrt Satellite Measurements, Mercator Ocean International [data set], https://doi.org/10.48670/moi-00180, 2023.
Goda, Y.: Random seas and design of maritime structures, World Scientific Publishing Co., Statistical Analysis of Extreme Waves, 377–425, https://doi.org/10.1142/9789812385444_0011, 2000.
Gommenginger, C. P., Srokosz, M. A., Challenor, P. G., and Cotton, P. D.: Development and validation of altimeter wind speed algorithms using an extended collocated Buoy/Topex dataset, IEEE T. Geosci. Remote, 40, 251–260, https://doi.org/10.1109/36.992782, 2002.
Hersbach, H., Bell, B., Berrisford, P., Hirahara, S., Horányi, A., Muñoz-Sabater, J., Nicolas, J., Peubey, C., Radu, R., Schepers, D., Simmons, A., Soci, C., Abdalla, S., Abellan, X., Balsamo, G., Bechtold, P., Biavati, G., Bidlot, J., Bonavita, M., Chiara, G., Dahlgren, P., Dee, D., Diamantakis, M., Dragani, R., Flemming, J., Forbes, R., Fuentes, M., Geer, A., Haimberger, L., Healy, S., Hogan, R. J., Hólm, E., Janisková, M., Keeley, S., Laloyaux, P., Lopez, P., Lupu, C., Radnoti, G., Rosnay, P., Rozum, I., Vamborg, F., Villaume, S., and Thépaut, J. N.: The ERA5 global reanalysis, Q. J. Roy. Meteor. Soc., 146, 1999–2049, https://doi.org/10.1002/qj.3803, 2020.
Husson, R. and Charles, E.: EU Copernicus Marine Service Product User Manual for the Global Ocean L 4 Significant Wave Height From Reprocessed Satellite Measurements Product, WAVE_GLO_PHY_SWH_L4_MY_014_007, Issue 2.0, Mercator Ocean International, https://catalogue.marine.copernicus.eu/documents/PUM/CMEMS-WAV-PUM-014-005-006-007.pdf (last access: 21 July 2023), 2021.
Law-Chune, S., Aouf, L., Dalphinet, A., Levier, B., Drillet, Y., and Drevillon, M.: WAVERYS: A CMEMS global wave reanalysis during the altimetry period, Ocean Dynam., 71, 357–378, https://doi.org/10.1007/s10236-020-01433-w, 2021.
Mentaschi, L., Vousdoukas, M., Voukouvalas, E., Sartini, L., Feyen, L., Besio, G., and Alfieri, L.: The transformed-stationary approach: a generic and simplified methodology for non-stationary extreme value analysis, Hydrol. Earth Syst. Sci., 20, 3527–3547, https://doi.org/10.5194/hess-20-3527-2016, 2016.
Mentaschi, L., Vousdoukas, M. I., Voukouvalas, E., Dosio, A., and Feyen, L.: Global changes of extreme coastal wave energy fluxes triggered by intensified teleconnection patterns, Geophys. Res. Lett., 44, 2416–2426, https://doi.org/10.1002/2016gl072488, 2017.
Mertz, F., Husson, R., Taburet, N., Charles, E., Estimbre, J.-J.: EU Copernicus Marine Service Product User Manual for the Global Ocean L 4 Significant Wave Height From Nrt Satellite Measurements Product, WAVE_GLO_PHY_SWH_L4_NRT_014_003, Issue 2.2, Mercator Ocean International, https://catalogue.marine.copernicus.eu/documents/PUM/CMEMS-WAV-PUM-014-001-002-003-004.pdf (last access: 21 July 2023), 2022.
Shimura, T., Mori, N., and Hemer, M. A.: Variability and future decreases in winter wave heights in the Western North Pacific, Geophys. Res. Lett., 43, 2716–2722, https://doi.org/10.1002/2016gl067924, 2016.
Storlazzi, C. D., Gingerich, S. B., van Dongeren, A., Cheriton, O. M., Swarzenski, P. W., Quataert, E., Voss, C. I., Field, D. W., Annamalai, H., Piniak, G. A., and McCall, R.: Most atolls will be uninhabitable by the mid-21st century because of sea-level rise exacerbating wave-driven flooding, Science Advances, 4, eaap9741, https://doi.org/10.1126/sciadv.aap9741, 2018.
Takbash, A. and Young, I.: Long-Term and seasonal trends in global wave height extremes derived from ERA-5 reanalysis data, Journal of Marine Science and Engineering, 8, 1015, https://doi.org/10.3390/jmse8121015, 2020.
Thomas, S., Babanin, A. V., Walsh, K. J. E., Stoney, L., and Heil, P.: Effect of wave-induced mixing on Antarctic sea ice in a high-resolution ocean model, Ocean Dynam., 69, 737–746, https://doi.org/10.1007/s10236-019-01268-0, 2019.
Timmermans, B. W., Gommenginger, C. P., Dodet, G., and Bidlot, J.-R.: Global wave height trends and variability from new multimission satellite altimeter products, reanalyses, and wave buoys, Geophys. Res. Lett., 47, e2019GL086880, https://doi.org/10.1029/2019gl086880, 2020.
Young, I. R. and Ribal, A.: Multiplatform evaluation of global trends in wind speed and wave height, Science, 364, 548–552, https://doi.org/10.1126/science.aav9527, 2019.