the Creative Commons Attribution 4.0 License.
the Creative Commons Attribution 4.0 License.
 | 27 Nov 2023 | OAE Guide 2023 | Chapter 2
Seawater carbonate chemistry considerations for ocean alkalinity enhancement research: theory, measurements, and calculations
Lennart T. Bach
Andrew G. Dickson
Ocean alkalinity enhancement (OAE) is a proposed marine carbon dioxide removal (mCDR) approach that has the potential for large-scale uptake of significant amounts of atmospheric carbon dioxide (CO2). Removing anthropogenic legacy CO2 will be required to stabilise global surface temperatures below the 1.5–2 ∘C Paris Agreement target of 2015. In this chapter we describe the impacts of various OAE feedstocks on seawater carbonate chemistry, as well as pitfalls that need to be avoided during sampling, storage, and measurement of the four main carbonate chemistry parameters, i.e. dissolved inorganic carbon (DIC), total alkalinity (TA), pH, and CO2 fugacity (fCO2). Finally, we also discuss considerations in regard to calculating carbonate chemistry speciation from two measured parameters. Key findings are that (1) theoretical CO2 uptake potential (global mean of 0.84 mol of CO2 per mole of TA added) based on carbonate chemistry calculations is probably secondary in determining the oceanic region in which OAE would be best; (2) carbonate chemistry sampling is recommended to involve gentle pressure filtration to remove calcium carbonate (CaCO3) that might have been precipitated upon TA increase as it would otherwise interfere with a number of analyses; (3) samples for DIC and TA can be stabilised to avoid the risk of secondary CaCO3 precipitation during sample storage; and (4) some OAE feedstocks require additional adjustments to carbonate chemistry speciation calculations using available programs and routines, for instance if seawater magnesium or calcium concentrations are modified.
- Article
(3012 KB) - Full-text XML
- BibTeX
- EndNote


In the following sections the basic concepts of the seawater carbonate system are laid out, together with definitions of the key parameters.
1.1 Acid–base parameters and equilibrium chemistry
The acid–base equilibrium chemistry of seawater has been described in the Guide to Best Practices for Ocean CO2 Measurements (Dickson et al., 2007) and the carbonate chemistry chapter in the Guide to Best Practices for Ocean Acidification Research and Data Reporting (Dickson, 2010). These publications are open-access and provide practical guidance related to studying the carbon dioxide system in seawater. They describe tested approaches for measuring the four main parameters that are commonly used to constrain seawater acid–base chemistry and provide recommended values for the various equilibrium constants (as functions of salinity and temperature and at 1 atm total pressure). Another key resource, although not open-access, is the book CO2 in seawater: Equilibrium, Isotopes, Kinetics (Zeebe and Wolf-Gladrow, 2001), which offers comprehensive theoretical knowledge on all aspects relevant for carbonate-chemistry-related research, including ocean alkalinity enhancement (OAE).
The marine carbonate system can be constrained by knowing next to temperature, salinity, and pressure two carbonate chemistry parameters (Zeebe and Wolf-Gladrow, 2001). Additional data such as silicic acid or phosphate concentrations might also be required, although these have typically limited influence on carbonate chemistry speciation. Four carbonate chemistry parameters are commonly measured (carbonate ion concentration measurements are less common). These are
-
DIC – the total dissolved-inorganic-carbon (expressed as an amount content of carbon atoms, i.e. moles per kilogramme of seawater) in a sample of seawater (Eq. 1);
-
TA – the total alkalinity (expressed as an amount content of hydrogen ions that is equivalent to the bases – defined relative to a specified equivalence point) in a sample of seawater (Eq. 2);
-
pHT – a measure of the amount content of total hydrogen ions in a sample of seawater (Eq. 3);
-
fCO2 – the fugacity of carbon dioxide in air that is in solubility equilibrium with a sample of seawater (Eq. 4).
with [] denoting the sum of dissolved [CO2] and [H2CO3].
with the last two terms denoting minor contributions of additional proton acceptors and donors.
with [H+]F describing the free hydrogen ion concentration.
with K0 denoting the temperature- and salinity-dependent carbon dioxide solubility, or Henry's law constant. Another important carbonate chemistry concept is that of the calcium carbonate (CaCO3) saturation state (Eq. 5).
with Ksp describing the temperature-, salinity-, and pressure-dependent solubility product of a particular calcium carbonate morphotype such as calcite or aragonite and [Ca2+] and [] being respective in situ concentrations. When Ω is above 1 CaCO3 precipitation is thermodynamically favoured, while below 1 it is its dissolution.
The equilibrium constants for the amount contents of the various constituents of the acid–base equilibria in a sample of seawater are essentially dependent on the major ion composition of the seawater (usually approximated by the salinity); the temperature of the seawater; and the total pressure, i.e. water depth. Hence if salinity, temperature, or pressure of a seawater sample changes, the various equilibrium constants will necessarily change. Thus, the pHT and fCO2 of the seawater will change as a consequence, and it is important to note the salinity, temperature, and pressure at which the measurements were made. For TA and DIC this is not a problem. The individual amount contents of unionised dissolved carbon dioxide, bicarbonate ion, and carbonate ion each change as salinity, temperature, and/or pressure changes, but their total sum does not (the number of carbon atoms that are in an inorganic form is conserved). Of course, this assumes that any redox reactions involving carbon do not occur on the relatively short timescales appropriate to the changes in salinity, temperature, or pressure. The same applies to the sum of the individual TA components.
Any two of the five measurable parameters (DIC, TA, pHT, fCO2, and CO) can – in principle – be used together with salinity, temperature, and pressure (defining suitable equilibrium constants) to calculate the state of the carbon dioxide acid–base system in a seawater sample. The parenthetic note “in principle” is an acknowledgement that – as a consequence of errors in the measurements of these parameters and in the measurement of the associated equilibrium constants – the results from using alternate pairs of parameters will likely not be identical (Orr et al., 2018). When total alkalinity is used as a measured parameter, it implicitly incorporates all other acid–base equilibria occurring within the sample of seawater, i.e. in addition to the inorganic CO2 system (Eq. 2). This is relatively straightforward if the total amount content of each acid–base system present has been measured directly, can be calculated from sample salinity, or can safely be neglected. For each acid–base system considered, the acid-dissociation constants also need to be known. A useful consequence of the TA definition is that TA does not change when CO2 is in- or outgassing. However, there is a growing awareness that the presence of organic acids and bases in seawater can complicate the use of total alkalinity as a measurable parameter (see e.g. Fong and Dickson, 2019). The contribution of such species to total alkalinity is usually neglected, especially for open-ocean seawater samples.
1.2 Deffeyes diagrams
Deffeyes (1965) published a detailed description of how to use contour diagrams plotting individual seawater CO2 system properties as a function of total alkalinity and total dissolved inorganic carbon for seawater of a specified salinity and at a particular temperature (and pressure). Insofar as this chapter is aimed at studies of ocean alkalinity enhancement, we feel such diagrams may be useful to help visualise the compositional changes that are involved in such processes.
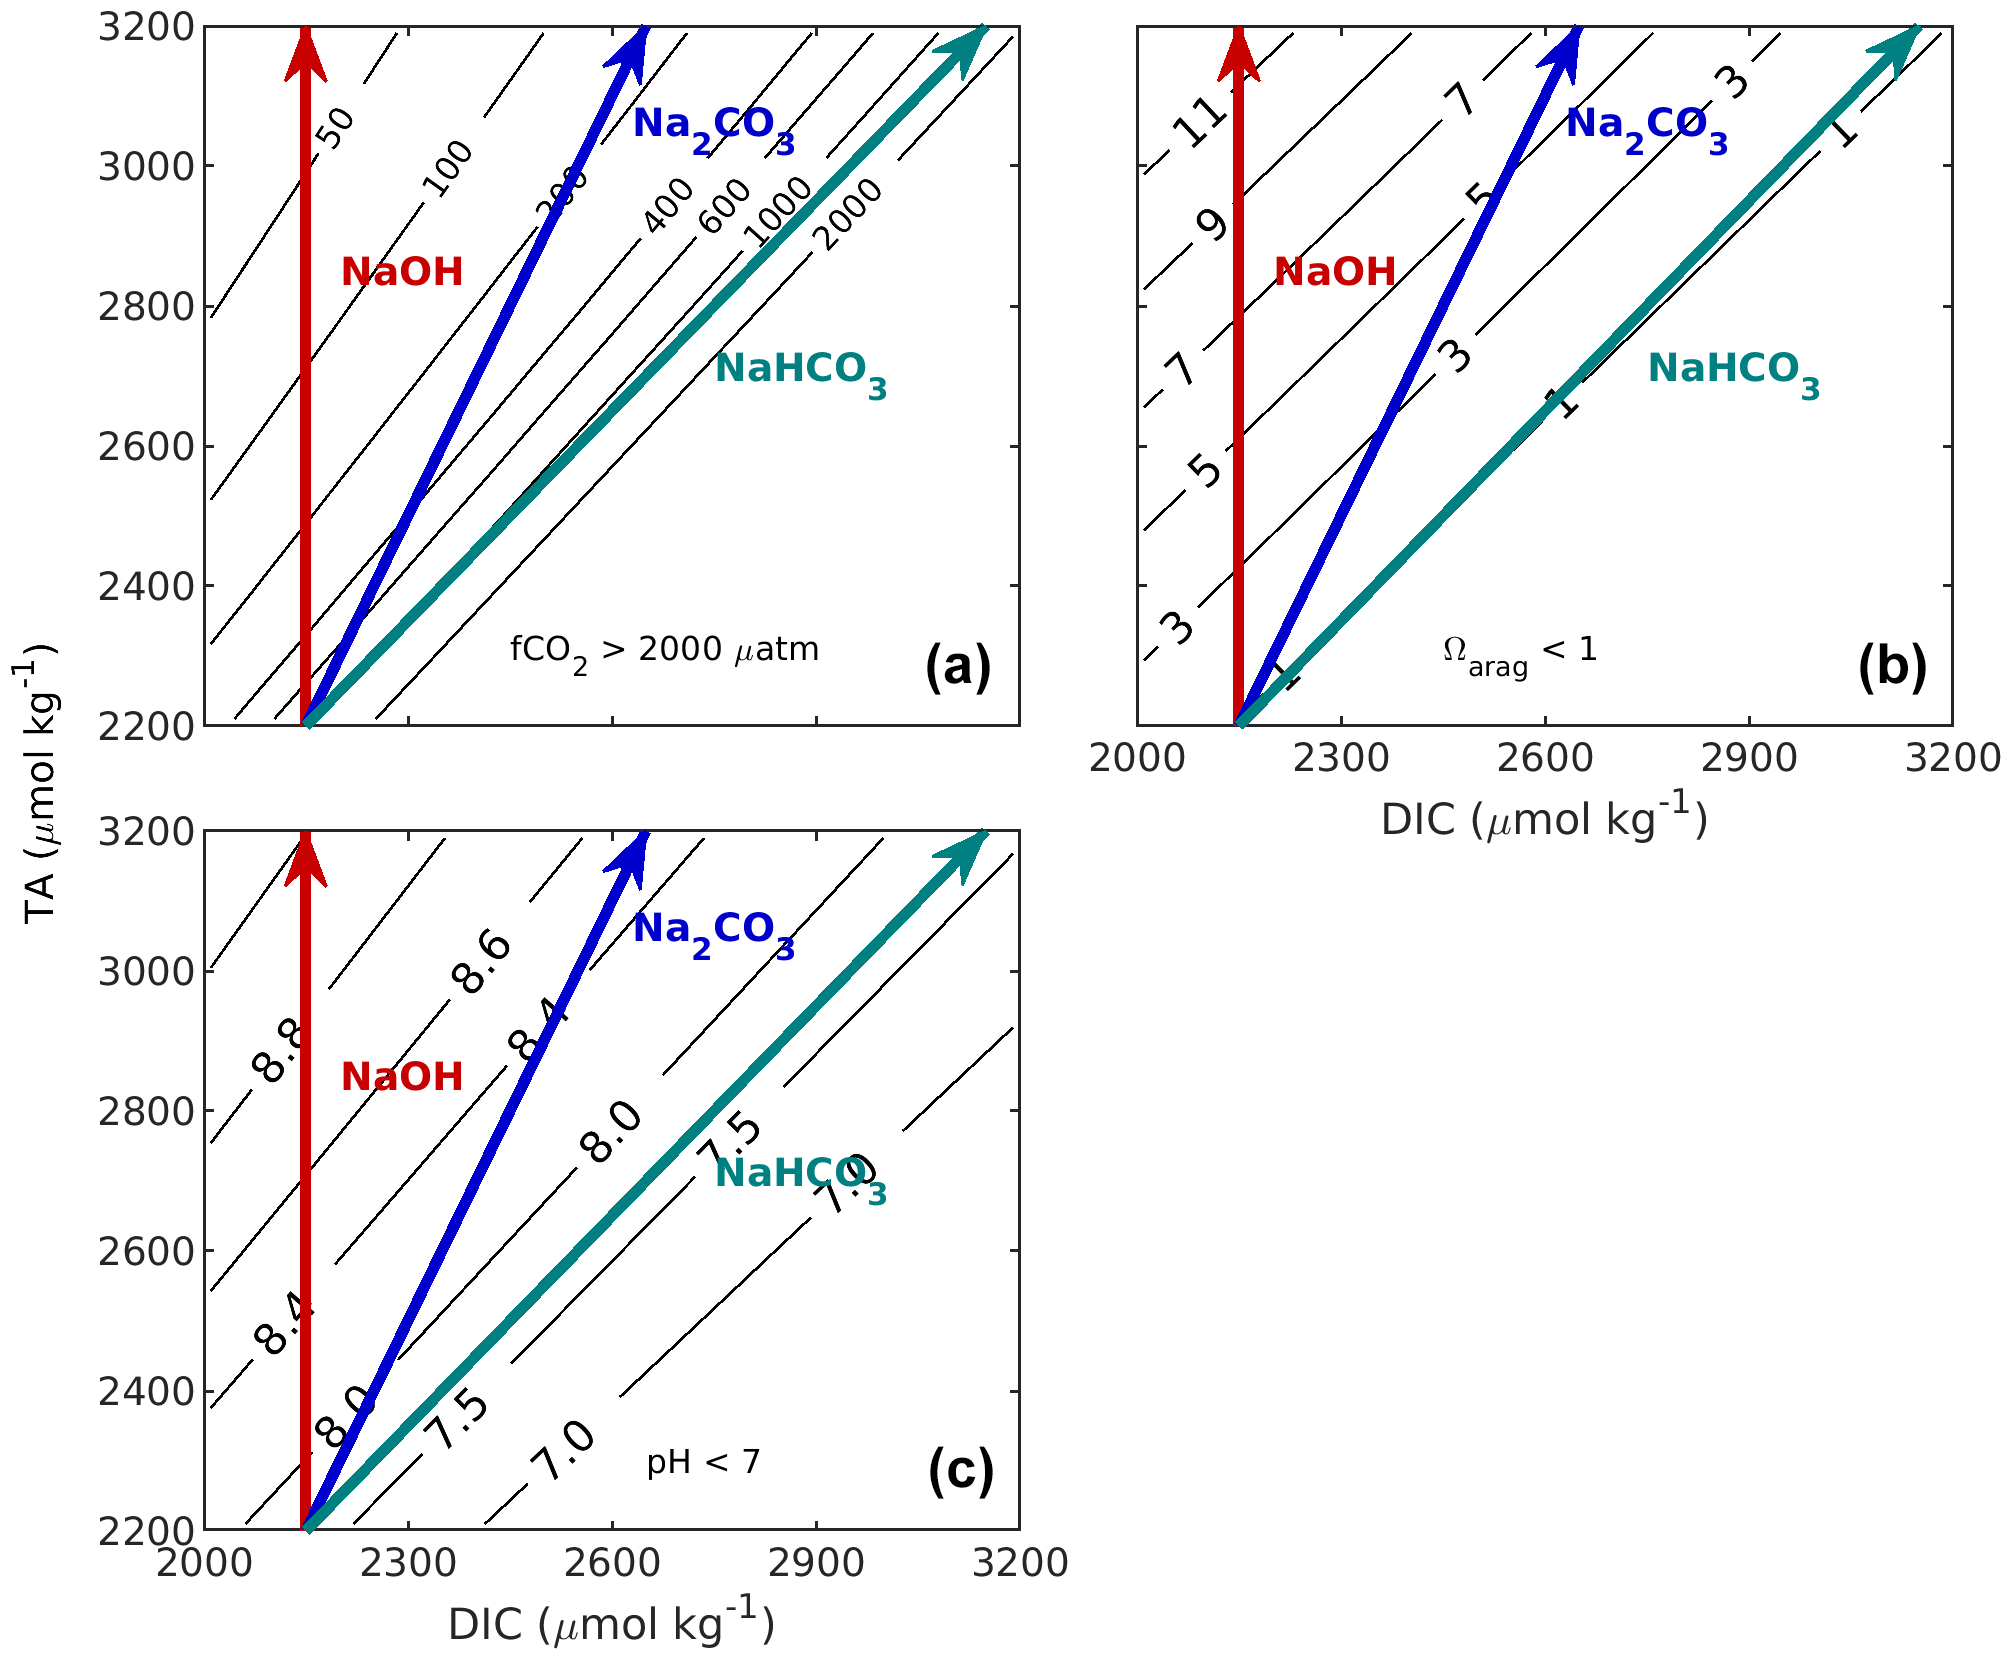
Figure 1Implications of changes in CT and AT on the properties of undersaturated seawater appropriate to the California Current region (S = 33.5, t = 10 ∘C, AT = 2200 µmol kg−1, CT = 2150 µmol kg−1). Panel (a) shows f(CO2), (b) shows aragonite saturation state (Ωarag), and (c) shows pHT. Calculations were carried out with the MATLAB version of CO2SYS (van Heuven et al., 2011) using the stoichiometric dissociation constants for carbonic acid from Sulpis et al. (2020), for sulfuric acid by Dickson et al. (1990), and for total boron from Uppström (1974). The red line indicates the effect of adding NaOH, the blue line indicates the effect of adding Na2CO3, and the teal line indicates the effect of adding NaHCO3. If a different initial seawater is chosen, this whole grouping (red, blue, and teal lines) can be translated (moved without any distortion or rotation) so that its initial position is elsewhere in these figures.
When an alkaline agent such as sodium hydroxide (NaOH) is used to increase total alkalinity, such addition does not change total dissolved inorganic carbon (the vertical red line, Fig. 1). Alternatively, alkalinity could be added as a soluble inorganic carbonate salt (e.g. ikaite, CaCO3 • 6H2O, or Na2CO3). Both would increase TA and DIC at a ratio of 2 : 1 (blue line, Fig. 1). As that modified water sample then equilibrates with the atmosphere, e.g. takes up CO2 from the air, DIC increases. It is straightforward to assess the potential of 1 kg of an alkalinity-enhanced seawater to remove CO2 from the atmosphere. It is equivalent to the change in DIC after re-equilibration to the initial fCO2 prior to the alkalinity addition (horizontally moving from the tip of the alkaline agent arrow to the initial fCO2). This concept takes into account that marine carbon dioxide removal (mCDR) also includes scenarios in which an oceanic CO2 source is reduced. Similar diagrams can be drawn to assess the impact of various TA additions on Ω or pH (Fig. 1b, c).
1.3 OAE impacts on seawater and potential secondary CaCO3 precipitation
As mentioned above, ocean alkalinity can be increased by various means (see also Eisaman et al., 2023, this Guide). First, there are multiple minerals found in natural rocks which release TA upon dissolution in seawater. Dissolution kinetics depend on how finely the minerals have been milled as well as on the mineral itself (e.g. Anbeek, 1992). For instance, olivine, a magnesium/iron silicate – (Mg,Fe)2SiO4, dissolves relatively slowly (for the purpose of OAE), on the order of weeks to months, and appears to have a relatively low solubility (Monserrat et al., 2017; Flipkens et al., 2023). On the other end of the spectrum, brucite (Mg(OH)2) dissolution rates can be on the order of hours (Moras et al., 2023a). Another way to increase oceanic TA is to add it in “liquid” or aqueous form, i.e. hydroxide ions – OH−, which can be produced electrochemically from seawater (e.g. Rau et al., 2013, but also see Eisaman et al., 2023, this Guide).
Whichever the approach, once alkalinity is increased it raises pH, shifting carbonate chemistry speciation towards lower aqueous carbon dioxide ([CO2]) and higher carbonate ion concentrations ([CO]), as well as saturation states for various calcium carbonate (CaCO3) morphotypes such as calcite (Ωcalc) and aragonite (Ωarag). In this context, saturation states can be considered critical thresholds, and depending on the application there are levels that should not be exceeded for extended periods of time. Avoiding critical saturation thresholds is important because CaCO3 will precipitate inorganically through a number of mechanisms at higher Ω values. Such secondary precipitation should be avoided as it reduces the oceanic uptake capacity for atmospheric CO2 and can even lead to runaway CaCO3 precipitation, where more TA is removed than had been added, reducing typical CO2 uptake potential by a factor of 8 (Fuhr et al., 2022; Moras et al., 2022).
In seawater there are three mechanisms for inorganic CaCO3 precipitation: (1) homogeneously – in the absence of any soluble or particulate surfaces; (2) pseudo-homogeneously – in the presence of particulate or colloidal organics; and (3) heterogeneously – in the presence of solid mineral phases (Marion et al., 2009). The critical Ω threshold beyond which CaCO3 formation would occur is highest for homogeneous and lowest for heterogeneous precipitation, with pseudo-homogeneous in between (Morse et al., 2007). In a natural setting, homogeneous precipitation is unlikely, as seawater is hardly void of organic or inorganic particles and/or colloids. For pseudo-homogeneous CaCO3 precipitation, the critical Ωarag threshold is about 12.3 at a salinity of 35 and 20 ∘C (Marion et al., 2009). For heterogeneous precipitation, it depends on the so-called lattice compatibility between CaCO3 and the mineral surfaces it precipitates onto. For instance, the mineral CaCO3 has a perfect lattice compatibility, meaning that any existing pre-cursors will lead to precipitation at Ω above 1 (Zhong and Mucci, 1989). The rate of precipitation exponentially increases with Ω, about 5-fold for a doubling in saturation state. In contrast, other mineral surfaces have lower lattice compatibilities; for instance CaCO3 precipitation was observed for CaO and Ca(OH)2 above an Ω of 7, while for Mg(OH)2 rates appeared to be even further reduced (Moras et al., 2022, 2023a). Critical Ω thresholds are also influenced by grain size, salinity, and dissolved-organic-matter concentrations (Simkiss, 1964; Chave and Suess, 1970; Moras et al., 2023a) and most likely temperature as well.
The risk of secondary precipitation is particularly high when TA has been increased, but atmospheric CO2 has not yet entered the ocean; i.e. Ω is still high. However, there is also the possibility of equilibrating seawater with respect to atmospheric CO2 during TA addition, which would reduce the possibility of secondary CaCO3 precipitation as Ω would be much lower for the same amount of TA added (Bach et al., 2019). Likewise, dilution of TA enhanced with unperturbed seawater has been shown to effectively slow/stop secondary precipitation due to a reduction in Ω (Moras et al., 2022).
1.4 TA additions and critical Ω thresholds in the surface ocean
From a practical OAE standpoint, there will always be an Ω that one will try not to go beyond for extended periods of time to minimise potential secondary CaCO3 precipitation. How much TA can be added therefore depends on initial in situ seawater Ω. Globally, both surface ocean Ωarag and Ωcalc are highly correlated, at least on larger scales, with temperature and salinity. On smaller scales, there is also a biological component, i.e. photosynthesis increasing Ω and respiration decreasing it. Impacts of temperature and salinity changes on carbonate chemistry speciation are 2-fold. While there is a direct effect of temperature on carbonate chemistry speciation, the bigger impact on Ω stems from the higher CO2 solubility in low-temperature waters. The resulting higher [CO2] and lower TA/DIC at atmospheric equilibrium leads to a shift towards lower [CO], and hence Ω. This is because [CO] is approximately equal to the difference between carbonate alkalinity (CA) and DIC in the ocean (Schulz and Maher, 2023). This largely explains the latitudinal gradient of surface ocean Ω (Jiang et al., 2015). Additionally, the temperature sensibility of the stoichiometric calcium carbonate solubility product (Ksp) also contributes to the latitudinal Ω gradient (Mucci, 1983).
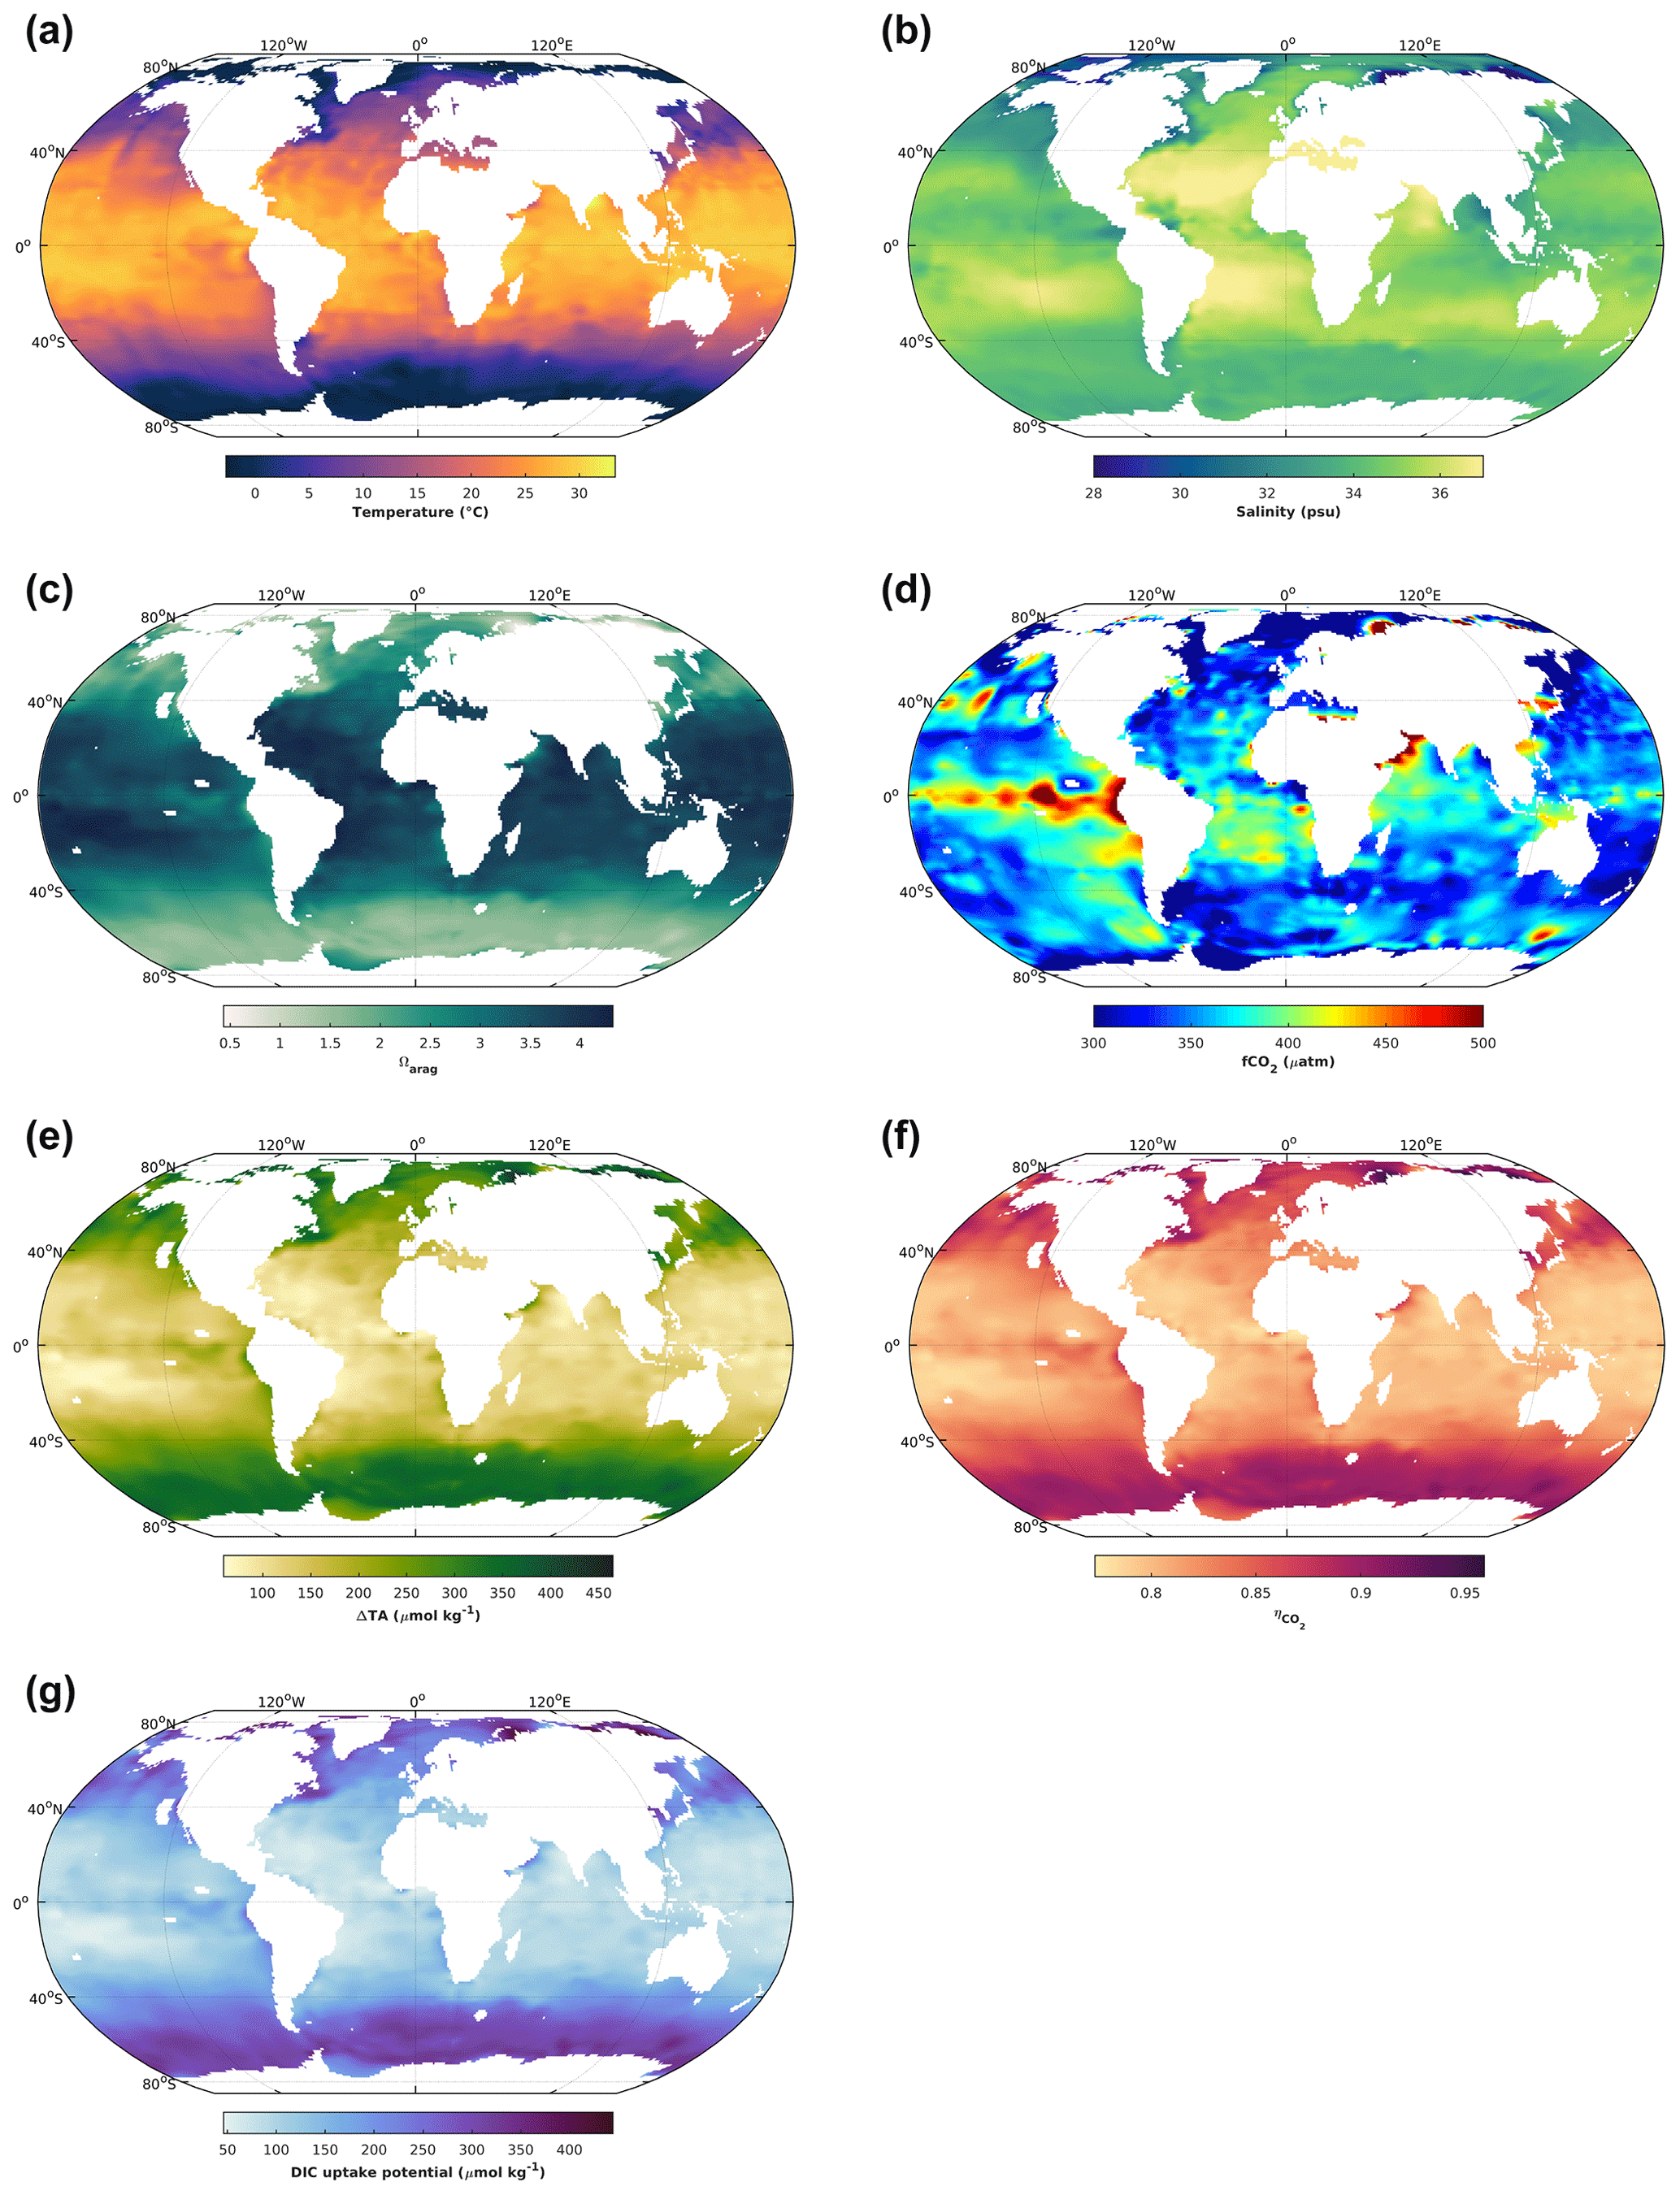
Figure 2The 1 × 1∘ GLODAP climatology (Lauvset et al., 2016) for surface ocean (upper 30 m) temperature (a), salinity (b), aragonite saturation state (c), and fCO2 (d). The latter two variables were calculated from GLODAP dissolved inorganic carbon and total alkalinity using the stoichiometric dissociation constants for carbonic acid from Sulpis et al. (2020), for sulfuric acid from Dickson et al. (1990), and for total boron from Uppström (1974). Finally, the concentration by which total alkalinity can be increased in order to reach an aragonite saturation state of 5, ΔTA (e); the CO2 uptake factor (f); and the resulting increase in DIC by uptake of atmospheric CO2 upon air–sea equilibration (g). For details see text.
When it comes to salinity, there is also a direct effect, but the major driver is that in oceanic waters DIC and TA scale with salinity (mostly driven by water evaporation and precipitation), meaning that they will be significantly reduced at lower salinities. And for a similar oceanic pH at equilibrium with atmospheric CO2, reducing salinity and DIC, for instance 5-fold, will reduce [CO] by a similar amount. In turn, this will reduce Ω, together with the salinity-related reductions in [Ca2+] at lower salinities. Globally, sea surface temperatures are highest in the tropics and subtropics and decrease towards higher latitudes (Fig. 2a). Similarly, there is a tendency towards higher salinity at low latitudes and lower salinities at high latitudes (Fig. 2b). In concert, this leads to increasing Ω from polar to tropical waters. For instance, while there are polar regions in which Ωarag is close to 1 on an annual basis, in large parts of the tropical surface ocean Ωarag can be close to 4 (Fig. 2c). Finally, as mentioned earlier, there are also biological drivers of sea surface Ω, for which a good indicator is CO2 fugacity. Higher-than-current atmospheric pressures of ∼ 425 µatm are indicative of respiratory CO2 generation, reducing Ω, while pressures below are typically driven by photosynthetic CO2 fixation, increasing Ω. This modulating effect of biology on temperature- and salinity-driven global surface ocean Ω distributions can be seen by the upwelling of CO2-enriched deep waters in the tropical Pacific, where elevated fCO2 results in lower Ωarag (Fig. 2c, d). Altogether, this determines how much TA can be added before a critical Ω threshold is reached. Assuming that Ω should not surpass a threshold of 5 to avoid secondary CaCO3 precipitation (Moras et al., 2022), 5-times-higher TA additions would be possible at high in comparison to low latitudes (Fig. 2e).
The amount of atmospheric CO2 that can be taken up for a certain TA increase depends on the uptake factor (Humphreys et al., 2018; Tyka et al., 2022). It denotes the molar ratio of the concomitant DIC increase relative to the amount of TA added upon establishing initial seawater fCO2 by air–sea gas exchange. It is mainly determined by sea surface temperatures, with minor effects of salinity and biology. It ranges between 0.77 and 0.96, with higher values at lower temperatures closer to the poles (Fig. 2f). The resulting DIC uptake potential for global surface waters, for a critical Ω threshold of 5, ranges between only 50 and up to 400 µmol kg−1, being higher at high and lower at low latitudes (Fig. 1g). It is noted though that the CO2 uptake factor plays only a minor role, and most differences in regional CO2 uptake potential are driven by the amount of TA that can be added before a critical Ω threshold is reached and/or the amount of time a water parcel stays in contact with the atmosphere (see next section). The uptake factor can be empirically estimated using available carbonate chemistry calculation tools or calculated analytically, for which there are also dedicated routines available (Humphreys et al., 2018).
1.5 Cautionary note on apparent trends in regional differences for atmospheric CO2 uptake
When looking at the distribution of global DIC uptake potential calculated for a specific OAE application (Ω threshold), there appears to be a general trend for higher uptake at high and lower at low latitudes. However, that only applies to the open ocean, as coastal areas are not included in the underlying Global Ocean Data Analysis Project (GLODAP) climatology. And there, the situation is likely to be quite different, as these areas are heavily impacted by terrestrial influences such as freshwater input but also anthropogenic disturbances such as nutrient runoff, which affects biological processes, and hence the CO2 uptake potential (see above), in particular as biological activity can be orders of magnitude higher than in the open ocean. Additionally, seasonal changes to carbonate chemistry speciation, which can be quite large, are also not captured.
Furthermore, it is only an uptake potential, and the realised increase in DIC critically depends on regional gas transfer velocities, i.e. how quickly atmospheric CO2 is equilibrating with the surface ocean and for how long the surface water with increased TA is in contact with the atmosphere before eventually being subducted. There are regions with relatively quick CO2 equilibration and surface waters remaining in contact with the atmosphere on the relevant timescales, meaning that about a year after the TA increase ∼ 80 %–100 % of the CO2 uptake potential could be realised (He and Tyka, 2023). In contrast, there are regions with either quite slow equilibration and/or where significant portions of TA-enriched surface waters lose contact with the atmosphere for relatively long times, e.g. regions of deep water formation. Here, the realised CO2 uptake potential might only be 50 % or less after a couple of decades (He and Tyka, 2023).
Finally, a water mass that has received a TA addition might change its physical properties such as temperature, for instance when moving from high to low latitudes. As such decreases along the trajectory, meaning that the CO2 uptake potential declines. Hence, instead of using at the site of TA addition to estimate its DIC uptake potential, it appears more appropriate to use a global mean of 0.84.
Last but not least, it is advisable to not treat or the DIC uptake potential as a measure of OAE efficiency. The latter should be assessed in two steps, i.e. first how much of a stable TA increase can be achieved, accounting for potential CaCO3 precipitation, as well as potentially shifting natural TA source/sink terms, for instance in sediments (Bach, 2023), and secondly, how much of DIC is actually then taken up given a particular air–sea gas exchange and exposure time. Such an approach takes into account the quite different timescales of TA and DIC increases.
Sampling of discrete DIC, TA, pH, and fCO2 should generally follow protocols described in Standard Operating Procedure (SOP) 1 by Dickson et al. (2007). One caveat, however, is that these protocols were developed for common oceanic carbonate chemistry conditions. Here, we discuss additional measures for sampling and sample storage that may be necessary for carbonate chemistry conditions specific to OAE (i.e. high TA, high pH, and high Ω). We acknowledge that many of the procedures described below are based on anecdotal evidence and need to be further scrutinised with increasing maturation of OAE research and ongoing improvements of this guide.
2.1 Specific problems to consider
In general, there are 4 processes that can alter carbonate chemistry conditions in a sample during its collection and storage. These are
-
modifications via air–sample gas exchange (sampling)
-
modifications via biological activity such as respiration (storage)
-
modifications via the precipitation of CaCO3 (storage)
-
modifications via diffusion of CO2 into or out of sampling container walls (storage).
These four processes affect carbonate chemistry parameters differently, and the effect size also depends to a large degree on the sample itself (Table 1). Sampling and storage procedures that describe how to deal with processes 1 and 2 can be found in SOP 1 by Dickson et al. (2007), such as how samples should be collected and stored, including thorough instructions of what materials are recommended to be used and how they should be prepared.
Table 1Direction of change in a measured carbonate chemistry parameter due to various processes (NC denotes no change). Note that for process 1 the direction depends on whether the sample is over- or undersaturated with respect to atmospheric CO2. For process 4 the direction depends on whether CO2 is diffusing from the walls into the sample or vice versa. Also, the direction of TA change in process 2 depends on which form of inorganic nutrients are being released during organic matter remineralisation.
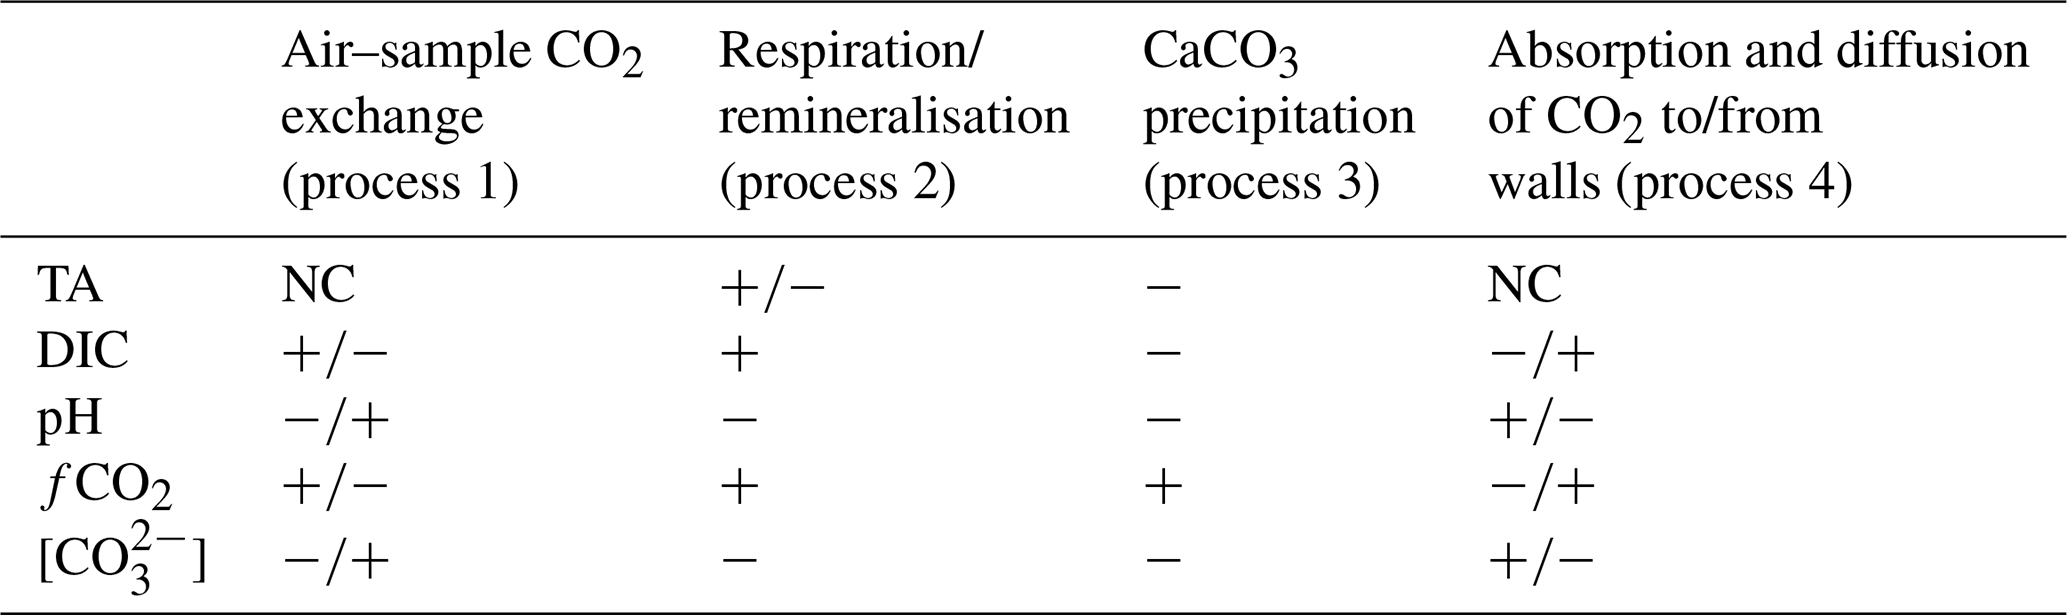
CaCO3 precipitation (process 3) has received less attention in SOP 1. This is because CaCO3 precipitation is very slow under most natural seawater carbonate chemistry conditions and is therefore not considered to affect carbonate chemistry conditions during sampling and storage of such waters. However, CaCO3 precipitation accelerates exponentially the further Ω deviates from 1 (Zhong and Mucci, 1989). Extreme Ω values which are much higher than what is commonly observed in the oceans will be frequently encountered in OAE research. Indeed, Subhas et al. (2022) experienced this problem in their OAE experiments, where TA and DIC concentrations in the OAE treatment samples declined during sample storage due to CaCO3 precipitation. The precipitation of CaCO3 reduces TA and DIC at a 2 : 1 molar ratio, also changing carbonate chemistry speciation (Fig. 3). As discussed above, precipitation rates critically depend on Ω but are also influenced by the presence of organic/inorganic particles as precipitation nuclei (Zhong and Mucci, 1989; Marion et al., 2009; Moras et al., 2022; Fuhr et al., 2022), the Mg concentration (Moras et al., 2023a), or the concentration of dissolved organic carbon (DOC; e.g. Chave and Suess, 1970; Pan et al., 2021; Moras et al., 2023a). Since precipitation is usually difficult to predict in terms of how long a sample might be stable, it is advisable to treat the sample in such a way that the potential problem of precipitation is minimised/mitigated.
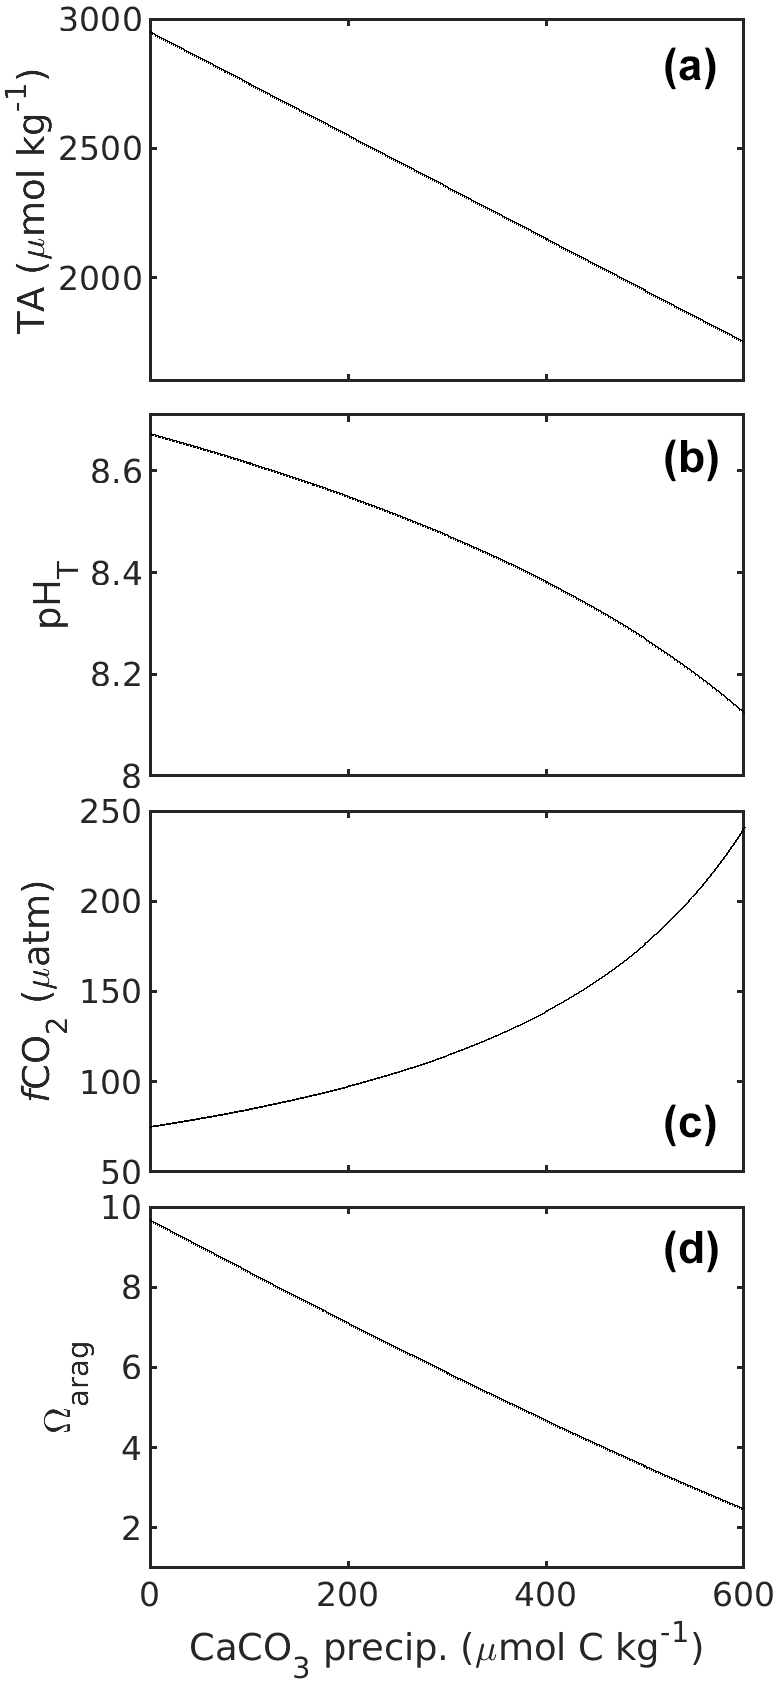
Figure 3Changes in TA (a), pHT (b), fCO2 (c), and Ωarag (d) in response to CaCO3 precipitation, i.e. DIC removal. Carbonate chemistry calculations for a salinity of 35 at 20 ∘C were as described in the caption of Fig. 1. Starting TA and DIC were 2950 and 2100 µmol kg−1. Please note that for 1 mol of CaCO3 precipitated, 1 mol of DIC is consumed.
In the following we describe procedures to avoid changes in carbonate chemistry conditions upon sampling and storage of DIC, TA, pH, and fCO2.
2.2 General sampling considerations: filtration
It is advisable to filter carbonate chemistry samples upon their collection to remove particles. In oceanography, the cut-off between what is considered to be dissolved or particulate has been operationally defined by passing or being retained on a GF/F filter (Whatman glass fibre grade F). Such a filter has a nominal pore size of 0.7 µm, but smaller pore sizes, for instance 0.2 µm, which would remove bacteria at the same time and theoretically produce a sterile sample, have also worked in the past. Filtration has multiple benefits and might even be required:
-
Particles can serve as precipitation nuclei, which catalyse CaCO3 precipitation during storage. Removing particles via filtration will therefore help to reduce the risks of secondary precipitation.
-
Removing particles will be necessary if CaCO3 precipitation has already occurred in situ to not interfere with the measurements. This is because typical analytical procedures to measure DIC and TA rely on acidifying the seawater sample during analysis, meaning that any CaCO3 present would re-dissolve and be measured as additional DIC and TA.
-
Filtration of the sample is also useful to remove substrate for biological breakdown and organisms that respire organic carbon. Respiration has limited influence on TA but strongly affects DIC, pH, fCO2, and [CO] (Table 1). However, for samples intended to be stored longer than a few days, sterile filtration is not recommended but instead fixation with mercuric chloride (HgCl2; Dickson et al., 2007).
Filtration can have negative side effects that need to be considered and mitigated. Most obviously, filtration requires additional sampling gear, which introduces contamination risks. Thus, all filtration gear must be prepared appropriately following SOP 1 in Dickson et al. (2007). The most critical issue is that filtration increases the risk of air–sample CO2 gas exchange. This risk can be reduced when the sample is handled by gentle pressure filtration (as opposed to vacuum filtration, which is prone to gas exchange, i.e. CO2 degassing) in a closed system. For example, the sample could be pumped via a peristaltic pump using Tygon tubing (relatively impermeable for CO2) through a membrane filter directly into the sampling bottle, filling it from bottom to top with significant overflow (Dickson et al., 2007; Schulz et al., 2017). Alternatively, the sample could be filled into a syringe (again, potential air–water gas exchange has to be minimised) and filtered through a syringe filter, again from bottom to top with overflow. CO2 gas exchange would change DIC and hence is also a problem for pH, fCO2, and [CO] samples, which would also change. While TA samples are not affected by air–sample CO2 gas exchange, they are sensitive to evaporation, so prolonged exposure to the atmosphere must also be avoided.
2.3 General storage considerations
Samples for DIC, TA, pH, fCO2, and [CO] should be prepared for storage and stored as described in SOP 1 in Dickson et al. (2007). If these samples have relatively high Ω values (as a rule of thumb Ωarag > 12 for filtered and Ωarag > 5 for unfiltered samples), they most likely require additional measures to avoid changes through CaCO3 precipitation that could eventually occur during storage.
We reiterate that much of what is described below, while appearing to be logical, remains to be tested and validated in dedicated laboratory studies. Thus, care must be taken when adopting these preliminary recommendations.
2.3.1 Preparing DIC samples for storage
DIC changes with CaCO3 precipitation at a 1 : 1 molar ratio (Fig. 3). Eventual CaCO3 precipitation can be avoided by adding a strong acid (e.g. hydrochloric acid – HCl) to the sample, although precautions have to be taken (see below). HCl reduces TA and hence Ω. Such addition also decreases pH and increases fCO2 in the sample but leaves DIC concentrations untouched. Increasing sample fCO2 might, however, be a problem; if acid is added in excess to the added TA, fCO2 will eventually rise above atmospheric levels and increase the risk of outgassing, which would decrease DIC.
Hence, to mitigate CO2 outgassing it is advisable to dose the HCl additions to just compensate the TA addition, bringing Ω down to typical seawater levels, i.e. Ωarag ∼ 2. Also, prior to full mixing, there might be localised high fCO2 microenvironments; hence exposure of the sample to air after acidification should be avoided, for instance by closing the lid. Again, equilibrated OAE samples most likely do not require such an acidification step (see Sect. 2.3.1).
To reduce sample dilution, it is recommended to use strong acids (e.g. HCl) at relatively high concentrations. The dilution of the DIC sample with HCl will need to be considered to calculate the DIC concentration of the undiluted sample.
2.3.2 Preparing TA samples for storage
TA changes due to CaCO3 precipitation occur at a 2 : 1 molar ratio (Fig. 3a). CaCO3 precipitation, due to initially high Ω, can be avoided by briefly bubbling the TA sample with pure CO2 gas. CO2 decreases Ω and pH and increases DIC and fCO2 but leaves TA unaffected (note that CO2 is not part of the TA definition; Eq. 2). The approach was tested with 120 mL of seawater sample, where high-purity CO2 gas (4.5, i.e. 99.995 %) was bubbled via Tygon tubing through a clean 1 mL pipette tip into the sample for 10 s (Lenc et al., 2023). The CO2 flow rate was not determined but adjusted so that the bubbling did not lead to spillover in the 125 mL sample bottle. Measured pH declined from initially ∼ 8.7 to well below 6 within 10 s so that Ωarag went from ∼ 9.5 to much below 1. Under these conditions, TA loss through CaCO3 precipitation is impossible. It is noted that bringing the pH down to pH levels prior to the TA addition, i.e. around 8, would have reduced Ωarag sufficiently (< 5) to avoid CaCO3 precipitation during sample storage if the sample had been filtered.
However, there are several aspects to consider when employing this sample fixation approach. First, impurities in the CO2 gas could contaminate the TA sample. Particle impurities can be avoided by using filters. Gas impurities (e.g. NH3) will be more difficult to remove so that it is important to use high-purity gases and test for potential TA impurities. Second, bubbling with dry CO2 gas directly leads to evaporation of water, increasing TA. It is unclear at this stage how relevant this problem is for a short bubble burst, but it could be avoided by saturating the CO2 gas stream with H2O before bubbling the sample, as for example described in Moras et al. (2023b).
Finally, atmosphere-equilibrated OAE samples which have Ω levels below the critical thresholds described above should not require CO2 bubbling. However, it is advised to actually calculate expected sample Ω from estimates of TA and DIC prior to storage.
2.3.3 Samples for pH and fCO2
Samples for pH and fCO2 cannot be stabilised with any of the methods described above. The addition of HCl or CO2 would alter the carbonate chemistry speciation, including pH and fCO2. There may be methods to reduce CaCO3 precipitation via the addition of certain inhibitors such as DOC, but such methods would need to be developed. Thus, the recommendation for pH and fCO2 of samples with high Ω is to measure them immediately after collection.
Concerning measurements of carbonate chemistry parameters, there are different needs depending on scientific research questions. Two levels of uncertainty have been proposed, one being able to detect relatively small carbonate chemistry speciation changes in “climate” signals and the other being able to monitor shorter-term or spatial variability, which can be considerably larger, termed “weather” signals (Newton et al., 2015).
Being able to resolve climate signals requires measurement uncertainties equal to or better than 2 µmol kg−1 for DIC and TA, 0.003 for pH, and 0.5 % for CO2 fugacity. In comparison, for weather signals, values better than 10 µmol kg−1 for DIC and TA, 0.02 for pH, and 2.5 % for fCO2 are sufficient (Newton et al., 2015).
Concerning OAE, both thresholds could be aimed for depending on the application. For example, if it is to monitor initial TA changes upon an alkalinity addition, which can be on the order of several hundred micromoles per kilogramme of seawater, then aiming to resolve such a weather signal with an uncertainty of better than 10 µmol kg−1 is probably sufficient. However, once this signal becomes diluted and to monitor CO2 ingassing and DIC increase over timescales of months, an uncertainty for climate signals must be aimed for. In fact, depending on dilution, this might even not be enough, highlighting the fact that monitoring, reporting, and verification (MRV), i.e. determining how many carbon credits can be assigned to a certain OAE effort in the end, are likely to require modelling (Fennel et al., 2023, this Guide; Ho et al., 2023, this Guide).
In any case, a first step before measuring any carbonate chemistry sample would be to assess the accuracy (how far off measurements are with respect to certified reference materials) and precision (what the standard deviation of replicate measurements is) of one's instrumentation, allowing estimation of the overall uncertainty for each parameter in question. Another important point to consider is that OAE samples can be far off the concentrations of typical certified reference material, meaning that checking for linearity can be important (see below for details).
Finally, for any measurements described below, the starting point should be the Guide to Best Practices of ocean CO2 Measurements (Dickson et al., 2007). Hence, with the exception of fCO2, below we mostly refer to discrete, not in situ, measurements, although the following recommendations should also be considered for the latter.
3.1 Measuring DIC
Acknowledging that OAE samples for DIC can be prone to air–sample gas exchange, if the right precautions are taken during sampling and storage (see Sect. 2.3.1), they should be straightforward to measure. This is because DIC concentrations in a “non-equilibrated” OAE sample will be the same as for untreated seawater samples. However, in samples equilibrated with the atmosphere DIC can be several hundred micromoles higher than typical seawater samples or certified reference material, meaning that the linearity of the measurement instrument and procedure has to be ascertained.
Linearity can be checked for by preparing and measuring Na2CO3 (ultrapure and dried at 280 ∘C for 2 h) solutions of increasing DIC in Milli-Q water (ideally prepared from a concentrated stock solution), covering the required concentration range and comparing the fractional offset of measured against theoretical concentrations for each measurement point (Fig. 4). If the fraction does not change with concentration, the system response is linear, and a “one-point calibration” against a certified reference material will be sufficient. Using NaHCO3 to create a DIC gradient is not ideal as it is not available in ultrapure form, and without further modifications it would create high-fCO2 samples, which would need additional precautions because of potential CO2 degassing (note that ΔfCO2 is much higher for NaHCO3 than for Na2CO3 samples).
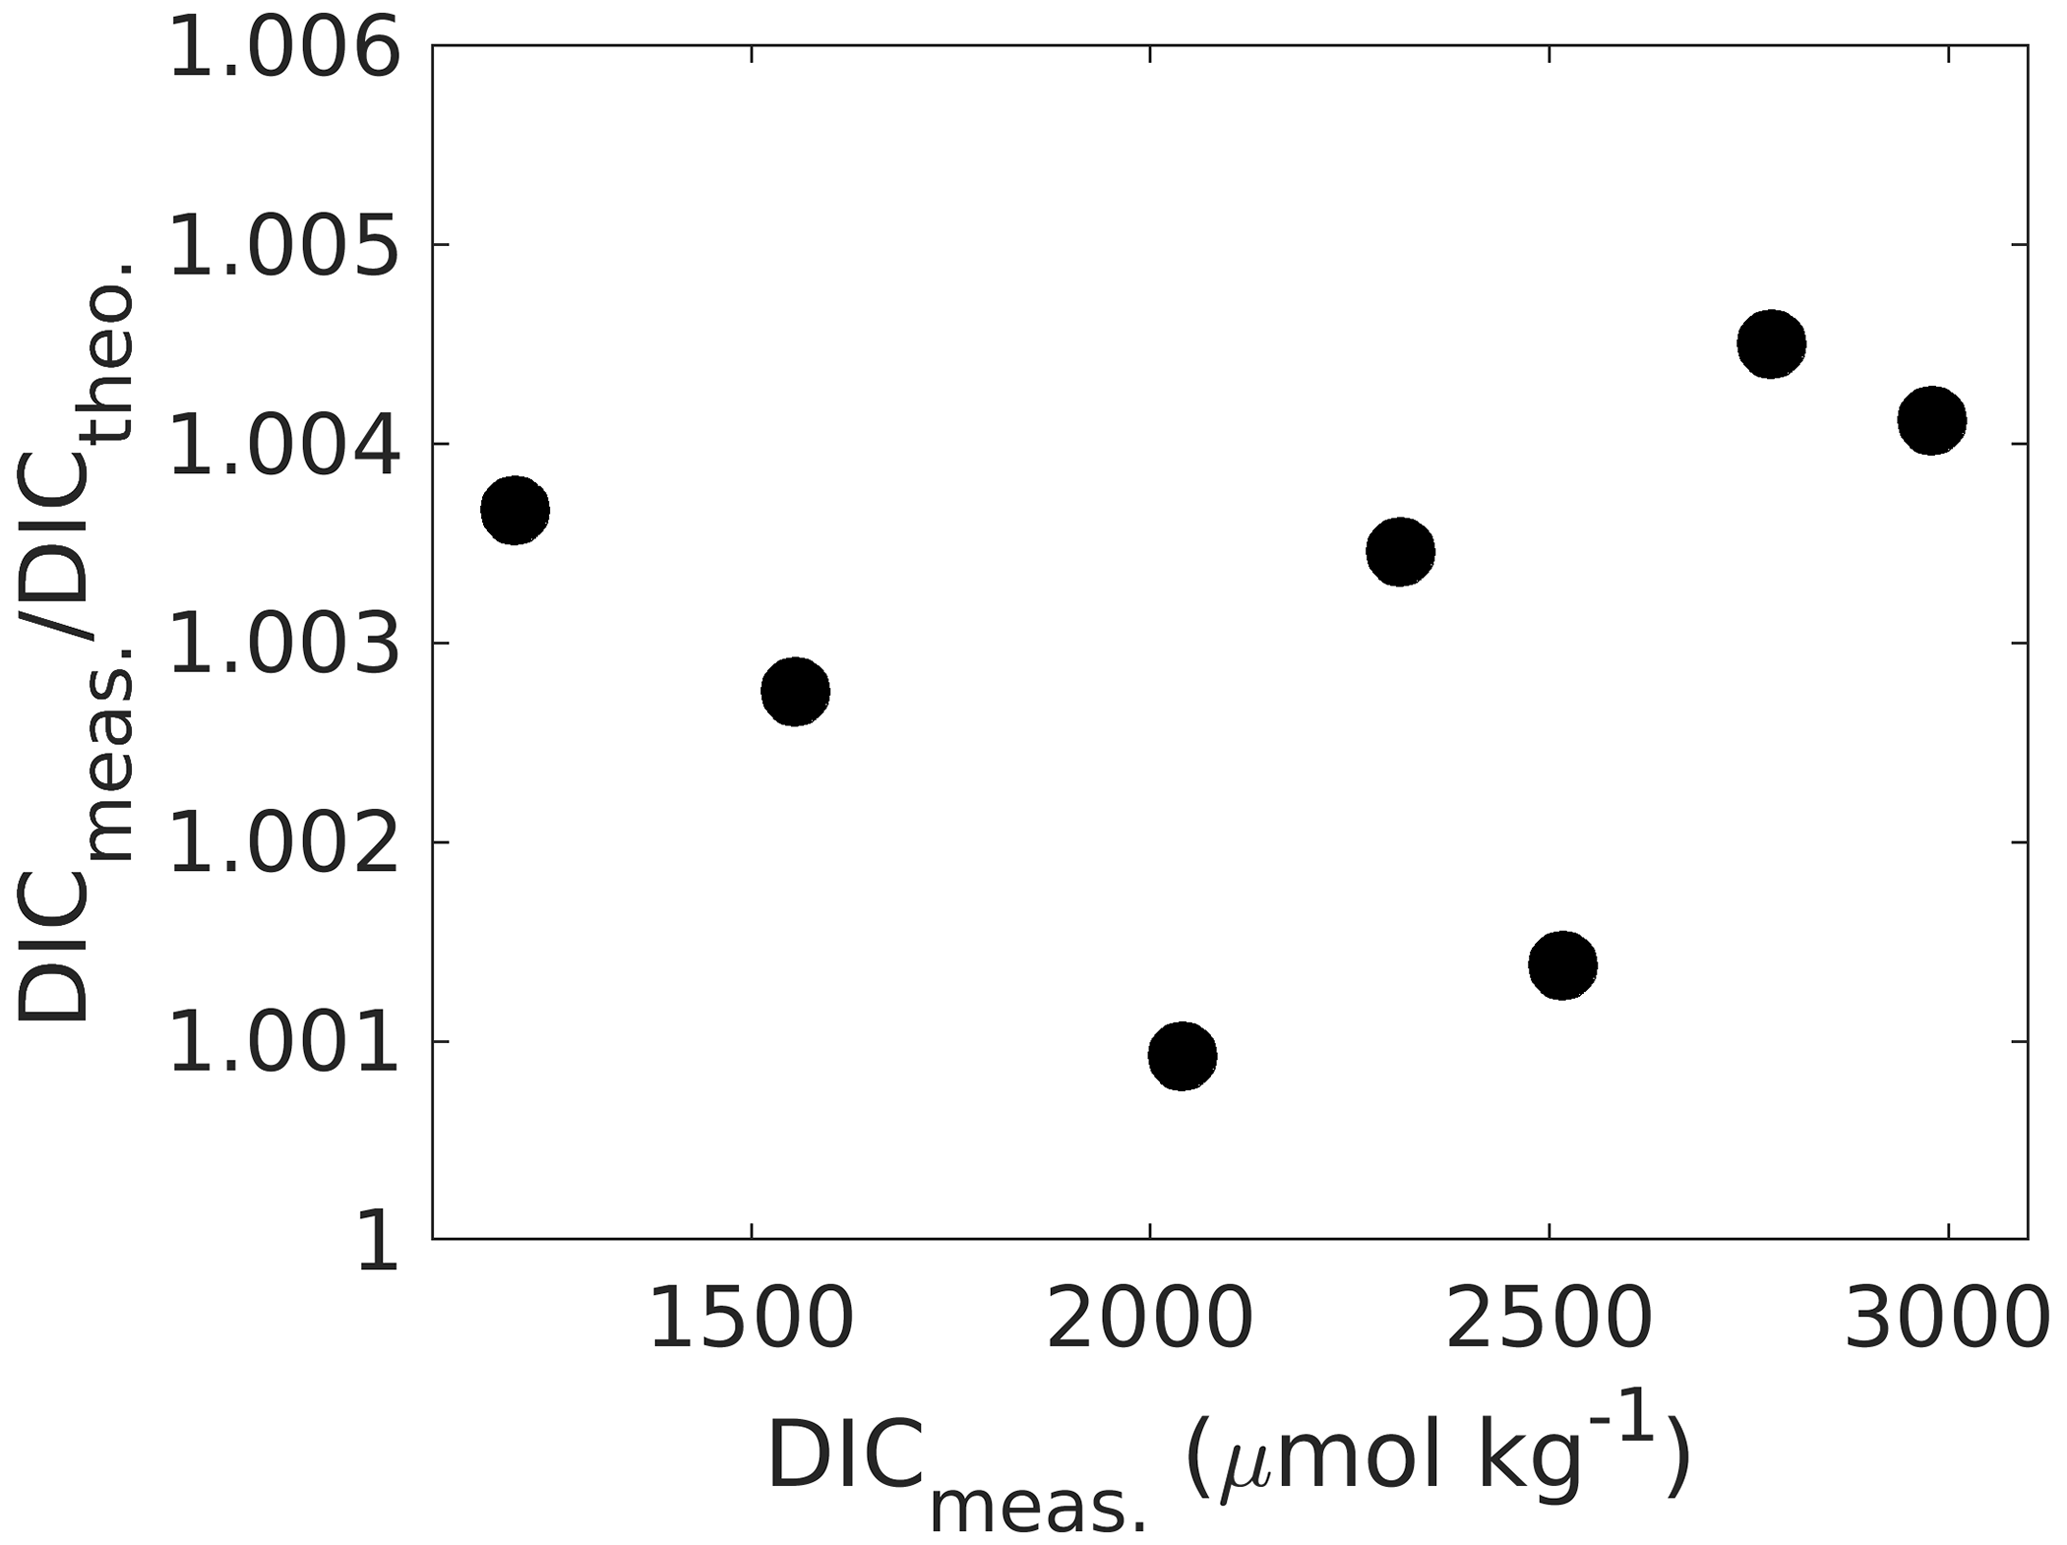
Figure 4Measured DIC concentrations versus the ratio of measured-to-theoretical DIC, showing that DIC is measured between ∼ 0.1 % and 0.4 % higher than theoretically predicted from self-prepared Na2CO3 solutions without an obvious trend across the DIC range. If the instrument response were not linear, this ratio would change with concentration changes. When linear, the mean ratio of measured-to-theoretical DIC allows for correcting measured concentrations for any accuracy bias.
Finally, it is again emphasised that sample filtration prior to measurement is most likely a crucial step to first stabilise the sample in terms of reducing the potential for CaCO3 precipitation and second to remove any CaCO3 that would have precipitated prior to sampling as it would interfere with the DIC measurement (see Sect. 2.2 for details).
3.2 Measuring TA
When it comes to measuring TA, samples are likely to be enriched in comparison to the typical surface ocean. Hence, checking for linearity of the instrument set-up like in the case of DIC is important. Again, this can be done by preparing suitable calibration standards, covering the required concentration range. However, unlike for relatively straightforward DIC measurements, this requires interpreting pH titration data on the basis of chemical acid–base equilibria in a well-defined ion matrix, called seawater (precisely defining the zero level of protons). Hence, simply using Na2CO3 or NaHCO3 in Milli-Q water is not the ideal option. Instead, to cover the higher TA range, suitable amounts of NaHCO3 could be added to seawater (Na2CO3 is not advisable as it is quite alkaline and might induce some sort of carbonate precipitation, impacting TA). If the TA range also requires concentrations lower than typical seawater, for instance for samples that had seen substantial amounts of CaCO3 precipitation, then this can be easily achieved by diluting natural seawater with Milli-Q water (weight by weight) and taking the change in salinity into account. Again, checking for changes in the ratio of measured-to-theoretical TA along the measured TA gradient will tell if the measurement system is linear, like for DIC (compare Fig. 4).
A last thing to consider is that high-TA samples can need considerably more titrant if the molarity of the acid is not increased. Under certain circumstances this can lead to non-linearities, e.g. if the dosing unit needs calibration. Finally, as for DIC it is important that no CaCO3 is present in the sample; hence an additional filtration step during sampling might be required.
3.3 Measuring pH
If pH is measured by a glass electrode, following the recommendations in Dickson et al. (2007), there should be no additional precautions required for OAE samples, whether they are of high TA and pH or high TA and DIC, hence typical seawater pH. Also, any CaCO3 that has precipitated prior to sampling will not interfere with the measurements (potentiometric pH only). However, if CaCO3 has precipitated post-sampling, this will have decreased the pH, and an erroneous reading will be made. Concerning accuracy, potentiometric pH measurements can be less accurate than spectrophotometric pH measurements (Bockmon and Dickson, 2015).
For spectrophotometric measurements, one key element is the working range of the pH dye being used. It has been suggested that for sulfonephthalein indicator dyes it is between 1 pH unit below and above the indicator's pK2 (see Hudson-Heck et al., 2021, and references therein). The latter is the pH for which the concentration of the double-unprotonated form of the dye is equal to that of the single-protonated one (Byrne et al., 1988). The two most commonly used pH dyes for seawater are meta-cresol purple (mCP) and thymol blue (TB), with pK2 of ∼ 8.0 and ∼ 8.5, respectively, at a temperature of 25 ∘C and a salinity of 35, although there are a number of studies that have extended the salinity and temperature range (see Hudson-Heck et al., 2021, and references therein). That would suggest that seawater pH ranging from 7 to 9.5 could be measured at high accuracy and precision. However, in practice accuracy can be influenced by dye impurities, and their effect can even be dependent on pH. Hence, when unpurified dyes are used, it is highly recommended to check for the proper working range.
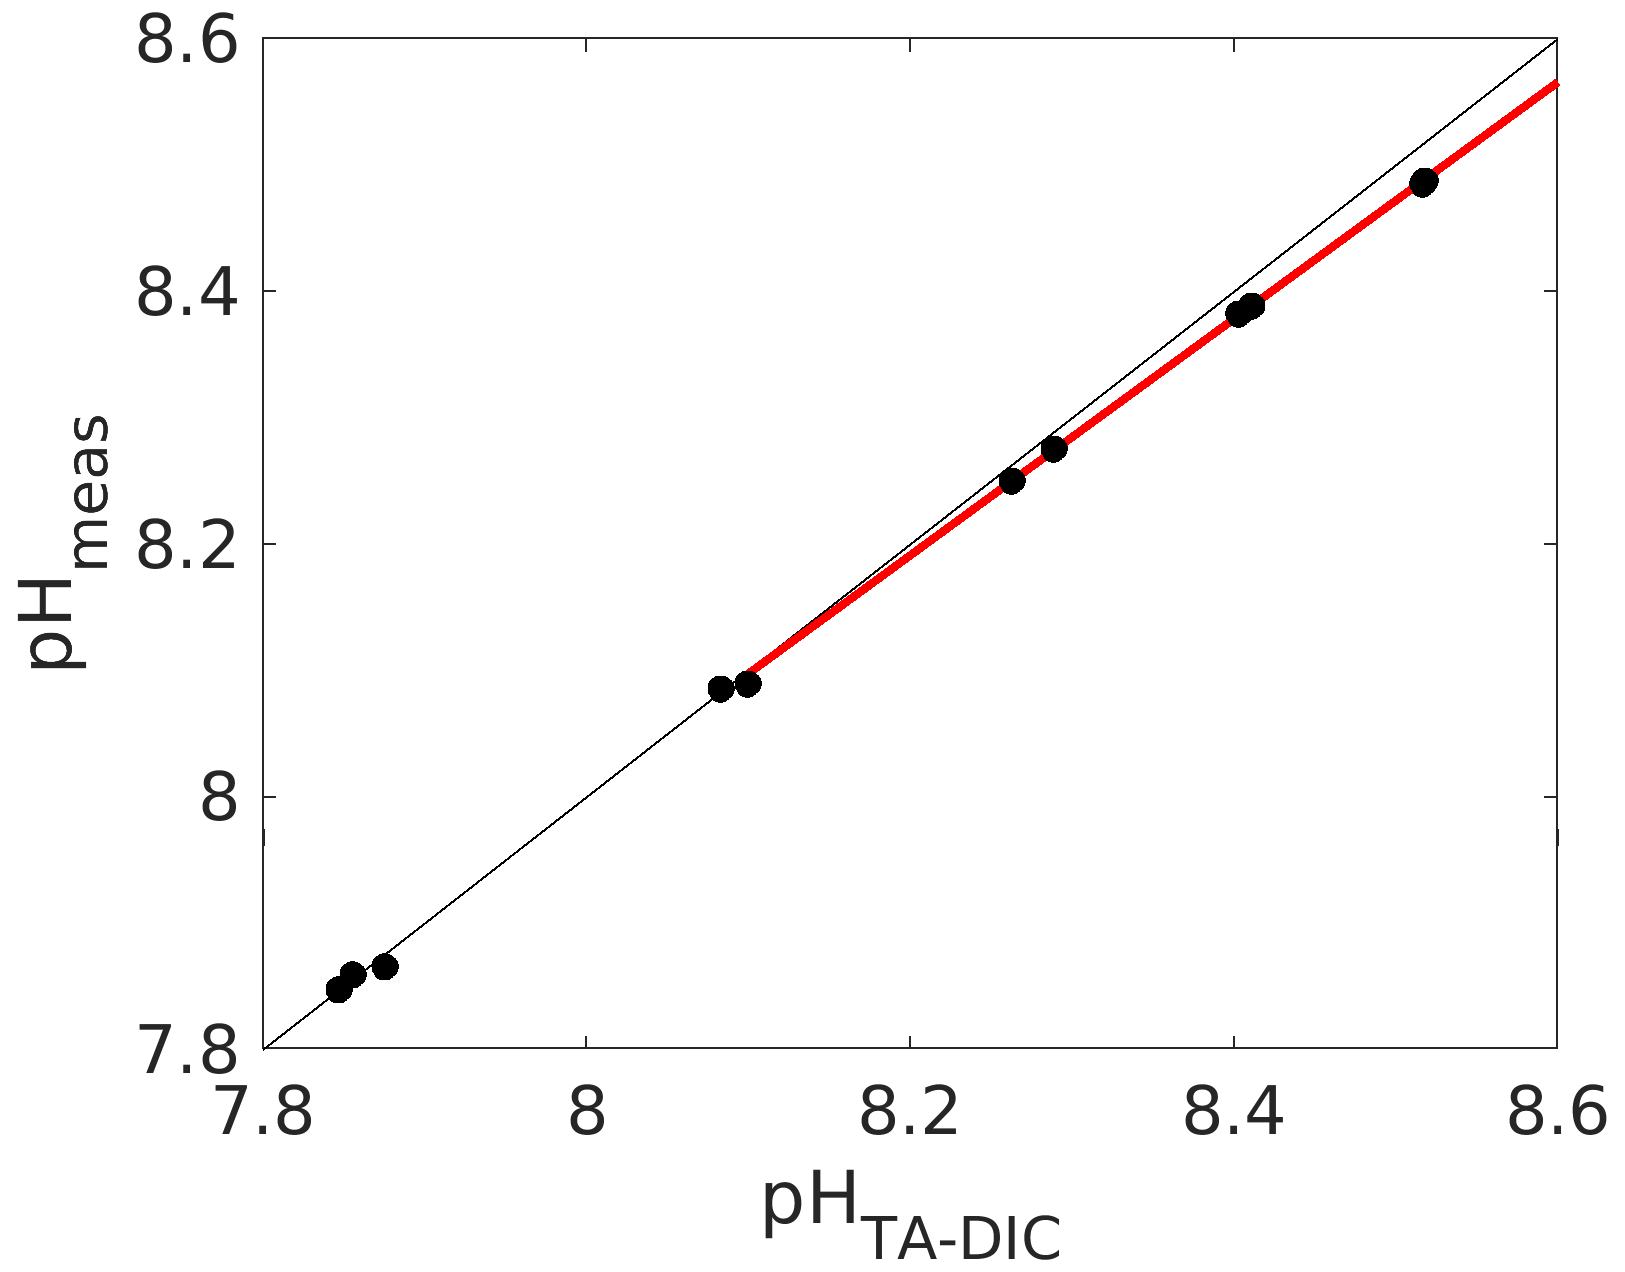
Figure 5Calculated (from measured DIC and TA; see caption of Fig. 1 for details) vs. measured pH (total scale) using an unpurified batch of mCP. The red line denotes a linear fit through the data above a pH of 8.1.
Indeed, we have found the working range to be significantly reduced for an unpurified mCP batch, for which we compared measured pH with calculated pH from measured DIC and TA (Fig. 5). And while a pH deviation of 0.03 pH units at a pH of 8.5 might not seem much, it corresponds to an offset of about 30 µmol kg−1 in DIC or TA if this pH measurement were used for carbonate chemistry calculations without correction, which is clearly way above both the weather and climate thresholds.
Another option for applying corrections is by direct means without the need for ancillary TA and DIC measurements (although they are recommended to check whether corrections are actually working within the desired pH range, which is actually quite important, as we see below). For that purpose, the absorbance ratios obtained with an unpurified dye need to be corrected. While the actual procedure is beyond the scope of this chapter, the reader is referred to detailed instructions in Douglas and Byrne (2017) for mCP and Hudson-Heck et al. (2021) for TB. Again, for the uncorrected pH measurements we found a considerable offset of up to 0.06 pH units (Fig. 6), corresponding to a ∼ 60 µmol kg−1 inaccuracy in TA or DIC if this pH measurement were used for carbonate chemistry calculations. Furthermore, the pH error is smallest around pK2 and increases below and above. While the impurity correction does fix the error close to pK2, the observed trend remains. The fact that there is some sort of optimum curve behaviour around pK2 points to an issue with the dye, rather than with measurements of DIC and TA. Hence, two separate linear corrections similar to the one with mCP (Fig. 4) could be applied. Alternatively, purified dyes could be sourced (e.g. Takeshita et al. 2021).
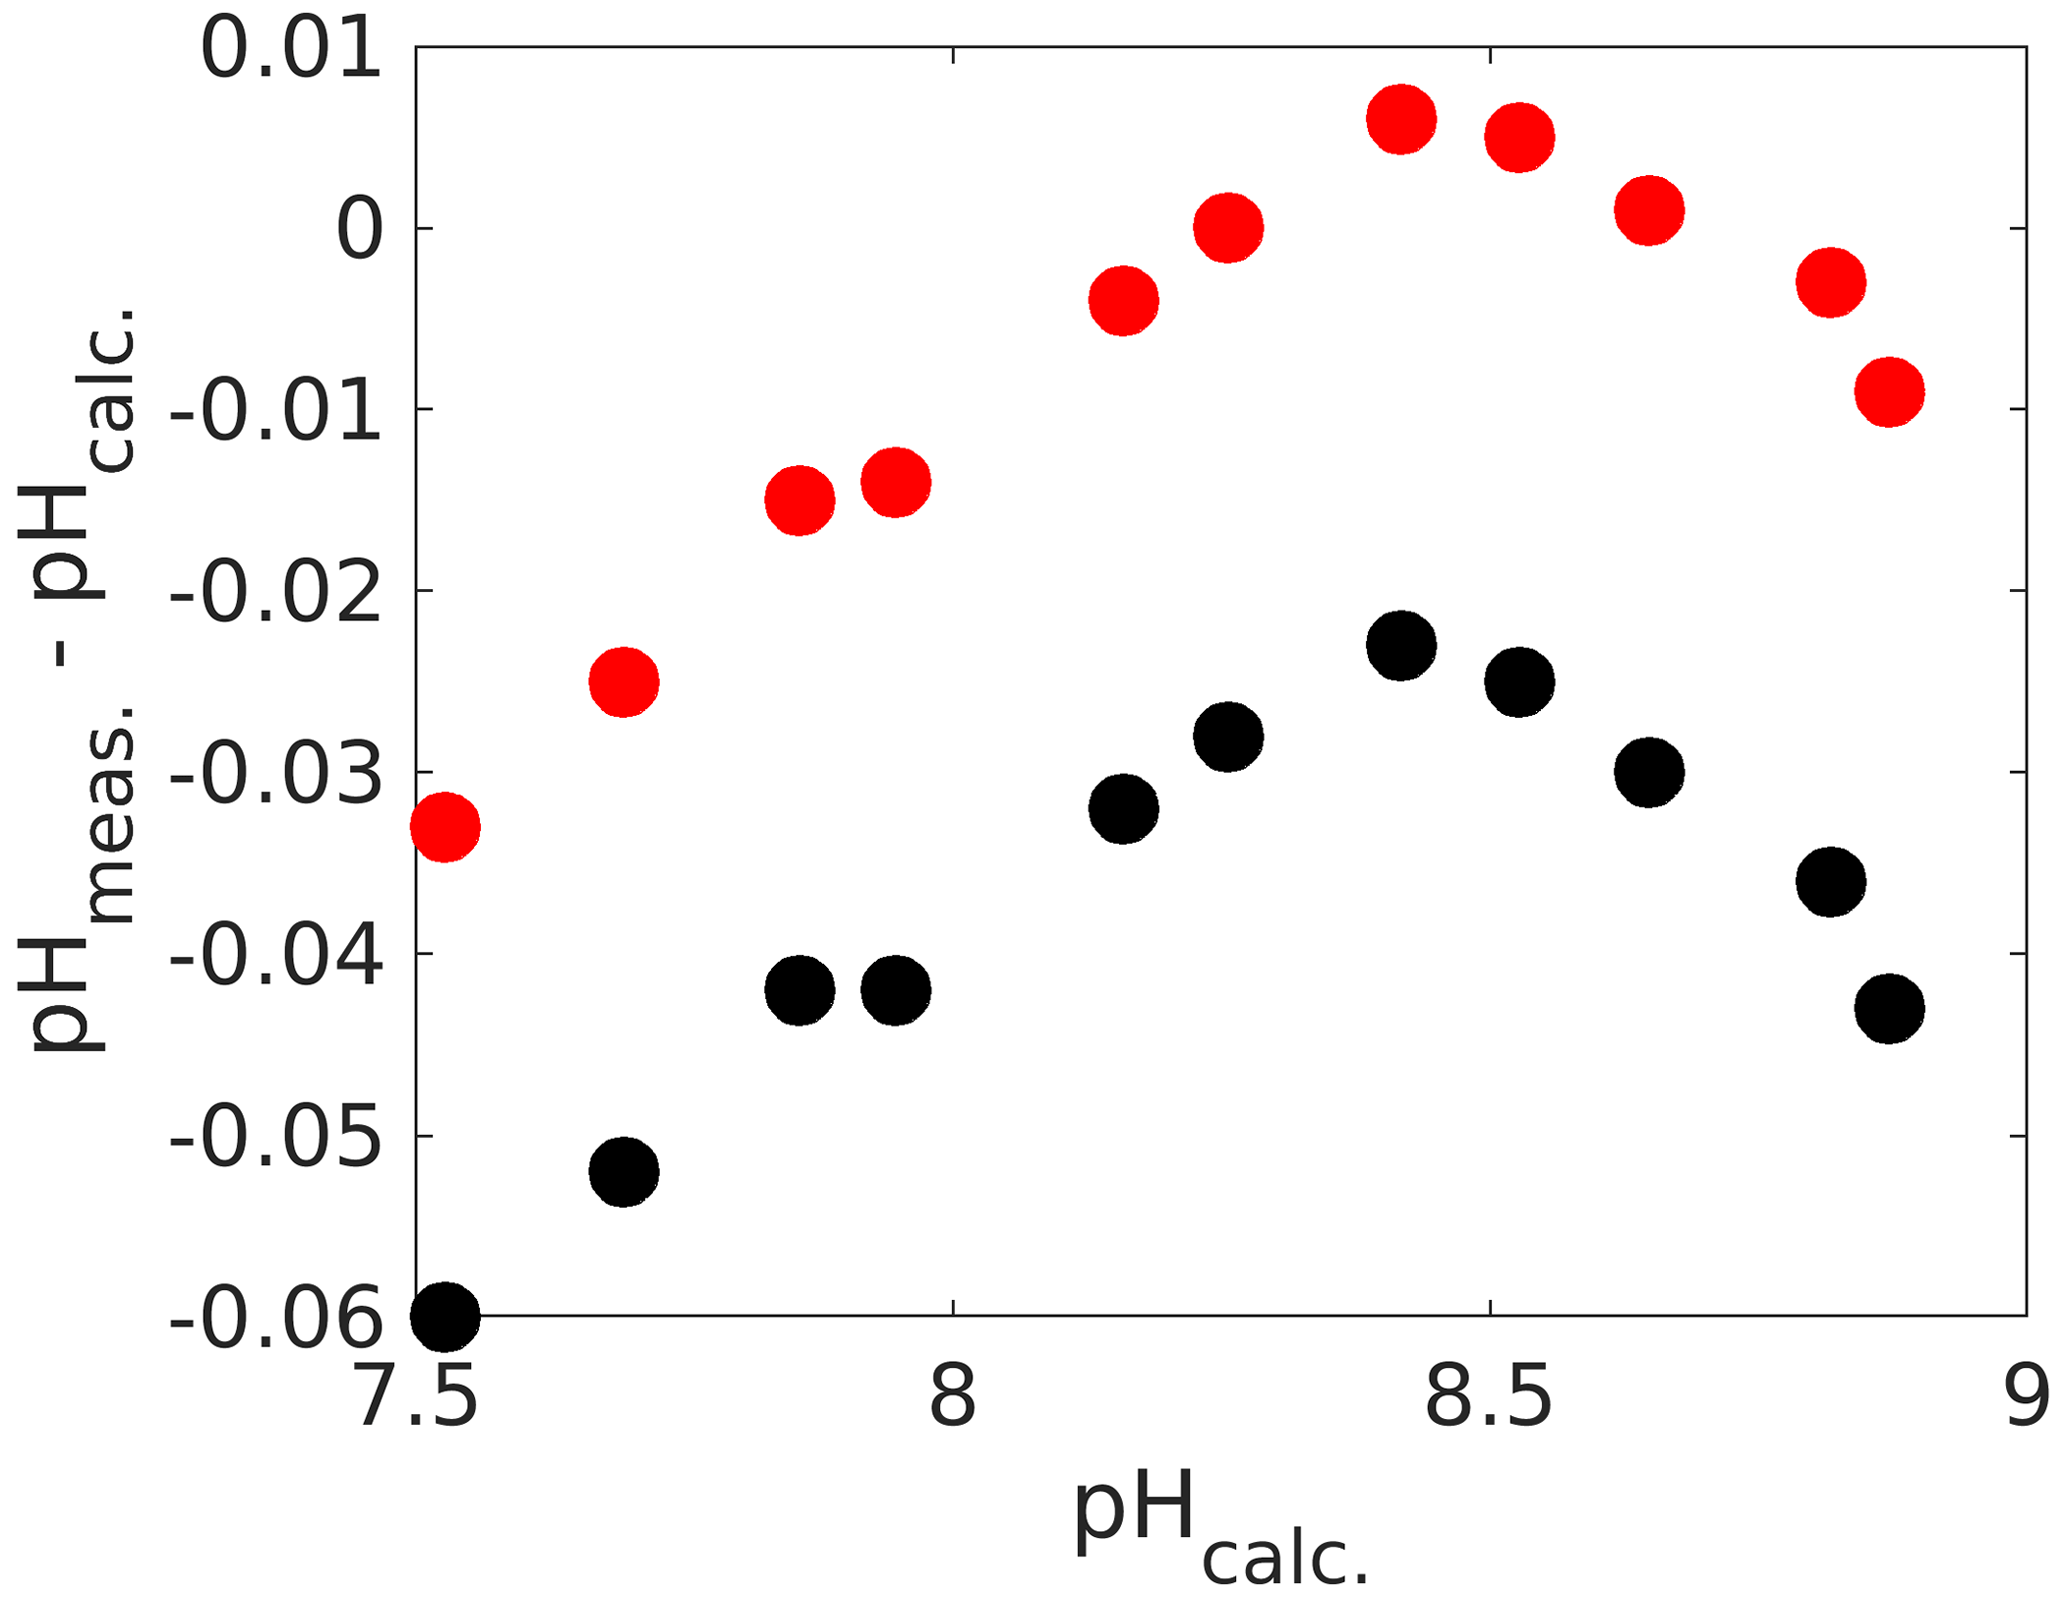
Figure 6Calculated pH (from measured DIC and TA) versus the difference between measured and calculated pH (total scale). The black dots are values prior to the impurity correction and the red ones after (see text for details).
Finally, as for potentiometric pH measurements the starting point for setting up spectrophotometric pH should be Dickson et al. (2007).
3.4 Measuring fCO2
For fCO2 measurements, air is being equilibrated with seawater, either via a CO2-permeable membrane or in a so-called showerhead equilibrator. As for potentiometric pH, any CaCO3 in suspension will not affect fCO2 measurements if precipitated pre-sampling. The only difference to typical seawater measurements is that fCO2 can be relatively low for “un-equilibrated” OAE, e.g. below 100 µatm for a TA addition of ∼ 500 µmol kg−1. Hence, full equilibration of seawater with the air to be measured might take a bit longer. Other than that, we do not see any particular issues, other than the generic problems with potential CaCO3 precipitation if samples are stored (Sect. 2.3).
Carbonate chemistry calculations in an OAE context from two measured parameters can require additional considerations. One is that particular OAE applications change not only TA or eventually DIC but also the major ion composition of seawater. For instance, for calcium-based OAE, with for instance calcium oxide or hydroxide (CaO and Ca(OH)2), for each mole of TA half a mole of Ca2+ will be added. This is the same for magnesium-based OAE, for instance with Mg(OH)2 or olivine (forsterite). For example, increasing TA by 500 µmol kg−1 would increase both calcium and magnesium ion concentrations by 250 µmol kg−1, i.e. by 2.5 % and 0.5 %, respectively, over seawater background levels at a salinity of 35.
For calcium-based OAE this means that calculations of calcium carbonate saturation states have to factor in the increase in the calcium-to-salinity ratio. In other words, using standard settings in various carbonate chemistry speciation calculation programs, e.g. CO2SYS, seacarb, and PyCO2SYS (for an overview see Orr et al., 2015), which derive calcium ion concentrations from salinity, will result in wrongly calculated saturation states. Hence, they would need to be calculated in a separate step from calculated carbonate ion and actual calcium concentrations (e.g. Moras et al., 2022), the programs being adapted or special functions used (for instance available for seacarb).
Furthermore, making changes to the matrix of the major ions in seawater also affects acid–base equilibria, i.e. stoichiometric dissociation constants such as for carbonic acid. Hence, one may also need to apply corrections to K1 and K2 for carbonic acid (Ben-Yakoov and Goldhaber, 1972), which then can be used to calculate carbonate chemistry speciation, either by hand (Zeebe and Wolf-Gladrow, 2001) or by adapting available programs. Furthermore, the solubility product of calcium carbonate, Ksp, needs to be corrected, which can be achieved by using the specific magnesium-to-calcium ratio in a seawater sample (Tyrell and Zeebe, 2004). Finally, the effects of major (and minor) ion composition changes on carbonate chemistry speciation can also be assessed by Pitzer modelling (for an overview see Turner et al., 2016), and there have been several programs and functions made available by the Scientific Committee on Oceanic Research (SCOR) Working Group 145, MARCHEMSPEC: Chemical Speciation Modelling in Seawater to Meet 21st Century Needs (http://marchemspec.org/, last access: 6 November 2023).
Key recommendations
Calcium carbonate (CaCO3) will precipitate in seawater when the saturation state is beyond certain thresholds (critically depending on the presence of organic matter or mineral precursors, among others). Hence, when it comes to determining carbonate chemistry speciation for samples with significantly increased total alkalinity (TA) at regular dissolved-inorganic-carbon (DIC) concentrations, CaCO3 that has precipitated prior to sampling has to be removed for most measurements (TA, DIC, spectrophotometric pH) as it interferes with the analytical procedures. Gentle pressure filtration, avoiding gas exchange of the sample with air, is recommended. Furthermore, if samples are to be stored prior to analysis, CaCO3 precipitation needs to be prevented, which can be achieved for TA (lowering the calcium carbonate saturation state by brief sparging with CO2) and DIC (acidifying the sample to reduce TA to natural pre-OAE conditions). Samples for fCO2 and pH cannot be stabilised and should therefore not be stored. Any sample that has been stored should be checked visually for potential CaCO3 precipitation on container walls or in suspension. For carbonate chemistry speciation calculations from two measured parameters, if experimental treatments have changed the Mg2+-to-Ca2+ ratio in seawater this should be considered by applying corrections to stoichiometric equilibrium constants. Also, experimental changes to Ca2+ concentrations mean that readily available calculation routines will report a wrong CaCO3 saturation state as simply related to salinity. Again, corrections have to be made.
No data sets were used in this article.
The manuscript was conceptually developed by all authors. Section 1.1 and 1.2 were led by AGD, Sect. 2 by LTB, and the rest by KGS. All authors contributed to writing, graphing, and editing.
Competing interests are declared in a summary for the entire volume at: https://sp.copernicus.org/articles/sp-oae2023-ci-summary.zip.
Publisher’s note: Copernicus Publications remains neutral with regard to jurisdictional claims made in the text, published maps, institutional affiliations, or any other geographical representation in this paper. While Copernicus Publications makes every effort to include appropriate place names, the final responsibility lies with the authors.
We thank the Ocean Acidification and other ocean Changes – Impacts and Solutions (OACIS), an initiative of the Prince Albert II of Monaco Foundation, for its support throughout the project. We extend our gratitude to the Villefranche Oceanographic Laboratory for supporting the meeting of the lead authors in January 2023. Finally we acknowledge Angela Stevenson for her invaluable support during the writing process.
This research has been supported by the ClimateWorks Foundation (grant no. 22-0296) and the Prince Albert II of Monaco Foundation. It has also been supported by the Carbon to Sea Initiative via the project OceanAlkAlign and the Australian Research Council (grant no. FT200100846).
This paper was edited by Rosalind Rickaby and reviewed by two anonymous referees.
Anbeek, C.: The dependence of dissolution rates on grain size for some fresh and weathered feldspars, Geochim. Cosmochim. Ac., 56, 3957–3970, 1992.
Bach, L. T.: The additionality problem of Ocean Alkalinity Enhancement, Biogeosciences Discuss. [preprint], https://doi.org/10.5194/bg-2023-122, in review, 2023.
Bach, L. T., Gill, S. J., Rickaby, R. E. M., Gore, S., and Renforth, P.: CO2 removal with enhanced weathering and ocean alkalinity enhancement: Potential risks and co-benefits for marine pelagic ecosystems, Front. Clim., 1, 7, https://doi.org/10.3389/fclim.2019.00007, 2019.
Ben-Yaakov, S. and Goldhaber, M. B.: The influence of seawater composition on the apparent constants of the carbonate system, Deep-Sea Res., 20, 87–99, 1972.
Bockmon, E. E. and Dickson, A. G.: An inter-laboratory comparison assessing the quality of seawater carbon dioxide measurements, Mar. Chem., 171, 36–43, 2015.
Byrne, R. H. Robert-Baldo, B., Thompson, S. W., and Chen, C. T. A.: Seawater pH measurements: an at-sea comparison of spectrophotometric and potentiometric methods, Deep-Sea Res., 35, 1405–1410, 1988.
Chave, K. E. and Suess, E.: Calcium Carbonate Saturation in Seawater: Effects of Dissolved Organic Matter, Limnol. Oceanogr., 15, 633–637, 1970.
Deffeys, K. S.: Carbonate equilibria: a graphic and algebraic approach, Limnol. Oceanogr., 10, 412–426, 1965.
Dickson. A. G.: The carbon dioxide system in seawater: equilibrium chemistry and measurements, in: Guide to Best Practices in Ocean Acidification Research and Data Reporting, edited by: Riebesell, U., Fabry, V. J., Hansson, L., Gattuso, J. P., 260 pp., Luxembourg, ISBN 1813-8519, 2010.
Dickson, A. G., Wesolowski, D. J., Palmer, D. A., and Mesmer, R. E.: Dissociation constant of bisulfate ion in aqueous sodium chloride solutions to 250 ∘C, J. Phys. Chem., 94, 7978–7985, https://doi.org/10.1021/j100383a042, 1990.
Dickson, A. G., Sabine, C. L., and Christian, J. R.: Guide to best practices for ocean CO2 measurements, PICES Special Publication 3, IOCCP Report 8, North Pacific Marine Science Organization, Sidney, British Columbia, 191 pp., https://doi.org/10.25607/OBP-1342, 2007.
Douglas, N. K. and Byrne, R. H.: Achieving accurate spectrophotometric pH measurements using unpurified meta-cresol purple, Mar. Chem., 190, 66–72, https://doi.org/10.1016/j.marchem.2017.02.004, 2017.
Eisaman, M. D., Geilert, S., Renforth, P., Bastianini, L., Campbell, J., Dale, A. W., Foteinis, S., Grasse, P., Hawrot, O., Löscher, C. R., Rau, G. H., and Rønning, J.: Assessing the technical aspects of ocean-alkalinity-enhancement approaches, in: Guide to Best Practices in Ocean Alkalinity Enhancement Research, edited by: Oschlies, A., Stevenson, A., Bach, L. T., Fennel, K., Rickaby, R. E. M., Satterfield, T., Webb, R., and Gattuso, J.-P., Copernicus Publications, State Planet, 2-oae2023, 3, https://doi.org/10.5194/sp-2-oae2023-3-2023, 2023.
Fennel, K., Long, M. C., Algar, C., Carter, B., Keller, D., Laurent, A., Mattern, J. P., Musgrave, R., Oschlies, A., Ostiguy, J., Palter, J. B., and Whitt, D. B.: Modelling considerations for research on ocean alkalinity enhancement (OAE), in: Guide to Best Practices in Ocean Alkalinity Enhancement Research, edited by: Oschlies, A., Stevenson, A., Bach, L. T., Fennel, K., Rickaby, R. E. M., Satterfield, T., Webb, R., and Gattuso, J.-P., Copernicus Publications, State Planet, 2-oae2023, 9, https://doi.org/10.5194/sp-2-oae2023-9-2023, 2023.
Flipkens, G., Fuhr, M., Fiers, G., Meysman, F. J. R., Town, R. M., and Blust, R.: Enhanced olivine dissolution in seawater through continuous grain collisions, Geochim. Cosmochim. Ac., 359, 84–99, https://doi.org/10.1016/j.gca.2023.09.002, 2023.
Fong, M. B. and Dickson, A. G.: Insights from GO-SHIP hydrography data into the thermodynamic consistency of CO2 system measurements in seawater, Mar. Chem., 211, 52–63, 2019.
Fuhr, K., Geilert, S., Schmidt, M., Liebetrau, V., Vogt, C., Ledwig, B., and Wallmann, K.: Kinetics of olivine weathering in seawater: An experimental study, Front. Clim., 4, 831587, https://doi.org/10.3389/fclim.2022.831587, 2022.
He, J. and Tyka, M. D.: Limits and CO2 equilibration of near-coast alkalinity enhancement, Biogeosciences, 20, 27–43, https://doi.org/10.5194/bg-20-27-2023, 2023.
Ho, D. T., Bopp, L., Palter, J. B., Long, M. C., Boyd, P. W., Neukermans, G., and Bach, L. T.: Monitoring, reporting, and verification for ocean alkalinity enhancement, in: Guide to Best Practices in Ocean Alkalinity Enhancement Research, edited by: Oschlies, A., Stevenson, A., Bach, L. T., Fennel, K., Rickaby, R. E. M., Satterfield, T., Webb, R., and Gattuso, J.-P., Copernicus Publications, State Planet, 2-oae2023, 12, https://doi.org/10.5194/sp-2-oae2023-12-2023, 2023.
Hudson-Heck, E., Liu, X., and Byrne, R. H.: Purification and Physical–Chemical Characterization of Bromocresol Purple for Carbon System Measurements in Freshwaters, Estuaries, and Oceans, ACS Omega, 6, 17941–17951, 2021.
Humphreys, M. P., Daniels, C. J., Wolf-Gladrow, D. A., Tyrell, T., and Achterberg, E. P.: On the influence of marine biogeochemical processes over CO2 exchange between the atmosphere and ocean, Mar. Chem., 199, 1–11, https://doi.org/10.1016/j.marchem.2017.12.006, 2018.
Jiang, L.-Q., Feely, R. A., Carter, B. R., Greeley, D. J., Gledhill, D. K., and Arzayus, K. M.: Climatological distribution of aragonite saturation state in the Global Oceans, Global Biogeochem. Cy., 29, 1656–1673, https://doi.org/10.1002/2015gb005198, 2015.
Lauvset, S. K., Key, R. M., Olsen, A., van Heuven, S., Velo, A., Lin, X., Schirnick, C., Kozyr, A., Tanhua, T., Hoppema, M., Jutterström, S., Steinfeldt, R., Jeansson, E., Ishii, M., Perez, F. F., Suzuki, T., and Watelet, S.: A new global interior ocean mapped climatology: the 1∘ × 1∘ GLODAP version 2, Earth Syst. Sci. Data, 8, 325–340, https://doi.org/10.5194/essd-8-325-2016, 2016.
Lenc, R., Schulz, K. G., and Bach, L. T.: Assessing the risk for alkalinity loss due to carbonate precipitation on particles after an ocean Alkalinity Enhancement Operation, Masters Thesis, Institute for Marine and Antarctic Studies (IMAS), University of Tasmania, https://figshare.utas.edu.au/category (last access: 9 November 2023), 2023.
Marion, G. M., Millero, F. J., and Feistel, R.: Precipitation of solid phase calcium carbonates and their effect on application of seawater SA–T–P models, Ocean Sci., 5, 285–291, https://doi.org/10.5194/os-5-285-2009, 2009.
Montserrat, F., Renforth, P., Hartmann, J., Leermakers, M., Knops, P., and Meysman, F. J. R.: Olivine Dissolution in Seawater: Implications for CO2 Sequestration through Enhanced Weathering in Coastal Environments, Environ. Sci. Technol., 51, 3960–3972, https://doi.org/10.1021/acs.est.6b05942, 2017.
Moras, C. A., Bach, L. T., Cyronak, T., Joannes-Boyau, R., and Schulz, K. G.: Ocean alkalinity enhancement – avoiding runaway CaCO3 precipitation during quick and hydrated lime dissolution, Biogeosciences, 19, 3537–3557, https://doi.org/10.5194/bg-19-3537-2022, 2022.
Moras, C., Bach, L., Cyronak, T., Joannes-Boyau, R., and Schulz, K.: Effects of grain size and seawater salinity on brucite dissolution and secondary calcium carbonate precipitation kinetics: implications for Ocean Alkalinity Enhancement, EGU General Assembly 2023, Vienna, Austria, 24–28 April 2023, EGU23-330, https://doi.org/10.5194/egusphere-egu23-330, 2023a.
Moras, C. A., Bach, L. T., Cyronak, T., Joannes-Boyau, R., and Schulz, K. G.: Preparation and quality control of in-house reference materials for marine dissolved inorganic carbon and total alkalinity measurements, Limnol. Oceanogr. Methods, https://doi.org/10.1002/lom3.10570, online first, 2023b.
Morse, J., Arvidson, R. S., and Lüttge, A.: Calcium Carbonate Formation and Dissolution, Chem. Rev., 107, 342–381, 2007.
Mucci, A.: The solubility of calcite and aragonite in seawater at various salinities, temperatures, and one atmosphere total pressure, Am. J. Sci., 283, 781–799, 1983.
Newton, J. A., Feely, R. A., Jewett, E. B., Williamson, P., and Mathis, J.: Global Ocean Acidification Observing Network: Requirements and Governance Plan, 2nd edn., UNESCO IOC, 2015.
Orr, J. C., Epitalon, J.-M., and Gattuso, J.-P.: Comparison of ten packages that compute ocean carbonate chemistry, Biogeosciences, 12, 1483–1510, https://doi.org/10.5194/bg-12-1483-2015, 2015.
Orr, J. C., Epitalon, J. M., Dickson, A. G., and Gattuso, J. P.: Routine uncertainty propagation for the marine carbon dioxide system, Mar. Chem., 207, 84–107, 2018.
Pan, Y., Li, Y., Ma, Q., He, H., Wang, S., Cai, W.-J., Dong, B. Di, Y., Fu, W., and Chen, C.-T. A.: The role of Mg2+ in inhibiting CaCO3 precipitation from seawater, Mar. Chem., 237, 104036, https://doi.org/10.1016/j.marchem.2021.104036, 2021.
Rau, G. H., Carroll, S. A., Bourcier, W. L., Singleton, M. J., Smith, M. M., and Aines, R. D.: Direct electrolytic dissolution of silicate minerals for air CO2 mitigation and carbon-negative H2 production, P. Natl. Acad. Sci. USA, 110, 10095–10100, https://doi.org/10.1073/pnas.1222358110, 2013.
Schulz, K. G. and Maher, D. T.: Atmospheric Carbon Dioxide and Changing Ocean Chemistry, in: Marine Pollution – Monitoring, Management and Mitigation, edited by: Reichelt-Brushett, A., Springer, https://doi.org/10.1007/978-3-031-10127-4, 2023.
Schulz, K. G., Bach, L. T., Bellerby, R. G. J., Bermúdez, R., Büdenbender, J., Boxhammer, T., Czerny, J., Engel, A., Ludwig, A., Meyerhöfer, M., Larsen, A., Paul, A. J., Sswat, M., and Riebesell, U.: Phytoplankton blooms at increasing levels of atmospheric carbon dioxide: Experimental evidence for negative effects on prymnesiophytes and positive on small picoeukaryotes, Frontiers, Mar. Sci., 4, 64, https://doi.org/10.3389/fmars.2017.00064, 2017.
Simkiss, K.: The inhibitory effects of some metabolites on the precipitation of calcium carbonate from artificial and natural seawater, ICES J. Mar. Sci., 29, 6–18, 1964.
Subhas, A. V., Marx, L., Reynolds, S., Flohr, A., Mawji, E. W., Brown, P. J., and Cael, B. B.: Microbial ecosystem responses to alkalinity enhancement in the North Atlantic Subtropical Gyre, Front. Clim., 4, 784997, https://doi.org/10.3389/fclim.2022.784997, 2022.
Sulpis, O., Lauvset, S. K., and Hagens, M.: Current estimates of K1* K2* appear inconsistent with measured CO2 system parameters in cold oceanic regions, Ocean Sci., 16, 847–862, https://doi.org/10.5194/os-16-847-2020, 2020.
Takeshita, Y., Warren, J. K., Liu, X., Spaulding, R. S., Byrne, R. H., Carter, B. R., DeGrandpre, M. D., Murata, A., and Watanabe, S.: Consistency and stability of purified meta-cresol purple for spectrophotometric pH measurements in seawater, Mar. Chem., 236, 104018, https://doi.org/10.1016/j.marchem.2021.104018, 2021.
Turner, D. R., Achterberg, E. P., Chen, C.-T. A., Clegg, S. L., Hatje, V., Maldonado, M. T., Snader, S. G., van den Berg, C. M. G., and Wells, M.: Toward a Quality-Controlled and Accessible Pitzer Model for Seawater and Related Systems, Front. Mar. Sci., 3, 139, https://doi.org/10.3389/fmars.2016.00139, 2016.
Tyka, M. D., Van Arsdale, C., and Platt, J. C.: CO2 capture by pumping surface acidity to the depp ocean, Energy Environ. Sci., 15, 786–798, https://doi.org/10.1039/D1EE01532J, 2022.
Tyrell, T. and Zeebe, R. E.: History of carbonate ion concentration over the last 100 million years, Geochim. Cosmochim. Ac., 68, 3521–3530, 2004.
Uppström, L. R.: The boron/chlorinity ratio of deep-sea water from the Pacific Ocean, Deep-Sea Res. Oceanogr. Abstracts, 21, 161–162, https://doi.org/10.1016/0011-7471(74)90074-6, 1974.
van Heuven, S., Pierrot, D., Rae, J. W. B., Lewis, E., and Wallace, D. W. R.: MATLAB Program Developed for CO2 System Calculations, ORNL/CDIAC-105b, Carbon Dioxide Information Analysis Center, Oak Ridge National Laboratory, U.S. Department of Energy, Oak Ridge, Tennessee, https://github.com/jamesorr/CO2SYS-MATLAB (last access: 6 November 2023), 2011.
Zeebe, R. and Wolf-Gladrow, D.: CO2 in Seawater: Equilibrium, Kinetics, Isotopes, Elsevier Science B.V., Amsterdam, the Netherlands, 360 pp., ISBN 0444509461, 2001.
Zhong, S. and Mucci, A.: Calcite and aragonite precipitation from seawater solutions of various salinities: Precipitation rates and overgrowth compositions., in: Kinetic Geochemistry, edited by: Schott, J. and Lasaga, A. C., Chem. Geol., 78, 283–299, 1989.
- Abstract
- Seawater carbonate chemistry revisited
- Sampling and storage of TA-enriched water
- Carbonate chemistry measurements of TA-enriched water
- Carbonate chemistry calculations
- Data availability
- Author contributions
- Competing interests
- Disclaimer
- Acknowledgements
- Financial support
- Review statement
- References