the Creative Commons Attribution 4.0 License.
the Creative Commons Attribution 4.0 License.
 | 27 Sep 2023 | OSR7 | Chapter 4.3
Intense wind-driven coastal upwelling in the Balearic Islands in response to Storm Blas (November 2021)
Baptiste Mourre
Emma Reyes
Pablo Lorente
Alex Santana
Jaime Hernández-Lasheras
Ismael Hernández-Carrasco
Maximo García-Jove
Nikolaos D. Zarokanellos
This article analyses the Balearic Islands wind-driven coastal upwelling in response to the intense and long-lasting Storm Blas, which affected the western Mediterranean Sea in November 2021. The storm was associated with a pronounced pressure low, generating heavy rains and intense winds and showing some characteristics of a tropical cyclone. The Balearic Islands area was particularly affected since the core of the storm was moving over a 1-week-long period from the south-west of this area to just above the islands of Menorca and Mallorca. High-resolution regional forecast models indicated that the intense north-easterly winds blowing over the region during the first days of the storm led to the development of intense upwellings along the north-western coasts of the islands of Mallorca and Ibiza together with a reversal of the surface current. While the clouds associated with the storm prevented the radiometers on board satellites to precisely observe the evolution of the sea surface signature of the upwelling, signals of enhanced chlorophyll concentration were still detected in the upwelling region. The high-resolution Western Mediterranean Operational Prediction System model, which downscales the Copernicus Marine Service Mediterranean predictions, is used to describe the characteristics of this intense coastal-upwelling event, as well as to analyse its singularity over the past-9-year time series through the comparison of different coastal-upwelling indices. The upwelling event is found to have a duration of 3 d (considering its effects on the sea surface temperature) with a spatial offshore extension of around 20 km. It was characterized by intense cold coastal sea surface anomalies of around 6 ∘C. While it was the most intense event over the past 9 years in terms of local cross-shore sea surface temperature gradients, it is ranked second in terms of the intensity of cross-shelf transports, behind the Storm Gloria upwelling event in January 2020. This study demonstrates the benefits of operational oceanography for the characterization of extreme events through the provision of time series of high-resolution modelling results in the coastal area.
- Article
(5466 KB) - Full-text XML
-
Supplement
(851 KB) - BibTeX
- EndNote


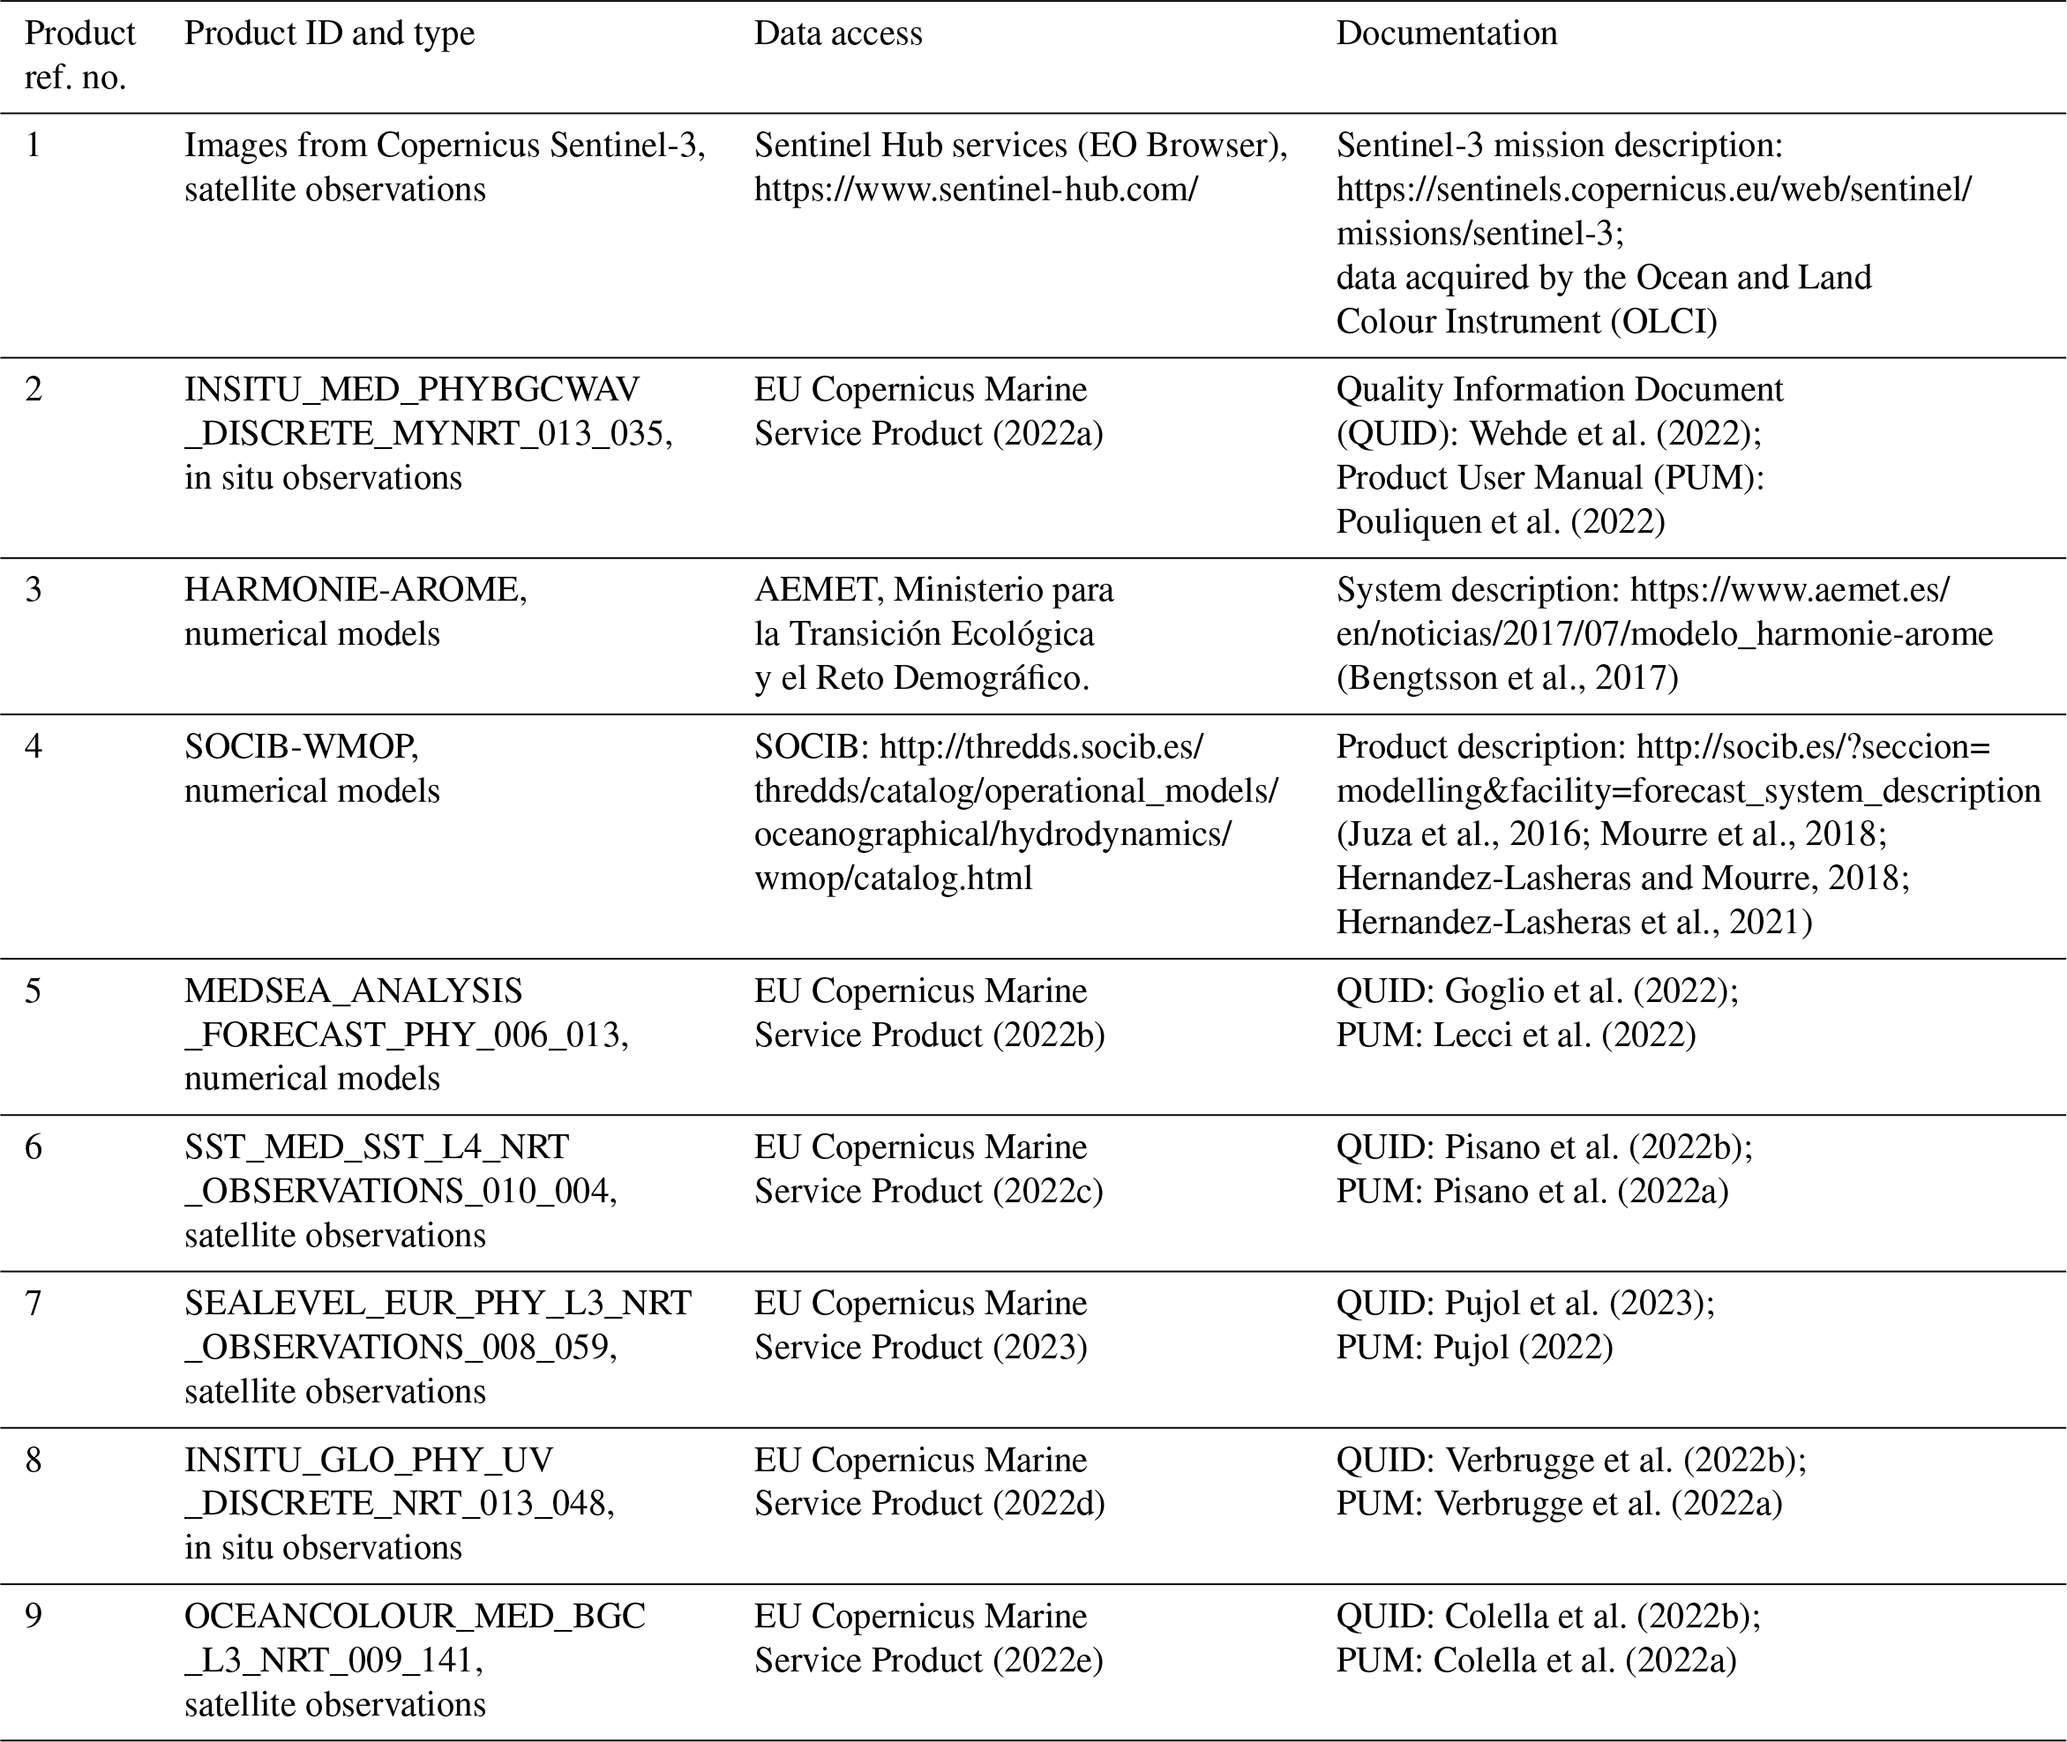
Table 1Products from the Copernicus Marine Service and other complementary datasets used in this study, including the Product User Manual and quality information. For complementary datasets, the link to the product description, data access and scientific references are provided. Last access for all web pages cited in this table: 14 April 2023.
Storm Blas1 was an intense Mediterranean cyclone which affected the western Mediterranean Sea from 6 to 18 November 2021. It was first identified on 6 November between the Balearic Islands and Sardinia before moving westwards towards the Balearic archipelago. After the core of the storm looped over the island of Mallorca on 11 November, exhibiting a well-defined, circular, deep (∼10 hPa) low-pressure centre, it then moved eastwards while developing a spiral structure resembling that of tropical cyclones. The storm then moved over the islands of Sardinia and Corsica before weakening and dissipating in the Tyrrhenian Sea on 18 November. Figure 1a and b show the distribution of clouds over the affected area on 7 and 13 November, as observed by Sentinel-3 Ocean and Land Colour Instrument (OLCI) satellite true-colour images.
This situation created extreme conditions of intense winds and high waves as well as heavy rainfall in the Balearic archipelago. In particular, intense north-easterly winds were blowing over the area during the first phase of the storm from 5 to 7 November (Fig. 1c, d), creating favourable conditions for coastal upwelling along the north-western coasts of the islands of Mallorca and Ibiza. The peak of this wind event occurred on 6 November around 10:00 UTC, with hourly mean values over 17.5 m s−1 off the island of Mallorca, as represented by the HARMONIE-AROME model (Bengtsson et al., 2017) from the Spanish Meteorological Agency (AEMET).
Coastal upwelling is an oceanic process which generates upward vertical currents at the coast in response to an offshore transport of surface waters produced under the action of an intense or sustained alongshore wind stress. In the Northern Hemisphere, the wind has to blow with the coast on its left-hand side to be favourable to upwelling. By bringing cold and nutrient-rich deep waters close to the surface, the upwelling has significant effects on the physical and biogeochemical characteristics of coastal waters, generally enhancing the local primary productivity and then playing an important role in marine ecosystems (Pauly and Christensen, 1995). In the western Mediterranean Sea, wind-induced upwelling is known to occur along the French coast (Millot et al., 1979; Rey et al., 2000; Bakun and Agostini, 2001), the western and eastern coasts of Sardinia (Olita et al., 2013; Salusti, 1998), and the north-western Alboran Sea (Sarhan et al., 2000; Macias et al., 2008). Eddy-induced coastal upwelling has also been evidenced in the Ligurian Sea (Casella et al., 2011) and along the Algerian coast (Millot et al., 1985). To our knowledge, no upwelling has been reported yet in the Balearic Islands. While the frequent north-north-westerly mistral wind events do not present the appropriate orientation to generate upwelling along the north-western coast of the Balearic Islands, favourable conditions with intense north-easterly winds are occasionally met during specific storms such as Gloria in January 2020 (Amores et al., 2020; Sotillo et al., 2021; Álvarez-Fanjul et al., 2022) or Blas in November 2021. Notice that these winds blow in the opposite direction of the established Balearic Current, which flows north-eastwards along the north-western coast of the Balearic Islands (Lopez-García et al., 1994).
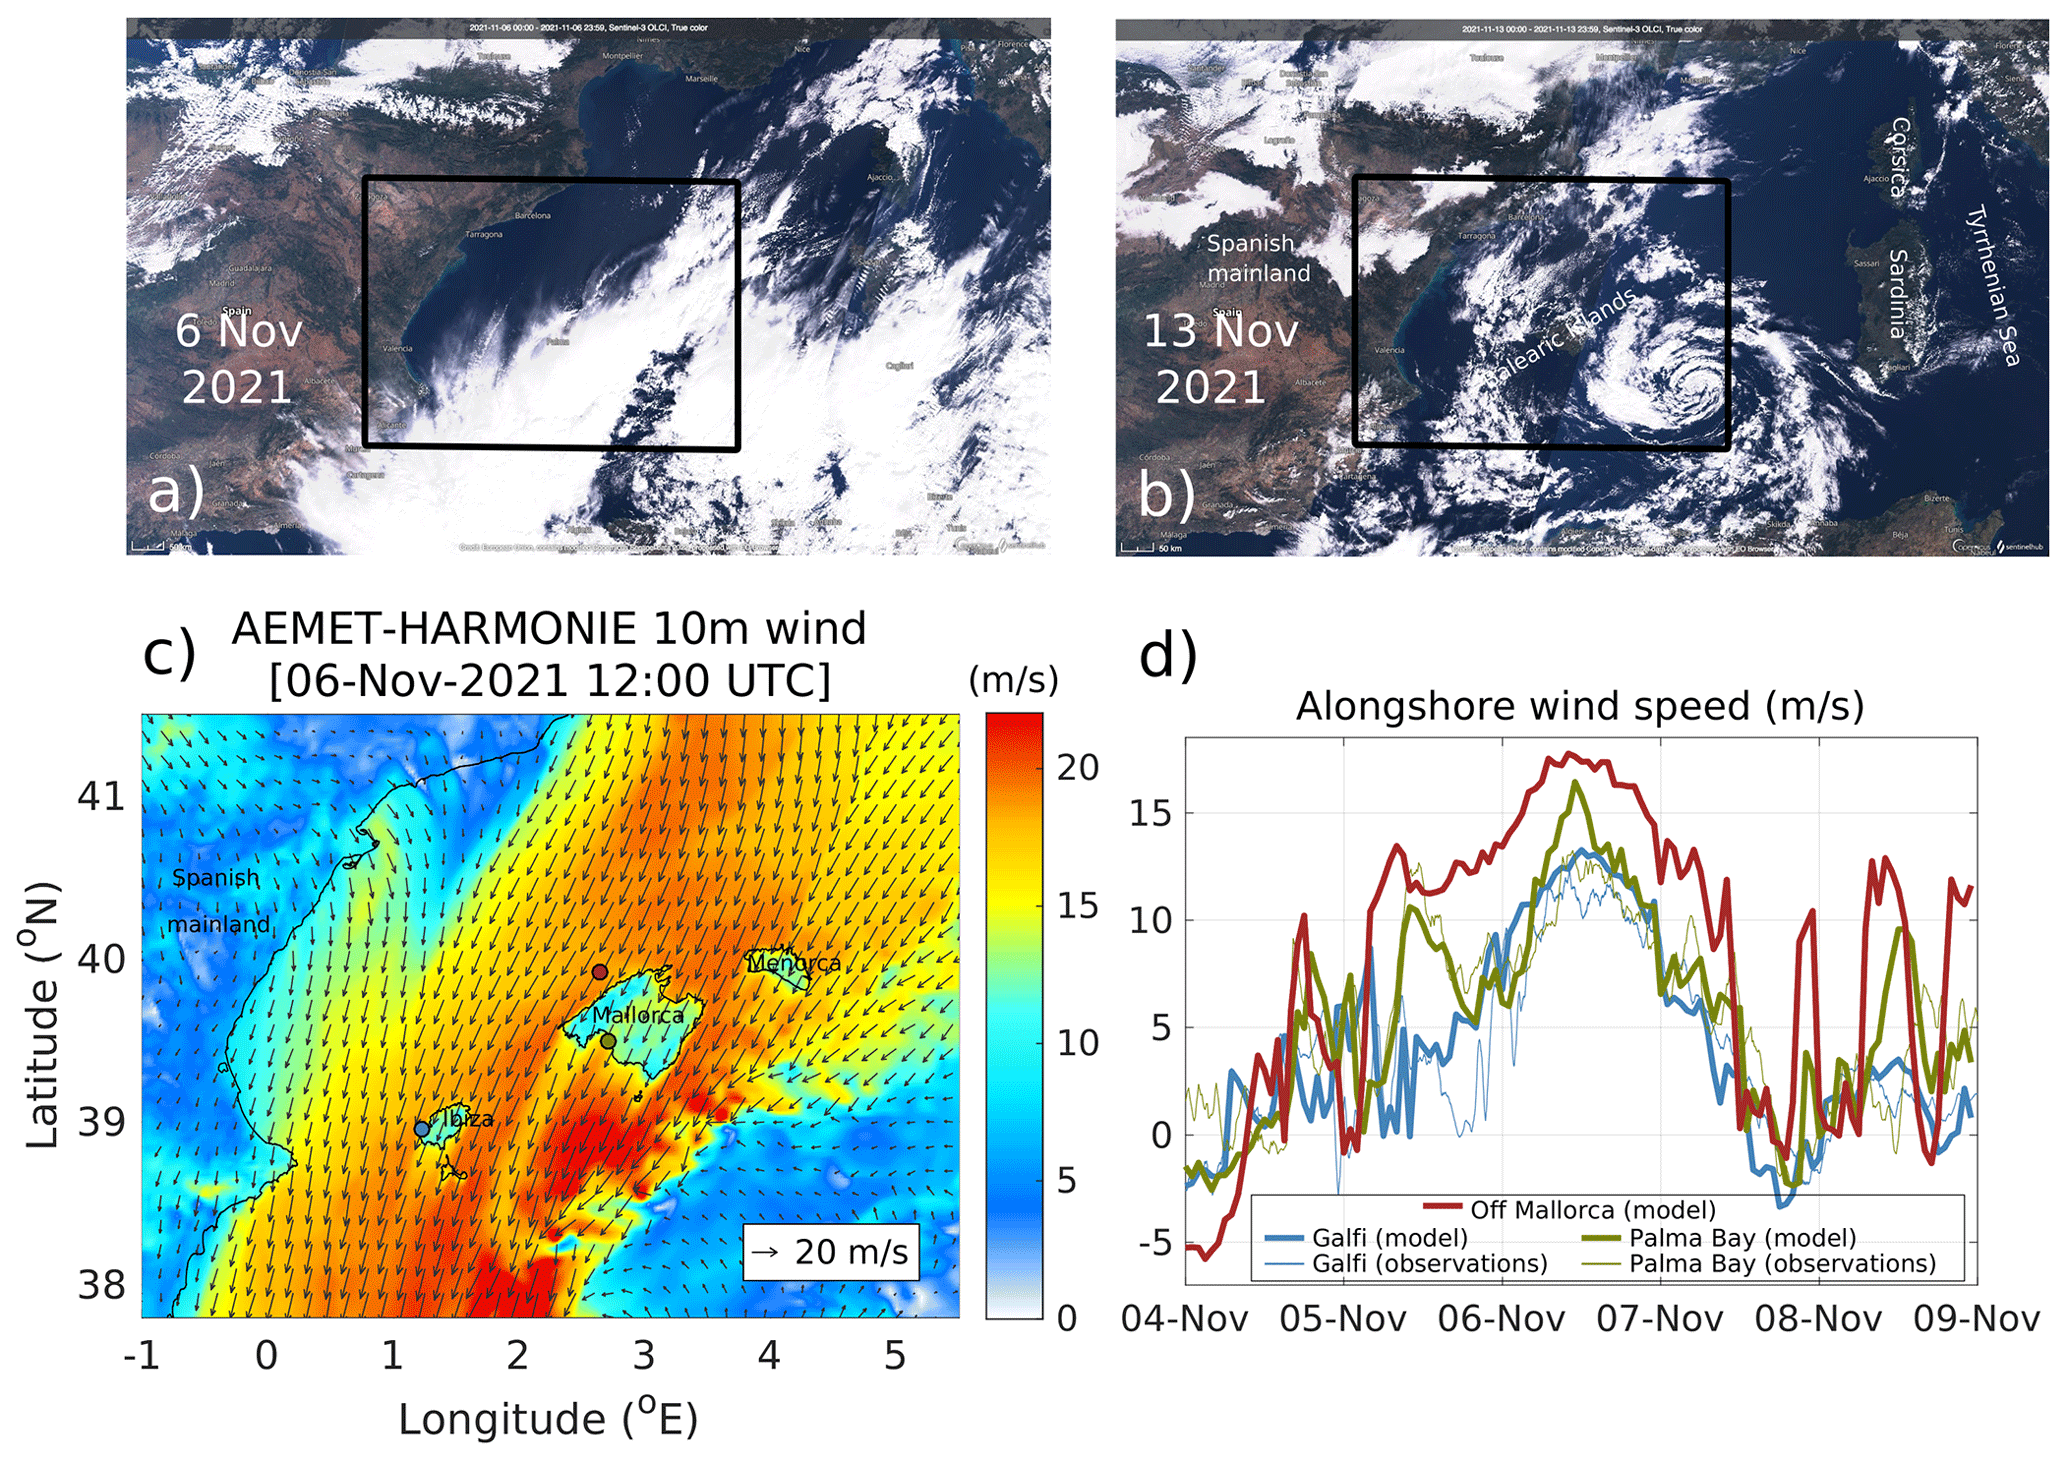
Figure 1Upper panels: true-colour image from Sentinel-3 OLCI captured over the western Mediterranean Sea on (a) 6 November 2021 and (b) 13 November 2021. Lower panels: (c) 10 m wind map on 6 November 2021 from the AEMET HARMONIE-AROME prediction model over the area delimited by the black rectangles in panels (a) and (b), (d) time series of alongshore 10 m wind speed from the model and observations at the three locations (1: automatic weather station of Puig des Galfí in Ibiza; 2: oceanographic buoy of Palma Bay in Mallorca; 3: virtual station off the north-western coast of Mallorca) represented in panel (c). “Alongshore” is defined here considering the direction of the north-western coast of the island of Mallorca making an angle of 123∘ with respect to the north, with positive values south-westwards.
This study was motivated by the intense sea surface temperature (SST) gradients along the north-western coast of the Balearic Islands seen in high-resolution regional prediction models during the first phase of Storm Blas, together with observations of surface current reversal from high-frequency (HF) radar measurements along the north-western coast of the island of Ibiza. The objective of this study is to characterize this unusually intense upwelling in terms of both its surface signature and its vertical structure, as well as to evaluate its singularity within the time series of different upwelling indices computed over the past decade. The main source of information is a high-resolution numerical prediction model given the very limited number of in situ and satellite observations available during this event.
2.1 Numerical models
We analyse the outputs of the Western Mediterranean Operational Prediction System (WMOP2; Juza et al., 2016; Mourre et al., 2018) developed at the Balearic Islands Coastal Observing and Forecasting System (SOCIB; Tintoré et al., 2013). The WMOP is a 2 km regional configuration of the Regional Ocean Modeling System (ROMS; Shchepetkin and McWilliams, 2005) implemented over the western Mediterranean Sea. It uses high-resolution (1 h, 2.5 km) atmospheric forcing from the HARMONIE-AROME model (Bengtsson et al., 2017) provided by AEMET. Notice that before February 2019, the HIRLAM model was used as atmospheric forcing with a resolution of 5 km and 1 h (3 h before March 2017). The WMOP downscales the conditions of the Copernicus Marine Service Mediterranean analysis and forecast model (CMEMS-MED; Clementi et al., 2021), which are used as open boundary conditions. It also includes assimilation of observations from satellite SST, along-track sea level anomaly, Argo temperature and salinity profiles as well as surface currents in the Ibiza channel, applying a local multimodel ensemble optimal interpolation approach as described in Hernandez-Lasheras and Mourre (2018) and Hernandez-Lasheras et al. (2021), with a 3 d cycle.
We also consider the outputs of the CMEMS-MED model, which provides a spatial resolution of around 4 km. This system includes variational data assimilation of temperature and salinity vertical profiles and along-track satellite sea level anomaly observations through a 3D-VAR scheme (Dobricic and Pinardi, 2008). The atmospheric forcing is provided by the predictions from the European Centre for Medium-Range Weather Forecasts3 with a spatial resolution close to 10 km and a temporal resolution of 1 h.
2.2 Ocean colour satellite observations
High-resolution ocean colour imagery was analysed to detect the enhancement of the surface chlorophyll a (Chl a) concentration during the upwelling. The Level 3 ocean colour product distributed by the Copernicus Marine Service (Volpe et al., 2019) was used. It provides surface Chl a concentration from the OLCI on board the Sentinel-3 satellite with a 300 m resolution. Notice that clouds were present over the study area during the storm period, which limited the availability of exploitable high-resolution satellite observations. The Sentinel-3 OLCI observations were the only available satellite data that were found to give relevant information for the detection of the upwelling signature during the study period.
2.3 Upwelling indices
Several upwelling indices (UIs) have been used in the literature with the objective of estimating the intensity of coastal upwelling. These indices are based on either the cross-shore SST differences (Demarcq and Faure, 2000), the alongshore surface current velocities (Lorente et al., 2020) or the cross-shore Ekman transport related to the forcing winds (Bakun, 1973), sometimes also incorporating the effect of cross-shore geostrophic flows (Marchesiello and Estrade, 2010; Rossi et al., 2013; Jacox et al., 2018). This study compares four UIs computed over the 9-year time series of the WMOP operational model outputs:
- i.
UISST first quantifies the temperature differences between the coast (SSTcoast) and a location 25 km offshore (SSToffshore) off the north-western coast of the island of Mallorca (edges of the magenta cross-shore section illustrated in Fig. 2a). As in Marchesiello and Estrade (2010), the observed differences are normalized by the vertical temperature differences between the surface and 200 m depth (T200 m) at the offshore end of the section according to the following formula:
This normalized formulation allows scaling of the horizontal temperature differences by the vertical ones. A value close to 1 indicates a fully developed upwelling with SST values at the coast equal to the temperatures at 200 m depth. Since this formulation of UISST generates very high values in situations when the upper ocean is vertically mixed during winter (denominator close to 0), the index is only computed here when the vertical temperature difference is larger than 1 ∘C.
- ii.
The second index is based on alongshore surface current velocities, as first proposed in Lorente et al. (2020) as a proof-of-concept investigation. This index was specifically designed to be applied in any coastal area where surface velocities are available from HF radar instruments. It assumes that the alongshore wind stress is the primary driver of upwelling circulation and that the surface currents are highly responsive to local winds (e.g. Paduan and Ronsenfeld, 1996; Kohut et al., 2006). This index is defined here as the average alongshore surface velocity () in the 25 km wide coastal region off the north-western coast of the island of Mallorca, following Eq. (2).
The overbar denotes the average over the rectangular box containing the two magenta sections represented in Fig. 2. The alongshore direction is the direction of the corresponding magenta section. It makes an angle of 123∘ with respect to the north. Positive values denote south-westward flows. Further details about the methodology and application of this index can be found in Lorente et al. (2023; present issue of the Ocean State Report).
- iii.
The third index is the classical cross-shore Ekman transport index, computed from the alongshore wind stress. It is defined as follows:
where τalongshore is the alongshore wind stress, ρ is the water density, and f is the Coriolis frequency. The integral is computed along the magenta alongshore section over a distance L of 60 km. UIEkman transport represents the total transport across this section. Positive values indicate an offshore transport.
Finally, the last index computes the total cross-shore model transport in the upper 50 m across the same section. This depth approximately corresponds to the depth of the Ekman layer as illustrated in Fig. 3. It includes not only the Ekman transport, but also the cross-shore geostrophic transport and other contributions due to the cross-shore wind component and potential effects associated with the spatial variability in the wind stress curl. It is calculated following Eq. (4):
where Vcross-shore is the model horizontal velocity in the cross-shore direction.
Figure 2 illustrates the surface circulation patterns and associated SST in the WMOP and CMEMS-MED predictions models on 7 November 2022 at 06:00 UTC (the time with the most significant impact of the upwelling on the SST). The SST exhibits marked upwelling signatures in the WMOP model along the north-western coast of the islands of Mallorca and Ibiza, with the temperature of surface waters around 6 ∘C colder at the coast compared to 20 km offshore. The surface coastal current flows south-westwards along the wind direction, which is reversed with respect to the direction of the Balearic Current under normal conditions (Lopez-García et al., 1994). The offshore width of the upwelled-water region ranges from 10 to 20 km, which slightly extends off the 200 m isobath. The upwelling is also represented in the CMEMS-MED model, but with a less pronounced signature. It is out of the scope of this short article to investigate these differences between models, but the lower spatial resolution of both the model grid and atmospheric forcing may have an important role in producing these discrepancies. The upwelled water only reaches the surface in the northern half of the north-western coast of the island of Mallorca in CMEMS-MED, yet with a larger offshore extension compared to the WMOP. The event duration based on its effect on the SST was around 3 d, i.e. from 5 November at 15:00 UTC, when the first cross-shore coastal SST gradients were observed, until 8 November at 12:00 UTC, when they vanished.
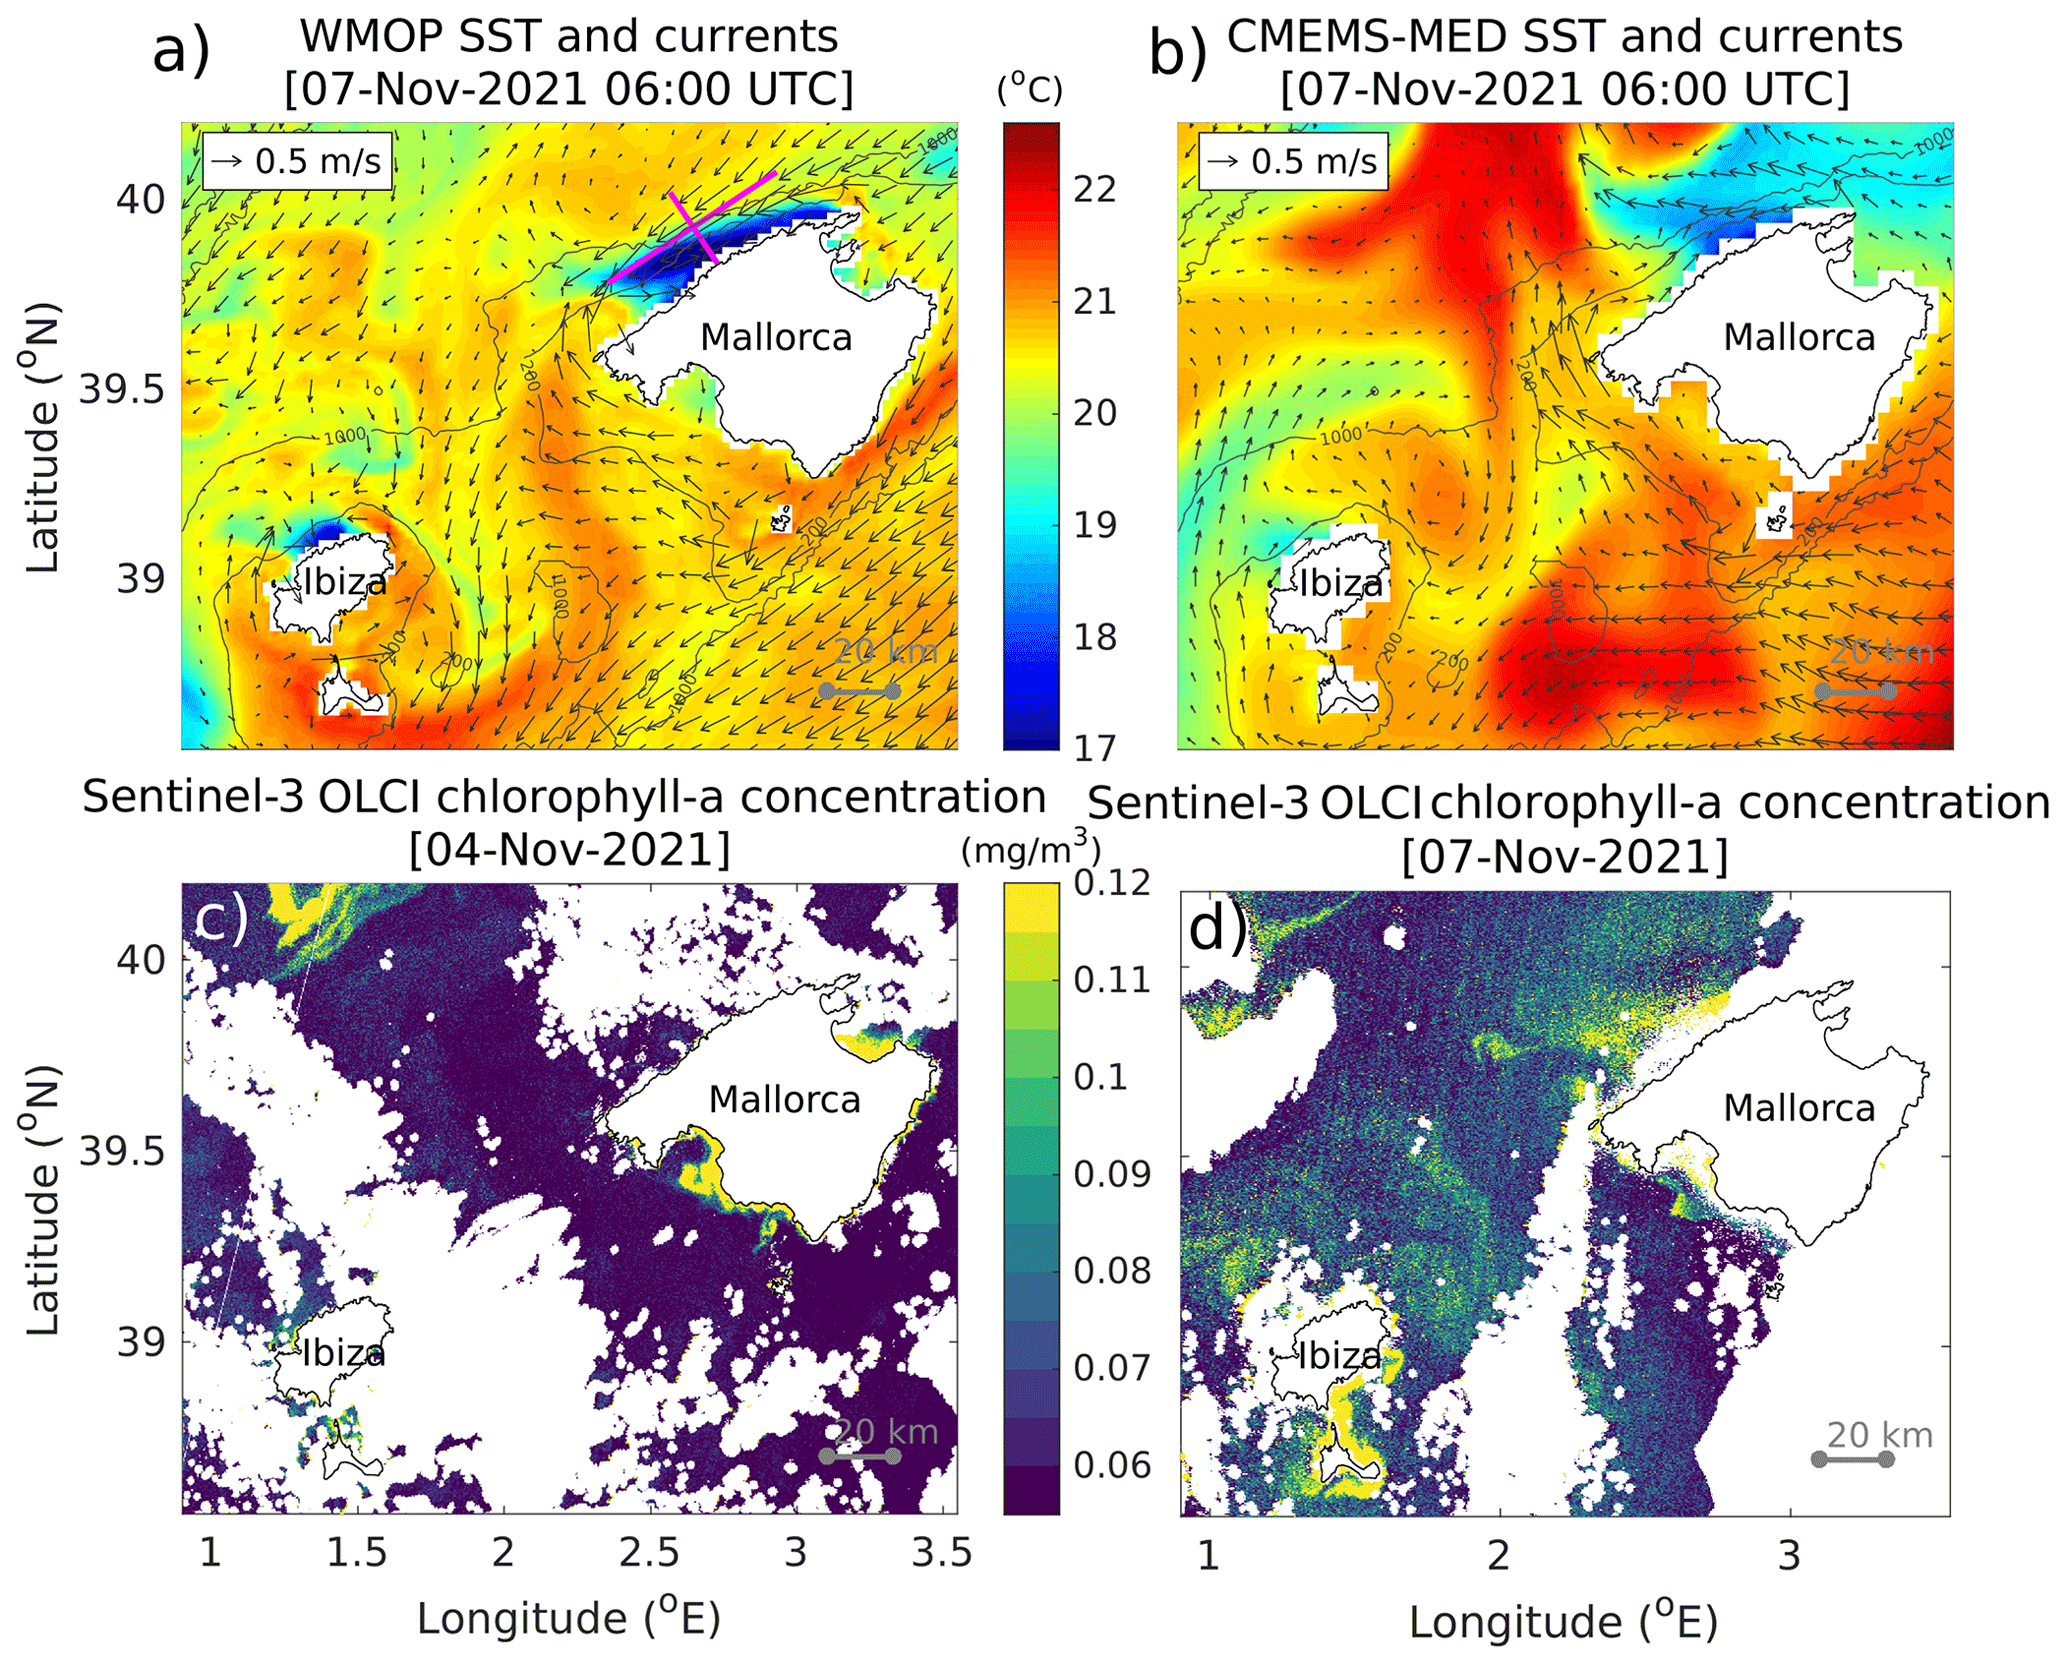
Figure 2Upper panels: SST and surface currents around the islands of Mallorca and Ibiza on 7 November 2021 at 06:00 UTC as represented by the (a) WMOP and (b) CMEMS-MED models. In panel (a), the lines in magenta represent the alongshore and cross-shore sections used in Sects. 3 and 4. Lower panels: Chl a concentration as observed by Sentinel-3 OLCI on (c) 4 November and (d) 7 November (i.e. before and during Storm Blas, respectively).
As illustrated in Fig. 1, the storm was associated with a dense cloud coverage, which only allowed very partial satellite remote sensing information on SST and Chl a concentration. Despite this important limitation, the two most relevant ocean colour images illustrated in Fig. 2 hint at the enhancement of the Chl a concentration along the north-western coast of the island of Mallorca. While a low concentration of Chl a was detected on 4 November before the storm, a significant increase was observed on 7 November. The Chl a concentration reached 0.1 mg m−3, a magnitude more than twice as large as that observed 3 d before. While the satellite-derived Chl a in coastal areas should be interpreted carefully, particularly under cloudy conditions, no evident errors have been identified in the associated quality index (QI). The QI measures for every pixel the difference between the observation and the climatological average, normalized by the climatological standard deviation. The QI maps for 4 and 7 November are included in the Supplement (Fig. S1), showing values ranging from 1 to 2 in the area of enhanced Chl a, with a peak above 4 in the near-coastal zone. Moreover, sediment resuspension is unlikely to affect the quality of the data due to the steep local topography. Also, the Lagrangian analysis of surface water trajectories in the northern part of the island of Mallorca (Fig. S2) allows the hypothesis of a lateral advection of Chl a from the northern bay (Alcúdia Bay) towards the north-western coast of the island to be rejected. As a consequence, and within the limitations of both the model and observations, we believe that the spatial consistency between the observed patch of enhanced Chl a and the model upwelling area is probably indicative of an upwelling-induced local enhancement of Chl a.
Figure 3 illustrates the vertical structure of the temperature and velocity fields along the cross-shore section off the north-western coast of the island of Mallorca, as represented by the WMOP model. While velocities are illustrated on 6 November at 12:00 UTC, corresponding to the maximum wind intensity in this area (Fig. 1), the temperature is displayed 18 h later to illustrate the time with the maximum signature in SST. The temperature section (Fig. 3a) shows a typical pattern of upwelling with an upward tilting of the isotherms towards the coast, which is associated with an upward transport of colder deep waters along the topographic slope. The surface temperature decreases by 6 ∘C across the upwelling front, varying from 20.6 ∘C 20 km offshore, where the mixed layer depth is around 50 m, to 14.6 ∘C at the coast. The cross-shore velocity section (Fig. 3b) shows an offshore displacement of surface waters in the upper 50 m, consistent with the Ekman theory in the presence of alongshore winds. Cross-shore velocities (Fig. 3c) reach 0.3 m s−1. The alongshore velocity along this cross-shelf section is characterized by the intense south-westward coastal jet with surface velocities exceeding 1 m s−1. Upward vertical velocities (Fig. 3d) are enhanced along the topographic slope, with values between 40 and 60 m d−1 in the upper 100 m and in the first 12 km from the coast. Overall, these cross-shelf sections illustrate a relatively thin (cross-shore extension around 20 km) but intense upwelling with a significant coastal jet.
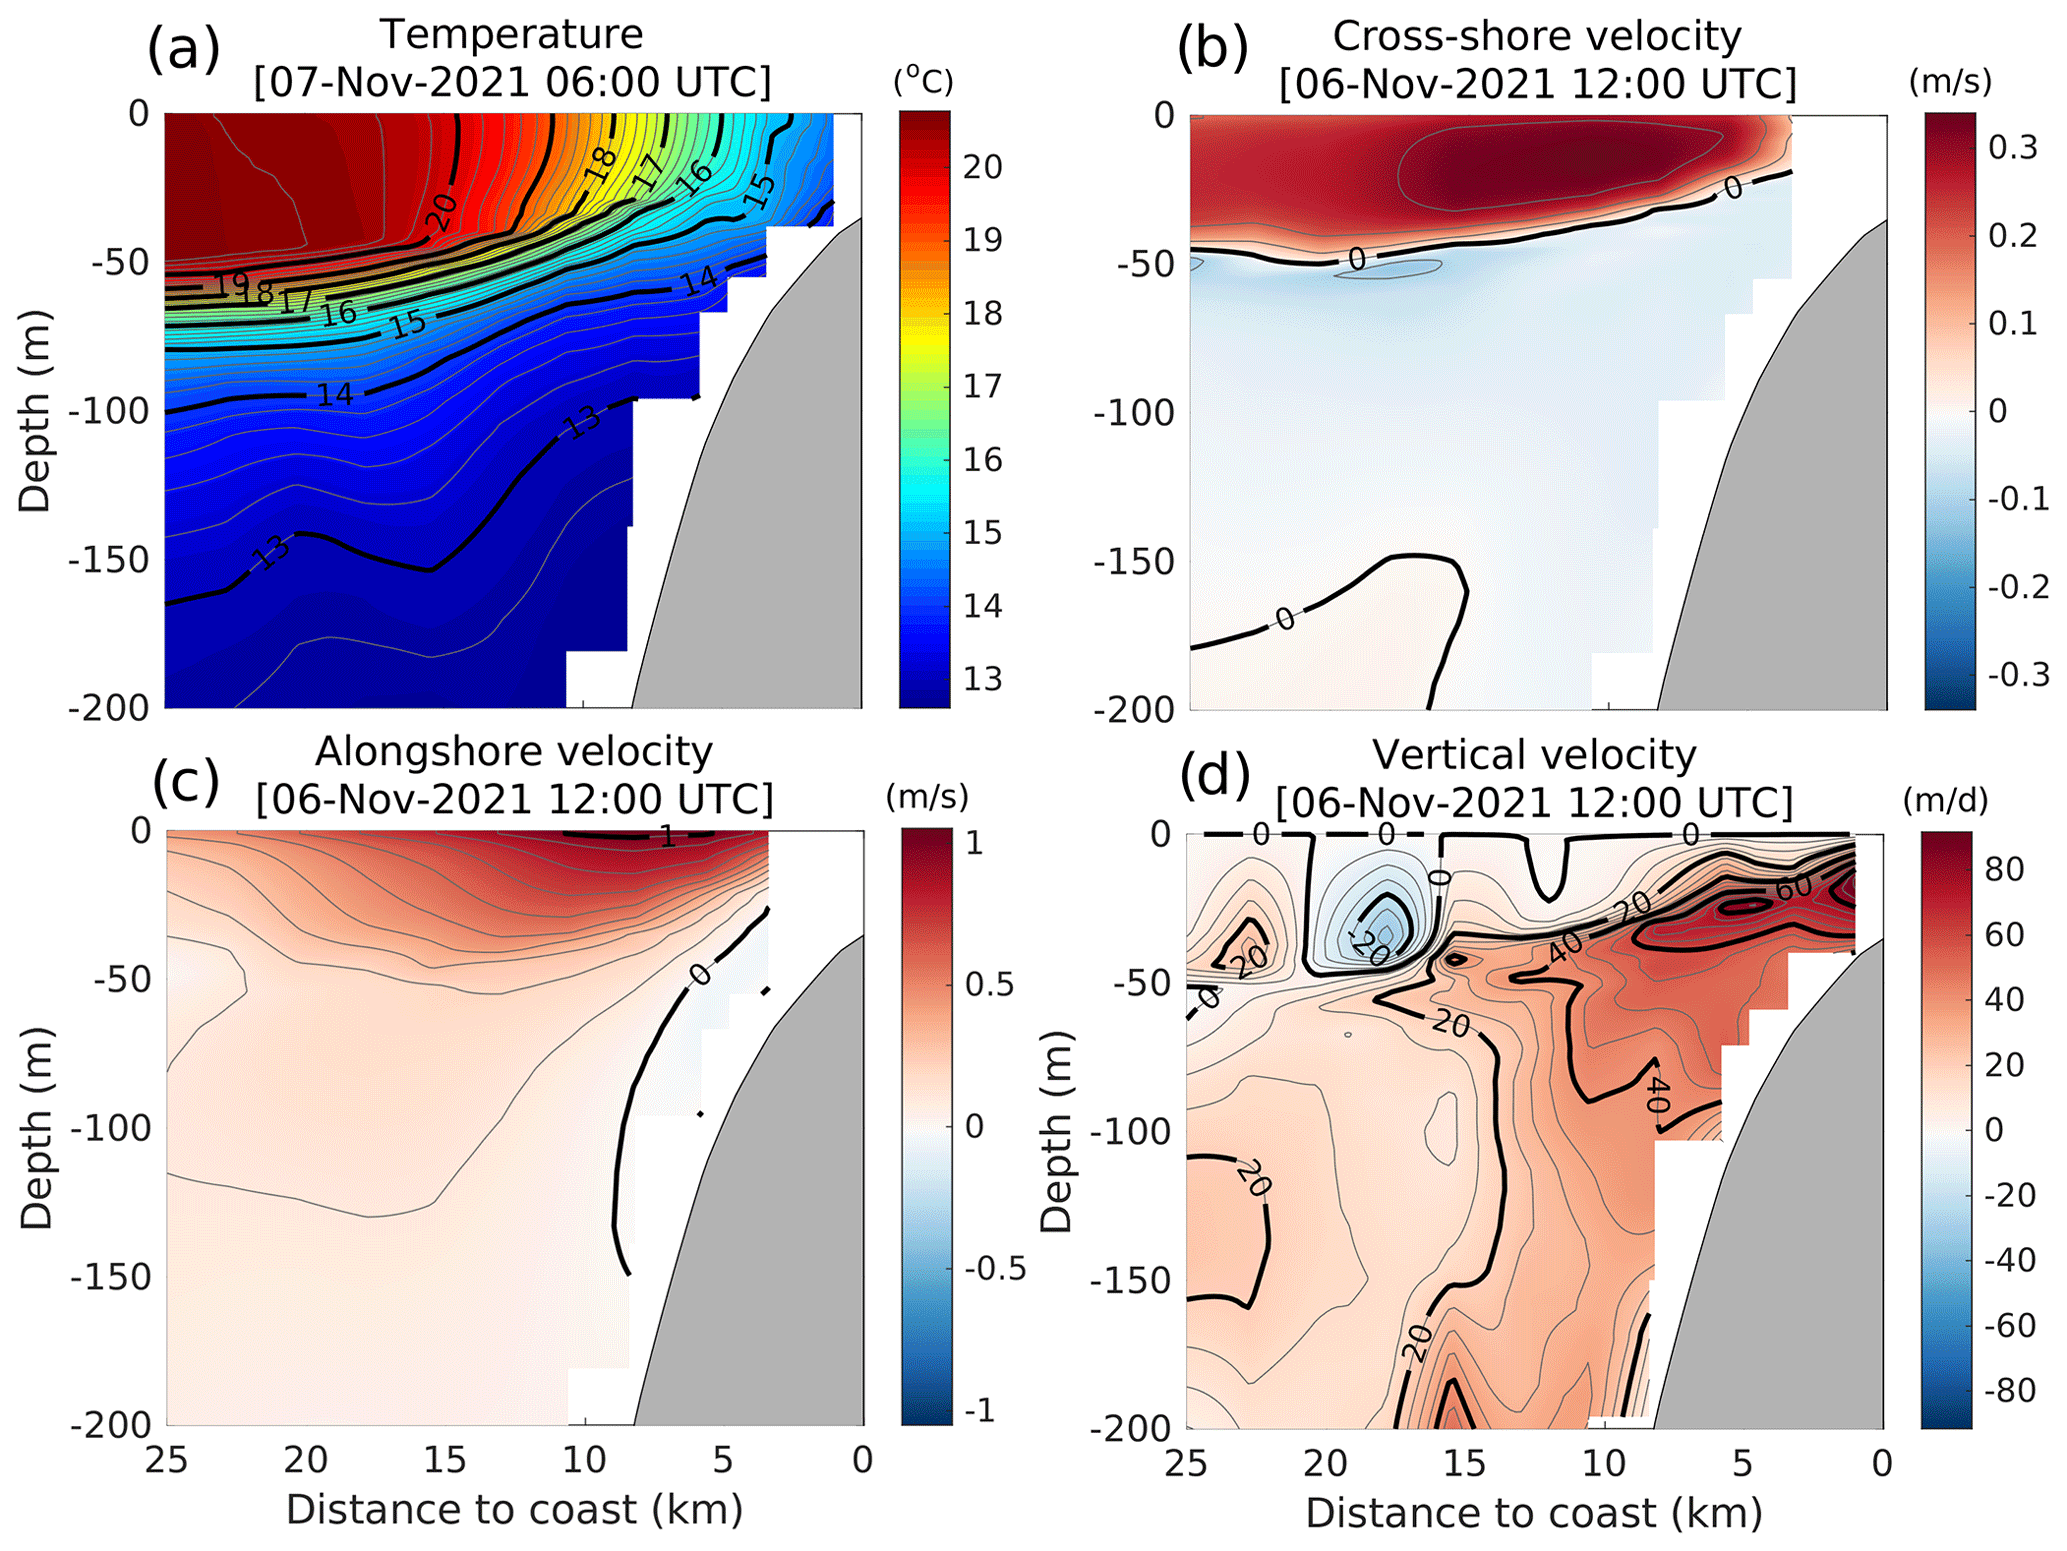
Figure 3Sections of WMOP model fields along the cross-shore magenta line represented in Fig. 2: (a) temperature on 7 November 2021 at 06:00 UTC, (b) cross-shore velocity, (c) alongshore velocity and (d) vertical velocity on 6 November 2021 at 12:00 UTC.
How singular was this intense wind-driven coastal-upwelling event? To answer this question, we compute here several upwelling indices (described in Sect. 2.3) over the whole WMOP model time series covering the 9-year period between August 2013 and June 2022. The first index, representing the normalized cross-shelf SST gradients, ranks the November 2021 event (i.e. Storm Blas) as the most intense event of the whole time series. It is the only event with a normalized cross-shelf SST gradient exceeding 0.5. The event is also the most intense according to the second index, which measures the intensity of the alongshore surface velocity. However, the Ekman and total cross-shelf transport indices indicate a larger transport during the other extreme event associated with Storm Gloria in January 2020. This is especially true for the total transport, which also accounts for the effects of the wind stress curl and cross-shore geostrophic transport. During both the Gloria and Blas upwelling events, the offshore total transport was enhanced with respect to the Ekman estimate. A third very intense storm in January 2017 (also documented in García-León et al., 2018) led to a slightly larger cross-shore Ekman transport but a lower total transport compared to Blas. The effects on the SST and coastal jet are particularly marked during the Blas upwelling event due to its occurrence in early November, when the surface ocean stratification was still significant. In contrast and despite the intense offshore transport during the upwelling event associated with Storm Gloria, the effects on the SST were hardly noticeable due to the presence of mixed surface waters. Note that the SST index is only computed when the vertical temperature difference between the surface and 200 m depth is larger than 1 ∘C, which significantly limits the use of the SST-based index during the winter season. However, this was not the case during the Gloria event, which showed values just above 1 ∘C.
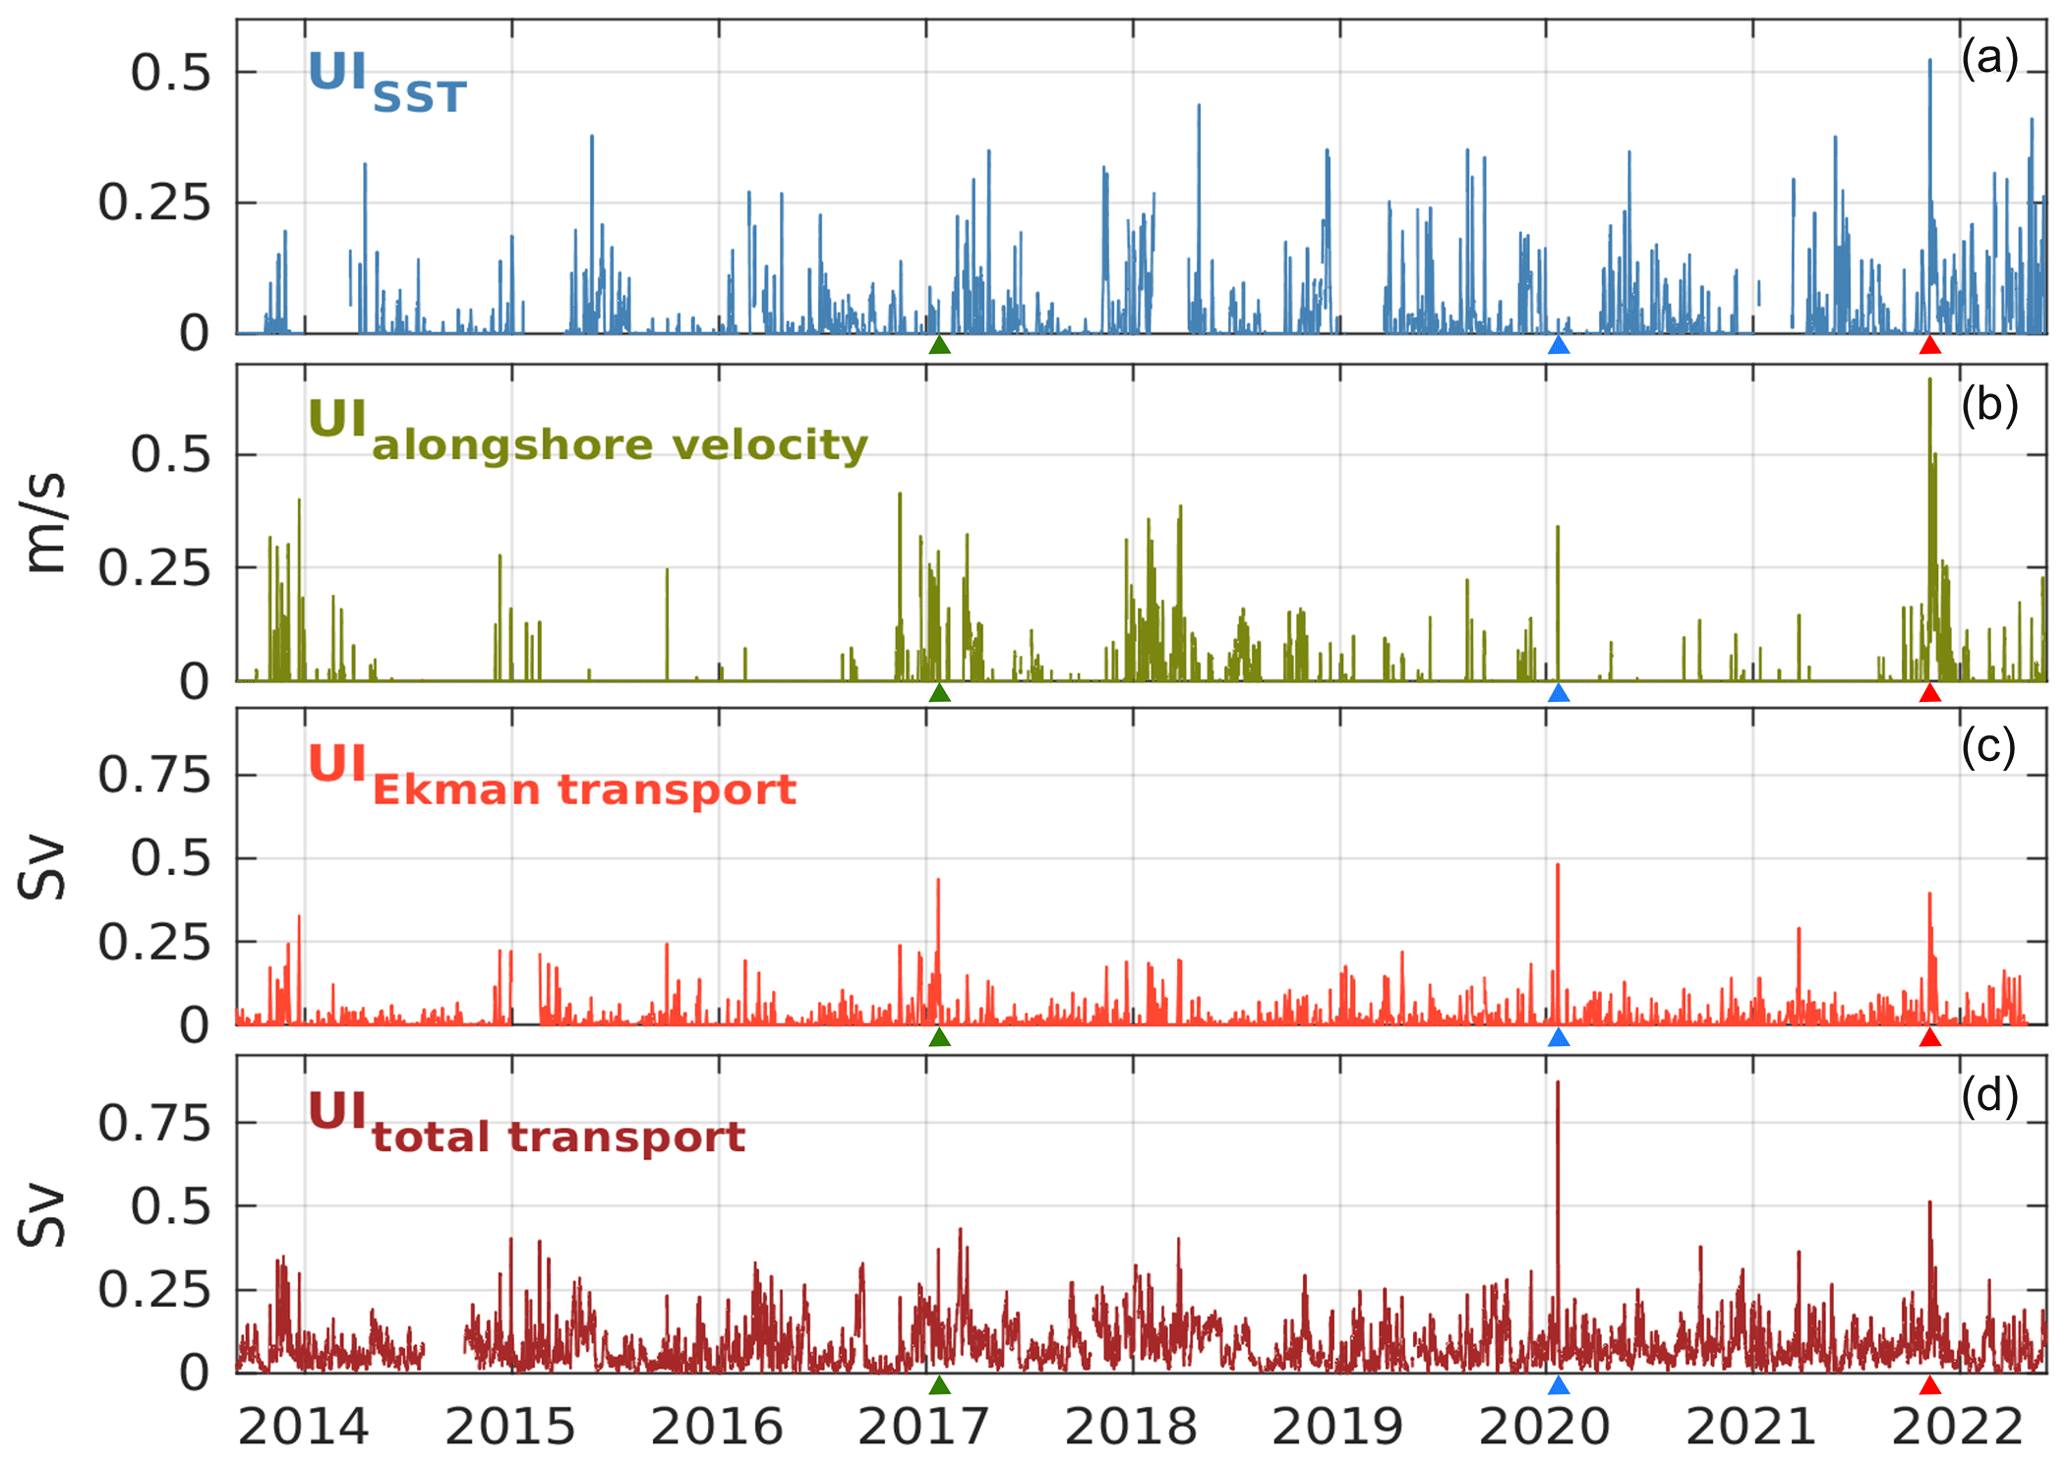
Figure 4Time series of upwelling indices defined in Sect. 2.3 between August 2013 and June 2022 (3-hourly values are shown after applying a 24 h running average): (a) cross-shore normalized SST gradient index, (b) alongshore velocity index, (c) cross-shore Ekman transport index, (d) cross-shore total transport index. The red, blue and green triangles on the x axis mark the time of the Blas, Gloria and January 2017 storms, respectively.
This study describes some of the characteristics of a short (5–8 November 2021) but intense wind-driven coastal-upwelling event along the north-western coast of the Balearic Islands, as represented by a high-resolution forecast model during Storm Blas in November 2021. The time series of several upwelling indices illustrate the episodicity of upwelling events in this area, mainly related to their nature related to the occurrence of storms with intense north-easterly winds.
While the November 2021 Blas-related event was the most intense in terms of the effects on the SST and alongshore velocities over the 9-year-long time series analysed, the induced cross-shelf surface transport was lower than that modelled during Storm Gloria in January 2020, whose effects on the wind, waves, sea level and currents were already reported as a record-breaking event in the literature (Álvarez-Fanjul et al., 2022). This comparison illustrates the difference between upwelling indices for the characterization of the intensity of these events. In particular, the magnitude of SST gradients or alongshore velocity does not necessarily reveal the whole intensity of the underlying offshore transport. A careful analysis of the time series would allow appropriate thresholds to be determined for the different indices so as to define suitable criteria for the identification of the upwelling. The duration would certainly be an additional relevant parameter for the operational definition of these events. Here, for instance, the event duration corresponding to a threshold of 0.25 Sv for the total offshore transport was 42 h for the Blas-related upwelling, 51 h for Gloria and 21 h for the January 2017 event. In the particular case of Blas, this duration is shorter than 3 d, i.e. the value obtained when considering the effect on the SST, highlighting the sensitivity of these metrics to the index and threshold under consideration.
Such storm-driven coastal upwelling is especially difficult to monitor given their short timescale and the absence of in situ observations in this area. The dense cloud coverage associated with the storm also significantly limits the availability of high-resolution satellite observations to characterize the surface signature of the phenomenon. In this context, high-resolution operational regional ocean models help overcome these limitations, providing timely and accurate information to identify and characterize these events. The only available ocean colour image from satellites suggests an increase in primary productivity in a coastal area which corresponds to the area of upwelled water in the model. While the lack of complementary observations prevents the realism of the model fields from being properly evaluated, the consistency between the spatial structure of observed Chl a enhancement and model upwelled water seems to indicate a reasonable representation of the effect of the upwelling process in the model. High spatial resolution (close to kilometric) is needed in both the model grid and the atmospheric forcing to describe such coastal phenomena whose cross-shore extension does not exceed 20 km.
Despite its short duration, this phenomenon was found to be sufficient to enhance the surface Chl a concentration. A more comprehensive understanding of the impacts of these storm-related upwelling events on local ecosystems would need further investigation requiring dedicated monitoring systems. Underwater gliders equipped with sensors of both physical and biogeochemical parameters can be suitable observation platforms for these studies given their capacity to operate under any weather conditions. In the future, the possible increase in the intensity and duration of the storms affecting the western Mediterranean area (Gaertner et al., 2007; Romero and Emanuel, 2013; González-Alemán et al., 2019) could lead to enhanced impacts of such storm-related upwelling events. While this study presents a first analysis over the last 9 years, it will be important to analyse these events in the longer term with a climate perspective when multi-decadal, kilometre-scale reanalysis simulations become available in the study area.
The model and observation products used in this study from both the Copernicus Marine Service and other sources are listed in Table 1.
The supplement related to this article is available online at: https://doi.org/10.5194/sp-1-osr7-15-2023-supplement.
BM, ER, AS, JHL, IHC, MGJ and NDZ designed the study through interactive discussions in the framework of working team meetings. BM and ER created the figures. BM prepared the article with contributions from all co-authors. ER analysed HF radar and in situ observations. PL provided expertise in the definition of upwelling indices. AS analysed the atmospheric fields and computed the Ekman transport. NDZ and IHC contributed to the analysis of ocean colour images. JHL and MGJ analysed WMOP and CMEMS-MED model outputs. All authors participated in the iterations and revision of the manuscript.
The contact author has declared that none of the authors has any competing interests.
Publisher’s note: Copernicus Publications remains neutral with regard to jurisdictional claims in published maps and institutional affiliations.
This study was conducted using information from the European Union's Copernicus Marine Service. The results of this article were obtained using the HARMONIE-AROME atmospheric fields provided by the Spanish Meteorological Agency (AEMET, Ministerio para la Transición Ecológica y el Reto Demográfico). The authors are very grateful to AEMET for providing these fields. The authors also thank SOCIB and Puertos del Estado for collecting oceanic and atmospheric observations around the Balearic Islands and distributing them through both their institutional websites and the Copernicus database.
This paper was edited by Joanna Staneva and reviewed by Riccardo Torres and one anonymous referee.
Álvarez-Fanjul, E., Pérez Gómez, M., Alonso-Muñoyerr, M. de A., Jiménez, P. L., Sotillo, M. G., Lin-Ye, J., Lecocq, A., Serna, M. R. G. de la, Rubio, S. P., Clementi, E., Coppini, G., García-León, M., Muñoz, D. S., Rico, M. Y. L., Mestres, M., Molina, R., Tintoré, J., Mourre, B., Masina, S., Mosso, C., Reyes, E., and Santana, A.: Western Mediterranean record-breaking storm Gloria: An integrated assessment based on models and observations, in: Copernicus Ocean State Report, Issue 6, edited by: von Schuckmann, K., Le Traon, P.-Y., Smith, N., Pascual, A., Djavidnia, S., Brasseur, P., and Grégoire, M., J. Oper. Oceanogr., 15, Supplement 1, 1–220, https://doi.org/10.1080/1755876X.2022.2095169, 2022.
Amores, A., Marcos, M., Carrió, D. S., and Gómez-Pujol, L.: Coastal impacts of Storm Gloria (January 2020) over the north-western Mediterranean, Nat. Hazards Earth Syst. Sci., 20, 1955–1968, https://doi.org/10.5194/nhess-20-1955-2020, 2020.
Bakun, A.: Coastal upwelling indices, west coast of North America, 1946-71, NOAA technical report NMFS SSRF, https://repository.library.noaa.gov/view/noaa/9041 (last access: 14 April 2023), 1973.
Bakun, A. and Agostini, V. N.: Seasonal patterns of wind-induced upwelling/downwelling in the Mediterranean Sea, Sci. Mar., 65, 243–257, 2001.
Bengtsson, L., Andrae, U., Aspelien, T., Batrak, Y., Calvo, J., Rooy, W. de, Gleeson, E., Hansen-Sass, B., Homleid, M., Hortal, M., Ivarsson, Karl-Ivar Lenderink, G., Niemelä, S., Nielsen, K. P., Onvlee, J., Rontu, L., Samuelsson, P., Muñoz, D. S., Subias, A., Tijm, S., Toll, V., Yang, X., and Køltzow, M. Ø.: The HARMONIE–AROME model configuration in the ALADIN–HIRLAM NWP system, Mon. Weather Rev., 145, 1919–1935, 2017.
Casella, E., Molcard, A., and Provenzale, A.: Mesoscale vortices in the Ligurian Sea and their effect on coastal upwelling processes, J. Marine Syst., 88, 12–19, 2011.
Clementi, E., Aydogdu, A., Goglio, A. C., Pistoia, J., Escudier, R., Drudi, M., Grandi, A., Mariani, A., Lyubartsev, V., Lecci, R., Cretí, S., Coppini, G., Masina, S., and Pinardi, N.: Mediterranean Sea Physical Analysis and Forecast (CMEMS MED-Currents, EAS6 system), Version 1, Copernicus Monitoring Environment Marine Service (CMEMS) [data set], https://doi.org/10.25423/CMCC/MEDSEA_ANALYSISFORECAST_PHY_006_013_EAS6, 2021.
Colella, S., Böhm, E., Cesarini, C., Garnesson, P., Netting, J., and Calton, B.: EU Copernicus Marine Service Product User Manual for the Mediterranean Sea Ocean Colour Plankton, Reflectance, Transparency and Optics L3 NRT daily observations, OCEANCOLOUR_MED_BGC_L3_NRT_009_141, Issue 3.0, Mercator Ocean International, https://catalogue.marine.copernicus.eu/documents/PUM/CMEMS-OC-PUM.pdf (last access: 14 April 2023), 2022a.
Colella, S., Brando, V. E., Di Cicco, A., D’Alimonte, D., Forneris, V., and Bracaglia, M.: EU Copernicus Marine Service Quality Information Document for the Mediterranean Sea Ocean Colour Plankton, Reflectance, Transparency and Optics L3 NRT daily observations, OCEANCOLOUR_MED_BGC_L3_NRT_009_141, Issue 2.0, Mercator Ocean International, https://catalogue. marine.copernicus.eu/documents/QUID/CMEMS-OC-QUID-009-141to144-151to154.pdf (last access: 14 April 2023), 2022b.
Demarcq, H. and Faure, V.: Coastal upwelling and associated retention indices derived from satellite SST. Application to Octopus vulgaris recruitment, Oceanol. Acta, 23, 391–408, 2000.
Dobricic, S. and Pinardi, N.: An oceanographic three-dimensional variational data assimilation scheme, Ocean Model., 22, 89–105, 2008.
EU Copernicus Marine Service Product: Mediterranean Sea- In-Situ Near Real Time Observations, Mercator Ocean International [data set], https://doi.org/10.48670/moi-00044, 2022a.
EU Copernicus Marine Service Product: Mediterranean Sea Physics Analysis and Forecast, Mercator Ocean International [data set], https://doi.org/10.25423/CMCC/MEDSEA_ANALYSISFORECAST_PHY_006_013_EAS7, 2022b.
EU Copernicus Marine Service Product: Mediterranean Sea High Resolution and Ultra High Resolution Sea Surface Temperature Analysis, Mercator Ocean International [data set], https://doi.org/10.48670/moi-00172, 2022c.
EU Copernicus Marine Service Product: Global Ocean- in-situ Near real time observations of ocean currents, Mercator Ocean International [data set], https://doi.org/10.48670/moi-00041, 2022d.
EU Copernicus Marine Service Product: Mediterranean Sea Ocean Colour Plankton, Reflectance, Transparency and Optics L3 NRT daily observations, Mercator Ocean International [data set], https://doi.org/10.48670/moi-00297, 2022e.
EU Copernicus Marine Service Product: European Seas Along Track L 3 Sea Level Anomalies Nrt Tailored For Data Assimilation, Mercator Ocean International [data set], https://doi.org/10.48670/moi-00140, 2023.
Gaertner, M. A., Jacob, D., Gil, V., Domínguez, M., Padorno, E., Sánchez, E., and Castro, M.: Tropical cyclones over the Mediterranean Sea in climate change simulations, Geophys. Res. Lett., 34, L14711, https://doi.org/10.1029/2007GL029977, 2007.
García-León, M.: Coastal Risk Forecast System: Fostering Proactive Management at the Catalan Coast, Doctoral dissertation, Polytechnic University of Catalonia, Barcelona, http://hdl.handle.net/2117/330131 (last access: 14 April 2023), 2018.
Goglio, A.-C., Clementi, E., Grandi, A., Mariani, A., Giurato, M., and Aydogdu, A.: EU Copernicus Marine Service Quality Information Document for the Mediterranean Sea Physics Analysis and Forecast, MEDSEA_ANALYSISFORECAST_PHY_006_013, Issue 2.3, Mercator Ocean International, https://catalogue.marine.copernicus.eu/documents/QUID/CMEMS-MED-QUID-006-013.pdf (last access: 14 April 2023), 2022.
González-Alemán, J. J., Pascale, S., Gutierrez-Fernandez, J., Murakami, H., Gaertner, M. A., and Vecchi, G. A.: Potential increase in hazard from Mediterranean hurricane activity with global warming, Geophys. Res. Lett., 46, 1754–1764, 2019.
Hernandez-Lasheras, J. and Mourre, B.: Dense CTD survey versus glider fleet sampling: comparing data assimilation performance in a regional ocean model west of Sardinia, Ocean Sci., 14, 1069–1084, https://doi.org/10.5194/os-14-1069-2018, 2018.
Hernandez-Lasheras, J., Mourre, B., Orfila, A., Santana, A., Reyes, E., and Tintoré, J.: Evaluating high-frequency radar data assimilation impact in coastal ocean operational modelling, Ocean Sci., 17, 1157–1175, https://doi.org/10.5194/os-17-1157-2021, 2021.
Jacox, M. G., Edwards, C. A., Hazen, E. L., and Bograd, S. J.: Coastal upwelling revisited: Ekman, Bakun, and improved upwelling indices for the U.S. west coast, J. Geophys. Res., 123, 7332–7350, 2018.
Juza, M., Mourre, B., Renault, L., Gómara, S., Sebastián, K., Lora, S., Beltran, J. P., Frontera, B., Garau, B., Troupin, C., Torner, M., Heslop, E., Casas, B., Escudier, R., Vizoso, G., and Tintoré, J.: SOCIB operational ocean forecasting system and multi-platform validation in the Western Mediterranean Sea, J. Oper. Oceanogr., 9, s155–s166, 2016.
Kohut, J. T., Glenn, S. M., and Paduan, J. D.: Inner-shelf response to tropical storm Floyd. J. Geophys. Res., 111, C09S91, https://doi.org/10.1029/2003JC002173, 2006.
Lecci, R., Drudi, M., Grandi, A., Creti, S., and Clementi, M.: EU Copernicus Marine Service Product User Manual for the Mediterranean Sea Physics Analysis and Forecast, MEDSEA_ANALYSISFORECAST_PHY_006_013, Issue 2.2, Mercator Ocean International, https://catalogue.marine.copernicus.eu/documents/PUM/CMEMS-MED-PUM-006-013.pdf (last access: 14 April 2023), 2022
Lopez-García, M. J., Millot, C., Font, J., and Garcia-Ladona, E.: Surface circulation variability in the Balearic Basin, J. Geophys. Res., 99, 3285–3296, 1994.
Lorente, P., Piedracoba, S., Montero, P., Sotillo, M. G., Ruiz, M. I., and Álvarez-Fanjul, E.: Comparative Analysis of Summer Upwelling and Downwelling Events in NW Spain: A Model-Observations Approach, Remote Sens.-Basel, 2020, 12, 2762, https://doi.org/10.3390/rs12172762, 2020.
Lorente, P., Rubio, A., Reyes, E., Solabarrieta, L., Piedracoba, S., Tintoré, J., and Mader, J.: High-frequency radar-derived coastal upwelling index, in: 7th edition of the Copernicus Ocean State Report (OSR7), edited by: von Schuckmann, K., Moreira, L., Le Traon, P.-Y., Grégoire, M., Marcos, M., Staneva, J., Brasseur, P., Garric, G., Lionello, P., Karstensen, J., and Neukermans, G., Copernicus Publications, State Planet, 1-osr7, 8, https://doi.org/10.5194/sp-1-osr7-8-2023, 2023.
Macías, D., Bruno, M., Echevarría, F., Vázquez, A., and García, C. M.: Meteorologically-induced mesoscale variability of the North-western Alboran Sea (southern Spain) and related biological patterns, Estuar. Coast. Shelf S., 78, 250–266, 2008.
Marchesiello, P. and Estrade, P.: Upwelling limitation by onshore geostrophic flow, J. Mar. Res., 68, 37–62, 2010.
Millot, C.: Wind induced upwellings in the Gulf of Lions, Oceanol. Acta, 2, 261–274, 1979.
Millot, C.: Some features of the Algerian Current, J. Geophys. Res.-Oceans, 90, 7169–7176, 1985.
Mourre B., Aguiar, E., Juza, M., Hernandez-Lasheras, J., Reyes, E., Heslop, E., Escudier, R., Cutolo, E., Ruiz, S., Mason, E., Pascual, A., and Tintoré, J.: Assessment of high-resolution regional ocean prediction systems using multi-platform observations: illustrations in the Western Mediterranean Sea, in: “New Frontiers in Operational Oceanography”, edited by: Chassignet, E., Pascual, A., Tintoré, J., and Verron, J., GODAE Ocean View, 663–694, https://doi.org/10.17125/gov2018.ch24, 2018.
Olita, A., Ribotti, A., Fazioli, L., Perilli, A., and Sorgente, R.: Surface circulation and upwelling in the Sardinia Sea: A numerical study, Cont. Shelf Res., 71, 95–108, 2013.
Paduan, J. D. and Rosenfeld, L. K.: Remotely sensed surface currents in Monterey Bay from shore-based HF radar (CODAR), J. Geophys. Res., 101, 20669–20686, 1996.
Pauly, D. and Christensen, V.: Primary production required to sustain global fisheries, Nature, 374, 255–257, 1995.
Pisano, A., Fanelli, C., Buongiorno Nardelli, B., Tronconi, C., Cesarini, C., and La Padula, F.: EU Copernicus Marine Service Product User Manual for Mediterranean Sea High Resolution and Ultra High Resolution Sea Surface Temperature Analysis, SST_MED_SST_L4_NRT_OBSERVATIONS_010_004, Issue 3.0, Mercator Ocean International, https://catalogue.marine.copernicus.eu/documents/PUM/CMEMS-SST-PUM-010-004-006-012-013.pdf, (last access: 14 April 2023), 2022a.
Pisano, A., Fanelli, C., Buongiorno Nardelli, B., Tronconi, C., La Padula, F., and Cesarini, C.: EU Copernicus Marine Service Quality Information Document for Mediterranean Sea High Resolution and Ultra High Resolution Sea Surface Temperature Analysis, SST_MED_SST_L4_NRT_OBSERVATIONS_010_004, Issue 3.0, Mercator Ocean International, https://catalogue.marine.copernicus.eu/documents/QUID/CMEMS-SST-QUID-010-004-006-012-013.pdf, (last access: 14 April 2023), 2022b.
Pouliquen, S., Carval, T., Petit de la Villéon, L., Tarot, S., and In Situ TAC partners: EU Copernicus Marine Service Product User Manual for the Mediterranean Sea- In-Situ Near Real Time Observations, INSITU_MED_PHYBGCWAV_DISCRETE_MYNRT_013_035, Issue 1.14, Mercator Ocean International, https://catalogue.marine.copernicus.eu/documents/PUM/CMEMS-INS-PUM-013-030-036.pdf (last access: 14 April 2023), 2022.
Pujol, M.-I.: EU Copernicus Marine Service Product User Manual for the European Seas Along Track L 3 Sea Level Anomalies Nrt Tailored For Data Assimilation, SEALEVEL_EUR_PHY_L3_NRT_OBSERVATIONS_008_059, Issue 7.0, Mercator Ocean International, https://catalogue.marine.copernicus.eu/documents/PUM/CMEMS-SL-PUM-008-032-068.pdf (last access: 14 April 2023), 2022.
Pujol, M.-I., Taburet, G., and SL-TAC Team: EU Copernicus Marine Service Quality Information Document for the European Seas Along Track L 3 Sea Level Anomalies Nrt Tailored For Data Assimilation, SEALEVEL_EUR_PHY_L3_NRT_OBSERVATIONS_008_059, Issue 8.2, Mercator Ocean International, https://catalogue.marine.copernicus.eu/documents/QUID/CMEMS-SL-QUID-008-032-068.pdf (last access: 14 April 2023), 2023.
Rey, V., Dufresne, C., Fuda, J.-L., Mallarino, D., Missamou, T., Paugam, C., Rougier, G., and Taupier-Letage, I.: On the use of long-term observation of water level and temperature along the shore for a better understanding of the dynamics: example of Toulon area, France, Ocean Dynam., 70, 913–933, 2020.
Romero, R. and Emanuel, K.: Medicane risk in a changing climate, J. Geophys. Res.-Atmos., 118, 5992–6001, 2013.
Rossi, V., Feng, M., Pattiaratchi, C., Roughan, M., and Waite, A. M.: On the factors influencing the development of sporadic upwelling in the Leeuwin Current system, J. Geophys. Res.-Oceans, 118, 3608–3621, 2013.
Salusti, E.: Satellite images of upwellings and cold filament dynamics as transient effects of violent air-sea interactions downstream from the island of Sardinia (western Mediterranean Sea), J. Geophys. Res.-Oceans, 103, 3013–3031, 1998.
Sarhan, T., García-Lafuente, J., Vargas, M., Vargas, J. M., and Plaza, F.: Upwelling mechanisms in the northwestern Alboran Sea, J. Marine Syst., 23, 317–331, 2000.
Shchepetkin, A. F. and McWilliams, J. C.: The regional oceanic modeling system (ROMS): a split-explicit, free-surface, topography-following-coordinate oceanic model, Ocean Model., 9, 347–404, 2005.
Sotillo, M. G., Mourre, B., Mestres, M., Lorente, P., Aznar, R., García-León, M., Liste, M., Santana, A., Espino, M., and Álvarez, E.: Evaluation of the operational CMEMS and coastal downstream ocean forecasting services during the storm Gloria (January 2020), Frontiers in Marine Science, 8, 644525, https://doi.org/10.3389/fmars.2021.644525, 2021.
Tintoré, J., Vizoso, G., Casas, B., Heslop, E., Pascual, A., Orfila, A., Ruiz, S., Martínez-Ledesma, M., Torner, M., Cusí, S., Diedrich, A., Balaguer, P., Gómez-Pujol, L., Álvarez-Ellacuria, A., Gómara, S., Sebastian, K., Lora, S., Beltrán, J. P., Renault, L., Juzà, M., Álvarez, D., March, D., Garau, B., Castilla, C., Cañellas, T., Roque, D., Lizarán, I., Pitarch, S., Carrasco, M. A., Lana, A., Mason, E., Escudier, R., Conti, D., Sayol, J. M., Barceló, B., Alemany, F., Reglero, P., Massuti, E., Vélez-Belchí, P., Ruiz, J., Oguz, T., Gómez, M., Álvarez, E., Ansorena, L., and Manriquez, M.: SOCIB: the Balearic Islands Observing and Forecasting System responding to science, technology and society needs, Mar. Technol. Soc. J., 47, 17 pp., 2013.
Verbrugge, N., Etienne, H., Corgnati, L., Mantovani, C., Reyes, E., Solabarrieta, L., Rubio, A., Carval, T., Mader, J., and Drouineau, L.: EU Copernicus Marine Service Product User Manual for the Global Ocean- in-situ Near real time observations of ocean currents, INSITU_GLO_PHY_UV_DISCRETE_NRT_013_048, Issue 2.2, Mercator Ocean International, https://catalogue.marine.copernicus.eu/documents/PUM/CMEMS-INS-PUM-013-048.pdf (last access: 14 April 2022), 2022a.
Verbrugge, N., Etienne, H., Corgnati, L., Mantovani, C., Reyes, E., Solabarrieta, L., Rubio, A., Carval, T., Mader, J., and Drouineau, L.: EU Copernicus Marine Service Quality Information Document for the Global Ocean- in-situ Near real time observations of ocean currents, INSITU_GLO_PHY_UV_DISCRETE_NRT_013_048, Issue 2.2, Mercator Ocean International, https://catalogue.marine.copernicus.eu/documents/QUID/CMEMS-INS-QUID-013-048.pdf (last access: 14 April 2023), 2022b.
Volpe, G., Colella, S., Brando, V. E., Forneris, V., La Padula, F., Di Cicco, A., Sammartino, M., Bracaglia, M., Artuso, F., and Santoleri, R.: Mediterranean ocean colour Level 3 operational multi-sensor processing, Ocean Sci., 15, 127–146, https://doi.org/10.5194/os-15-127-2019, 2019.
Wehde, H., von Schuckmann, K., Pouliquen, S., Grouazel, A., Bartolome, T., Tintore, J., De Alfonso Alonso-Munoyerro, M., Carval, T., Racapé, V., and the INSTAC team: EU Copernicus Marine Service Quality Information Document for the Mediterranean Sea- In-Situ Near Real Time Observations, INSITU_MED_PHYBGCWAV_DISCRETE_MYNRT_013_035, Issue 2.2, Mercator Ocean International, https://catalogue.marine.copernicus.eu/documents/QUID/CMEMS-INS-QUID-013-030-036.pdf (last access: 14 April 2023), 2022.
https://www.aemet.es/en/conocermas/borrascas/2021-2022/estudios_e_impactos/blas (last access: 14 April 2023)
https://www.socib.es/?seccion=modellingfacility=forecast (last access: 14 April 2023)
https://www.ecmwf.int (last access: 14 April 2023)