the Creative Commons Attribution 4.0 License.
the Creative Commons Attribution 4.0 License.
 | 30 Sep 2026 | OSR10 | Chapter 2.7
Assessing temporal trends in ocean transparency using GlobColour products from the Copernicus Marine Service and accounting for associated uncertainties
Aurélien Prat

Marine Bretagnon
Philippe Bryère
Quentin Jutard
Antoine Mangin
Ocean transparency refers to the ability of water to transmit light, which directly influences the depth to which sunlight penetrates the water column. This parameter is crucial for marine ecosystems, as it determines the availability of light for photosynthesis, a process vital for phytoplankton, the primary producers of the ocean. Phytoplankton not only form the base of the marine food web but also contribute significantly to biogeochemical cycles, including the carbon cycle. A decline in transparency can limit photosynthesis by reducing the depth of the euphotic zone, potentially disrupting ecosystems and impacting carbon sequestration.
Transparency has traditionally been measured using the Secchi disk, a simple yet effective tool for assessing water clarity. More recently, satellite-derived products have revolutionized the study of transparency, enabling large-scale and long-term observations. But whatever the method employed to measure transparency, robust evaluation of long-term trends depends on properly accounting for the inherent uncertainties of the observations. This issue is especially critical for remote sensing datasets, as the succession of sensors across two decades can introduce biases in long-term trend detection.
In this study, we accounted for observational uncertainties in the products by using a Monte Carlo approach, which incorporates the Seasonal Mann–Kendall test to evaluate trend detection reliability and the Theil–Sen slope estimator to quantify trend magnitude. In parallel, seasonal and inter-annual variability in transparency were also examined in relation to in situ data of water discharge, providing insights of riverine influences on transparency dynamics. Study areas include turbid French estuaries (Gironde and Loire), the semi-sheltered Gulf of Morbihan waters, tropical waters around Mayotte, and the oligotrophic North-East Atlantic, representing a broad range of hydrographic and climatic regimes.
The results reveal pronounced spatial contrasts: strong variability and decreasing transparency linked to high-flow events in the Gironde estuary, weaker but noticeable trends in the Loire estuary, no significant changes observed in the North-East Atlantic, and stable conditions for clear waters off Mayotte. The gulf of Morbihan exhibited strong variability that prevailed any trend detection from the long-term signal. Resolution analyses highlighted the importance of finer-scale products for capturing local estuarine processes, while coarser resolution provided more robust basin-scale patterns. This study confirms the value of satellite-derived transparency indicators and highlights the need to integrate uncertainties, resolution effects and call for synergies with in situ data to improve water quality assessments.
- Article
(3362 KB) - Full-text XML
- BibTeX
- EndNote


Water transparency is a critical indicator of coastal ecosystem health, as it governs light availability for primary productivity and shapes the habitat conditions for a wide range of marine organisms. Transparency is influenced by both natural processes and human-induced pressures, including sediment inputs, nutrient enrichment, and physical disturbances. Monitoring transparency across diverse marine environments is essential for understanding the impacts of environmental change and anthropogenic activity on coastal and oceanic systems.
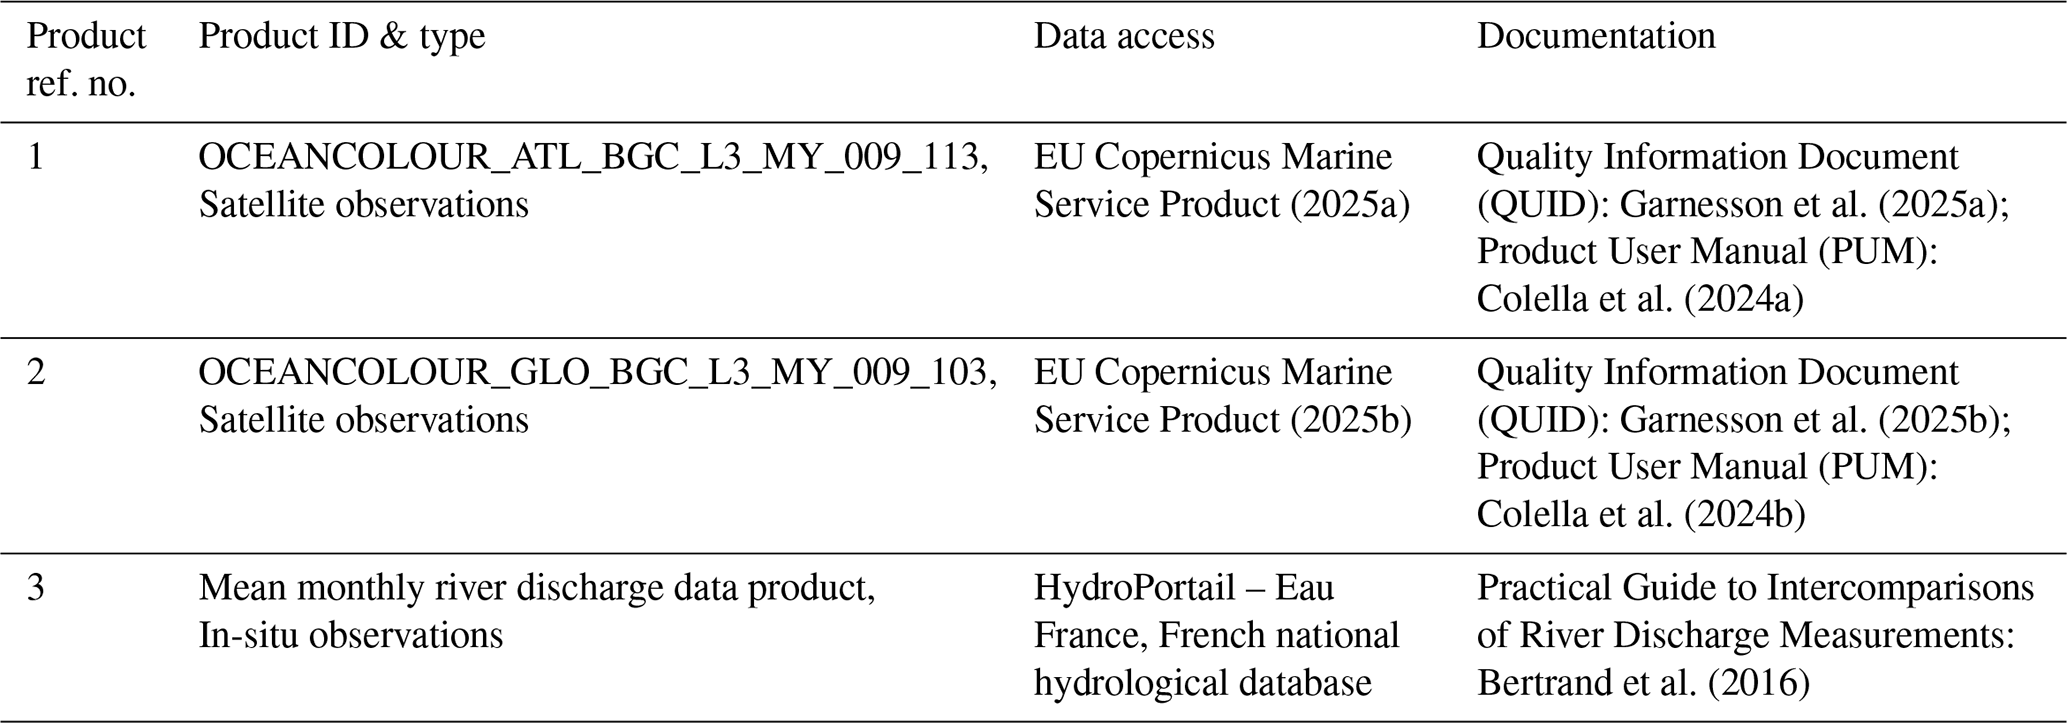
Satellite-derived Secchi depth (ZSD) has been widely used as a proxy for water transparency across a broad range of aquatic environments, including coastal waters (Harvey et al., 2015), estuaries (Son et al., 2025), lakes (Gomes et al., 2020), and the open ocean. Various approaches have been developed to retrieve ZSD from satellite observations. Among them, the method proposed by Morel et al. (2007) provides a theoretical framework that has been implemented in a global product distributed through the Copernicus Marine Service (Garnesson et al., 2025a). This product (product ref. no. 1, Table 1) enables consistent, large-scale, and long-term assessments of water transparency variability.
In this study, we analyse long-term and seasonal variability in ZSD across a set of contrasted marine and coastal environments using satellite-derived estimates from 1998 to 2022. The study sites include the estuary of Gironde and Loire rivers, the Gulf of Morbihan, the coastal waters around Mayotte in the Indian Ocean, and the broader region of the North-East Atlantic basin. These regions span a range of climatic and hydrographic regimes, from turbid estuarine systems subject to strong riverine influence and seasonal variability, to tropical reef ecosystems under increasing anthropogenic pressure, and oligotrophic offshore waters. This spatial diversity allows for a comprehensive evaluation of the natural and anthropogenic drivers of the transparency variability.
While many previous studies have focused on spatial patterns, seasonal variability, or mean temporal changes, the role of observational uncertainty in trend assessment has received comparatively less attention. In most cases, trend significance is inferred primarily from the temporal structure of the time series itself , rather than being explicitly derived from the uncertainties associated with the observations (Franzke, 2012; Hughes and Williams, 2010). As a result, the measurement uncertainty inherent to satellite products is often not propagated into the trend estimation process. We address this limitation by incorporating pixel-level product uncertainty into a Monte-Carlo framework, thereby generating a distribution of possible trend slopes rather than a single deterministic estimate. This approach provides a more robust assessment of trend significance and confidence, especially where signal amplitudes are small relative to observation error or where data density is uneven. In that sense, the proposed framework advances current practice by explicitly distinguishing apparent trends from trends that remain robust after observation uncertainty is taken into account.
The objectives of this study are threefold. First, we investigate seasonal and interannual variability in each study area and explore correlations with environmental drivers such as river discharge, extreme weather events and climatic fluctuations. Second, we assess long-term trends in Secchi depth over the 1998–2022 period, placing particular emphasis on the role of the uncertainty in the trend detection process. Uncertainty from satellite products is explicitly integrated in the trend estimation to improve the robustness of the analysis. Third, we examine how spatial resolution (1 km vs. 4 km) influences the characterisation of these trends and evaluate the implications for monitoring in coastal environments. Together, these analyses aim to enhance our understanding of transparency dynamics in diverse marine settings and contribute to the development of reliable, satellite-based indicators for long-term water quality assessment.
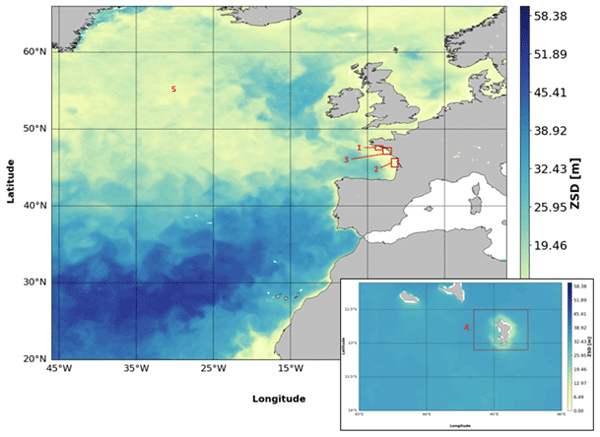
To assess the influence of environmental and anthropogenic drivers on water transparency, five regions were selected to represent a range of contrasting marine environments (Fig. 1). These include: (1) the coastal waters off Morbihan, a semi-sheltered temperate system influenced by moderate urban and agricultural pressures; (2) the Gironde and (3) Loire estuaries, characterized by strong fluvial inputs, seasonal turbidity maxima, and intensive land use in their catchments; (4) Mayotte, a tropical coral reef lagoon system subject to both oceanic conditions and increasing anthropogenic stress; and (5) a broader domain encompassing the North-East Atlantic basin, which enables the analysis of spatial gradients and large-scale trends in transparency from coastal to open-ocean environments.
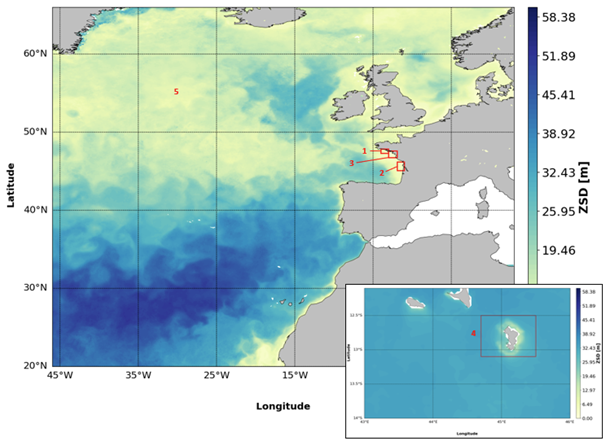
Figure 1Map of Secchi disk depths for July 2020, showing the locations of the selected sites.
Water transparency was analysed using satellite-derived Secchi depth (ZSD) estimates from the Copernicus Marine Service. For the regions of interest (1), (2), (3), and (5), the dataset used was the North Atlantic ocean colour multi-sensor merged product (product ref. no. 1, Table 1), which provides daily composites at 1 km spatial resolution. For Mayotte (4), we used the global ocean colour multi-sensor merged product (product ref. no. 2, Table 1), which directly provides monthly composites at 4 km resolution. In both cases, ZSD estimates were derived using the algorithm of Morel et al. (2007), which links chlorophyll a concentrations to water clarity through bio-optical relationships. A detailed description of the datasets, their processing chain, and associated quality assessment is available in the corresponding Copernicus Marine Service Quality Information Documents (QUID) (Garnesson et al., 2025a). Note that the studied regions exhibit relatively low CDOM absorption (mean aCDOM<0.3 m−1), suggesting a limited influence of coloured dissolved organic matter on the optical properties. In this context, the assumptions underlying the Morel-based algorithm are likely to be reasonably satisfied. In addition to the satellite datasets, mean monthly river discharge data products (product ref. no. 3, Table 1) were obtained from the SANDRE Hydrologic Service through the Eau France HydroPortail, in order to evaluate the potential influence of freshwater inputs on transparency.
Prior to analysis, the daily satellite products were aggregated into monthly composites, using the arithmetic mean for both the ZSD values and the associated uncertainties. This choice reflects a conservative worst-case assumption of correlated uncertainties across daily observations, which we adopted because the true covariance structure is unknown and cannot be estimated robustly from the available information. Monthly products were preferred as they reduce short-term noise, mitigate data gaps from cloud cover, and enhance the robustness of long-term trend detection by averaging out high-frequency variability and emphasizing persistent signals. For the Atlantic study sites, monthly means were computed based only on pixels with at least 30 % revisit coverage over the entire time series, ensuring sufficient temporal consistency. This threshold reflects a compromise between temporal data availability and spatial representativeness and avoid trends driven by sparse observations. Comparisons with unfiltered datasets (not shown) suggest that the main conclusions are robust to this choice.
To assess trends in ocean transparency while accounting for observational uncertainty, a Monte Carlo framework was implemented, combined with the Seasonal Mann–Kendall (SMK) test (Hirsch et al., 1982) and Theil–Sen's slope estimator (Hipel and McLeod, 1994). The Theil–Sen estimator was chosen for its robustness to outliers and its non-parametric nature, as it does not rely on distributional assumptions, unlike ordinary least squares regression. This property is particularly suitable for environmental time series, which often include extreme values. Although that estimator can be sensitive to missing data, this limitation is not relevant here due to the completeness of the monthly time series.
The uncertainty metric used in this study corresponds to the per-pixel relative uncertainty provided in the Copernicus products. These uncertainties are derived from comparisons with in situ reference measurements and from the multi-sensor merging approach, as described in the Copernicus Quality Information Document (QUID) (Garnesson et al., 2025a). Consequently, they are intrinsically linked to the magnitude of the ZSD variable and may exhibit moderate seasonal and spatial variability. However, this variability is not expected to bias the results, as uncertainty is explicitly incorporated into the trend detection framework. Specifically, the Monte Carlo approach propagates the reported uncertainties into ensembles of synthetic time series, enabling the assessment of trend significance under realistic, observation-dependent noise conditions. As such, spatial and temporal variations in uncertainty are inherently accounted for in the trend statistics, rather than treated as fixed or external perturbations.
For each time step, normally distributed synthetic values were generated based on the reported relative uncertainties of the ZSD measurements, with a standard deviation derived from the reported relative uncertainty. A Gaussian approximation is justified here because the reported uncertainty reflects the combined effect of multiple independent error sources (e.g., reprojection, multi-sensor merging, temporal averaging), following the central limit theorem. This procedure was repeated 5000 times to produce ensembles of time series that reflect the inherent uncertainty in the observations. The choice of 5000 Monte Carlo realizations was supported by a convergence analysis showing that the estimated trend statistics stabilized beyond this number of iterations. The SMK test was applied to each realization to assess trend significance, while Theil–Sen's slope provided an estimate of the trend magnitude. By aggregating the outputs, we derived robust confidence intervals for the trend slope and calculated the frequency of statistically significant outcomes, thereby quantifying both the strength and reliability of observed trends in transparency. In parallel, the SMK test and Theil–Sen's slope estimator were also applied directly to the original time series at each study site without incorporating uncertainties, in order to provide a baseline reference for comparison with the Monte Carlo-based results.
3.1 Seasonal variability and climatic driver
Time series of Secchi disk depth (ZSD) provide valuable insights into both the seasonal variability of water transparency and its interannual variability across the study regions.
A first-order analysis reveals that among the regions considered (Northeast Atlantic, Gulf of Morbihan, Loire Estuary, Gironde Estuary, and Mayotte), the deepest ZSD values are observed at the Northeast Atlantic site. This high transparency is explained by the predominance of offshore conditions, where sediment inputs and terrigenous influence are minimal, yielding an average ZSD of 26 m. Mayotte ranks second, with an average ZSD of 24 m. This is consistent with its clear, oligotrophic waters, which are not influenced by major river inputs. In contrast, water transparency is lower in coastal sites, with average ZSD values of 7, 5.6, and 7.9 m in the Gironde Estuary, Loire Estuary, and Gulf of Morbihan, respectively.
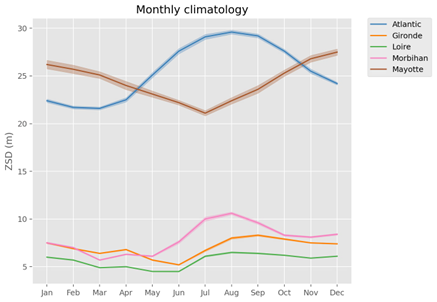
Figure 2Monthly climatology of ZSD over the archive 1998–2022 for the region of interest. The shaded contours correspond to the standard deviation of each month.
Each of the studied regions exhibits its own characteristic seasonal pattern (Fig. 2). To quantify this variability, a climatology of ZSD was constructed for each site (monthly means over the entire archive). The amplitude of the seasonal cycle varies across regions. All regions exhibit low interannual variability. Mayotte shows the highest interannual variability among them and is also associated with the second highest ZSD values. The most pronounced seasonal signal is observed in the Atlantic, where the transparency depth varies by up to 8 m between its maximum in August and minimum in March.
Mayotte exhibits the second strongest seasonal variability, with an amplitude of 6.4 m between the month of maximum ZSD (December) and minimum ZSD (July). The highest ZSD values, indicative of greater water transparency, occur at the onset of the rainy season (November–April), prior to significant water discharge, whereas the lowest transparency is observed during the middle of the dry season (May–October), likely driven by intensified wind conditions.
While both the Atlantic region and the Mayotte site display the largest absolute seasonal variability, the Gulf of Morbihan shows the strongest relative seasonal signal. There, ZSD varies by up to 62 % relative to the annual mean between the most transparent and least transparent months (August and March, respectively). The seasonal cycle of ZSD in the Gulf of Morbihan closely follows that of surface salinity, with maximum transparency coinciding with higher salinity levels. This relationship suggests a strong influence of winter freshwater discharge on water transparency, likely through increased water inflow and wind-driven resuspension of particles.
By contrast, the Loire Estuary exhibits the weakest absolute seasonal variability, with an average difference of only 2 m between seasons (or 35 % relative to the annual mean ZSD). The lowest ZSD values are observed in late spring (May–June), whereas the highest values occur in August. Reduced transparency during late spring likely results from a combination of increased river discharge and phytoplankton bloom. However, due to the inherent correlation between ZSD and chlorophyll retrieval algorithms, this interpretation remains uncertain. The peak ZSD observed in August (6.5 m) may reflect nutrient depletion in the surface layer, leading to reduced chlorophyll a concentrations as well as a minimum of river discharge.
A similar seasonal pattern is observed in the Gironde Estuary, where minimum ZSD values (5.2 m) occur in May–June and maximum values (8.3 m) in August–September. This site exhibits intermediate seasonal variability (44 %), higher than that of the broader Atlantic region but lower than that observed in the Gulf of Morbihan.
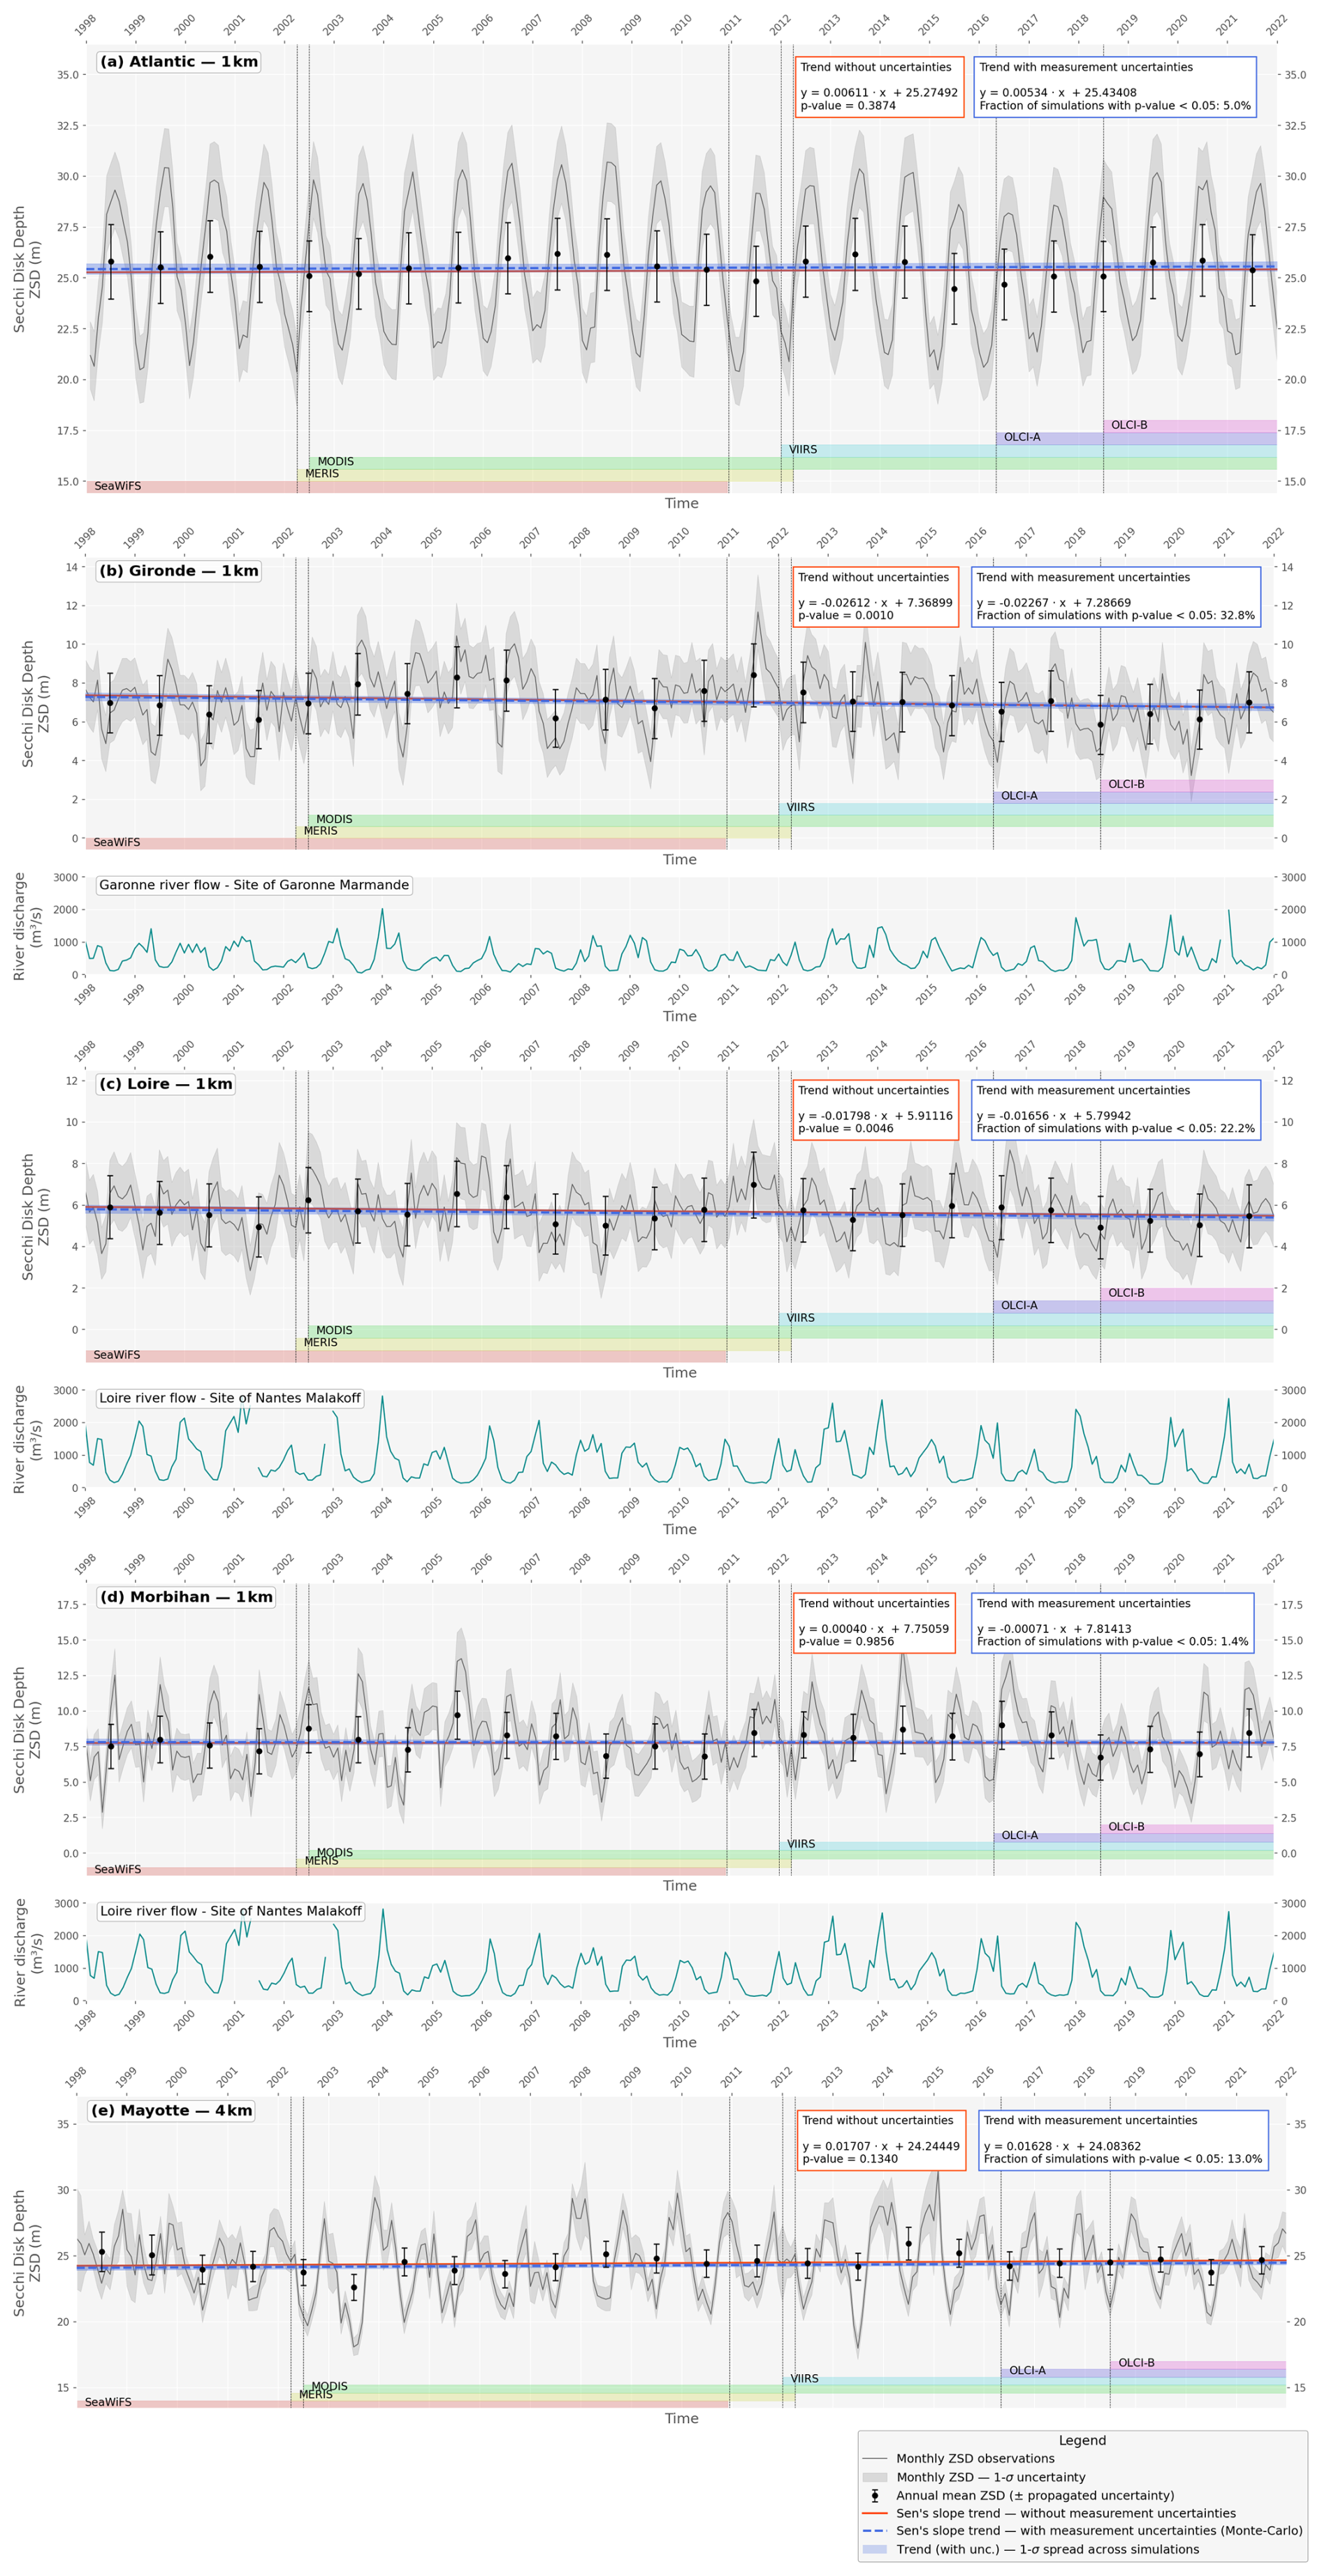
Figure 3Secchi disk depth (ZSD) time series from 1998 to 2022 across all regions of interest (grey), with trend estimates derived with (blue) and without (red) consideration of observational uncertainties.
The correspondence between river discharge and precipitation data may provide valuable insights into interannual variability and the occurrence of significant climatic events. For instance, in the Gironde Estuary (Fig. 3b), a pronounced minimum in water transparency (< 4 m) was recorded in June 2004, following a high discharge of the Garonne River (> 2000 m3 s−1), which transported large amounts of suspended sediments into the coastal zone. A similar situation occurred in May 2020, when sustained high river discharge during the preceding winter also resulted in reduced transparency.
Comparable events are observed in other regions. In the Loire Estuary (Fig. 3c), strong discharges appear to explain the transparency minima (< 4 m) recorded in May 2001. Conversely, river discharge time series can also shed light on periods of unusually high transparency. For example, during spring–summer 2011, the Loire River discharge remained low for several consecutive months, reflecting reduced rainfall. Consequently, particle input to the coastal zone was lower than in other years, leading to increased water transparency (ZSD > 8 m).
However, there are also periods when high river discharge does not coincide with marked minima in transparency. This suggests that, while river flow plays a key role in shaping seasonal variability, its influence on extreme transparency events is less consistent across the studied regions.
3.2 Long-term trend analysis
As detailed in the methods, long-term trends in water transparency were assessed using the Seasonal Mann–Kendall (SMK) test combined with Theil–Sen's slope estimator, applied both directly to the ZSD time series and within a Monte Carlo framework that accounted for observational uncertainties (Fig. 3). This dual approach allowed us to estimate trend magnitudes, test their statistical significance, and evaluate their robustness under uncertainty.
Long-term trend analysis revealed contrasting patterns across the study areas. In the Atlantic zone, no significant trend was detected, regardless of whether uncertainties were considered (p-value = 0.3874, fraction of significant simulations = 5 %) (Fig. 3a). This lack of trend is consistent with the area being dominated by open waters, which are largely unaffected by external natural or anthropogenic inputs.
In both the Gironde and Loire estuaries, decreasing trends in ZSD were identified when observational uncertainties were not considered; however, accounting for uncertainty substantially altered the assessment of their statistical significance. In the Gironde estuary, a decline of 2.6 cm yr−1 was detected using the deterministic approach (p-value = 0.001), whereas incorporating uncertainties yielded a lower proportion of significant simulations (32.8 % of significant simulations) (Fig. 3b). A similar pattern was observed in the Loire estuary, where a decreasing trend was significant only in the absence of uncertainty (p-value = 0.0046), while the Monte Carlo framework reduced the fraction of significant simulations to 22.2 % (Fig. 3c). This discrepancy illustrates how failing to account for uncertainties may lead to overconfident interpretations of trend significance. It also suggests that, although a potential decrease in transparency is plausible, the signal remains close to the detection threshold, and conclusions should therefore be drawn with caution. Despite these differences in statistical robustness, the decreasing trends can be linked to the increasing frequency of flood events observed in the monthly mean discharge of both the Garonne (Gironde estuary) and Loire rivers, which are the main source of sediment inputs in the study areas. Specifically for the Garonne site, five flood-related events with average monthly discharges exceeding 1200 m3 s−1 were recorded between 2010 and 2022, compared to only two such events during the earlier period 1998–2010.
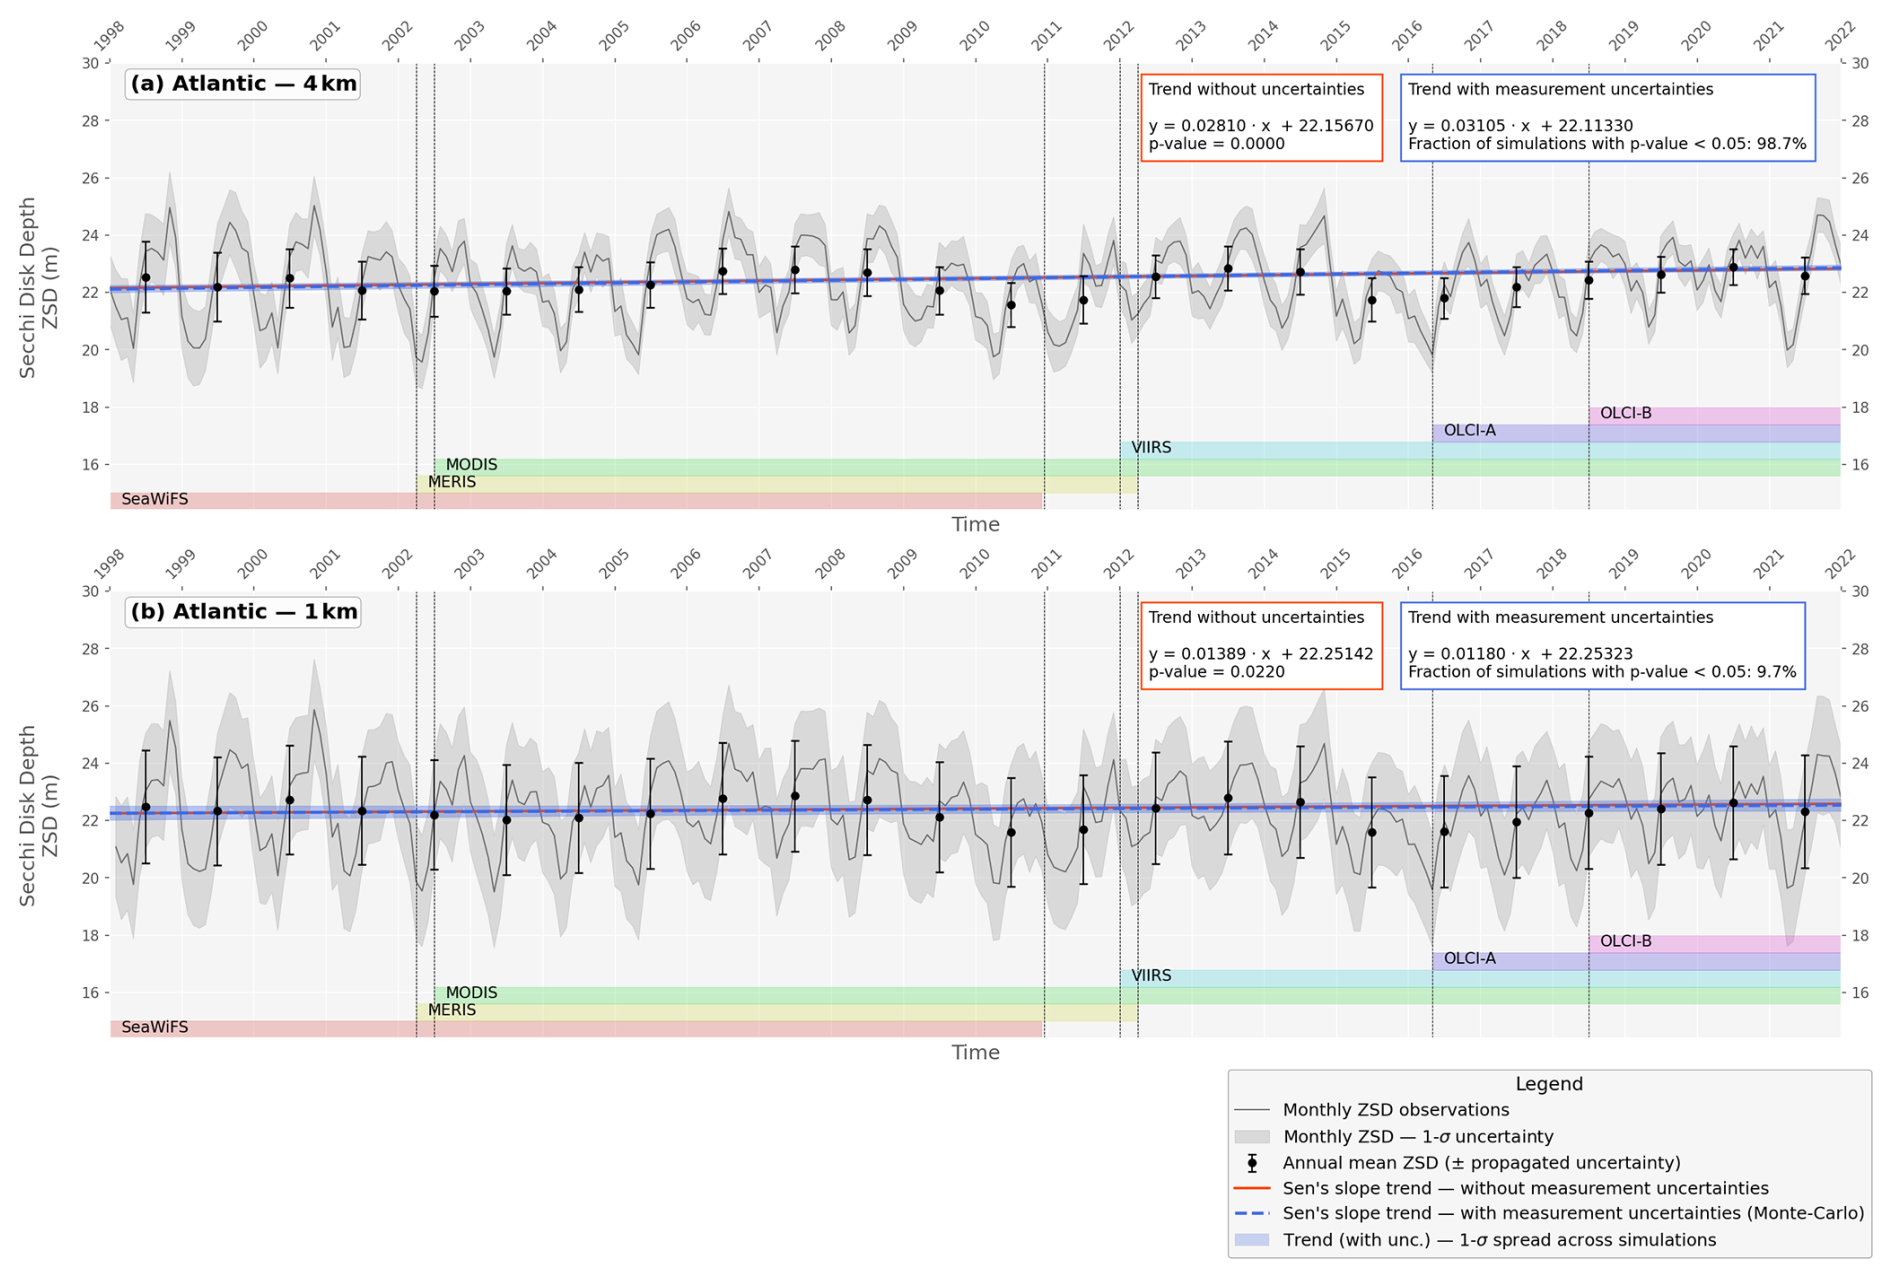
Figure 4Comparison of Secchi disk depth (ZSD) time series for the North-East Atlantic region over the period 1998–2022, derived from satellite products at 1 and 4 km spatial resolutions. No pixel revisit mask applied.
In the Morbihan Gulf, no long-term trend in ZSD was identified (Fig. 3d). As outlined above, the strong interannual variability of the signal complicates the detection of persistent changes and may obscure subtle long-term tendencies. Around Mayotte, no significant trend was detected either (Fig. 3e). This result is consistent with the relatively stable environmental conditions in this region reducing the likelihood of detecting significant long-term variations.
3.3 Spatial comparison and regional implications
A comparative analysis of the Atlantic 1 and 4 km products was conducted to evaluate potential differences in ZSD time series and associated trends. For both products, the study area was restricted to the Northeast Atlantic, excluding the Mediterranean Sea, and no pixel revisit mask was applied to ensure consistency.
The seasonal ZSD signal exhibits a broadly similar pattern at both resolutions, though the 1 km product shows stronger interannual variability, likely reflecting its higher sensitivity to sub-mesoscale heterogeneity and localized dynamics. No systematic offset was observed between the two datasets, as both yield an identical mean ZSD value of 22.4 m. Minor differences in variability may nonetheless be partly related to the finer spatial resolution of the 1 km dataset, which is more sensitive to turbid coastal conditions, whereas the 4 km product tends to smooth these signals.
Trend analyses reveal a consistent long-term increase in transparency across the North-East Atlantic basin. For the 1 km product, the Theil–Sen's slope indicates an average increase of 1.4 cm yr−1, with the SMK test yielding a statistically significant result (p = 0.022). In comparison, the 4 km product suggests a stronger increase of 2.8 cm yr−1, with the trend highly significant (p < 0.0001). This difference in trend detection is also observed the same way across all other study areas. While the coarser product appears to provide a more statistically robust detection, this does not necessarily imply a more reliable representation of the underlying physical reality. The 1 km dataset, despite its higher sensitivity to small-scale variability and noise, better integrates fine-scale coastal and localized processes that are critical for accurately characterizing the actual evolution of water transparency in these areas. Consequently, both resolutions provide complementary insights: the 4 km product emphasizes the large-scale, smoothed signal, while the 1 km product captures localized dynamics that may ultimately drive the long-term trajectory of transparency.
It is worth noting the marked differences between the ZSD signals derived from the 1 km product and those obtained from the 1 km product restricted to pixels revisited at least 30 % of the time (Figs. 4 and 3a, respectively). In the non-masked case, the signal amplitude is lower, and a much higher interannual variability is observed. When all pixels are included, the signal integrates more heterogeneous observations, particularly in coastal areas or near clouds where data are available more sporadically. This tends to smooth the mean values, reducing the amplitude of the detected variations, but introduces greater interannual variability due to differences in pixel coverage and availability from one year to the next.
This study provides a comprehensive assessment of water transparency dynamics across contrasting marine and coastal environments using satellite-derived Secchi depth (ZSD) over the period 1998–2022. By combining multi-decadal time series, robust statistical approaches, and explicit treatment of observational uncertainties, the analysis yields new insights into both the drivers and limitations of satellite-based transparency monitoring.
The results highlight pronounced spatial contrasts in transparency, ranging from highly turbid estuarine systems to oligotrophic tropical and offshore waters. Seasonal variability is strongly site-dependent, with riverine influence and climatic forcing emerging as primary drivers in temperate estuaries of the French metropolitan coast, while tropical systems such as Mayotte show distinct seasonal signatures, likely reflecting the interplay of meteorological and hydrodynamic processes. At interannual scales, extreme river flow events strongly influenced transparency, though their impacts were not uniform across regions.
Long-term trend analysis revealed contrasting outcomes among sites. A robust and significant decrease in transparency was detected in the Gironde estuary, consistent with the rising frequency of high-flow events from the Garonne River. In the Loire estuary, a potential decrease was suggested but its significance weakened when observational uncertainties were considered, underlining the importance of explicitly accounting for product errors. In contrast, no persistent trend was observed in the North-East Atlantic, reflecting the dominance of stable open-ocean waters; in the Gulf of Morbihan, strong interannual variability likely masked any long-term tendencies; and around Mayotte, transparency remained stable due to the relative constancy of its clear, oligotrophic waters.
The comparison of 1 and 4 km products further demonstrated that spatial resolution critically influences both mean transparency values and trend detection. While the coarser dataset yields more stable and statistically robust basin-scale patterns, the finer-resolution product captures essential local variability in estuarine and coastal waters.
Together, these findings confirm the utility of satellite-based indicators for monitoring transparency but also stress the need to integrate uncertainty estimates and resolution effects. Strengthening synergies with in situ observations and biogeochemical models will be essential to improve the reliability of long-term water quality assessments and their application in ecosystem management.
All datasets used and described in this study were obtained from the publicly available Copernicus Marine Service and Eau France HydroPortail platforms (Table 1).
AP, MB, PB, and AM contributed to the conception and design of the study. QJ helped with the provision and pretreatment of data. AP and MB drafted the manuscript. PB and AM provided important advice on the scientific analysis and interpretation of the results.
The contact author has declared that none of the authors has any competing interests.
The Copernicus Marine Service offering is regularly updated to ensure it remains at the forefront of user requirements. In this process, some products may undergo replacement or renaming, leading to the removal of certain product IDs from the catalogue. If readers have any questions or require assistance regarding these modifications, please feel free to reach out to the Copernicus Marine Service user support team for further guidance. They will be able to provide the necessary information to address concerns and find suitable alternatives.
Publisher's note: Copernicus Publications remains neutral with regard to jurisdictional claims made in the text, published maps, institutional affiliations, or any other geographical representation in this paper. The authors bear the ultimate responsibility for providing appropriate place names. Views expressed in the text are those of the authors and do not necessarily reflect the views of the publisher.
We gratefully acknowledge the Copernicus Marine Service for providing free and open access to the ocean colour and environmental data used in this study. We also thank the two anonymous reviewers for their insightful and constructive comments, which significantly improved the quality and clarity of the manuscript.
We would also like to thank Pierre Brasseur, the Editor for his support throughout the publication process. We are also grateful to Karina von Schuckmann and the Copernicus Editorial Team for their valuable guidance and constructive feedback during the initial review phase of the manuscript.
This paper was edited by Pierre Brasseur and reviewed by two anonymous referees.
Bertrand, X., Collobert, M., Besson, D., and Puechberty, R.: Guide pratique Intercomparaisons de mesures de débit en rivière, Eaufrance, https://hydro.eaufrance.fr/documentation/guide-pratique-intercomparaisons-de-mesures-de-debit-en-riviere (last access: 1 September 2025), 2016.
Colella, S., Böhm, E., Cesarini, C., Jutard, Q., and Brando, V. E.: EU Copernicus Marine Service Product User Manual for the North Atlantic Ocean Colour Plankton, Reflectance, Transparency and Optics MY L3 daily observations, OCEANCOLOUR_ATL_BGC_L3_MY_009_113, Issue 5.0, Mercator Ocean International, https://documentation.marine.copernicus.eu/PUM/CMEMS-OC-PUM.pdf (last access: 1 September 2025), 2024a.
Colella, S., Böhm, E., Cesarini, C., Jutard, Q., and Brando, V. E.: EU Copernicus Marine Service Product User Manual for the Global Ocean Colour (Copernicus-GlobColour), Bio-Geo-Chemical, L3 (daily) from Satellite Observations (1997–ongoing), OCEANCOLOUR_GLO_BGC_L3_MY_009_103, Issue 5.0, Mercator Ocean International, https://documentation.marine.copernicus.eu/PUM/CMEMS-OC-PUM.pdf (last access: 1 September 2025), 2024b.
EU Copernicus Marine Service Product: North Atlantic Ocean Colour Plankton, Reflectance, Transparency and Optics MY L3 daily observations, Mercator Ocean International [data set], https://doi.org/10.48670/moi-00286, 2025a.
EU Copernicus Marine Service Product: Global Ocean Colour (Copernicus-GlobColour), Bio-Geo-Chemical, L3 (daily) from Satellite Observations (1997–ongoing), Mercator Ocean International [data set], https://doi.org/10.48670/moi-00280, 2025b.
Franzke, C.: Nonlinear trends, long-range dependence, and climate noise properties of surface temperature, J. Climate, 25, 4172–4183, https://doi.org/10.1175/JCLI-D-11-00293.1, 2012. a
Garnesson, P., Mangin, A., Bretagnon, M., and Jutard, Q.: EU Copernicus Marine Service Quality Information Document for the North Atlantic Ocean Colour Plankton, Reflectance, Transparency and Optics MY L3 daily observations, Tech. Rep. OCEANCOLOUR_ATL_BGC_L3_MY_009_113, Issue 5.1, Mercator Ocean International, https://documentation.marine.copernicus.eu/QUID/CMEMS-OC-QUID-009-101to104-111-113-116-118.pdf (last access: 1 September 2025), 2025a. a, b, c
Garnesson, P., Mangin, A., Bretagnon, M., and Jutard, Q.: EU Copernicus Marine Service Quality Information Document for the Global Ocean Colour (Copernicus-GlobColour), Bio-Geo-Chemical, L3 (daily) from Satellite Observations (1997–ongoing), OCEANCOLOUR_GLO_BGC_L3_MY_009_103, Issue 5.1, Mercator Ocean International, https://documentation.marine.copernicus.eu/QUID/CMEMS-OC-QUID-009-101to104-111-113-116-118.pdf (last access: 1 September 2025), 2025b.
Gomes, A. C., Alcântara, E., Rodrigues, T., and Bernardo, N.: Satellite estimates of euphotic zone and Secchi disk depths in a colored dissolved organic matter-dominated inland water, Ecol. Indic., 110, 105848, https://doi.org/10.1016/j.ecolind.2019.105848, 2020. a
Harvey, E. T., Kratzer, S., and Philipson, P.: Satellite-based water quality monitoring for improved spatial and temporal retrieval of chlorophyll-a in coastal waters, Remote Sens. Environ., 158, 417–430, https://doi.org/10.1016/j.rse.2014.11.017, 2015. a
Hipel, K. W. and McLeod, A. I.: Time series modelling of water resources and environmental systems, vol. 45, Elsevier, https://doi.org/10.1016/s0167-5648%2808%29x7026-1, 1994. a
Hirsch, R. M., Slack, J. R., and Smith, R. A.: Techniques of trend analysis for monthly water quality data, Water Resour. Res., 18, 107–121, https://doi.org/10.1029/WR018i001p00107, 1982. a
Hughes, C. W. and Williams, S. D. P.: The color of sea level: Importance of spatial variations in spectral shape for assessing the significance of trends, J. Geophys. Res.-Oceans, 115, 148–227, https://doi.org/10.1029/2010JC006102, 2010. a
Morel, A., Huot, Y., Gentili, B., Werdell, P. J., Hooker, S. B., and Franz, B. A.: Examining the consistency of products derived from various ocean color sensors in open ocean (Case 1) waters in the perspective of a multi-sensor approach, Remote Sens. Environ., 111, 69–88, https://doi.org/10.1016/j.rse.2007.03.012, 2007. a, b
Son, S., Nezlin, N. P., and Lance, V. P.: Assessing water clarity in the Chesapeake Bay using satellite-derived Secchi disk depth, Int. J. Appl. Earth Obs., 140, 104574, https://doi.org/10.1016/j.jag.2025.104574, 2025. a