the Creative Commons Attribution 4.0 License.
the Creative Commons Attribution 4.0 License.
 | 30 Sep 2025 | OSR9 | Chapter 3.3
Insights into sea surface temperature variability and the impact of long-term warming on marine heatwaves in the Mediterranean Sea
Gerasimos Korres
Sofia Darmaraki
Maria Hatzaki
In the context of a warming Mediterranean Sea, marine heatwaves (MHWs) have progressively intensified, leading to multiple environmental and socioeconomic damage. This study explores the origin of the observed trends in surface MHWs in the basin using sea surface temperature (SST) observations for the period 1982–2023. Results show a basin-wide increase in SST and extreme SST occurrences over the study period, emphasized in the eastern basin. The Adriatic, Aegean, and northern Levantine seas exhibit the highest trends in both SST and extreme SST percentiles, suggesting that these are the most vulnerable areas in the basin in terms of both accumulated warming and extreme SST occurrences. On top of the underlying mean warming, increased variability in SST is observed in parts of the western and central Mediterranean Sea, while decreased variability in SST is found in most of the eastern basin. Results reveal a basin-wide dominance of mean warming versus interannual variability in causing higher maximum MHW intensities, more extreme MHWs, longer heat exposure, and a greater accumulation of heat stress on an annual basis. Interannual variability becomes the dominant driver of the mean MHW intensity trends in most of the basin and particularly in the western and central Mediterranean areas. Mean MHW intensity is also differentiated from the other examined metrics due to the higher sensitivity of our trend attribution results for this metric to different methodological choices for climatological baselines, thus implying a more complex nature of this metric. To advance our understanding of forcing factors behind MHW trends in the Mediterranean Sea, future work should incorporate climate models that can explicitly represent the anthropogenic nature of trends against natural ocean variability.
- Article
(3806 KB) - Full-text XML
- BibTeX
- EndNote


Over the past 4 decades, the Mediterranean Sea has undergone continuous warming of the sea surface temperature (SST) at observed rates ranging from 0.37 to 0.41 °C per decade between 1982–2022 (e.g., Mohamed et al., 2019; Pisano et al., 2020; Pastor et al., 2020; Juza and Tintoré, 2021; E.U. Copernicus Marine Service Information, 2024b; Martínez et al., 2023). Additionally, extreme warm events, named marine heatwaves (MHWs), have garnered significant attention due to their severe environmental and socioeconomic impacts and their notable intensification over recent decades (Darmaraki et al., 2019; Juza et al., 2022; Dayan et al., 2023; Hamdeno and Alvera-Azcaráte, 2023; Pastor and Khodayar, 2023; Denaxa et al., 2024).
Recent studies have addressed the origin of observed MHW trends in the Mediterranean Sea by assessing the relative contributions of long-term changes in mean SST and changes in SST variability. Simon et al. (2023) investigated the role of the long-term SST warming (mean warming from now on) and interannual variability in SST in altering summer MHW activity. They showed that the mean warming is the main driver of the increase in MHW activity across the basin. They also showed that the SST variability contributes to long-term trends in MHW activity in the western and Adriatic regions, while it acts towards reducing these trends in central and eastern Mediterranean regions. Ciappa (2022) and Martínez et al. (2023) also showed that MHW intensification mainly results from the mean warming in the basin. Moreover, Oliver (2019) used a statistical climate model to simulate trends in surface MHWs originating from mean warming or changes in variance of SST in the global ocean. Their results for the Mediterranean Sea show that trends in the annual number of MHW days and the maximum MHW intensity are mainly driven by the mean warming. The latter has been also suggested as the primary driver behind observed trends in properties of surface MHWs at coastal locations globally by Marin et al. (2021). In particular, they quantified the mean warming contribution versus that of interannual variability using a trend attributional ratio (TAR) based on an ensemble approach. Their results reveal that mean warming is mainly responsible for the observed trends in all examined MHW metrics except for mean MHW intensity, whose trends are largely attributed to internal variability.
As a biodiversity hotspot and one of the most sensitive marine regions to climate change, the Mediterranean Sea necessitates a comprehensive, basin-wide investigation of MHWs, accounting for areas that support key ecological processes susceptible to disruptions by MHWs. For instance, pelagic species may be affected by MHWs, with potential repercussions for the fishery industry. A climate risk assessment by Hidalgo et al. (2022) identifies the southeastern basin as the most impacted for both pelagic and demersal fisheries, highlighting geographic differences in drivers and impacts and recommending regionally tailored adaptation strategies. In addition, MHWs pose significant risks to aquaculture, a rapidly expanding industry in the Mediterranean Sea, by increasing fish mortality and facilitating the proliferation of pathogens and disease outbreaks, which can lead to substantial financial losses (Cascarano et al., 2021; Mengual et al., 2021). A comprehensive understanding of MHWs across the basin can further inform conservation measures in Marine Protected Areas (MPAs), which host vulnerable species, such as marine mammals and turtles (Chatzimentor et al., 2023). In fact, a regional-scale approach can provide critical insights for identifying spatial refugia and establishing new MPAs, strengthening the resilience of Mediterranean marine ecosystems to climate change (e.g., Zentner et al., 2023; Bates et al., 2019).
Given the broad ecological and socioeconomic challenges associated with Mediterranean MHWs, this study investigates extreme warming conditions and the effect of mean SST warming versus that of interannual variability in SST on MHW trends across the basin. We firstly provide insights into changes in the Mediterranean SST over the 42-year period using observational SST data. This part provides essential context on long-term changes in extremes and variability throughout the basin, setting the stage for the subsequent MHW analysis while also highlighting areas where extreme warming is particularly pronounced and might be disproportionately impacted. Then, we quantify the relative contributions of mean SST warming and interannual variability in SST to observed trends in the selected MHW properties, applying the methodological approach proposed by Marin et al. (2021) to the entire Mediterranean basin.
2.1 SST observations
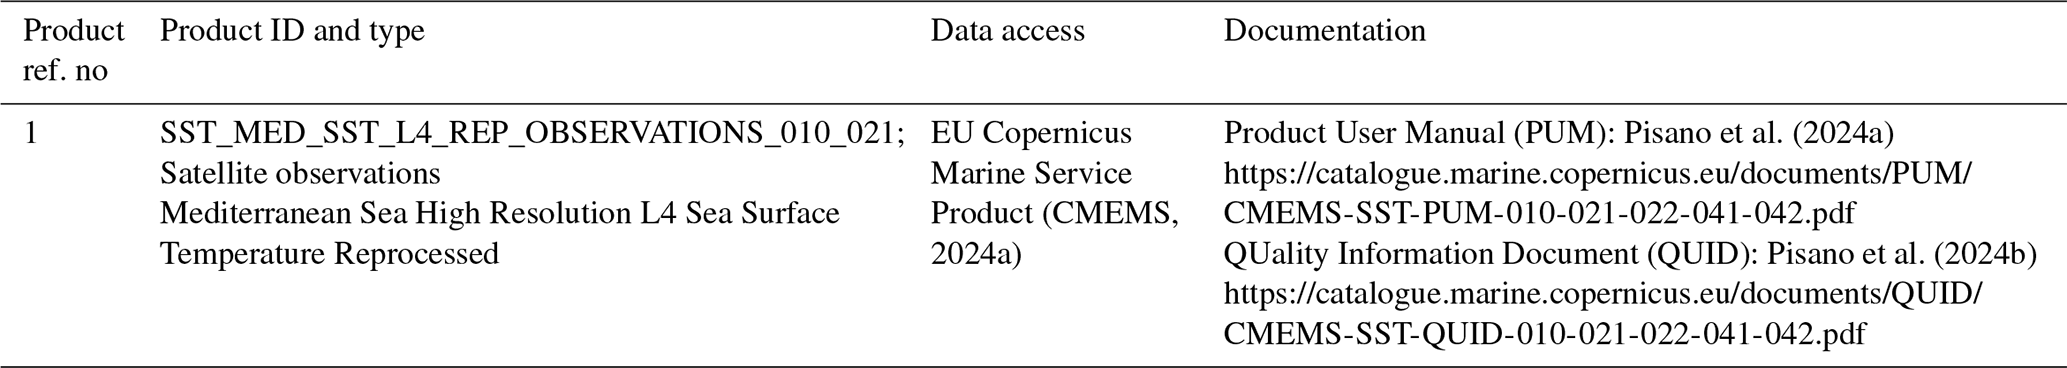
For the SST analysis and detection of MHWs in this study, we use satellite SST observational data in the Mediterranean Sea for the period Jan 1982–Dec 2023. Gridded SST data at daily frequency and 0.05° × 0.05° horizontal resolution are obtained from the Reprocessed satellite SST dataset of the Copernicus Marine catalog for the study period (product ref. no. 01, Table 1). This reprocessed product provides optimally interpolated estimates of the foundation SST based on satellite observations across the Mediterranean Sea and is extensively validated against drifter buoy measurements as outlined in its Quality Information Document (Pisano et al., 2024b), confirming its suitability for MHW studies. For computational reasons, the SST values are re-gridded to a 0.25° × 0.25° spatial grid.
De-seasonalized daily SST anomaly time series are constructed by subtracting the daily climatological SST for the period 1982–2023 at each grid point, thus removing the effect of seasonal fluctuations. To investigate changes in extreme SST occurrences, the 99th percentile (P99) of the daily SST anomalies of each year and the corresponding trend over the study period are also computed. In addition, the standard deviation (SD) of the daily SST anomalies is calculated over each year to obtain an annual measure of SST variability. The linear trend in the annual SD time series is computed to gain insights into changes in SST variability over the study period. Trends are computed using linear regression, and their statistical significance is assessed using the Mann–Kendall test at the 95 % confidence level. Confidence intervals for the trend estimates are calculated based on the standard error of the regression coefficients, using the Student's t distribution (α=0.05).
To exclude long-term variations, we subsequently remove the linear trend over the 42-year study period from the SST anomaly time series, creating a detrended daily SST dataset. This additional dataset is used to investigate MHWs independently of the long-term warming in the basin. Notably, we assume that the variability in SST in the detrended dataset may arise from internal ocean variability and from potential indirect effects of the climate change signal, given the ocean inertia and the complex ocean dynamics at multiple temporal and spatial scales. On these grounds, we use the term interannual (rather than internal) variability to address the remaining temperature variations after removing the long-term trend component.
2.2 MHW analysis: detection and origin of trends
MHWs are defined upon the exceedance of a locally determined climatological threshold (90th percentile) of SST for a 5 d period at each grid point, following Hobday et al. (2016), and are identified using the MATLAB toolbox by Zhao and Marin (2019).
To investigate the effect of mean warming and interannual variability on MHW trends, we follow Marin et al. (2021), where the origins of observed trends in MHW metrics are assessed using a trend attributional ratio (TAR). We firstly identify MHWs in the daily SST anomaly time series between 1982–2023, where long-term SST trends are included (named the non-detrended dataset from now on). Subsequently, we detect MHWs that emerge solely due to interannual variability within the study period, by applying the MHW detection algorithm on the detrended dataset. We then use the two MHW detection outputs to compute selected metrics, listed in Sect. 2.3. To isolate the effect of the mean SST warming on a particular MHW metric, we remove the interannual variability (iv) component from the observed (obs) value of that metric as follows:
where Mobs and Miv are the annual values of the metric obtained from the non-detrended dataset and the detrended dataset, respectively. Linear trends in M and Miv are then computed for the entire Mediterranean Sea and for the western, central, and eastern sub-basins, which are separated by the Strait of Sicily and a fixed-longitude boundary at 22° E (Fig. 1a). Following Marin et al. (2021), the TAR is obtained at each grid point by computing the linear trend in the M and Miv component for each MHW metric according to the following equation:
where TrendM and Trend are the trends in the M and Miv components representing MHW properties due to long-term SST changes and interannual variability, respectively. Scaling this difference with the maximum absolute value of the aforementioned trends forces TAR to range from −1 to 1. Positive (negative) TAR values indicate a stronger role of the mean warming (interannual variability) in forming the observed trends in a given MHW property.
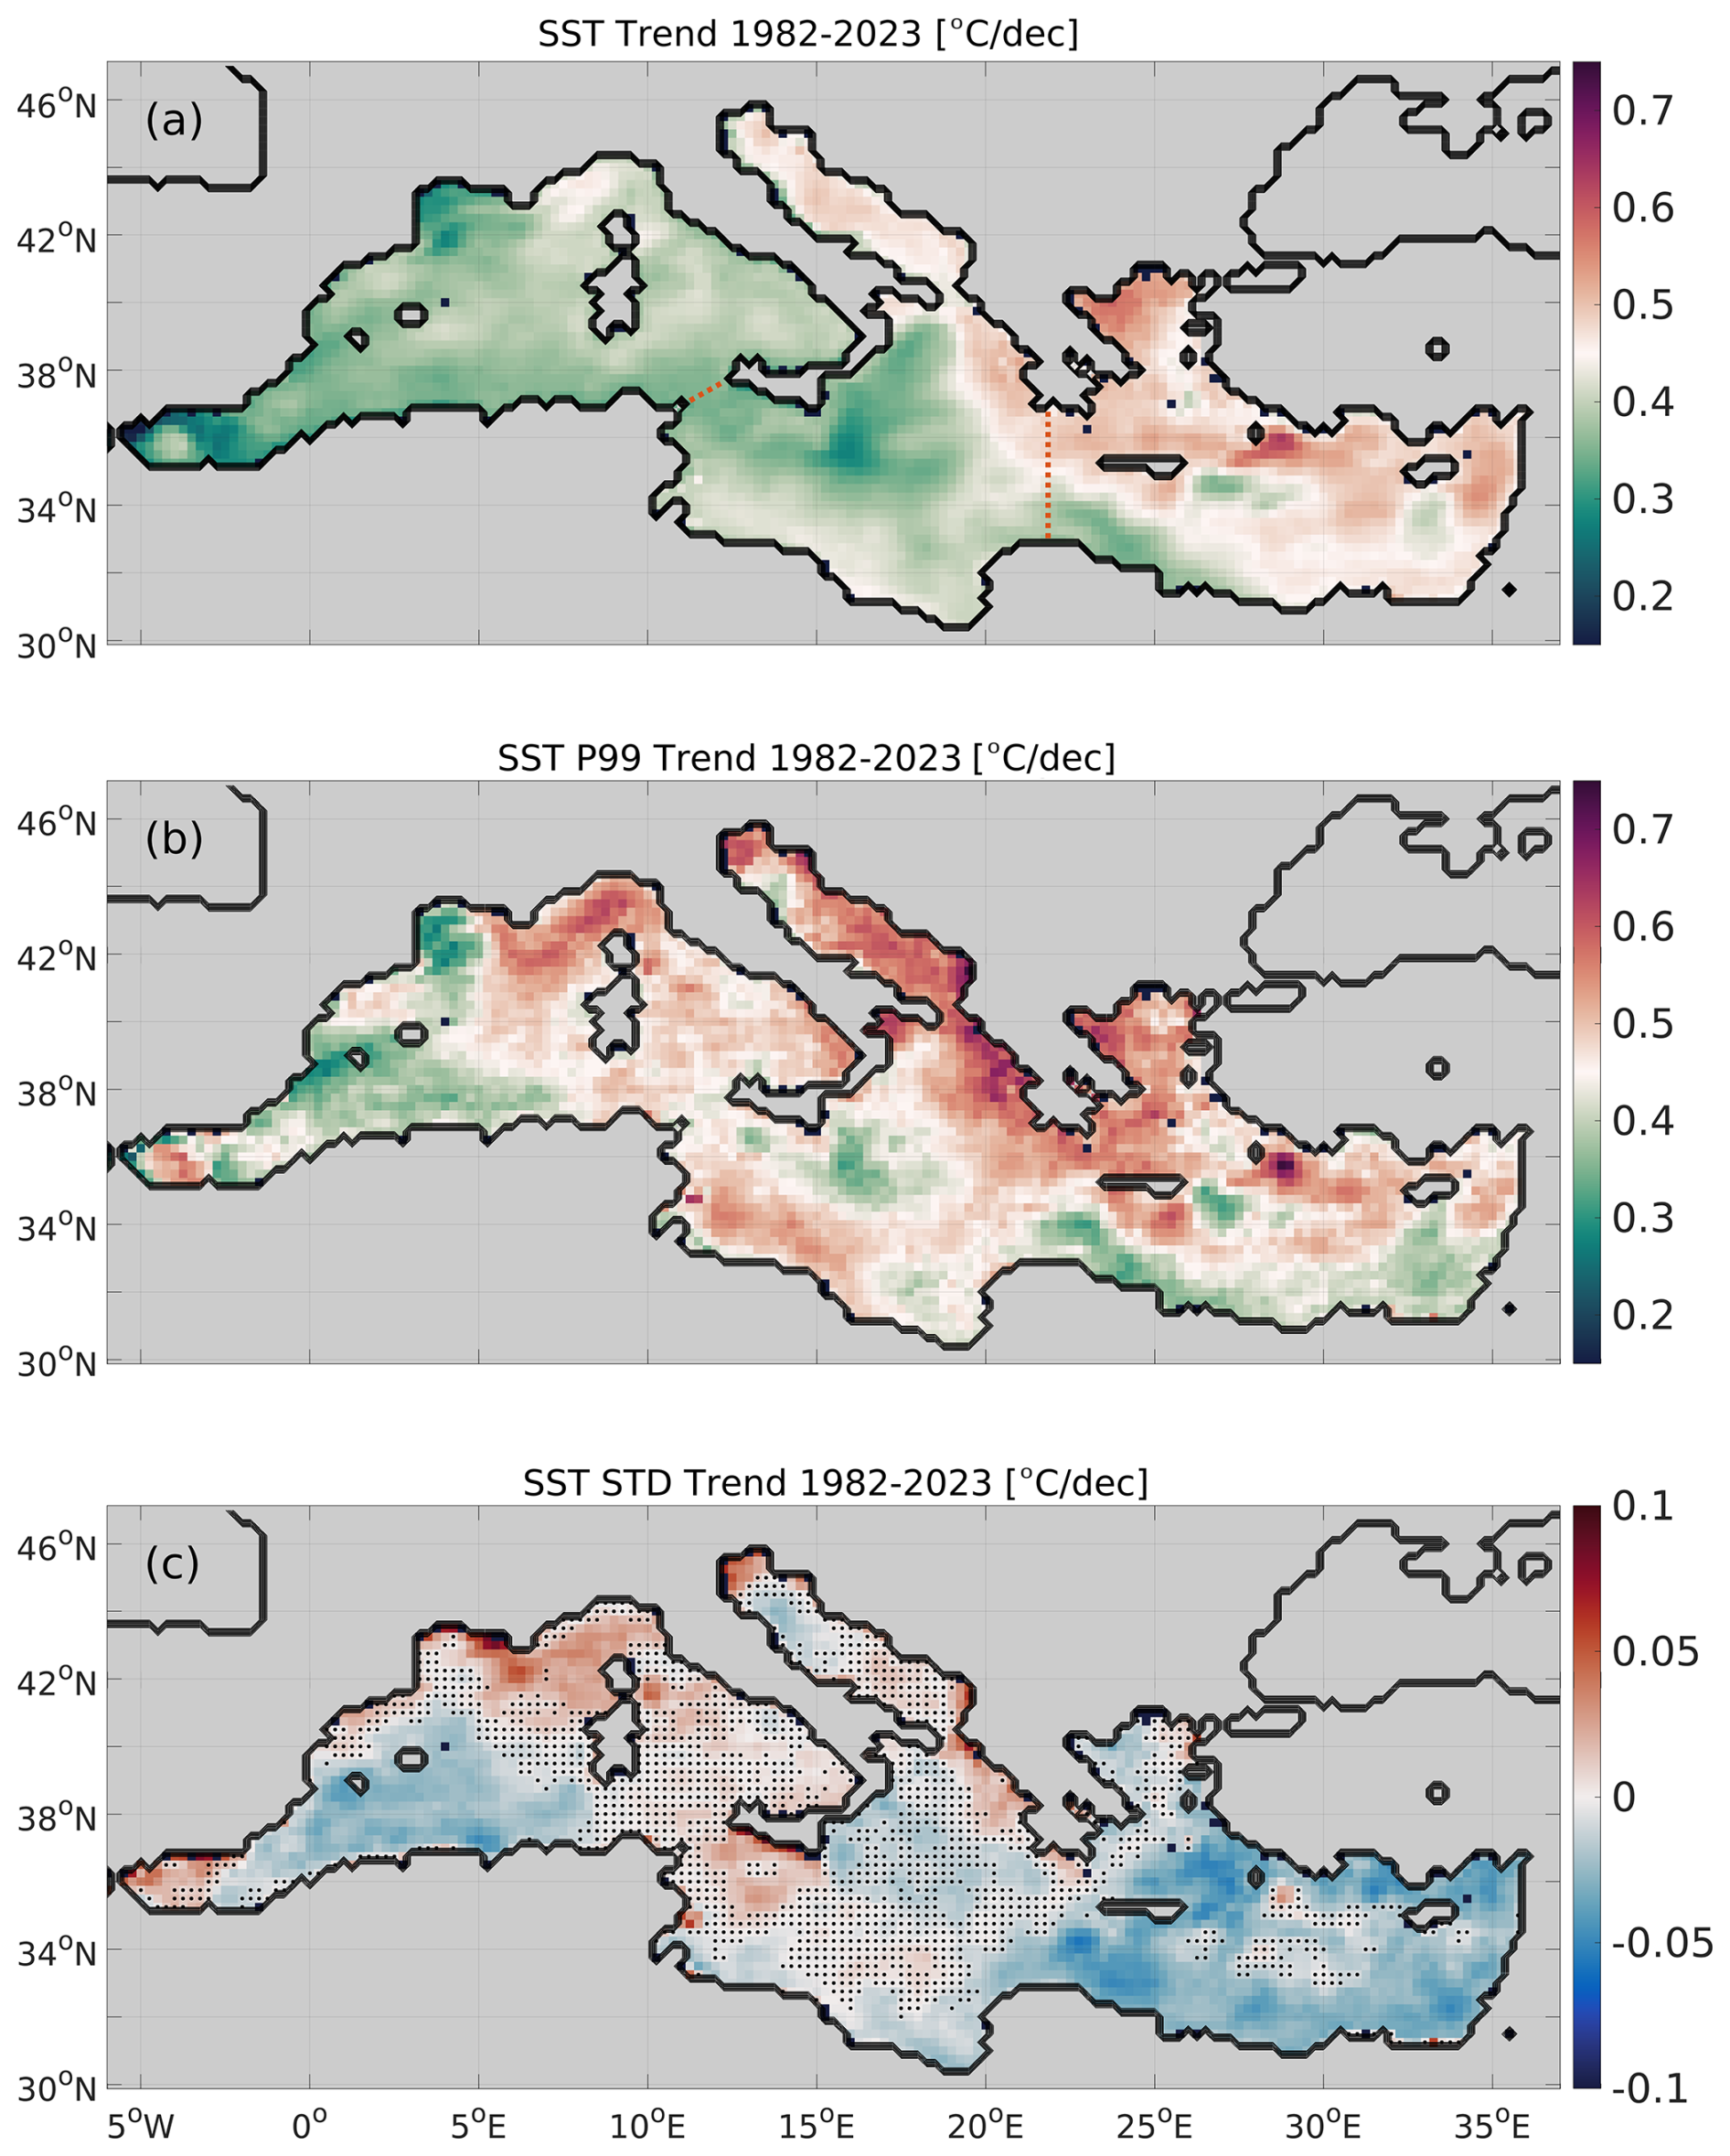
Figure 1Linear trend in (a) SST, (b) the 99th percentile (P99) of SST, and (c) the standard deviation (SD) of SST, for the period 1982–2023, using de-seasonalized SST anomalies. Black dots superimposed on trend fields denote the locations with statistically insignificant trends (Mann–Kendall test, 95 % confidence level). The western, central, and eastern sub-basins are separated by the Strait of Sicily and a fixed-longitude boundary at 22° E (dashed red lines in panel (a)). Product used: Mediterranean Sea High Resolution L4 Sea Surface Temperature Reprocessed (Table 1, product ref. no. 1).
A daily SST climatology of the detrended SST dataset is constructed following Hobday et al. (2016) based on the entire period (1982–2023). Similarly to Marin et al. (2021), this climatology is used for the detection of MHWs in both the non-detrended and detrended datasets. MHWs derived from both datasets are therefore relative to the initial state of the study period (1982), offering insights into what would have occurred without the mean warming effect. This approach for the climatological baseline aims to better represent the impact of long-term changes in MHW metrics and facilitates a direct inter-comparison with the findings of Marin et al. (2021) for Mediterranean coastal locations. Nonetheless, to examine the sensitivity of TAR values of the examined metrics to the approach followed for the climatological baseline, two extra experiments are carried out (EXP2 and EXP3) in addition to the initial approach (EXP1). In EXP2, the aforementioned methodology for computing TAR is repeated after detecting MHWs in the non-detrended dataset based on its own climatology (1982–2023), instead of using the climatology obtained from the detrended dataset as in EXP1. EXP3 follows the climatology computation approach of EXP2 but reduces the reference period to its first half (1982–2002) to explore the impact of using a shorter reference period on the attribution of trends.
2.3 Selected MHW metrics
To complement existing knowledge and provide impact-related insights, we examine the yearly cumulative intensity and the normalized maximum event intensity, in addition to the mean MHW intensity (SST anomaly with respect to climatology averaged over the event duration), the maximum MHW intensity (maximum SST anomaly with respect to climatology over the event duration), and the total number of MHW days (total count of days with an MHW activated).
The yearly cumulative intensity (CIyearly) serves as a measure of the long-term thermal stress induced by MHWs, combining the effect of mean intensity (Imean) and duration accumulated on a yearly basis. Considering the total events (N) of the year, it is computed as follows:
The normalized maximum event intensity is indicative of the degree to which SST exceeds the local climatology. It is defined as the peak intensity over the event (i.e., ) divided by the deviation of the detection threshold (SSTP90) from the corresponding daily climatology (SSTclim), as in Sen Gupta et al. (2020):
Values ranging from (1–2], (2–3], and (3–4] and above 4 correspond to moderate, strong, severe, and extreme conditions, respectively (Hobday et al., 2018). Here, we choose to focus on the maximum value of this index (SImax) each year. The SImax represents MHW severity by means of capturing the most extreme temperatures with respect to local SST variability, regardless of the event duration, thus informing on the “local worst” extremely warm instances occurring on a yearly basis.
As different marine organisms exhibit different (i) upper thermal limits, (ii) adaptation capacities to local temperature variations, and (iii) abilities to geographically shift in order to avoid excess heat stress, the usefulness of CIyearly and SImax relies on the context of specific impact assessment studies and application. For instance, the cumulative effect of multiple MHWs (represented by CIyearly) may be relevant for several species, such as gorgonian populations, which have been severely impacted by recurrent events in the basin (Orenes-Salazar et al., 2023), or fish species, such as the gilthead sea bream, whose thermal tolerance can be affected by past exposure to thermal stress (Kır, 2020). Such species may also be vulnerable to extreme temperature peaks (represented by SImax). For example, unlike wild marine species that can often escape unfavorable aquatic conditions, farmed species confined to aquaculture environments are more vulnerable to warm extremes (Beever et al., 2017). Such distinctions in behavioral adaptability are important for selecting appropriate metrics to assess MHW impacts on different marine populations and environments.
3.1 Mean and extreme SST trends
This section examines the trends and spatial distribution of the observed mean (Fig. 1a) and extreme (Fig. 1b) warming of SST in the Mediterranean Sea for the period 1982–2023. Results reveal a continuous surface warming over the past 42 years in terms of both mean annual and extreme warming conditions, in agreement with previous studies (e.g., Pisano et al., 2020; Pastor et al., 2020). In our study, the average warming trend for the basin for the examined period is 0.41 °C per decade. The warming trend is statistically significant across the basin, with higher values observed over the eastern Mediterranean Sea, reaching up to 0.6 °C per decade in the Aegean and northern Levantine seas. The lowest warming trend is observed in the Alboran Sea (0.25 °C per decade), followed by the Gulf of Lions and the southwestern Ionian Sea (0.3 °C per decade) (Fig. 1a).
Long-term changes in extreme SST occurrences are shown through the trend in the 99th percentile of SST anomalies (P99) depicted in Fig. 1b. The P99 shows statistically significant positive trends across the entire basin, suggesting a basin-wide intensification of extremely warm surface conditions (Fig. 1b). The highest trend values of P99 are observed in the Ligurian, Adriatic, northeastern Ionian, and Aegean seas at about 0.6 °C per decade and locally exceeding 0.7 °C per decade (e.g., to the southeast of Rhodes). Weaker warming trends in the P99 are observed in the western basin, the western Ionian, and certain areas in the southern Levantine Sea, with minimum values in the Gulf of Lions (lower than 0.3 °C per decade).
While long-term trends in SST anomalies (Fig. 1a) provide insights into the overall warming of the sea surface, they do not capture how temperatures fluctuate around the observed trend over the study period. In this respect, the linear trend in the SD of the daily SST anomalies informs on changes in their variability (Fig. 1c). Specifically, we observe a statistically significant increase in the SD mainly in areas of the western and central Mediterranean Sea. Maximum SD trend values are observed in the northwestern basin (eastern part of Gulf of Lions, Ligurian Sea) and the northern Adriatic Sea, indicating heightened variability in SST. Conversely, the area south of the Balearic Islands and a great portion of the eastern Mediterranean basin exhibit a statistically significant negative SD trend, indicating a weaker variability in SST towards the most recent years in these areas.
Notably, the SD trend is independent of the mean warming trend and reflects changes in the variability in SST around mean annual values. Our findings therefore indicate that, on top of the underlying mean warming, few distinct areas, primarily in the western basin, experience increased variability, while most of the eastern basin and the region south of the Balearic Islands show reduced variability. These results are in agreement with Martínez et al. (2023), who compared the SD of SST anomalies between the periods 1982–2002 and 2002–2022 for different Mediterranean sub-basins, reporting a decreased variability in the Ionian, Aegean, and Levantine seas and increased variability in the western basin and the Adriatic and Tyrrhenian seas during the most recent period.
3.2 Attribution of trends in MHW metrics
This section studies the relative role of the mean SST warming and the SST interannual variability in MHW trends. The temporal evolution and long-term trends in the selected MHW metrics (Sect. 2.3) derived from the non-detrended and detrended datasets are presented in Fig. 2 for the entire Mediterranean Sea and its sub-basins.
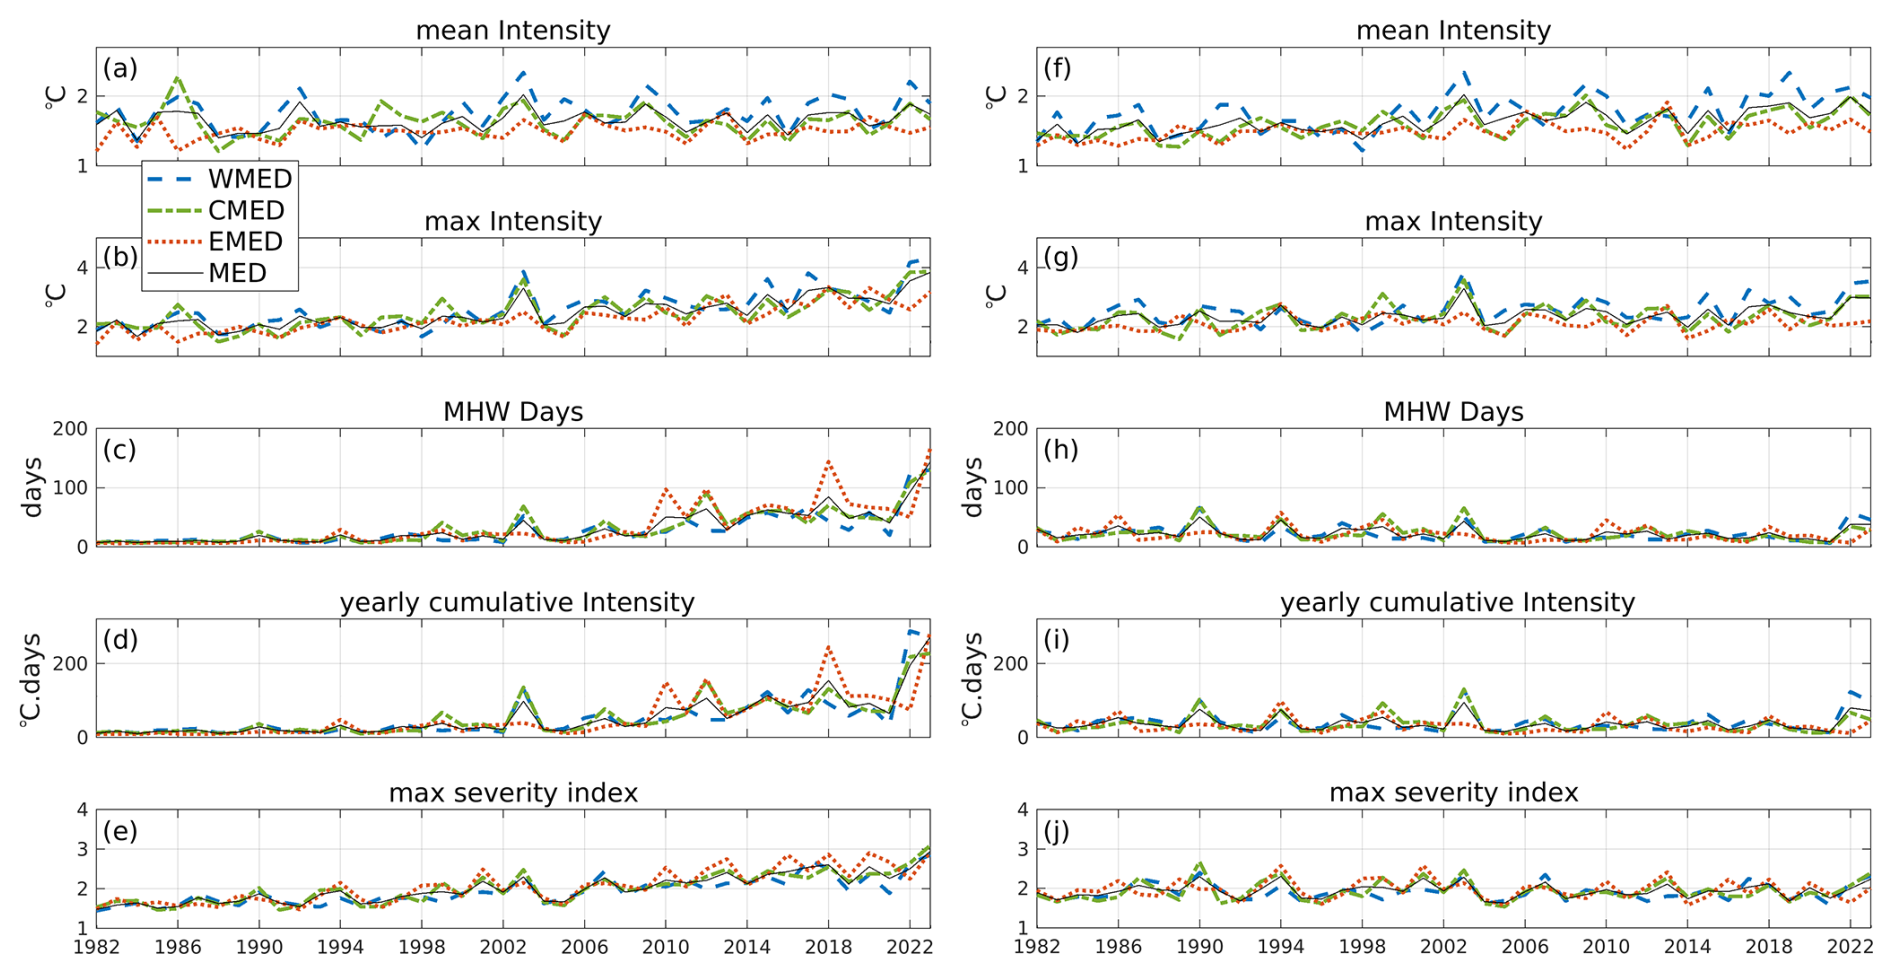
Figure 2Temporal evolution of MHW characteristics over 1982–2023 using the non-detrended (a–e) and the detrended (f–j) SST anomaly time series. From top to bottom: mean intensity (a, f), maximum intensity (g, b), number of MHW days (c, h), yearly cumulative intensity (d, i), and maximum severity index (e, j). Blue, green, and red lines and the dashed black line correspond to spatial averages for the western (WMED), central (CMED), and eastern (EMED) Mediterranean sub-basins and the entire Mediterranean basin (MED), respectively. Product used: Mediterranean Sea High Resolution L4 Sea Surface Temperature Reprocessed (Table 1, product ref. no. 1).
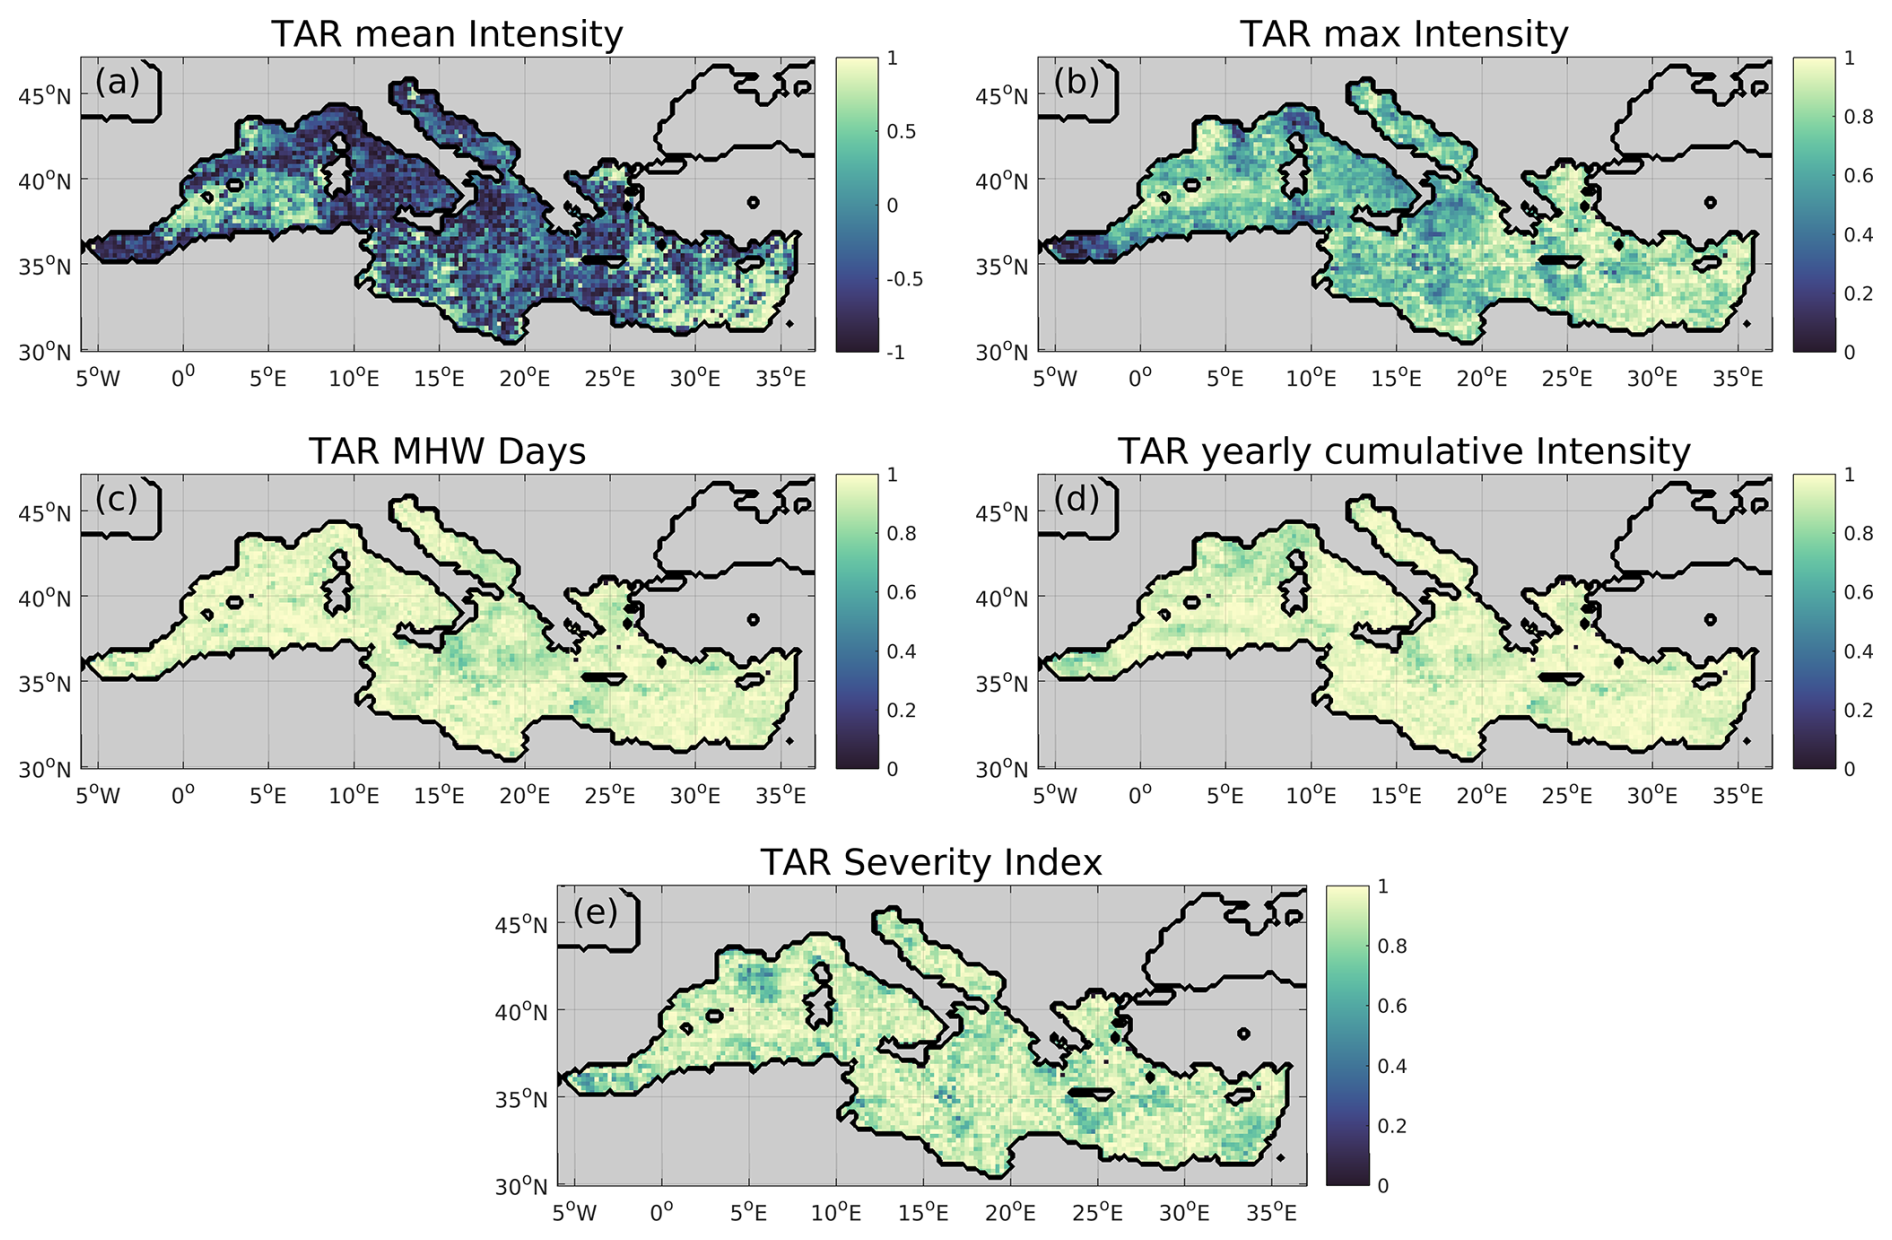
Figure 3Trend attributional ratio (TAR) for MHW characteristics over 1982–2023: (a) mean MHW intensity, (b) maximum MHW intensity, (c) number of MHW days, (d) yearly cumulative MHW intensity, and (e) maximum MHW severity index. Positive (negative) TAR values indicate that mean SST warming (interannual variability) is the dominant driver of the trend in an MHW metric. The range of TAR values in colorbar axes varies for mean intensity and the rest of the variables to allow the visualization of spatial variations. Product used: Mediterranean Sea High Resolution L4 Sea Surface Temperature Reprocessed (Table 1, product ref. no. 1).
Table 2Linear trends and confidence intervals for the spatially averaged MHW metrics of the non-detrended (N-DET) and the detrended (DET) SST datasets over 1982–2023. Metrics used: mean intensity (Imean), maximum intensity (Imax), number of MHW days (MHW days), yearly cumulative intensity (CIyearly), and maximum severity index (SImax). Sub-regions considered: western (WMED), central (CMED), and eastern (EMED) Mediterranean and the entire Mediterranean basin (MED). Values in bold correspond to statistically significant trends (Mann–Kendall test, 95 % confidence level). Product used: Mediterranean Sea High Resolution L4 Sea Surface Temperature Reprocessed (Table 1, product ref. no. 1).
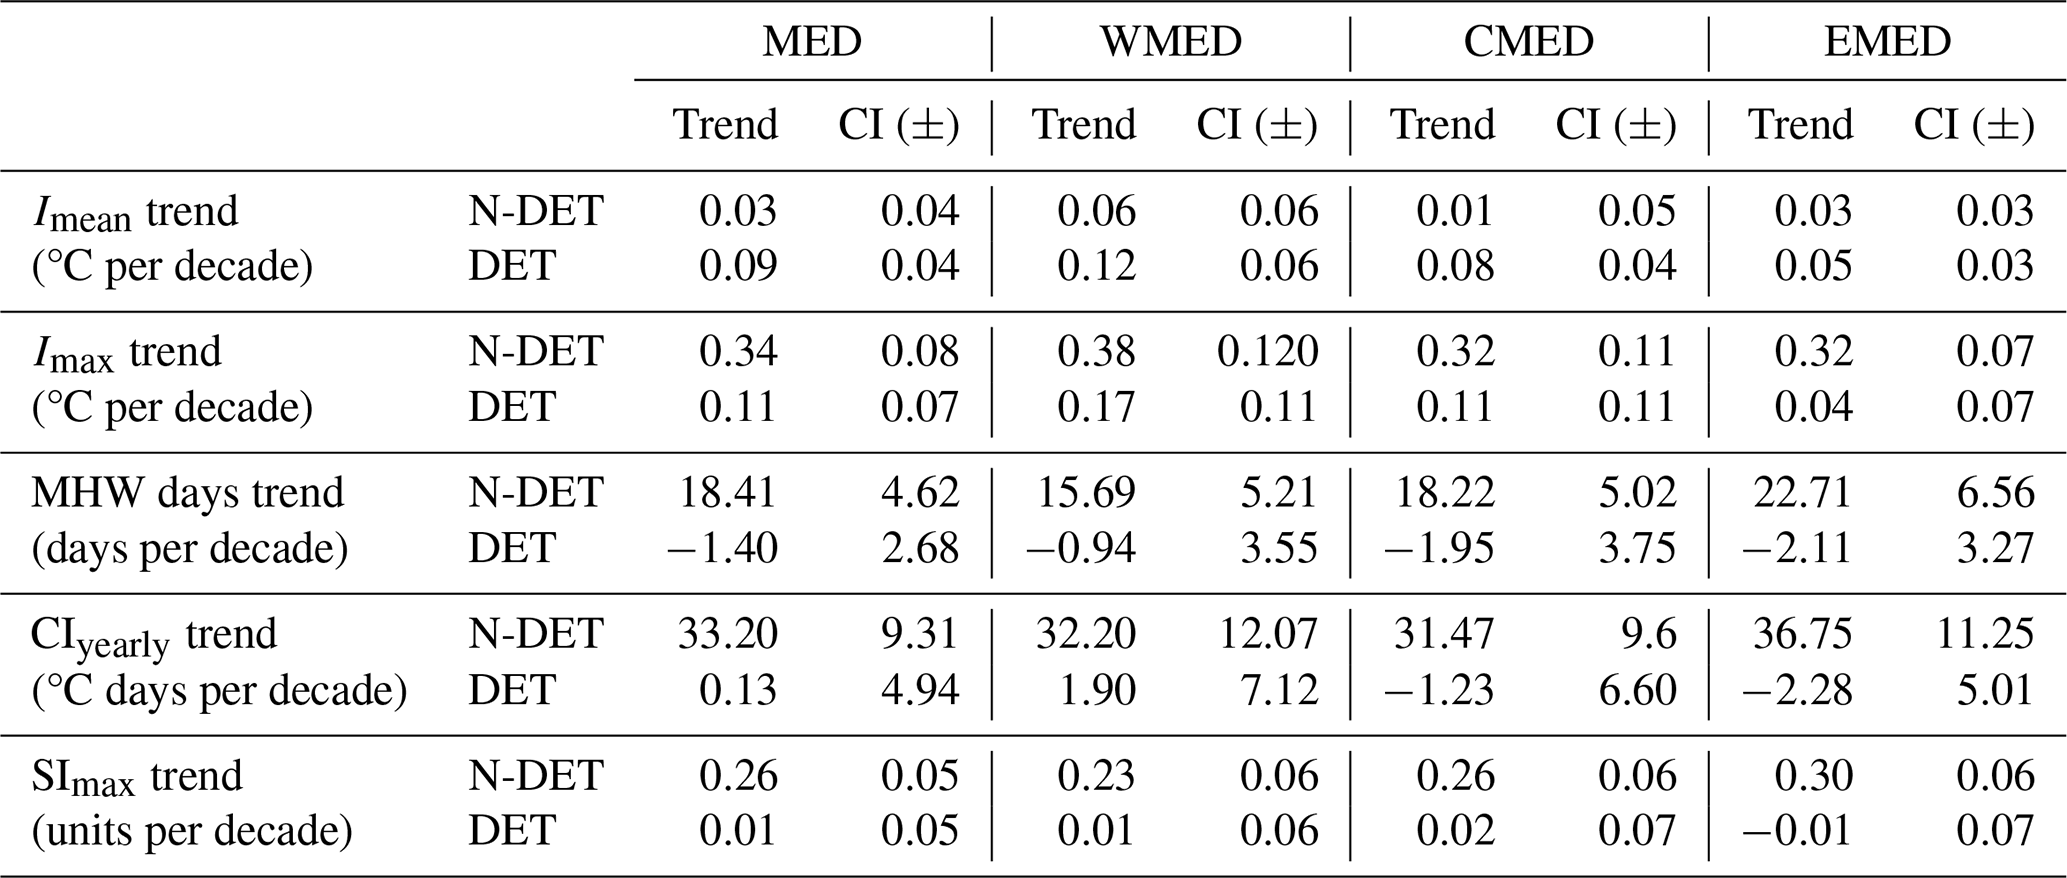
Results show an increase in all MHW metrics derived from the non-detrended SST dataset over the study period (Fig. 3a–e, Table 2). The mean intensity of MHWs increases by 0.03° per decade, with higher values in the western compared to the central and eastern sub-basins (Fig. 2a, Table 2). The total number of MHW days shows significant positive trends, increasing from the western to the eastern basin, with approximately 16, 18, and 23 d per decade for the western, central, and eastern sub-basins, respectively (Fig. 2c). The basin-averaged yearly cumulative intensity increases by ∼ 33 °C d per decade, with its highest values and linear trends seen in the eastern sub-basin (Fig. 2d, Table 2).
The maximum intensity (Imax) shows a higher positive trend in the western (0.38 °C per decade) than in the eastern (0.32 °C per decade) sub-basin (Fig. 2b). In contrast, the maximum severity index (SImax) exhibits a stronger increasing trend in the eastern (0.3 units per decade) than in the western (0.23 units per decade) sub-basin (Table 2). This pattern arises potentially due to SImax quantifying the extremity of MHW intensity relative to a fixed climatological threshold (Eq. 4). Since this threshold remains constant over time, the larger increase in SImax in the eastern sub-basin suggests that maximum intensities in this region are becoming proportionally more extreme compared to historical conditions. The observed differences in trends between Imax and SImax across sub-basins highlight that absolute MHW intensities are increasing more rapidly in the western sub-basin, while their relative extremity compared to the historical baseline is increasing more in the eastern sub-basin.
MHW metrics originating from the detrended dataset represent MHW conditions that would have occurred solely due to interannual variability. Most metrics from this dataset show insignificant trends over the study period, with MHW intensity being a noteworthy exception (Fig. 2f–j, Table 2). In particular, both mean and maximum intensity exhibit higher trends in the western basin, similarly to the non-detrended dataset. The statistically significant basin-wide positive trend in mean intensity ranges from 0.12 to 0.08 and 0.05 °C per decade for the western, central, and eastern sub-basins, (Fig. 2f). Interestingly, these trends are higher than those from the non-detrended dataset, suggesting that interannual variability alone would still result in a statistically significant increase in mean MHW intensity (Fig. 2a, f).
Imax in the detrended dataset also shows positive trends, though they are not significant for the central and eastern sub-basins (Fig. 2g). Despite this, SImax in the detrended dataset shows non-significant trends (Fig. 2j). In conjunction with the positive SImax trends in the non-detrended dataset, this indicates that the observed increase in SImax is primarily driven by the long-term warming trend, particularly in the eastern sub-basin (Table 2).
Moreover, the annual number of MHW days derived from the detrended dataset shows an insignificant trend of −1.4 d per decade for the entire basin, with a larger decrease for the eastern sub-basin (Fig. 2h, Table 2). Similarly. the yearly cumulative intensity derived from the detrended dataset shows non-significant trends (Fig. 2i), with higher (absolute) values again found in the eastern sub-basin (−2.28 °C d per decade). This aligns with the trends in MHW days, which constitute an annual measure of the total duration of MHW conditions and are therefore closely linked to the yearly cumulative intensity. These results potentially suggest that the decreasing duration of MHW conditions in the detrended dataset (Fig. 2h) counterbalance the rising mean intensity (Fig. 2f), leading to a lower accumulation of heat stress as represented by yearly cumulative intensity (see Eq. 3).
Overall, with the exception of MHW intensity, our results suggest that interannual variability mainly tends to dampen the climate-change-driven increase in MHW characteristics in the Mediterranean Sea, particularly in the eastern sub-basin, in agreement with Simon et al. (2023). This observation is in line with results presented in Sect. 3.1 showing an increase (decrease) in SST variability mainly in western (eastern) Mediterranean areas throughout the study period. Nevertheless, further investigations are needed to unravel the cause of the differentiation of MHW intensity compared to other MHW properties.
To attribute MHW trends over the study period to the mean warming or the interannual variability in SST, TAR values are computed for the examined MHW properties (Fig. 3). As explained in Sect. 2.2, positive TAR values correspond to a major role of the mean SST warming, while negative values correspond to a major role of interannual variability in driving MHW trends.
Results reveal a basin-wide dominance of the mean warming in driving the observed trends in all MHW characteristics, except for the mean MHW intensity, which is found to be mainly forced by interannual variability over most of the Mediterranean Sea (Fig. 3a). In particular, a great part of the western basin and most of the central basin reaching up to 26° E exhibit large negative TAR values, often reaching −1, indicating that the mean MHW intensity trend is primarily driven by interannual variability. In contrast, the mean SST warming appears to dominate interannual variability over the eastern Levantine Sea and part of the Aegean Sea, as well as in certain areas in the southwestern basin, as indicated by high positive mean-intensity TAR values in these areas (Fig. 3a). These positive TAR locations largely coincide with the ones showing a decreasing SD of SST anomalies over the study period (Figs. 1c and 3a). The dominance of the mean warming signal in explaining the MHW intensity trends in these areas appears associated with the decreasing trend in the variability in SST in the same areas. We note that the positive mean-intensity TAR values in these areas result from significant positive trends in the mean warming component and insignificant trends in the interannual variability component for this metric (not shown).
For the rest of the examined MHW properties' trends, positive TAR values across the entire basin indicate a dominant role of mean SST warming in driving their increase during 1982–2023 (Fig. 3b–e). We note here that, the greater the value of TAR, the stronger the impact of the mean SST warming. Positive TAR values for the maximum MHW intensity shown in Fig. 3b range from 0 to 1 across the basin, revealing areas with a marginally stronger influence of the mean SST warming signal compared to that of the interannual SST variability (Alboran Sea, followed by the Ligurian Sea). However, there seems to be a clear prevalence of the mean SST warming especially over the eastern basin for this metric (Fig. 3b). Spatial distribution of TAR for the maximum severity index exceeds 0.6 in most of the basin, indicating a basin-wide dependence of this metric on the mean SST warming (Fig. 3e). Furthermore, high positive TAR values are seen for the number of MHW days and the yearly cumulative intensity, exceeding 0.8 throughout the basin (Fig. 3c, d).
Overall, from a basin-wide perspective, our findings suggest a dominant role of the mean SST warming in the development of more severe and prolonged MHW conditions. By contrast, interannual variability becomes the dominant driver of the mean MHW intensity trend in most of the basin, playing an important role, and of the maximum MHW intensity trends in certain Mediterranean areas, though to a notably lesser extent.
To examine the sensitivity of TAR values of the examined metrics to the approach followed for climatological baseline, two additional tests are performed as described in Sect. 2.2. These experiments reveal minimal TAR sensitivity for all metrics except for mean intensity (Fig. 4). The bar graphs of Fig. 4 summarize this finding, showing the number of locations (as a percentage of the total number of Mediterranean grid points) exhibiting a positive TAR sign (i.e., a dominant role of the mean warming in MHW trends). In all experiments, the long-term trends in maximum intensity, yearly cumulative intensity, maximum severity index, and annual number of MHW days are mainly attributed to the mean warming across more than 97 % of the Mediterranean Sea. On the other hand, we observe a differentiated sensitivity of the mean-intensity TAR to the examined approaches for climatology. Based on the initial approach (EXP1), 34 % of the Mediterranean Sea shows mean-warming-driven mean-intensity trends, while, for the second and third approach, this percentage is 46 % (EXP2) and 30 % (EXP3) (Fig. 4). We note that the spatial distribution of mean-intensity TAR values is similar in the three experiments (the same applies for the rest of the metrics), with the easternmost and a part of the southwestern basin showing a dominant role of mean warming (not shown), as shown in Fig. 3a. Notably, mean MHW intensity is the metric found to be largely associated with interannual variability, as opposed to the rest of the examined MHW properties. The higher sensitivity of our results for mean intensity to different methodological choices further suggests a less predictable future behavior for this MHW property.
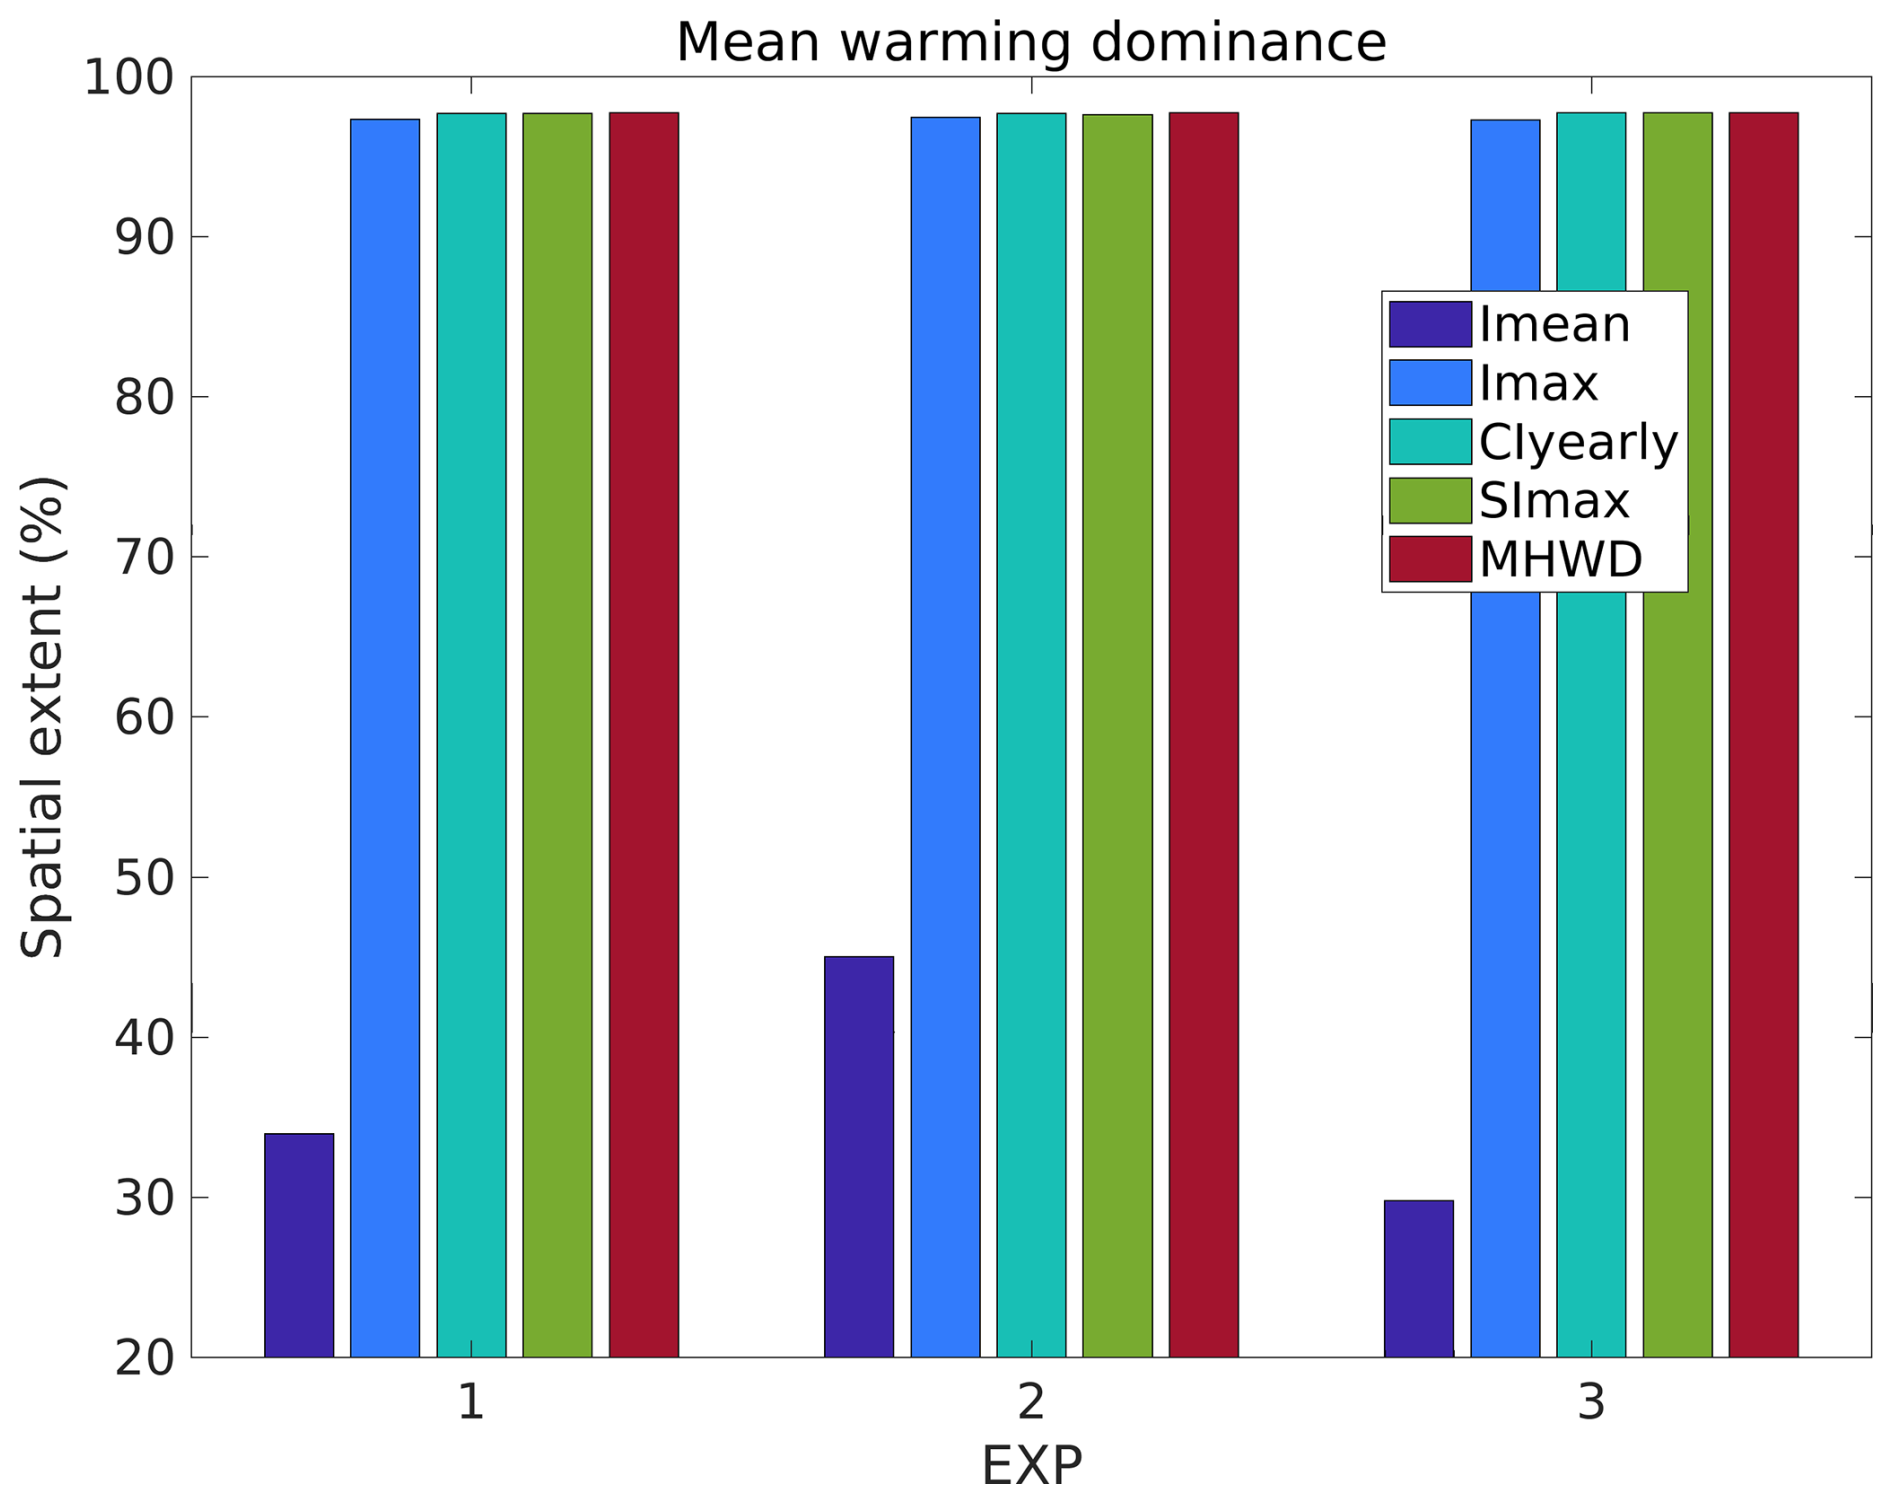
Figure 4Sensitivity of the trend attributional ratio (TAR) to different approaches for base climatology used in MHW detection in the original (non-detrended) dataset. Vertical axis: percentage of Mediterranean locations with positive TAR (i.e., mean warming dominance in trends in MHW metrics). Horizontal axis: EXP1 – climatology computed based on the detrended dataset with reference period 1982–2023; EXP2 – climatology computed based on the non-detrended dataset with reference period 1982–2023; EXP3 – as EXP2 but with reference period 1982–2002. Metrics used: mean intensity (Imean), maximum intensity (Imax), number of MHW days (MHWD), yearly cumulative intensity (CIyearly), and maximum severity index (SImax). Product used: Mediterranean Sea High Resolution L4 Sea Surface Temperature Reprocessed (Table 1, product ref. no. 1).
This study investigates the role of long-term changes in SST in observed trends in MHWs in the Mediterranean Sea, using SST observations for the period 1982–2023. Our results show a basin-wide increase in SST and extreme SST occurrences over the study period, with stronger trends in the eastern basin. The Adriatic, Aegean, and northern Levantine Seas show the highest trends in both SST and its 99th percentile, highlighting these areas as particularly vulnerable in terms of both accumulated warming and extreme SST occurrences. Increased SST variability is observed in parts of the western and central Mediterranean Sea, while decreased variability is found in most of the eastern basin, alongside the underlying basin-wide mean warming. Results potentially suggest a stronger climate change effect in the southern Aegean Sea and most of the Levantine Sea, where the highest warming rates are observed despite the reduced variability in SST over the study period.
Applying the trend attributional ratio (TAR) proposed by Marin et al. (2021) for the Mediterranean Sea, we find a basin-wide dominance of the long-term SST change in causing more extreme events, longer heat exposure, and a greater accumulation of heat stress on an annual basis. Interannual variability mainly tends to mitigate the observed increase in these MHW properties, particularly in the eastern sub-basin. In contrast, interannual variability emerges as the primary driver of mean MHW intensity trends in the western and central Mediterranean areas.
These findings are in agreement with Marin et al. (2021), who demonstrated that trends in mean MHW intensity are predominantly forced by interannual variability at coastal sites globally and in the western and central Mediterranean Sea in particular, based on multiple SST datasets covering a shorter period. In the eastern Mediterranean areas, where the highest warming rates are observed, their findings for mean intensity trends at coastal locations show that mean warming dominates interannual variability, in line with our results. Moreover, they showed that trends in the yearly cumulative intensity and the number of MHW days are primarily attributed to the mean warming, in agreement with our findings for these metrics across the basin. This inter-comparison enhances confidence in the current results derived from applying their methods to an observational SST dataset (Table 1) spanning the satellite period and covering the entire Mediterranean Sea.
The current study is also in line with other recent studies that follow different approaches to investigate origins of MHW trends in the Mediterranean Sea. Our findings for the mean MHW intensity trends are consistent with Simon et al. (2023), although they focus on summer MHW activity, which is an index combining the occurrence, intensity, duration, and spatial extent of MHWs. In particular, they showed that interannual variability explains one-third of the total trend in summer activity in the western basin and in the Adriatic Sea, while our results suggest that interannual variability predominates over the mean warming signal in most of the western and central sub-basins for mean intensity trends based on all events throughout the year.
In addition, Martínez et al. (2023) suggest that the intensification of MHW conditions in the Mediterranean Sea is primarily driven by the mean SST warming in the basin. Their analysis focuses on MHW duration, cumulative intensity, spatial extent, frequency, and maximum intensity, with the latter being the only metric directly comparable to our study. A difference with respect to our results appears in the maximum intensity derived from detrended SST data: while Martínez et al. (2023) report an insignificant positive trend (basin-averaged), we detect a significant positive trend, which is more pronounced in the western basin. Notably, both studies agree on the dominant contribution of mean warming to the long-term trends in maximum intensity (and the rest of the metrics as well), though through different approaches. Martínez et al. (2023) base their conclusion on the insignificant long-term trends in basin-averaged metrics obtained from the detrended dataset, while our study relies on weighting the mean SST warming and interannual SST variability within the TAR framework. Specifically, TAR for maximum intensity confirms the dominant role of the mean SST warming, in line with Martínez et al. (2023), but also highlights non-negligible contributions from interannual SST variability, especially in the Alboran and Ligurian seas.
Overall, this study reveals a dominant role of the mean SST warming in increasing the severity, total heat exposure, and maximum intensity of MHWs in the Mediterranean Sea with a notably smaller effect on mean MHW intensity, which is largely influenced by interannual variability. The sensitivity of the employed attribution metric to different methodological choices for climatological baselines is higher for the mean MHW intensity compared to the rest of the examined metrics. This differentiation further suggests a more complex and likely less predictable behavior of this property. In this respect, Marin et al. (2021) show that mean intensity trends exhibit significant sensitivity to different datasets, in contrast to other metrics. Also consistent with our findings, Oliver (2019) shows that trends in the annual number of MHW days and the maximum intensity are mainly forced by mean warming in the basin, noting a less clear origin of the trends for the latter. Nevertheless, their results cannot be directly inter-compared to ours, as they use a substantially different methodology based on a statistical climate model. Moreover, Schlegel et al. (2019) show that, while linear trends significantly increase MHW duration, their effect on the maximum intensity can be either positive or negative. Their finding aligns with our results on the increased uncertainty associated with mean intensity; however, since it is based on the maximum intensity of averaged MHWs, it cannot be directly comparable to ours. Therefore, further investigation is needed to understand the reasons behind the distinct behavior of mean intensity – whether in terms of trends, trend attribution, or sensitivity to climatological baselines.
Finally, while the approach used to decompose SST signals in this study is commonly employed, there are limitations in interpreting the origin of the different components. To specifically assess the impact of anthropogenic influence, a future study for the Mediterranean Sea could employ an ensemble approach using climate models. This would offer a clearer understanding of the effects of climate change on extreme SST events relative to the role of natural variability while also minimizing the impact of single-product characteristics on MHW metrics.
Information on the product used in this paper is included in Table 1.
DD defined the research problem. DD conducted the analysis and wrote the article, with contributions from GK, SD, and MH. All authors contributed to the interpretation of results.
The contact author has declared that none of the authors has any competing interests.
The Copernicus Marine Service products are subject to updates and revisions as part of the Service's ongoing efforts to meet user needs. As such, product identifiers and documentation for the product Mediterranean Sea High Resolution L4 Sea Surface Temperature Reprocessed used in this paper may change over time. For the most current information or if assistance is needed regarding this product, readers are encouraged to contact the Copernicus Marine Service user support team.
Publisher's note: Copernicus Publications remains neutral with regard to jurisdictional claims made in the text, published maps, institutional affiliations, or any other geographical representation in this paper. While Copernicus Publications makes every effort to include appropriate place names, the final responsibility lies with the authors.
This research has been supported by the Copernicus Med-MFC (LOT reference: 21002L5-COP-MFC MED-5500, supporting Dimitra Denaxa) and the Hellenic Foundation for Research and Innovation (HFRI, TexMed, project no. 07077, supporting Sofia Darmaraki).
This paper was edited by Marta Marcos and reviewed by two anonymous referees.
Bates, A. E., Cooke, R. S. C., Duncan, M. I., Edgar, G. J., Bruno, J. F., Benedetti-Cecchi, L., Côté, I. M., Lefcheck, J. S., Costello, M. J., Barrett, N., Bird, T. J., Fenberg, P. B., and Stuart-Smith, R. D.: Climate resilience in marine protected areas and the “Protection Paradox”, Biol. Conserv., 236, 305–314, https://doi.org/10.1016/j.biocon.2019.05.005, 2019.
Beever, E. A., Hall, L. E., Varner, J., Loosen, A. E., Dunham, J. B., Gahl, M. K., Smith, F. A., and Lawler, J. J.: Behavioral flexibility as a mechanism for coping with climate change, Front. Ecol. Environ., 15, 299–308, https://doi.org/10.1002/fee.1502, 2017.
Cascarano, M. C., Stavrakidis-Zachou, O., Mladineo, I., Thompson, K. D., Papandroulakis, N., and Katharios, P.: Mediterranean aquaculture in a changing climate: Temperature effects on pathogens and diseases of three farmed fish species, Pathogens, 10, 1205, https://doi.org/10.3390/pathogens10091205, 2021.
Chatzimentor, A., Doxa, A., Katsanevakis, S., and Mazaris, A. D.: Are Mediterranean marine threatened species at high risk by climate change?, Glob. Chang. Biol., 29, 1809–1821, https://doi.org/10.1111/gcb.16577, 2023.
Ciappa, A. C.: Effects of Marine Heatwaves (MHW) and Cold Spells (MCS) on the surface warming of the Mediterranean Sea from 1989 to 2018, Prog. Oceanogr., 205, 102828, https://doi.org/10.1016/j.pocean.2022.102828, 2022.
Darmaraki, S., Somot, S., Sevault, F., and Nabat, P.: Past Variability of Mediterranean Sea Marine Heatwaves, Geophys. Res. Lett., 46, 9813–9823, https://doi.org/10.1029/2019GL082933, 2019.
Dayan, H., McAdam, R., Juza, M., Masina, S., and Speich, S.: Marine heat waves in the Mediterranean Sea: An assessment from the surface to the subsurface to meet national needs, Front. Mar. Sci., 10, 1–21, https://doi.org/10.3389/fmars.2023.1045138, 2023.
Denaxa, D., Korres, G., Bonino, G., Masina, S., and Hatzaki, M.: The role of air–sea heat flux for marine heatwaves in the Mediterranean Sea, in: 8th edition of the Copernicus Ocean State Report (OSR8), edited by: von Schuckmann, K., Moreira, L., Grégoire, M., Marcos, M., Staneva, J., Brasseur, P., Garric, G., Lionello, P., Karstensen, J., and Neukermans, G., Copernicus Publications, State Planet, 4-osr8, 11, https://doi.org/10.5194/sp-4-osr8-11-2024, 2024.
E.U. Copernicus Marine Service Information (CMEMS): Mediterranean Sea – High Resolution L4 Sea Surface Temperature Reprocessed, Marine Data Store (MDS) [data set], https://doi.org/10.48670/moi-00173, 2024a.
E.U. Copernicus Marine Service Information (CMEMS): Mediterranean Sea Surface Temperature time series and trend from Observations Reprocessing, Marine Data Store (MDS) [data set], https://doi.org/10.48670/moi-00268, 2024b.
Hamdeno, M. and Alvera-Azcaráte, A.: Marine heatwaves characteristics in the Mediterranean Sea: Case study the 2019 heatwave events, Front. Mar. Sci., 10, 1–19, https://doi.org/10.3389/fmars.2023.1093760, 2023.
Hidalgo, M., El-Haweet, A. E., Tsikliras, A. C., Tirasin, E. M., Fortibuoni, T., Ronchi, F., Lauria, V., Ben Abdallah, O., Arneri, E., Ceriola, L., Milone, N., Lelli, S., Hernández, P., Bernal, M., and Vasconcellos, M.: Risks and adaptation options for the Mediterranean fisheries in the face of multiple climate change drivers and impacts, ICES J. Mar. Sci., 79, 2473–2488, https://doi.org/10.1093/icesjms/fsac185, 2022.
Hobday, A. J., Alexander, L. V., Perkins, S. E., Smale, D. A., Straub, S. C., Oliver, E. C. J., Benthuysen, J. A., Burrows, M. T., Donat, M. G., Feng, M., Holbrook, N. J., Moore, P. J., Scannell, H. A., Sen Gupta, A., and Wernberg, T.: A hierarchical approach to defining marine heatwaves, Prog. Oceanogr., 141, 227–238, https://doi.org/10.1016/j.pocean.2015.12.014, 2016.
Hobday, A. J., Oliver, E. C. J., Sen Gupta, A, Benthuysen, J. A., Burrows, M. T., Donat, M. G., Holbrook, N. J., Moore, P. J., Thomsen, M. S., Wernberg, T., and Smale, D. A.: Categorizing and naming marine heatwaves, Oceanography, 31, 162–173, 2018.
Juza, M. and Tintoré, J.: Multivariate Sub-Regional Ocean Indicators in the Mediterranean Sea: From Event Detection to Climate Change Estimations, Front. Mar. Sci., 8, 610589, https://doi.org/10.3389/fmars.2021.610589, 2021.
Juza, M., Fernández-Mora, A., and Tintoré, J.: Sub-Regional Marine Heat Waves in the Mediterranean Sea From Observations: Long-Term Surface Changes, Sub-Surface and Coastal Responses, Front. Mar. Sci., 9, 785771, https://doi.org/10.3389/fmars.2022.785771, 2022.
Kır, M.: Thermal tolerance and standard metabolic rate of juvenile gilthead seabream (Sparus aurata) acclimated to four temperatures, J. Therm. Biol., 93, 102739, https://doi.org/10.1016/j.jtherbio.2020.102739, 2020.
Marin, M., Feng, M., Phillips, H. E., and Bindoff, N. L.: A Global, Multiproduct Analysis of Coastal Marine Heatwaves: Distribution, Characteristics, and Long-Term Trends, J. Geophys. Res.-Oceans, 126, 1–17, https://doi.org/10.1029/2020JC016708, 2021.
Martínez, J., Leonelli, F. E., García-Ladona, E., Garrabou, J., Kersting, D. K., Bensoussan, N., and Pisano, A.: Evolution of marine heatwaves in warming seas: the Mediterranean Sea case study, Front. Mar. Sci., 10, 1193164, https://doi.org/10.3389/fmars.2023.1193164, 2023.
Mengual, I. L., Sanchez-Jerez, P., and Ballester-Berman, J. D.: Offshore aquaculture as climate change adaptation in coastal areas: sea surface temperature trends in the Western Mediterranean Sea, Aquac. Environ. Interact., 13, 515–526, https://doi.org/10.3354/AEI00420, 2021.
Mohamed, B., Abdallah, A. M., Alam El-Din, K., Nagy, H., and Shaltout, M.: Inter-Annual Variability and Trends of Sea Level and Sea Surface Temperature in the Mediterranean Sea over the Last 25 Years, Pure Appl. Geophys., 176, 3787–3810, https://doi.org/10.1007/s00024-019-02156-w, 2019.
Oliver, E. C. J.: Mean warming not variability drives marine heatwave trends, Clim. Dynam., 53, 1653–1659, https://doi.org/10.1007/s00382-019-04707-2, 2019.
Orenes-Salazar, V., Navarro-Martínez, P. C., Ruíz, J. M., and García-Charton, J. A.: Recurrent marine heatwaves threaten the resilience and viability of a key Mediterranean octocoral species, Aquat. Conserv. Mar. Freshw. Ecosyst., 33, 1161–1174, https://doi.org/10.1002/aqc.3997, 2023.
Pastor, F. and Khodayar, S.: Marine heat waves: Characterizing a major climate impact in the Mediterranean, Sci. Total Environ., 861, 160621, https://doi.org/10.1016/j.scitotenv.2022.160621, 2023.
Pastor, F., Valiente, J. A., and Khodayar, S.: A Warming Mediterranean: 38 Years of Increasing Sea Surface Temperature, Remote Sens., 12, 2687, https://doi.org/10.3390/rs12172687, 2020.
Pisano, A., Marullo, S., Artale, V., Falcini, F., Yang, C., Leonelli, F. E., Santoleri, R., and Buongiorno Nardelli, B.: New evidence of Mediterranean climate change and variability from Sea Surface Temperature observations, Remote Sens., 12, 1–18, https://doi.org/10.3390/RS12010132, 2020.
Pisano, A., Fanelli, C., Cesarini, C., Tronconi, C., La Padula, F., and Buongiorno Nardelli, B.: EU Copernicus Marine Service Product User Manual for the Mediterranean Sea – High Resolution L4 Sea Surface Temperature Reprocessed Product, SST_MED_SST_L4_REP_OBSERVATIONS_010_021, Issue 4.0, Mercator Ocean International, https://catalogue.marine.copernicus.eu/documents/PUM/CMEMS-SST-PUM-010-021-022-041-042.pdf (last access: 14 May 2025), 2024a.
Pisano, A., Fanelli, C., Cesarini, C., Tronconi, C., La Padula, F., and Buongiorno Nardelli, B.: EU Copernicus Marine Service Quality Information Document for the Mediterranean Sea – High Resolution L4 Sea Surface Temperature Reprocessed Product, SST_MED_SST_L4_REP_OBSERVATIONS_010_021, Issue 4.0, Mercator Ocean International, https://catalogue.marine.copernicus.eu/documents/QUID/CMEMS-SST-QUID-010-021-022-041-042.pdf (last access: 14 May 2025), 2024b.
Schlegel, R. W., Oliver, E. C. J., Hobday, A. J., and Smit, A. J.: Detecting Marine Heatwaves With Sub-Optimal Data, Front. Mar. Sci., 6, 1–14, https://doi.org/10.3389/fmars.2019.00737, 2019.
Sen Gupta, A., Thomsen, M., Benthuysen, J. A., Hobday, A. J., Oliver, E., Alexander, L. V, Burrows, M. T., Donat, M. G., Feng, M., Holbrook, N. J., Perkins-Kirkpatrick, S., Moore, P. J., Rodrigues, R. R., Scannell, H. A., Taschetto, A. S., Ummenhofer, C. C., Wernberg, T., and Smale, D. A.: Drivers and impacts of the most extreme marine heatwave events, Sci. Rep., 10, 19359, https://doi.org/10.1038/s41598-020-75445-3, 2020.
Simon, A., Pires, C., Frölicher, T. L., and Russo, A.: Long-term warming and interannual variability contributions' to marine heatwaves in the Mediterranean, Weather Clim. Extrem., 42, 100619, https://doi.org/10.1016/j.wace.2023.100619, 2023.
Zhao, Z. and Marin, M.: A MATLAB toolbox to detect and analyze marine heatwaves, J. Open Source Softw., 4, 1124, https://doi.org/10.21105/joss.01124, 2019.
Zentner, Y., Rovira, G., Margarit, N., Ortega, J., Casals, D., Medrano, A., Pagès-Escolà, M., Aspillaga, E., Capdevila, P., Figuerola-Ferrando, L., Riera, J. L., Hereu, B., Garrabou, J., and Linares, C.: Marine protected areas in a changing ocean: Adaptive management can mitigate the synergistic effects of local and climate change impacts, Biol. Conserv., 282, 110048, https://doi.org/10.1016/j.biocon.2023.110048, 2023.