the Creative Commons Attribution 4.0 License.
the Creative Commons Attribution 4.0 License.
 | 30 Sep 2024 | OSR8 | Chapter 2.6
Surface and bottom marine heatwave characteristics in the Barents Sea: a model study
Roshin P. Raj
Sourav Chatterjee
Anomalously warm oceanic events, often termed marine heatwaves (MHWs), can potentially impact the ecosystem in the affected region and have therefore become a hot topic for research in recent years. Determining the intensity and spatial extent of marine heatwaves, however, depends on the definition and climatological average used. Moreover, the stress applied by the heatwave to the marine ecosystem will depend on which component of the ecosystem is considered. Here, we utilize a model reanalysis (1991–2022) to explore the frequency, intensity, and duration of marine heatwaves in the Barents Sea, as well as regional heterogeneities. We find that major marine heatwaves are rather coherent throughout the region, but surface marine heatwaves occur more frequently while heatwaves on the ocean floor have a longer duration. Moreover, we investigate the sensitivity to the choice of climatological average length when calculating marine heatwave statistics. Our results indicate that severe marine heatwaves may become more frequent in a future Barents Sea due to ongoing climate change.
- Article
(2357 KB) - Full-text XML
-
Supplement
(1176 KB) - BibTeX
- EndNote


A marine heatwave (MHW) is a period of a warm spell in an ocean region and is usually defined as a period when the temperature exceeds a given threshold relative to a climatological average (e.g., Marbá et al., 2015; Hobday et al., 2016; Scannell et al., 2016; Hu et al., 2020; Huang et al., 2021). Due to the potentially profound impact on marine life (e.g., Smale et al., 2019; Husson et al., 2022) and, hence, also socioeconomic impacts (Smith et al., 2021), MHWs have received increasing attention in recent years (see Oliver et al. (2021) for a comprehensive review of recent literature). While the criteria to define MHWs seem to converge to those proposed by Hobday et al. (2016), i.e., the temperature exceeding the 90th percentile of the moving climatological average, little attention has been given to the impact of the choice of climatological average on the MHW characteristics and statistics such as frequency, intensity, and duration (Chiswell, 2022). The underlying trends of global ocean warming (e.g., Cheng et al., 2022) and regional climate variability (e.g., Smedsrud et al., 2022) both impact the MHW statistics, and some regions may eventually enter a state of permanent MHW, depending on the climatological average chosen. As an example, while Fröhlicher et al. (2018) found a doubling of MHW days between 1982 and 2016 globally, Chiswell (2022) showed that accounting for climate change by removing the linear trend resulted in weaker MHWs in the tropics and stronger MHWs in the northern Pacific and Atlantic oceans.
When MHWs are calculated as a time series for a whole region, possible regional heterogeneities may be masked, thereby reducing the applicability of using the time series as an MHW index. The Barents Sea is a complex shelf sea that mainly consists of a relatively warm and ice-free Atlantic-Water-dominated part in the south and a cold, seasonally ice-covered Arctic-Water-dominated part in the north. The southern part is kept ice-free by relatively warm and saline Atlantic Water entering to the southwest. The Atlantic Water gives up most of its heat (relative to the average temperature of the Polar Basin) to the atmosphere while en route (e.g., Gammelsrød et al., 2009; Smedsrud et al., 2013). Moreover, the inflow of Atlantic Water has been shown to be a precursor for interannual variability in the Barents Sea sea-ice cover (Onarheim et al., 2015; Schlichtholz, 2019) and in the ocean heat content further downstream in the Barents Sea (Lien et al., 2017). Both the southern and northern Barents Sea have varying seasonal stratification, mainly from the melting of sea ice in the north and solar insolation causing thermal stratification in the south (e.g., Smedsrud et al., 2013; Lind et al., 2018). The marine ecosystem differs between the two main regions, with further diversification within each region. However, the extension of the two regimes is changing due to ongoing climate change, with the boreal southern part expanding at the expense of the northern Arctic part (e.g., Fossheim et al., 2015; Oziel et al., 2020). The Barents Sea is home to several important commercial fish stocks, both pelagic (e.g., capelin (Mallotus villosus) and Norwegian spring spawning herring (Clupea harengus)) and demersal (e.g., Northeast Arctic cod (Gadus morhua) and haddock (Melanogrammus aeglefinus)), in addition to a diverse marine ecosystem including large groups of marine mammals and sea birds, as well as unique benthos communities (see Jakobsen and Ozhigin, 2011, for a more comprehensive overview). Hence, MHWs may have profound impacts on marine living resources but with different species exhibiting differences in resilience to MHW events (e.g., Husson et al., 2022). Recent studies on MHWs in the Barents Sea, however, have focused on the surface or the upper parts of the water column (Mohamed et al., 2022; Husson et al., 2022). Here, we investigate the occurrences of both surface and bottom MHWs in four contrasting environments in the Barents Sea. Moreover, we explore the differences in frequency, intensity, and duration using varying climatological average lengths for estimating MHWs. We also focus on the highest-intensity MHW event in terms of cumulative degree days and investigate its oceanic and atmospheric preconditioning and decline.
2.1 Model data
We based our analysis on modelled daily averages from the EU Copernicus Marine Service ocean reanalysis for the Arctic region based on the TOPAZ model system for the period 1991–2022 (Sakov et al., 2012; Xie et al., 2016; Lien et al., 2016; product ref. 1, Table 1), hereinafter termed “TOPAZ reanalysis”.
2.2 Ocean observation data
We have used available Conductivity–Temperature–Depth (CTD) casts (product ref. 2, Table 1), covering the period 1986 to 2020, for assessing the quality of the model dataset with regard to bottom temperatures in four regions of the Barents Sea (Fig. 1) before we use the models results to calculate MHW statistics. The CTD data were obtained from the Institute of Marine Research database, The Integrated Database for Ocean Research (TINDOR).
2.3 Atmospheric data
Monthly averages of turbulent heat fluxes and outgoing longwave radiation for the period 1993 to 2021 were downloaded from the EU Copernicus Climate Service website (product ref. 3, Table 1; Hersbach et al., 2023).
2.4 Marine heatwave estimation method
We have adopted the definition of MHWs proposed by Hobday et al. (2016), where an MHW is defined as a period of more than 5 d where the temperature is above the 90th percentile of the daily varying climatology averaged over a period of at least 30 years. Moreover, two consecutive events divided by a gap of 2 d or less are considered a single event.
The TOPAZ reanalysis covers the time period 1991–2022. In compliance with common standards set by the World Meteorological Organization (WMO, 2007, 2015), we have chosen the period 1991–2020 as the climatological average period. To study the effect of changing the climatological average period, we have also calculated the MHW statistics using the 25-year period 1996–2020 and the 20-year period 2001–2020 as the climatological average periods.
We have chosen four sub-regions where we compute the daily spatially averaged surface and bottom temperatures representing contrasting marine environments: the Bear Island Trough in the southwestern Atlantic Water inflow area to the Barents Sea; the adjacent Spitsbergen Bank which represents a productive, shallow bank with an Arctic marine environment; the Northeast Basin in the northeastern Barents Sea which represents the outflow region where strongly modified Atlantic-derived water masses leave the Barents Sea; and the Pechora Sea to the southeast which represents a shallow area influenced by coastal water (see map; Fig. 1). Our Bear Island Trough region is pushed towards the southern slope of the trough to cover the area around 72°30′ N which is where the core of the main inflow branch carrying Atlantic Water to the Barents Sea is located (e.g., Skagseth et al., 2008).
For estimating MHW statistics we have used the Python package provided by Eric C. J. Oliver (https://github.com/ecjoliver/marineHeatWaves/releases/tag/v0.16; last access: 24 March 2023; Oliver, 2016), using the default settings.
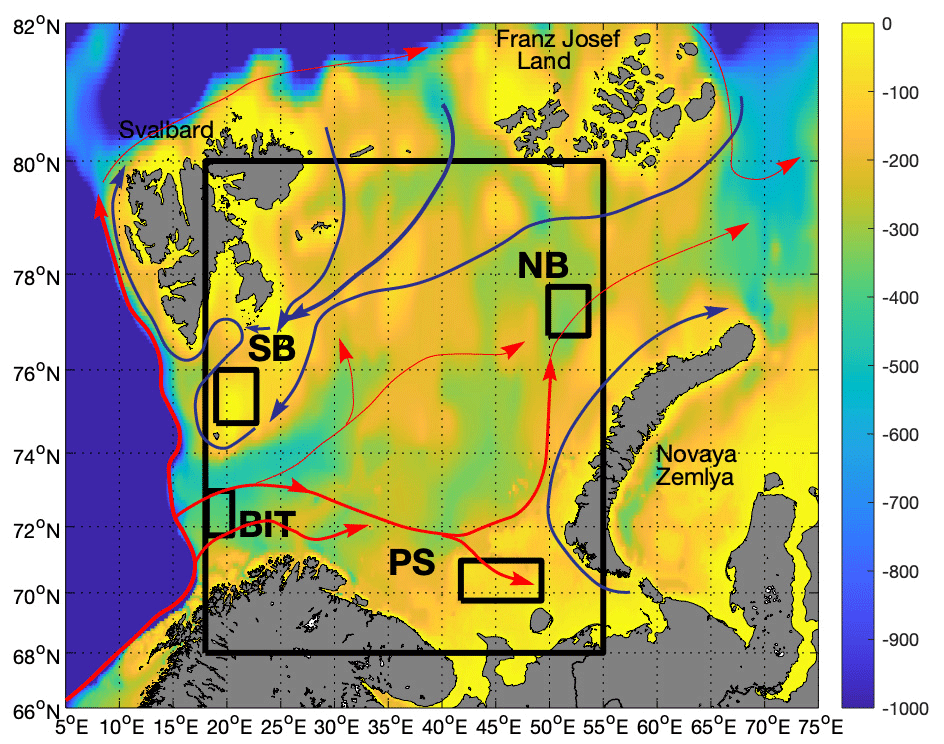
Figure 1Map of the Barents Sea. Colours show the bathymetry (in metres). Arrows show the main current patterns for Atlantic Water (red) and Arctic Water (blue). Boxes show regions for estimating marine heatwave statistics from the TOPAZ reanalysis. BIT: Bear Island Trough. NB: Northeast Basin. SB: Spitsbergen Bank. PS: Pechora Sea.
2.5 Model evaluation
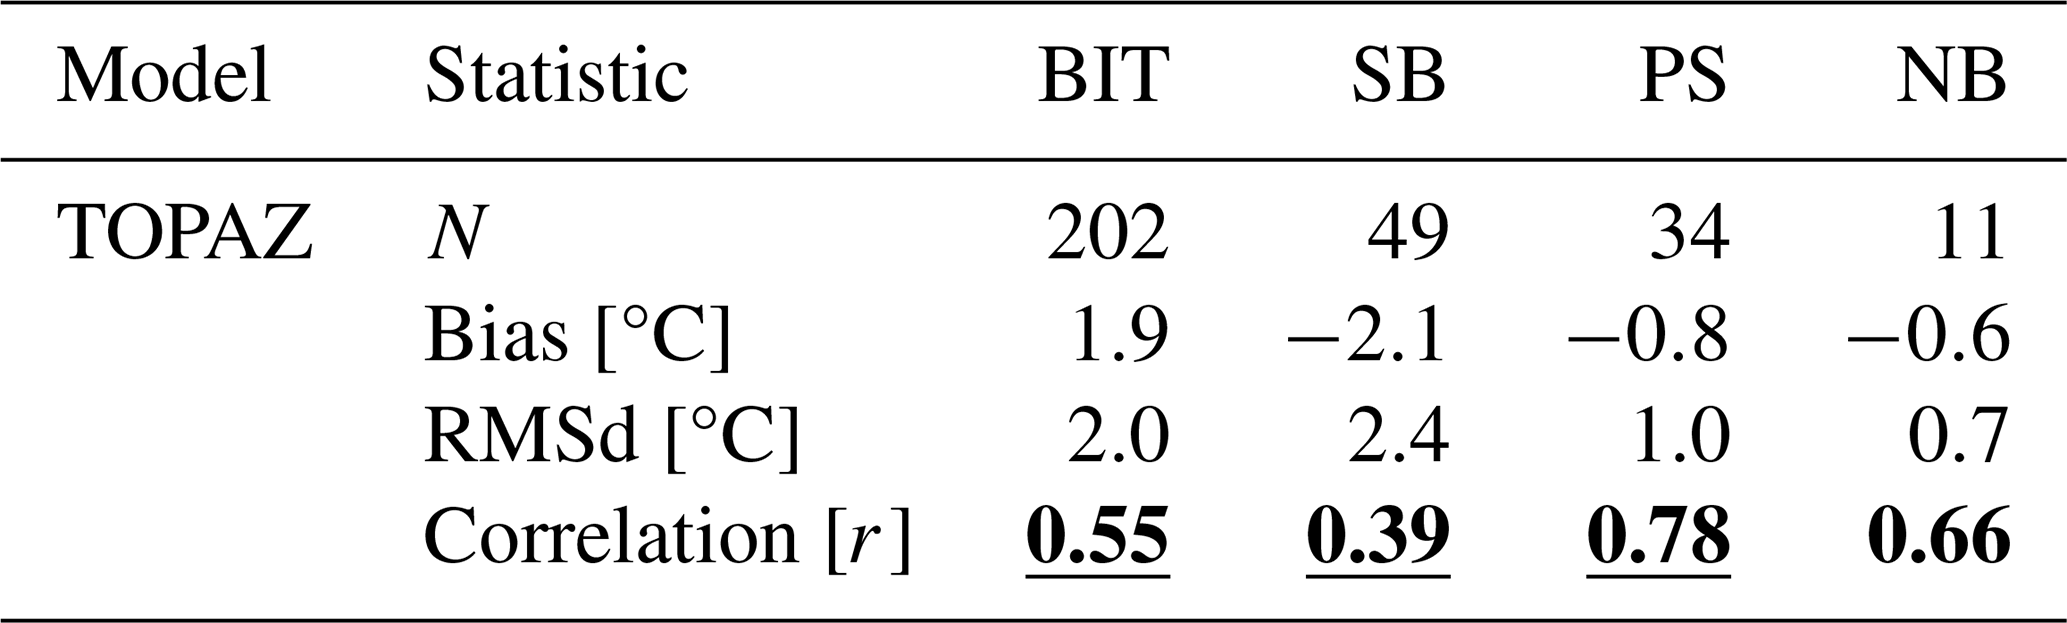
The model product used in this study has previously been evaluated against a suite of ocean observations (e.g., Lien et al., 2016; Xie et al., 2019, 2023). However, because we also used the model for the analysis of MHWs near the ocean floor, we provide an assessment of the quality of the model by direct comparison with observations of near-bottom temperature from CTD casts where available in the four sub-regions. The motivation for comparing only bottom temperatures is that satellite sea surface temperature observations are assimilated into the TOPAZ reanalysis. Moreover, the sea surface temperature is also constrained by ocean–atmosphere bulk fluxes.
In this model quality assessment, we compared modelled and observed near-bottom temperatures averaged in time (monthly) and space (see sub-regions; Fig. 1). The modelled seasonal signal was removed from both model and observation time series before the correlation was calculated. The comparison is summarized in Table 2 and Fig. S1.
Table 2Statistics summarizing the comparison between the model and observations at N CTD locations. Correlations are shown in boldface when p<0.05 and underlined boldface when p<0.01. BIT: Bear Island Trough. SB: Spitsbergen Bank. PS: Pechora Sea. NB: Northeast Basin.
We first calculated the MHW statistics based on the TOPAZ reanalysis for the full Barents Sea region for the period 1991–2022 (see Fig. 1 for area definition), which are summarized in Fig. 2 and Tables 3–5. A total of 29 MHWs were identified at the surface compared to 5 MHWs near the bottom, equating to a frequency of 0.90 yr−1 at the surface and 0.16 yr−1 near the bottom. The average maximum intensity was 1.41 and 1.07 °C at the surface and near the bottom, respectively. The duration was, on average, longer near the bottom (214 d) than at the surface (33 d). Moreover, we found a positive decadal trend in the MHW frequency at the surface of 0.82 yr−1 (p<0.05), while for all the other metrics mentioned above the decadal trends were non-significant.
Two periods are distinguished in terms of MHW cumulative intensity (°C days), both at the surface and near the bottom. The strongest MHW in the Barents Sea as a whole, in terms of cumulative intensity, occurred in 2016 both at the surface and near the bottom (Fig. 3a, f). At the surface, the 2016 MHW had an average intensity of 1.29 °C (maximum of 3.41 °C) and a total duration of 480 d (from 19 December 2015 to 11 April 2017). Near the bottom, the 2016 MHW had an average intensity of 1.10 °C (maximum of 1.28 °C) and a total duration of 479 d (28 February 2016 to 20 June 2017). The second-strongest MHW in terms of cumulative intensity in the Barents Sea as a whole occurred in 2013 at the surface and in 2012 near the bottom (see Fig. S2). While an investigation on possible mechanisms for the decoupling between the surface and the bottom is beyond the scope of this work, we note that the 2012–13 MHW event was preceded by an extraordinarily large temperature anomaly but close-to-average volume transport in the Atlantic Water entering the Barents Sea to the southwest (e.g., ICES, 2022), as opposed to extraordinarily large volume transports preceding the 2016 MHW event (see below for more details). Moreover, previous studies have suggested that temperature anomalies that are advected into the Barents Sea at depth during the stratified summer season can re-emerge at the surface further downstream through vertical mixing during the following winter (e.g., Schlichtholz, 2019).
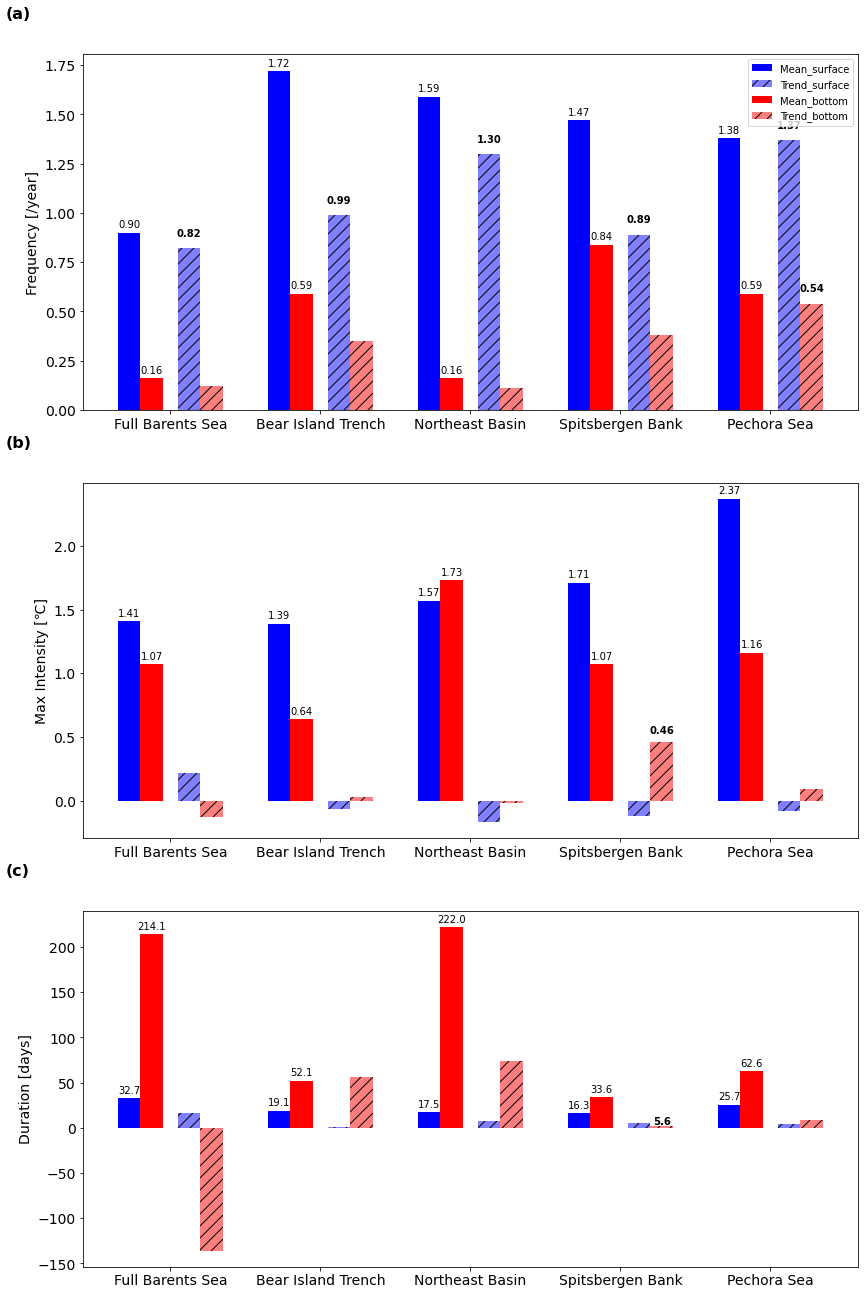
Figure 2Marine heatwave statistics for the full Barents Sea for the period 1991–2022, using 1991–2020 as the climate average period. (a) Number of marine heatwave events per year. (b) Maximum intensity of the heatwave events. (c) Average marine heatwave duration. The associated decadal trends are shown in hatched colours. The trend is provided in boldface if significant to 95 % (p<0.05). Surface values are shown by blue bars, and bottom values are shown by red bars. This figure is based on data from the TOPAZ reanalysis.
To investigate possible regional heterogeneity in MHWs within the Barents Sea, we calculated MHW statistics in the four sub-regions depicted in Fig. 1. The results are summarized in Tables 3, 4, and 5. In all regions, we found a higher frequency of MHW events than for the Barents Sea as a whole (except for near the bottom of the Northeast Basin). Moreover, all regions showed a larger positive decadal trend in the frequency compared with the Barents Sea as a whole, although this trend was only found to be statistically significant near the bottom of the Pechora Sea (p<0.05; Table 3). For the average maximum intensity at the surface, we found that the Bear Island Trough, which is the upstream inflow region, had similar statistics to the Barents Sea as a whole, while for the other three regions the intensity was generally larger (Table 4). Near the bottom, the intensity in the Bear Island Trough was less than that of the Barents Sea as a whole, while in the downstream Northeast Basin the intensity was larger on average. In the two other regions the differences were smaller. In terms of duration, all regions experienced shorter MWHs on average compared to the Barents Sea as a whole, especially near the bottom. The exception was the Northeast Basin, where the average duration of near-bottom MHWs was found to be comparable to that of the Barents Sea as a whole (Table 5).
To investigate further regional heterogeneity, we considered the MHW event in 2016 in each of the regions. At the surface, the 2016 MHW event was the most severe MHW event in terms of cumulative intensity in three out of the four sub-regions investigated. The exception was the Bear Island Trough, where the 2012 MHW event was more severe (not shown). Near the bottom, the 2016 MHW event was the most severe MHW event in all four regions (Fig. 3). The progression of the 2016 MHW event was comparable in all regions, except for the Spitsbergen Bank where the onset of the MHW occurred later, near mid-summer, compared to the other regions where the onset occurred during late winter. However, on the Spitsbergen Bank the 2016 MHW was preceded by several but less intense and intermittent MHWs. It is also worth noting that the onset in the other three regions, as well as the Barents Sea as a whole, occurred in late February/early March, except for in the upstream Bear Island Trough where the onset occurred at the beginning of April. Moreover, both the average and maximum MHW intensity were less in the Bear Island Trough compared to the other regions.
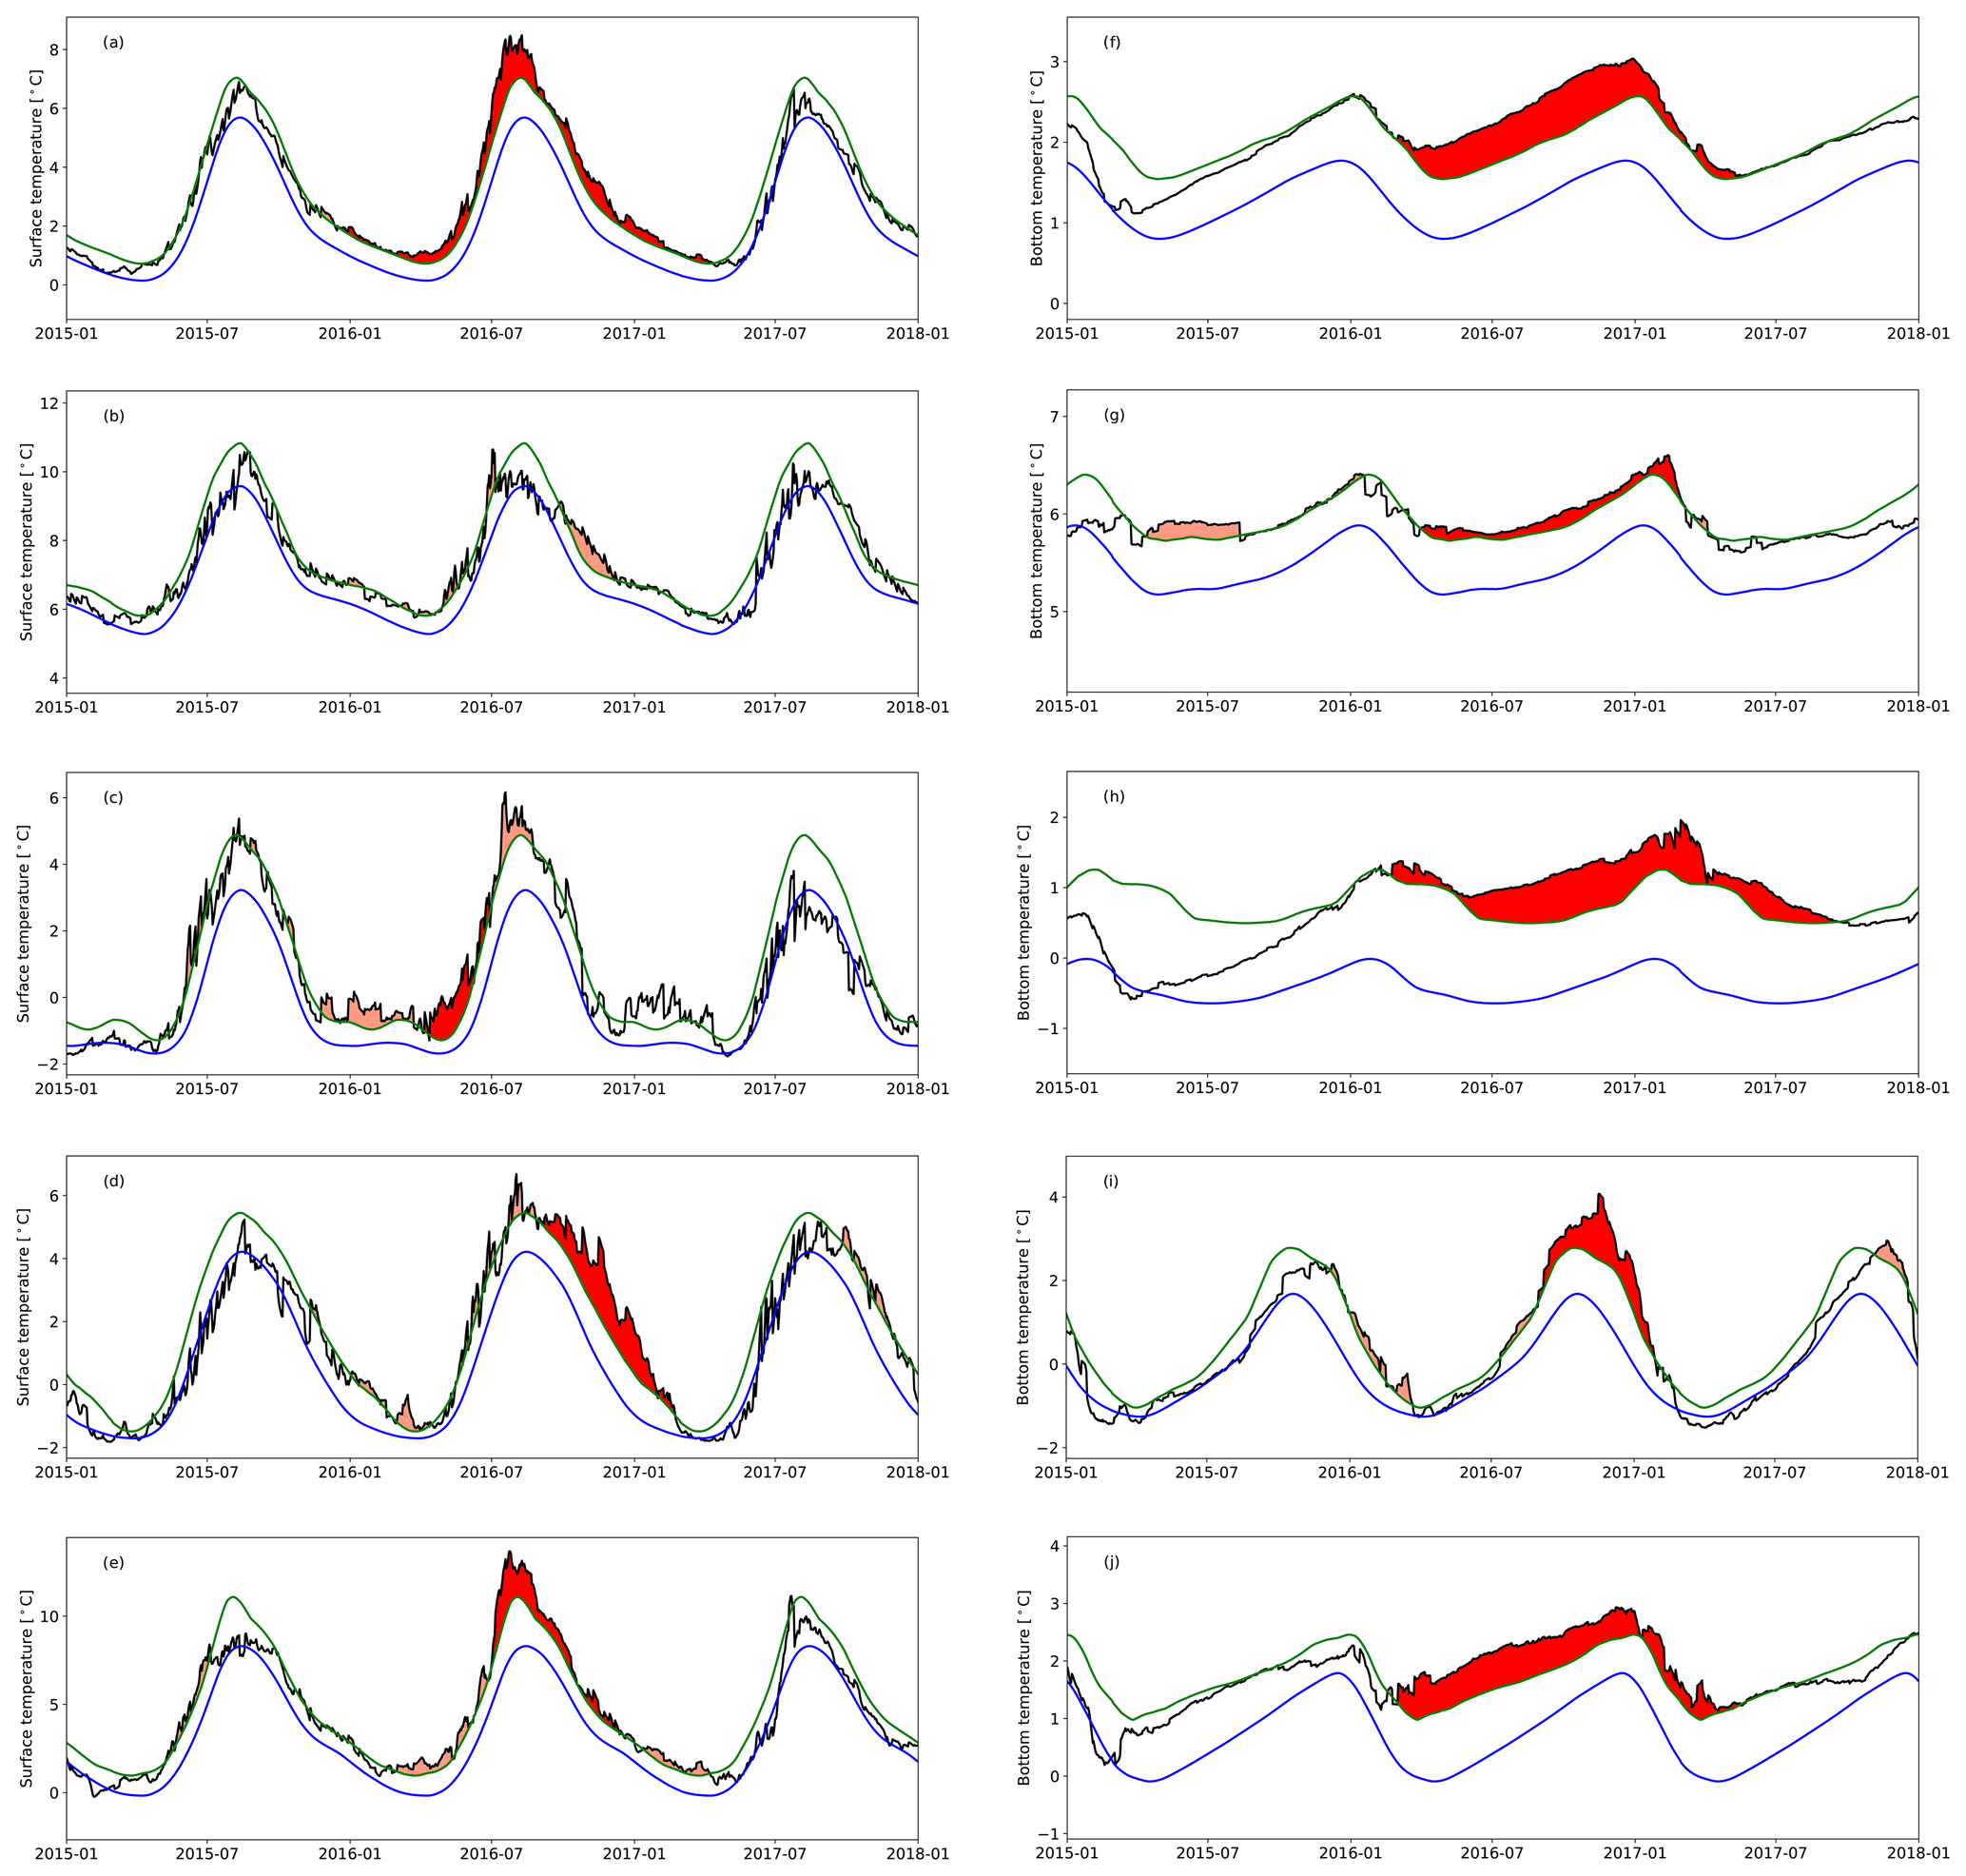
Figure 3Time series (2015–2017; black lines) showing the temperature at the surface (left column) and near the bottom (right column) spatially averaged over the Barents Sea. Blue lines show daily climatology. Green lines show the 90th percentile. The highest-intensity marine heatwave in terms of cumulative degree days for the full 1991–2022 period is shown in dark-red shading. Other marine heatwaves are shown in pink shading. (a) The full Barents Sea (surface). (b) The Bear Island Trough (surface). (c) The Northeast Basin (surface). (d) The Spitsbergen Bank (surface). (e) The Pechora Sea (surface). (f) The full Barents Sea (bottom). (g) The Bear Island Trough (bottom). (h) The Northeast Basin (bottom). (i) The Spitsbergen Bank (bottom). (j) The Pechora Sea (bottom). All panels show the period 1 January 2015 to 1 January 2018. Note the different scales on the y axes.
3.1 Preconditioning and atmospheric forcing of the 2016 MHW event
Leading up to the onset of the 2016 MHW, the inflow of warm Atlantic Water to the Barents Sea was above average during the whole of 2015 (ICES, 2022). However, during the following winter of 2015–16, the turbulent (latent and sensible) heat loss was between 20 and 70 W m−2 below the 1993–2021 average in the southern Barents Sea (71–75° N, 25–45° E; i.e., along the Atlantic Water pathway through the Barents Sea; Fig. 4a), which was the lowest for the period 1993–2021. The reduced heat loss to the atmosphere occurred despite the preceding increase in advected oceanic heat (Fig. 4a, e). Note that, during the winter months, the solar radiation can be neglected due to the polar night conditions in the Barents Sea region. Moreover, wind-driven mixing during winter breaks down the upper water column stratification, connecting the surface with the deeper layers. Thus, the 2016 MHW event was preceded by an increased Atlantic Water heat transport and reduced heat loss to the atmosphere. While we did not perform a closed heat budget calculation, we note that the oceanic heat carried by the downstream outflow from the Barents Sea has previously been reported to be smaller than the inflow by 1 order of magnitude (e.g., Gammelsrød et al., 2009; Smedsrud et al., 2013) and that a previous study found that increased oceanic heat advection to the Barents Sea led to increased ocean heat content in the interior Barents Sea (Lien et al., 2017).
In the following winter of 2016–17, i.e., during the decline of the 2016 MHW event, the turbulent heat loss and outgoing longwave radiation in the northern Barents Sea (76–80° N, 25–45° E; Fig. 4b, e, f) reached the largest values in the 1993–2021 period. This was likely enhanced by a record low winter sea-ice extent (ICES, 2022) and negative cloud cover anomaly in the northern Barents Sea (not shown). In the southern Barents Sea, however, no heat loss anomaly at the ocean surface was observed during the winter of 2016–17 (Fig. 4b), but the Atlantic Water transport through the Barents Sea Opening decreased during 2016 (ICES, 2022). Thus, the 2016 MHW event in the Barents Sea can be linked to the combined effect of increased Atlantic Water transport into the Barents Sea and to reduced oceanic heat loss in the southern Barents Sea during the onset and increased oceanic heat loss in the northern Barents Sea during the decline.
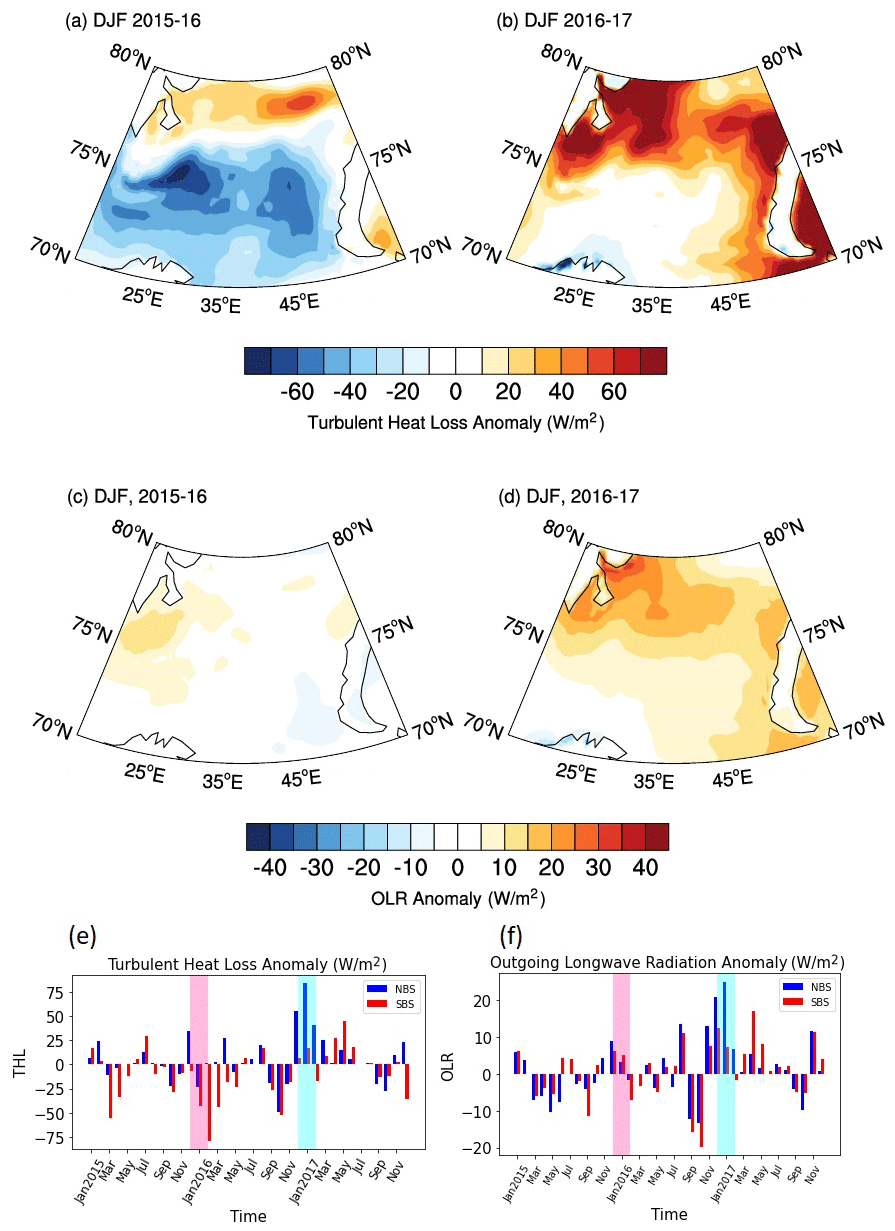
Figure 4Atmospheric preconditioning leading up to the MHW depicted in Fig. 3. (a, b) DJF (December (−1), January, February (0)) turbulent (latent + sensible) heat loss anomaly (W m−2) for 2016 (a) and 2017 (b). Same as (a) and (b) but for outgoing longwave radiation (OLR). Positive values indicate upward fluxes. Monthly mean turbulent heat loss (e) and OLR (f) over the northern (blue; 76–80° N, 25–45° E) and southern (red; 71–75° N, 25–45° E) Barents Sea. The onset (DJF, 2015/2016) and decay (DJF, 2016/2017) phase of the 2016 MHW event are shaded in pink and cyan. Data: ERA5.
3.2 Effect of changing baselines
Next, we investigated the effect of changing the climatological average period from 30 years (1991–2020) to 25 years (1996–2020) and 20 years (2001–2020) when calculating the MHW statistics for both the surface and the bottom (Tables 3–5).
Table 3Average frequency of marine heatwaves and the associated decadal trend for three different baseline periods, 1991–2020, 1996–2020, and 2001–2020. The trend is provided in boldface if significant to 95 % (p<0.05) or in italics if not significant (p>0.05). Values for the surface are shown on top, and values for bottom are shown below. BIT: Bear Island Trough. SB: Spitsbergen Bank. PS: Pechora Sea. NB: Northeast Basin.
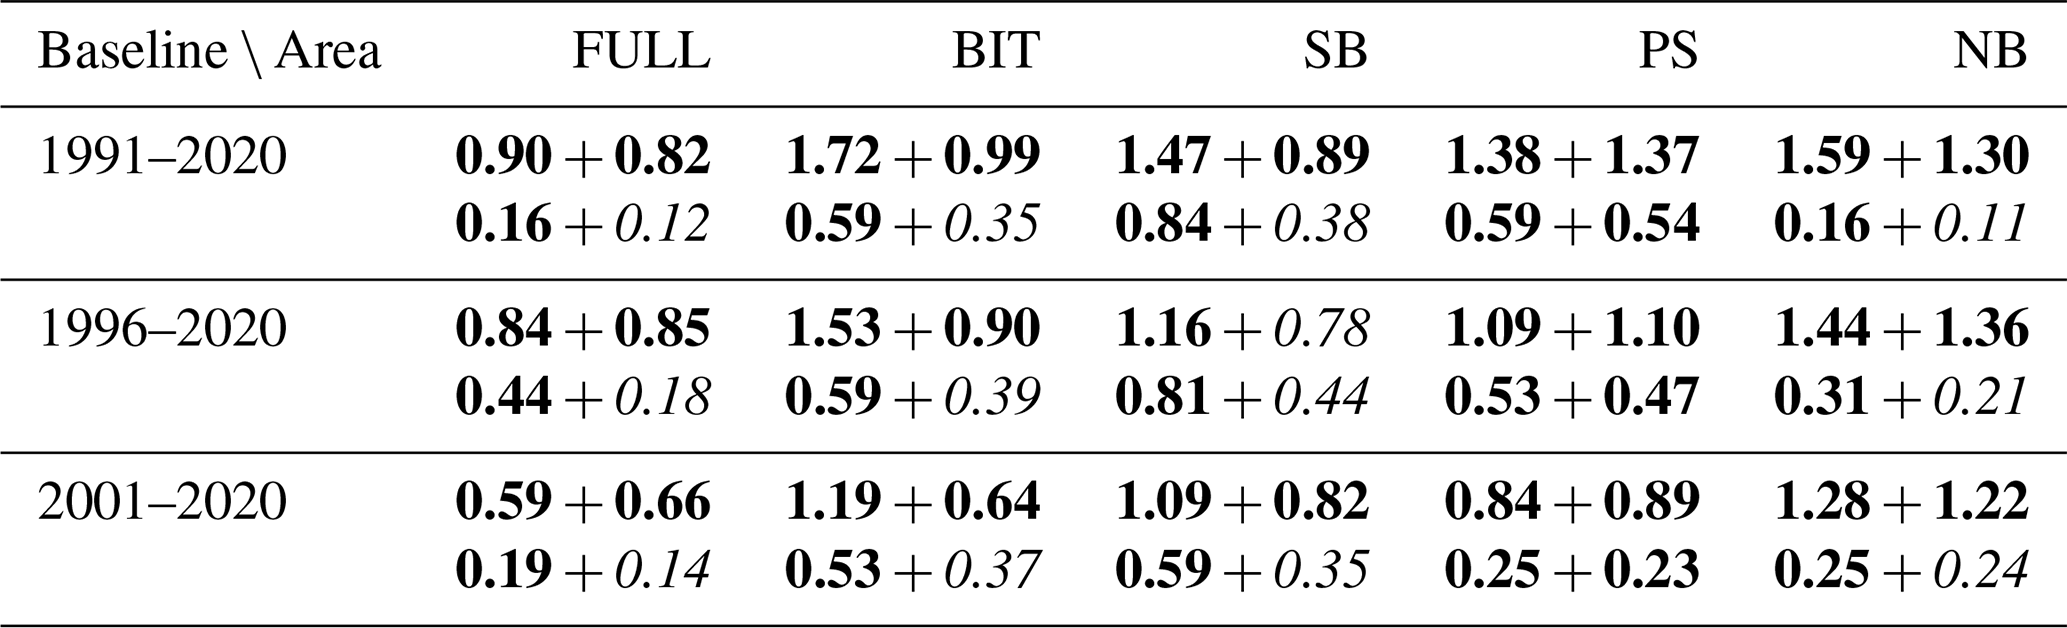
Table 4Same as Table 3 but showing average maximum intensity (in °C).
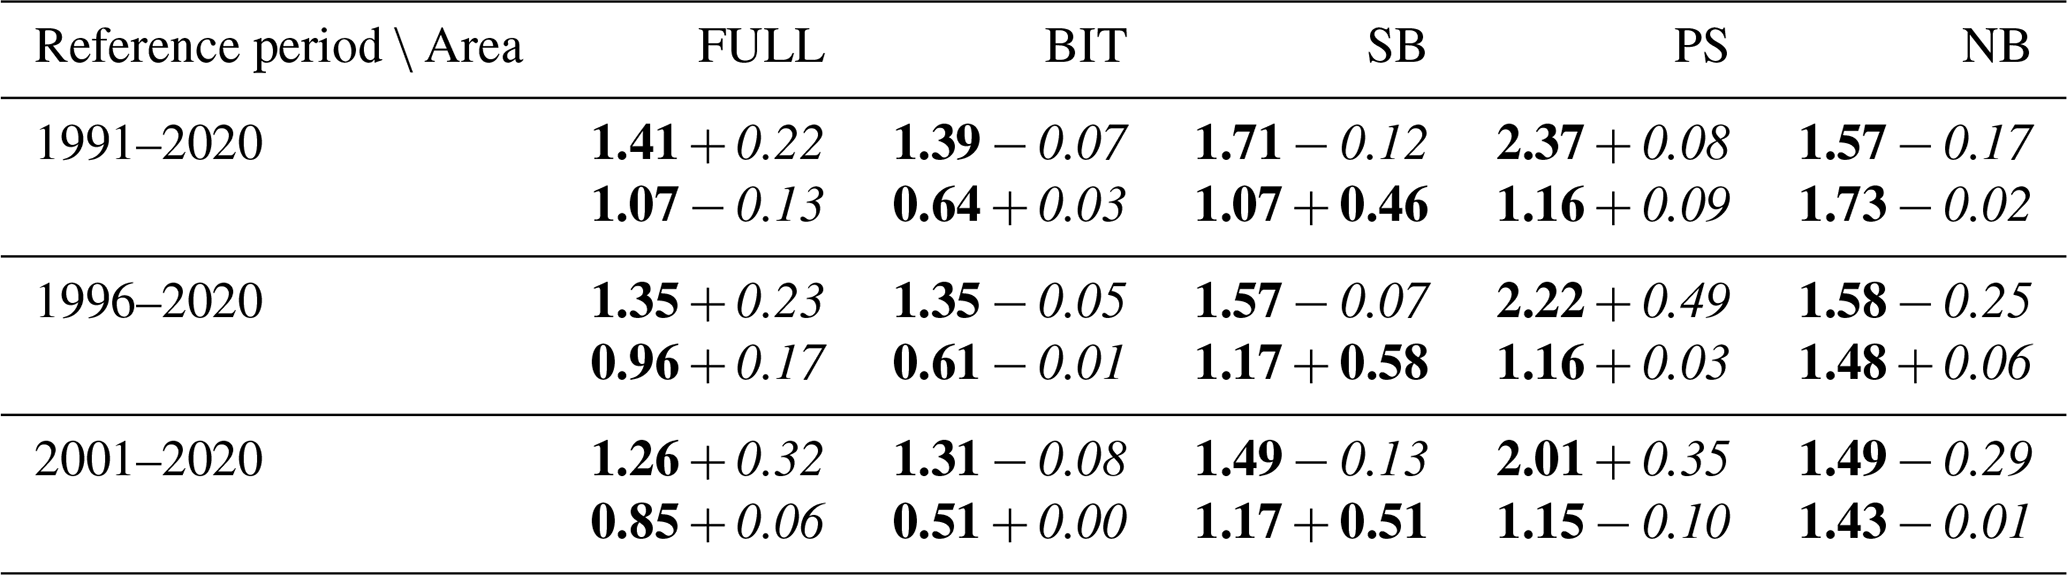
Table 5Same as Table 3 but showing average duration (in days).
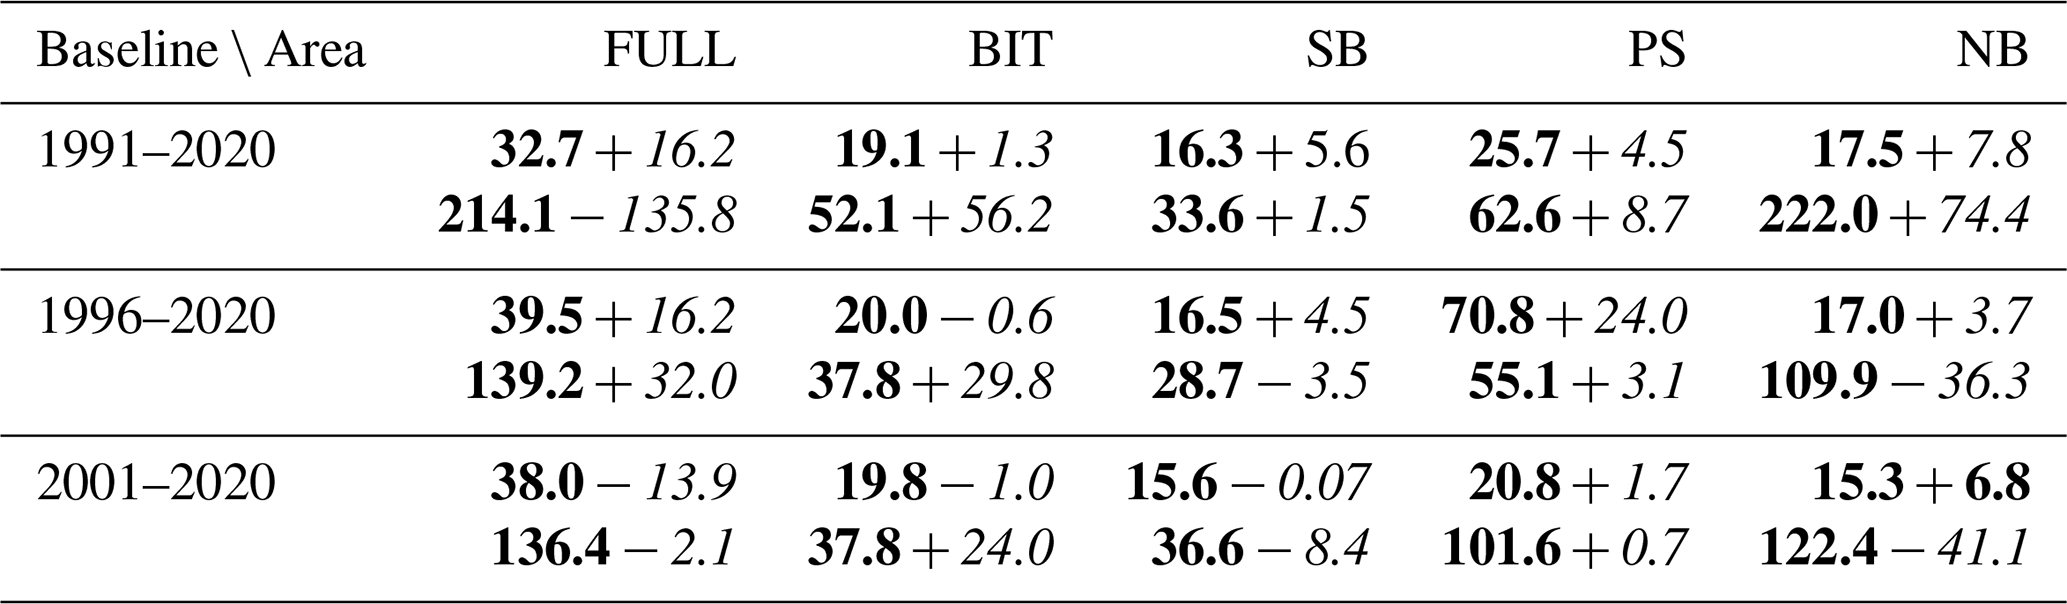
For all regions, including the Barents Sea as a whole, we found that the frequency of surface MHWs decreased with decreasing length of the climatological average period. For near-bottom MHWs, the results were less clear except for a decrease in frequency in the two shallow-bank regions (the Spitsbergen Bank and the Pechora Sea). Similarly, for the intensity at the surface, there was a general trend of decreasing average intensity with decreasing length of the climatological average period. There was also a trend of decreasing intensities near the bottom, except for in the two shallow-bank regions. As opposed to the average frequency and intensity, the average duration seemed less dependent on the length of the climatological average period. Near the bottom, however, the duration was sensitive to the climatological average period length due to the low number of MHWs and the dominance of the 2012 and 2016 MHW events.
We have estimated average MHW frequency, duration, and intensity at the surface and near the bottom of the Barents Sea, based on an ocean reanalysis for the period 1991–2022. Moreover, we have investigated the impact of changing climatological average period length when estimating MHW statistics in the Barents Sea. We found two dominating and pervasive MHW events in the Barents Sea in the last 30 years that affected the whole region.
Previous studies of MHWs, including in the Barents Sea, have mainly focused on the ocean surface due to the availability of satellite remote sensing sea surface temperature data (e.g., Mohamed et al., 2022). Our results also identified significant MHW events near the bottom of the ocean in the Barents Sea and showed that bottom MHWs tend to have lower frequency and intensity but longer duration compared to surface MHWs. Note, however, that these statistics need to be interpreted with care, especially the statistics on near-bottom MHWs, due to the low number of events (five near-bottom MHWs were detected in the Barents Sea during 1991–2022). Among other things, this severely affected the statistical significance of the trend estimates. Nevertheless, the longer duration near the bottom was more pronounced in the eastern parts of the Barents Sea, as represented by the Pechora Sea and the Northeast Basin. One likely explanation is the strong reduction in sea-ice formation in the shallow Pechora Sea in the southeastern Barents Sea and on the Novaya Zemlya Bank adjacent to the Northeast Basin and thus a reduction in the formation of cold, brine-enriched water. The eastern Barents Sea is one of the regions that has experienced the largest changes in sea-ice cover in recent decades (e.g., Yang et al., 2016; Onarheim and Årthun, 2017) and has thus experienced a strong reduction in the formation of cold, brine-enriched bottom water. Midttun (1985) observed very cold and saline water in the deeper parts of the Northeast Basin following cold winters in the 1970s, while Lien and Trofimov (2013) reported no such bottom water following the warmer winter of 2007–08. The occasional presence of such cold bottom water further west in the Barents Sea, adjacent to the Bear Island Trough, has been hypothesized to cause differences in the position of the polar front at the bottom, as detected by bottom-living organisms, compared to higher in the water column based on hydrographic properties in the pelagic zone (Jørgensen et al., 2015). Thus, the transition indicated by bottom MHWs in the eastern Barents Sea may have a profound impact on bottom fauna by allowing boreal species with less resilience to below-zero temperatures to settle.
Previous findings by Mohamed et al. (2022), based on satellite remote sensing sea-surface temperature data, contrasted the Spitsbergen Bank area showing no trend in MHW frequency and duration with the Pechora Sea area showing significant trends in both frequency and duration. Neither of the two regions showed significant trends in MHW intensity. Our findings agree with those of Mohamed et al. (2022) that the Pechora Sea has experienced a positive trend in MHW frequency and not in intensity, but our results showed no significant trend in duration at the surface. Our results indicated that there is also a significant, positive trend in MHW frequency near the bottom of the Pechora Sea (but not in intensity and duration). Moreover, our results showed positive trends in both the MHW frequency and duration on the Spitsbergen Bank (at the surface), although we did not find a statistically significant trend in MHW intensity, but our results indicated a positive trend in the MHW intensity near the bottom on the Spitsbergen Bank. Note, however, that the Spitsbergen Bank is also the area where the TOPAZ reanalysis showed the largest bias and RMS deviation, as well as the lowest correlation, when compared with in situ temperature observations. Thus, we cannot draw firm conclusions whether our results for the Spitsbergen Bank area contradict the findings of Mohamed et al. (2022).
Our findings that the strong 2016 MHW event was preceded by stronger-than-average Atlantic Water inflow and anomalously weaker ocean-to-atmosphere heat loss further suggest that MHWs may become more frequent and severe in terms of intensity and duration in a future Barents Sea with continued increase in oceanic heat advection from the North Atlantic (e.g., Årthun et al., 2019) in combination with reduced ocean-to-atmosphere heat loss within the Barents Sea (e.g., Skagseth et al., 2020).
A list of the data products utilized in this paper, along with their availability and links to their documentation, is provided in Table 1. The MHW analysis toolbox developed by Oliver (2016) was used without adjustments or changes to the settings as provided in the GitHub repository https://github.com/ecjoliver/marineHeatWaves/releases/tag/v0.16 (Oliver, 2016).
The supplement related to this article is available online at: https://doi.org/10.5194/sp-4-osr8-8-2024-supplement.
All authors contributed to the study design. RPR prepared the model data. VSL performed the MHW analysis. SC performed the atmospheric data analysis. All authors contributed to the interpretation and discussion of the results and the writing of the paper.
The contact author has declared that none of the authors has any competing interests.
Publisher’s note: Copernicus Publications remains neutral with regard to jurisdictional claims made in the text, published maps, institutional affiliations, or any other geographical representation in this paper. While Copernicus Publications makes every effort to include appropriate place names, the final responsibility lies with the authors.
This research has been supported by the European Commission, Directorate-General for Maritime Affairs and Fisheries (grant no. 21002L1-COP-MFC ARC-5100).
This paper was edited by Pierre Brasseur and reviewed by two anonymous referees.
Årthun, M., Eldevik, T., and Smedsrud, L. H.: The role of Atlantic heat transport in future Arctic winter sea ice loss, J. Climate, 32, 3327–3341, 2019.
Cheng, L., von Schuckmann, K., Abraham, J. P., Trenberth, K. E., Mann, M. E., Zanna, L., England, M. H., Zika, J. D., Fasullo, J. T., Yu, Y., Pan, Y., Zhu, J., Newsom, E. R., Bronselaer, B., and Lin X.: Past and future ocean warming, Nat. Rev. Earth Environ., 3, 776–794, 2022.
Chiswell, S. M.: Global Trends in Marine Heatwaves and Cold Spells: The Impacts of Fixed Versus Changing Baselines, J. Geophys. Res.-Oceans, 127, e2022JC018757, https://doi.org/10.1029/2022JC018757, 2022.
EU Copernicus Marine Service Product: Arctic Ocean Physics Reanalysis, Mercator Ocean International [data set], https://doi.org/10.48670/moi-00007, 2023.
Fossheim, M., Primicerio, R., Johannesen, E., Ingvaldsen, R. B., Aschan, M. M., and Dolgov, A. V.: Recent warming leads to a rapid borealization of fish communities in the Arctic, Nat. Clim. Change, 5, 673–677, https://doi.org/10.1038/nclimate2647, 2015.
Frölicher, T. L., Fischer, E. M., and Gruber, N.: Marine heatwaves under global warming, Nature, 560, 360–364, https://doi.org/10.1038/s41586-018-0383-9, 2018.
Gammelsrød, T., Leikvin, Ø., Lien, V., Budgell, W. P., Loeng, H., and Maslowski. W.: Mass and Heat transports in the NE Barents Sea: Observations and Models, J. Marine Syst., 75, 56–69, https://doi.org/10.1016/j.jmarsys.2008.07.010, 2009.
Hackett, B., Bertino, L., Alfatih, A., Burud, A., Williams, T., Xie, J., Yumruktepe, C., Wakamatsu, T., and Melsom, A.: EU Copernicus Marine Service Product User Manual for the Arctic Ocean Physics Reanalysis, ARCTIC_MULTIYEAR_PHY_002_003, Issue 5.17, Mercator Ocean International, https://catalogue.marine.copernicus.eu/documents/PUM/CMEMS-ARC-PUM-002-ALL.pdf, (last access: 22 March 2024), 2023.
Hersbach, H., Bell, B., Berrisford, P., Biavati, G., Horányi, A., Muñoz Sabater, J., Nicolas, J., Peubey, C., Radu, R., Rozum, I., Schepers, D., Simmons, A., Soci, C., Dee, D., and Thépaut, J.-N.: ERA5 monthly averaged data on single levels from 1940 to present, Copernicus Climate Change Service (C3S) Climate Data Store (CDS) [data set], https://doi.org/10.24381/cds.f17050d7, 2023.
Hobday, A. J., Alexander, L. V., Perkins, S. E., Smale, D. A., Straub, S. C., Oliver, E. C. J., Benthuysen, J. A., Burrows, M. T., Donat, M. G., Feng, M., Holbrook, N. J., Moore, P. J., Scannell, H. A., Gupta, A. S., and Wernberg, T.: A hierarchical approach to defining marine heatwaves, Progr. Oceanogr., 141, 227–238, 2016.
Hu, S., Zhang, L., and Qian, S.: Marine heatwaves in the Arctic region: Variation in different ice covers, Geophys. Res. Lett., 47, e2020GL089329, https://doi.org/10.1029/2020GL089329, 2020.
Huang, B., Wang, Z., Yin, X., Arguez, A., Graham, G., Liu, C., Smith, T., and Zhang H.-M.: Prolonged Marine Heatwaves in the Arctic: 1982–2020, Geophys. Res. Lett., 48, e2021GL095590, https://doi.org/10.1029/2021GL095590, 2021.
Husson, B., Lind, S., Fossheim, M., Kato-Solvag, H., Skern-Mauritzen, M., Pécuchet, L., Ingvaldsen, R. B., Dolgov, A. V., and Primicerio, R.: Successive extreme climatic events lead to immediate, large-scale, and diverse responses from fish in the Arctic, Glob. Change Biol., 28, 3728–3744, 2022.
ICES: Working Group on the Integrated Assessments of the Barents Sea (WGIBAR), ICES Scientific Reports, 4:50, 235 pp., https://doi.org/10.17895/ices.pub.20051438, 2022.
Jakobsen, T., and Ozhigin, V. K. (Eds.): The Barents Sea – Ecosystem, Resources, Management: Half a century of Russian-Norwegian cooperation, Tapir Academic Press, Trondheim, Norway, 825 pp., ISBN 978-82-519-2545-7, 2011.
Jørgensen, L. L., Ljubin, P., Skjoldal, H. R., Ingvaldsen, R. B., Anisimova, N. and Manushin, I.: Distribution of benthic megafauna in the Barents Sea: baseline for an ecosystem approach to management, ICES J. Mar. Sci., 72, 595–613, https://doi.org/10.1093/icesjms/fsu106, 2015.
Lien, V. S. and Trofimov, A. G.: Formation of Barents Sea Branch Water in the north-eastern Barents Sea, Polar Res., 32, 18905, https://doi.org/10.3402/polar.v32i0.18905, 2013.
Lien, V. S., Hjøllo, S. S., Skogen, M. D., Svendsen, E., Wehde, H., Bertino, L., Counillon, F., Chevallier, M., and Garric, G.: An assessment of the added value from data assimilation on modelled Nordic Seas hydrography and ocean transports, Ocean Modell., 99, 43–59, https://doi.org/10.1016/j.ocemod.2015.12.010, 2016.
Lien, V. S., Schlichtholz, P., Skagseth, Ø., and Vikebø, F. B.: Wind-driven Atlantic water flow as a direct mode for reduced Barents Sea ice cover, J. Climate, 30, 803–812, 2017.
Lind, S., Ingvaldsen, R. B., and Furevik, T.: Arctic warming hotspot in the northern Barents Sea linked to declining sea-ice import, Nat. Clim. Change, 8, 634–639, 2018.
Marbà, N., Jordà, G., Agustí, S., Girard, C., and Duarte, C. M.: Footprints of climate change on Mediterranean Sea biota, Front. Mar. Sci., 2, 56, https://doi.org/10.3389/fmars.2015.00056, 2015.
Midttun, L.: Formation of dense bottom water in the Barents Sea, Deep-Sea Res.-Pt. I, 32, 1233–1241, 1985.
Mohamed, B., Nilsen, F., and Skogseth, R.: Marine Heatwaves Characteristics in the Barents Sea Based on High Resolution Satellite Data (1982–2020), Front. Mar. Sci., 9, 821646, https://doi.org/10.3389/fmars.2022.821646, 2022.
Oliver, E. C. J.: marineHeatWaves v0.16, GitHub [code], https://github.com/ecjoliver/marineHeatWaves/releases/tag/v0.16 (last access: 24 March 2023), 2016.
Oliver, E. C. J., Benthuysen, J. A., Darmaraki, S., Donat, M. G., Hobday, A. J., Holbrook, N. J., Schlegel, R. W., and Gupta, A. S.: Marine heatwaves, Annu. Rev. Mar. Sci., 13, 313–342, https://doi.org/10.1146/annurev-marine-032720-095144, 2021.
Onarheim, I. H., Eldevik, T., Årthun, M., Ingvaldsen, R. B., and Smedsrud, L. H.: Skillful prediction of Barents Sea ice cover, Geophys. Res. Lett., 42, 5364–5371, 2015.
Onarheim, I. H. and Årthun, M.: Toward an ice-free Barents Sea, Geophys. Res. Lett., 44, 8387–8395, https://doi.org/10.1002/2017GL074304, 2017.
Oziel, L., Baudena, A., Ardyna, M., Massicotte, P., Randelhoff, A., Sallee, J.-B., Ingvaldsen, R. B., Devred, E., and Babin, M.: Faster Atlantic currents drive poleward expansion of temperate phytoplankton in the Arctic Ocean, Nat. Commun., 11, 1705, https://doi.org/10.1038/s41467-020-15485-5, 2020.
Sakov, P., Counillon, F., Bertino, L., Lisæter, K. A., Oke, P. R., and Korablev, A.: TOPAZ4: an ocean-sea ice data assimilation system for the North Atlantic and Arctic, Ocean Sci., 8, 633–656, https://doi.org/10.5194/os-8-633-2012, 2012.
Scannell, H. A., Pershing, A. J., Alexander, M. A., Thomas, A. C., and Mills, K. E.: Frequency of marine heatwaves in the north Atlantic and north Pacific since 1950, Geophys. Res. Lett., 43, 2069–2076, https://doi.org/10.1002/2015GL067308, 2016.
Schlichtholz, P.: Subsurface ocean flywheel of coupled climate variability in the Barents Sea hotspot of global warming, Sci. Reports, 9, 13692, https://doi.org/10.1038/s41598-019-49965-6, 2019.
Skagseth, Ø., Furevik, T., Ingvaldsen, R., Loeng, H., Mork, K. A., Orvik, K. A., and Ozhigin, V.: Volume and Heat Transports to the Arctic Ocean via the Norwegian and Barents Seas, in: Arctic Subarctic ocean fluxes: Defining the Role of the Northern Seas in Climate, edited by: Dickson, R., Meincke, J., and Rhines, P., Springer, New York, 45–64, ISBN 978-1-4020-6773-0, 2008.
Skagseth, Ø., Eldevik, T., Årthun, M., Asbjørnsen, H., Lien, V. S., and Smedsrud, L. H.: Reduced efficiency of the Barents Sea cooling machine, Nat. Clim. Change, 10, 661–666, https://doi.org/10.1038/s41558-020-0772-6, 2020.
Smale, D. A., Wernberg, T., Oliver, E. C. J., Thomsen, M., Harvey, B. P., Straub, S. C., Burrows, M. T., Alexander, L. V., Benthuysen, J. A., Donat, M. G., Feng, M., Hobday, A. J., Holbrook, N. J., Perkins-Kirkpatrick, S. E., Scannell, H. A., Gupta, A. S., Payne, B. L., and Moore, P. J.: Marine heatwaves threaten global biodiversity and the provision of ecosystem services, Nat. Clim. Change, 9, 306–312, https://doi.org/10.1038/s41558-019-0412-1, 2019.
Smedsrud, L. H., Esau, I., Ingvaldsen, R. B., Eldevik, T., Haugan, P. M., Li, C., Lien, V. S., Olsen, A., Omar, A. M., Otterå, O. H., Risebrobakken, B., Sandø, A. B., Semenov, V. A., and Sorokina, S. A.: The role of the Barents Sea in the climate system, Rev. Geophys., 51, 415–449, 2013.
Smedsrud, L. H., Muilwijk, M., Brakstad, A., Madonna, E., Lauvset, S. K., Spensberger, C., Born, A., Eldevik, T., Drange, H., Jeansson, E., Li, C., Olsen, A., Skagseth, Ø., Slater, D. A., Straneo, F., Våge, K., and Årthun, M.: Nordic Seas heat loss, Atlantic inflow, and Arctic sea ice cover over the last century, Rev. Geophys., 60, e2020RG000725, https://doi.org/10.1029/2020RG000725, 2022.
Smith, K. E., Burrows, M. T., Hobday, A. J., Sen Gupta, A., Moore, P. J., Thomsen, M., Wernberg, R., and Smale, D. A.: Socioeconomic impacts of marine heatwaves: Global issues and opportunities, Science, 374, eabj3593, https://doi.org/10.1126/science.abj3593, 2021.
WMO: The Role of Climatological Normals in a Changing Climate (WMO/TD-No. 1377), Geneva, https://library.wmo.int/idurl/4/52499 (last access: June 2023), 2007.
WMO: Seventeenth World Meteorological Congress (WMO-No. 1157), Geneva, ISBN 978-92-63-11157-9, https://library.wmo.int/idurl/4/54771 (last access: June 2023), 2015.
Xie, J. and Bertino, L.: EU Copernicus Marine Service Quality Information Document for the Arctic Ocean Physics Reanalysis, ARCTIC_MULTIYEAR_PHY_002_003, Issue 1.3, Mercator Ocean International, https://catalogue.marine.copernicus.eu/documents/QUID/CMEMS-ARC-QUID-002-003.pdf, (last access: 22 March 2024), 2023.
Xie, J., Counillon, F., Bertino, L., Tian-Kunze, X., and Kaleschke, L.: Benefits of assimilating thin sea ice thickness from SMOS into the TOPAZ system, The Cryosphere, 10, 2745–2761, https://doi.org/10.5194/tc-10-2745-2016, 2016.
Xie, J., Raj, R. P., Bertino, L., Samuelsen, A., and Wakamatsu, T.: Evaluation of Arctic Ocean surface salinities from the Soil Moisture and Ocean Salinity (SMOS) mission against a regional reanalysis and in situ data, Ocean Sci., 15, 1191–1206, https://doi.org/10.5194/os-15-1191-2019, 2019.
Xie, J., Raj, R. P., Bertino, L., Martínez, J., Gabarró, C., and Catany, R.: Assimilation of sea surface salinities from SMOS in an Arctic coupled ocean and sea ice reanalysis, Ocean Sci., 19, 269–287, https://doi.org/10.5194/os-19-269-2023, 2023.
Yang, X.-Y., Yuan, X., and Ting, M.: Dynamical link between the Barents-Kara sea ice and the Arctic Oscillation, J. Climate, 29, 5103–5122, https://doi.org/10.1175/JCLI-D-15-0669.1, 2016.