the Creative Commons Attribution 4.0 License.
the Creative Commons Attribution 4.0 License.
 | 30 Sep 2024 | OSR8 | Chapter 4.5
Characterization of marine heat waves in the Iberia–Biscay–Ireland (IBI) region in 2022
Lluís Castrillo-Acuña
Axel Alonso-Valle
Álvaro de Pascual-Collar
Marine heat waves (MHWs) are defined as prolonged periods of anomalously high sea surface temperatures. These events have a profound impact on marine ecosystems, resulting in ecological and economic impacts such as coral bleaching, reduced surface chlorophyll due to increased surface layer stratification, mass mortality of marine invertebrates due to heat stress, rapid species migrations, and fishery closures or quota changes, among others.
This research focuses on the study of the MHWs that occurred in the IBI (Iberia–Biscay–Ireland) region during the year 2022, assessing their climatologic properties, analyzing the mean values for the year 2022, and discretizing the events in four subregions representative of the entire domain. Satellite-derived sea surface temperature data were used to detect and characterize the events, revealing that in some areas the year 2022 showed peak anomaly values of (i) 15 MHW events, (ii) 128 d of mean durations, and (iii) 261 total days of MHWs. Through observational and modeling data, the discrete events located in the Bay of Biscay were also examined in the subsurface layers, demonstrating a strong seasonal modulation and heat diffusion through deeper layers, where cold-season events reach higher MHW mean depth values and subsurface positive anomalies of temperature can remain for weeks once an MHW has ended.
- Article
(5259 KB) - Full-text XML
- BibTeX
- EndNote


Marine heat waves (MHWs) are a physical process which results in extreme temperatures, at least, on the ocean surface. As they are known to be related to multiple drastic alterations in marine ecosystems and services (Holbrook et al., 2020; Smale et al., 2019), and due to the recently observed ocean surface warming of 0.88 °C in the last decade (Lee et al., 2023), which is also related to an increase in the MHW frequency and the intensity of the events, the scientific community has shown a growing interest in this topic (Hobday et al., 2018).
In this contribution, an analysis of the MHWs in the IBI (Iberia–Biscay–Ireland) domain during the year 2022 is performed. The IBI region is one of the areas handled by the Monitoring and Forecasting Centers of the Copernicus Marine Service, located in the northeastern Atlantic Ocean between the Canary Archipelago in the south and Great Britain and Ireland in the north (Fig. 1). This region clusters multiple dynamical systems, such as upwelling areas, open waters, straits, and bays, and it is hence a region characterized by a remarkable range of physical processes at various spatial and temporal scales (Sotillo et al., 2015).
Table 1List of Copernicus Marine products used for the computation of marine heat waves (MHWs) in Iberia–Biscay–Ireland (IBI) region.
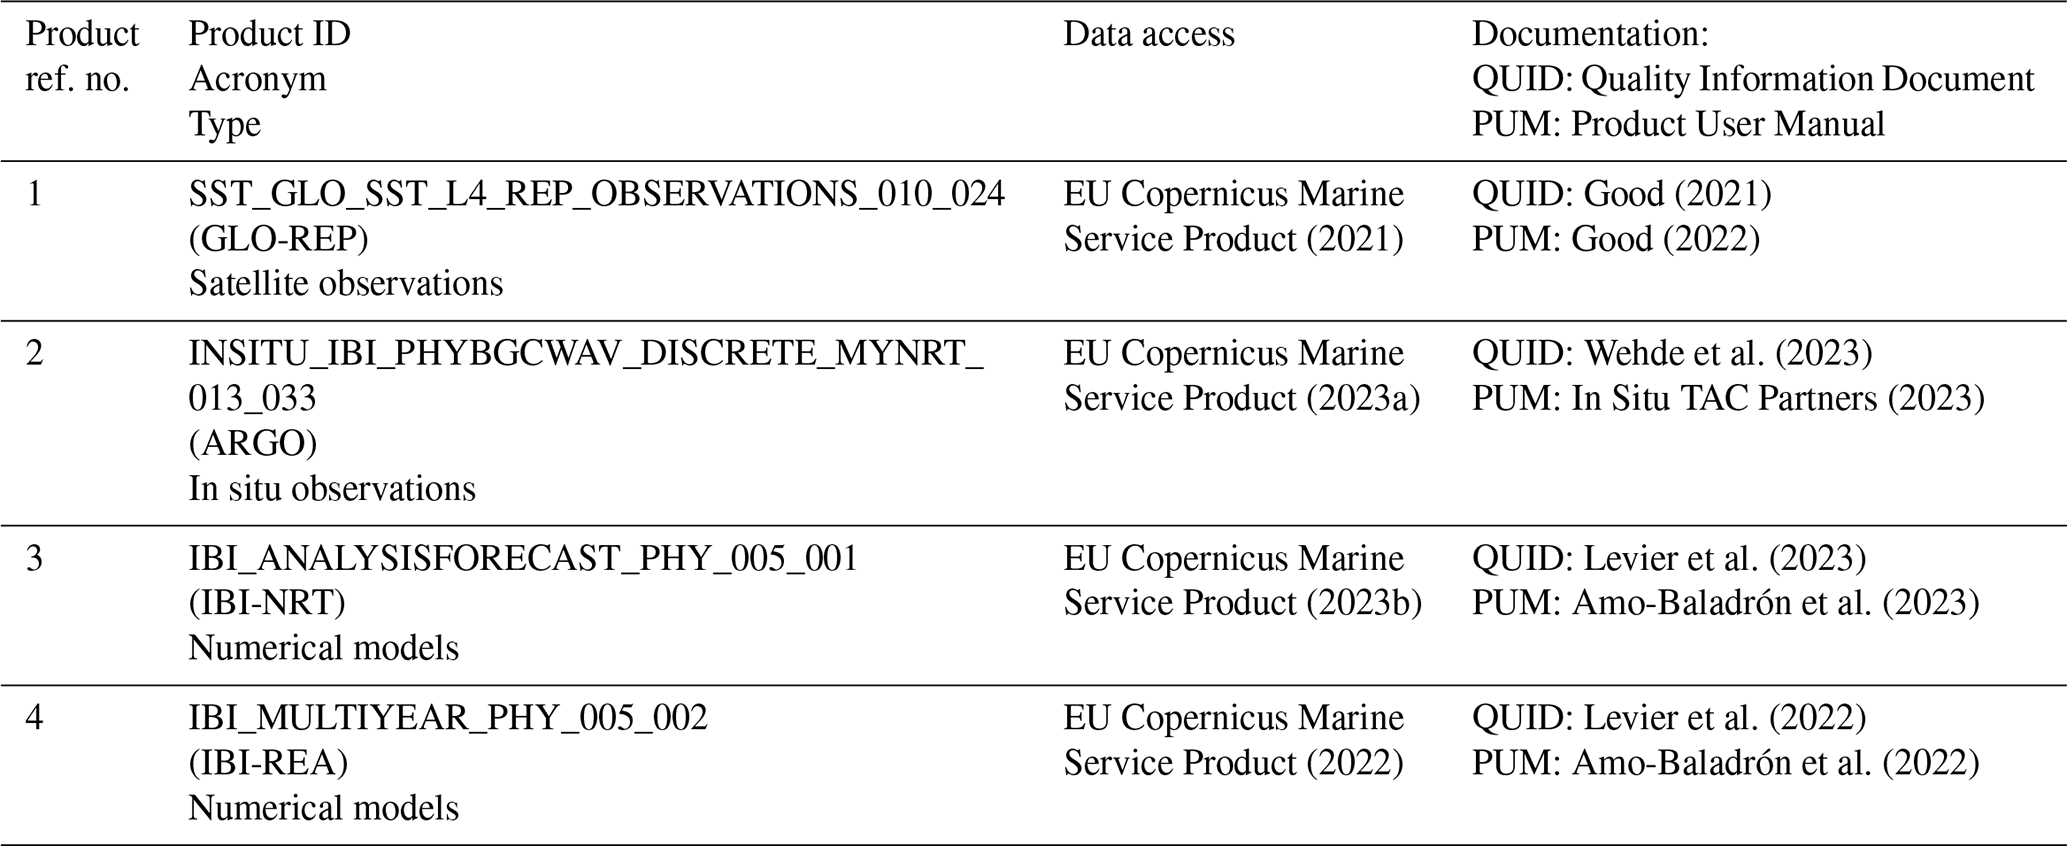
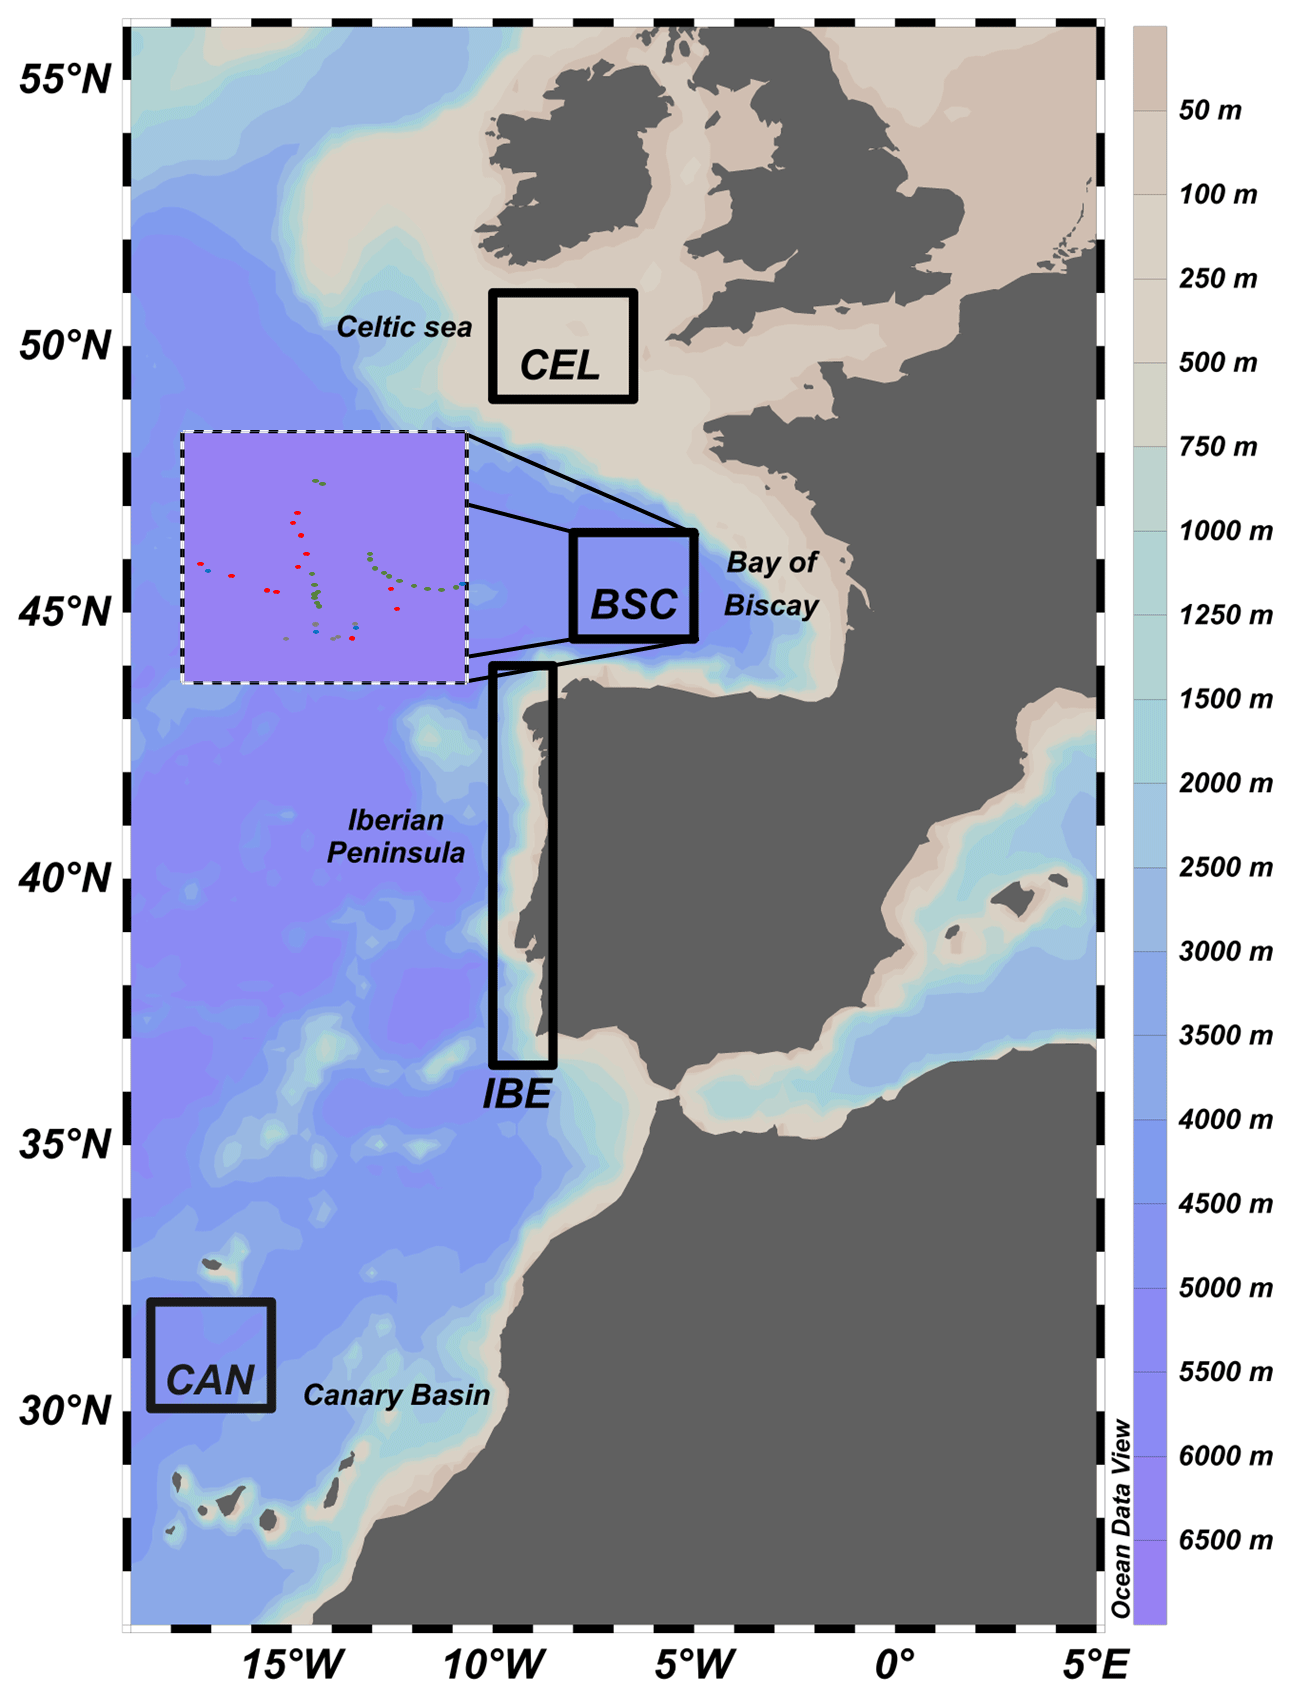
Figure 1Study area with bathymetry from 19° W to 5° E of longitude and 25 to 59° N of latitude. Black boxes with acronyms represent the areas in which we discretize the MHW events of 2022 by spatial averaging of SST; areas are the Canary Basin (CAN) (18.5–15° W, 30–32° N), the Iberian Peninsula (IBE) (10–8.5° W, 36.5–44° N), the Bay of Biscay (BSC) (8–5° W, 44.5–46.5° N), and the Celtic Sea (CEL) (10–6.5° W, 49–51° N). For the BSC area, the position of the ARGO profiles is shown with points in different colors. This map has been obtained through Ocean Data View v.5.6.3. (Schlitzer, 2021).
To detect and analyze MHWs, the standard method of Hobday et al. (2016) is used, defining an MHW as a discrete event that lasts for at least 5 consecutive days exhibiting temperatures warmer than the 90th percentile of the climatological distribution. This method has been widely used, and hence an important number of comparable MHW studies around the world have been published. Unfortunately, there is an unsolved issue regarding the Hobday et al. (2016) method: how to deal with sea surface temperature (SST) trends and MHW detection. Different authors have assessed this issue, but a consensus has not been reached yet. It is demonstrated that long-term trends influence the MHW results; for example, the global assessment of Oliver et al. (2018) shows that just the SST trend may explain the MHW trends in 80 %, 59 %, and 53 % of the ocean surface for the frequency, intensity, and duration, respectively. Also, through the use of synthetic SST time series and sensitivity experiments, Schlegel et al. (2019) demonstrated that SST long-term linear trends can have a much greater effect on the trend of MHW properties than the length of the series or even the presence of missing data. So, the underlying issue is about considering the long-term mean modulation to be part of the MHW process (not detrending) or consider the MHW just looking into the modulation of the extreme values independent of the evolution of mean ones (detrending).
Considering the results of the recent MHW global assessments, it is expected for such events to increase in frequency and duration during the next years in most parts of the world (Oliver et al., 2018; Yao et al., 2022; Collins et al., 2019; Fox-Kemper et al., 2021). These predictions also include the IBI domain, a region characterized by Yao et al. (2022) as presenting MHWs with an intensity mean close to 1 °C and approximately 15 to 30 MHW days per year from 1982 to 2020. A wide range of physical processes can be pointed out as drivers of the occurrence of MHWs depending on the subregions assessed. Specifically, our study area covers the Canary Basin, the Iberian Peninsula, the Bay of Biscay, and the Celtic Sea (Fig. 1).
Canary and Iberian MHWs are mostly linked to processes of atmospheric blocking, the negative phase of the North Atlantic Oscillation (NAO), the regional air–sea coupling, the regional changes in wave stress and the jet stream position, local advective processes, and air–sea heat fluxes (Holbrook et al., 2019; Varela et al., 2021). In a rare instance, the influence of ENSO has also been observed in a record-breaking event recorded in the area (Hu et al., 2011).
In the case of the Bay of Biscay and the Celtic Sea the main interannual drivers of MHWs are the NAO and the East Atlantic pattern (EA) (Izquierdo et al., 2022; Simon et al., 2023), while other processes such as the inflow from the English Channel and the strength of the tidal currents also play a key role in the regional changes in the SST (Cornes et al., 2023).
In this research we aim to characterize the year 2022 regarding the MHWs in the IBI domain, considering not only the annual mean values but also the 2022 discrete events in four different subregions representative of the domain. Also, we shed light on the first steps of learning how MHWs behave under the surface by using Copernicus products.
In the present work several Copernicus Marine products (described in Table 1) have been used to provide a description of the MHWs which occurred in the IBI region during the year 2022. The diversity of products used is due to our leverage of their different strengths in the detection and description of MHWs.
2.1 Data
To detect the MHW events, we used the ESA SST CCI and C3S global Sea Surface Temperature Reprocessed product (GLO-REP, Table 1, product ref. 1), which is a homogenous level 4 analysis. This dataset provides daily gridded gap-free SST data from 1 September 1981 at 0.05° × 0.05° of spatial resolution. The input data of the system derive from three different satellite sensors, the ATSRs, the SLSTR, and the AVHRR (Merchant et al., 2019), and are processed through the Operational Sea Surface Temperature and Sea Ice Analysis (OSTIA) system developed by the UK's Met Office (Good et al., 2020). The availability of gridded data for this product has enabled (i) the generation of a reference climatology and seasonal threshold to detect MHWs and (ii) the compilation of a catalogue of MHWs that impacted the study area during 2022.
Once a specific event was located in space and time, we observed how some of these events behaved under the surface. To achieve this goal, we used seawater temperature data from the ocean surface down to 350 m of depth from both in situ observations and numerical models. Thus, we examined specific events with in situ data and also estimated their development during all the MHW days through numerical modeling data, which have no spatial or temporal limitations.
ARGO is the collective name of a global array of 3000 automated free-drifting profiling floats that measure seawater temperature and salinity in the upper ocean as well as, in some cases, bio-geo parameters such as oxygen or chlorophyll concentration. All collected data are freely available from the international ARGO project and the national programs that contribute to it (ARGO, 2019). The specific Copernicus Marine Environment Monitoring Service (CMEMS) product that we used is the Atlantic–Iberian Biscay–Irish Ocean in situ near-real-time observations (hereafter the ARGO product, Table 1, product ref. 2), which compiles level 2 processed in situ near-real-time data from ARGO floats and other observational sources in the IBI region since 1 January 1990 to the current day. They are hourly-updated and distributed by the Copernicus Marine In Situ Thematic Assembly Centre (In Situ TAC) within 24–48 h of acquisition. The ARGO observations consist of instantaneous values, quality-controlled and irregularly distributed in time and space as a result of the diverse modes of operation, problems with the sensors, and drifting movement of the buoys.
With the aim of acquiring data that allow a more detailed study at a regular daily scale, two three-dimensional, gridded, and gap-free CMEMS datasets from numerical models have also been used, both run and provided by the IBI Monitoring and Forecasting Center. The first one is the Atlantic–Iberian–Biscay–Irish Ocean Physics Analysis and Forecast (IBI-NRT, Table 1, product ref. 3), a product with a spatial resolution of 0.028° × 0.028° and 50 depth levels down to 5728 m. It provides best estimates with level 4 processing of different physical variables for the last 2 years, as well as a forecast with a 5 d horizon, updated daily. Secondly, we used the Atlantic–Iberian–Biscay–Irish Ocean Physics Reanalysis (IBI-REA, Table 1, product ref. 4), which extends from 1 January 1993 to 28 December 2021. It has a spatial resolution of 0.083° × 0.083° with the same vertical levels as IBI-NRT and a time resolution that ranges from hourly to yearly. Observational data assimilated for the reanalysis include altimeter measurements, in situ temperature and salinity vertical profiles, and satellite sea surface temperature. For the purposes of this study, we extracted daily averaged values of potential temperature (θ) in the water column from 2005 to 2021 for IBI-REA and the year 2022 for IBI-NRT. Thereby, we obtained a dataset to use as a mean reference (IBI-REA) and another one to assess the year 2022 (IBI-NRT) deep inside the ocean.
2.2 Methods
2.2.1 Surface MHW assessment
The study and detection of the MHWs were accomplished through the standard definition of Hobday et al. (2016) applied to the GLO-REP product from January 1982 to December 2022. We chose the usual parameters in order to obtain results comparable to those of similar studies on this topic: a minimum duration of 5 d to consider an MHW, a maximum gap tolerance of 2 d between two events, a threshold calculated through the 90th percentile, and a climatology and threshold computed for the whole period smoothed out using a moving window of 31 d. The reference period for the climatology corresponds to the entire time series in order to use all the possible values to compute the mean without arbitrary selections.
Among the set of parameters available to characterize the MHW we selected the ones that we understand as fundamental to evaluate the state of MHWs in the IBI domain during 2022: the frequency of the events, the duration, the maximum intensity point relative to the climatology and the absolute value, and the cumulative intensity, which can be assessed as the total energy of an event.
Regarding the possible presence of linear trends in SST, in this research we did not apply any kind of trend assessment or detrending method due to the lack of any standard procedure.
For a deeper analysis of MHWs in the region, we defined four subregions to be representative of the different oceanographic systems in our study area and performed a spatial average to assess them. According to this criterion, the selected subregions were the continental shelf near the British Islands and English Channel (CEL), the offshore region of the Gulf of Biscay (BSC), the upwelling region next to the coast of the Iberian Peninsula (IBE), and the Azores and Canary Islands Basin (CAN) (Fig. 1). In this manner, we were able to analyze the discrete events in 2022 and the record-breaking ones for all the years as a reference for each sub-domain.
2.2.2 Subsurface MHW assessment
The ARGO float network is used to assess specific events from the ocean surface down to a maximum depth of 350 m. With the aim of computing a temperature anomaly or deviation profile which represents a single event, we first converted pressure into depth by using the UNESCO formula (Fofonoff and Millard, 1993) and interpolated them to a common depth scale, which in our case consisted of vertical steps of 0.5 m. The mean MHW profile is then calculated as the mean temperature value at each depth level of all the available data that concur in time and space with the event recorded by the GLO-REP dataset. The reference profile is the mean temperature value at each depth level of all the ARGO observations which agree in space and time for the year with each MHW singled out in 2022. Lastly, the deviation or anomaly profile is computed as the mean MHW profile minus the reference one for each event. The uncertainty for the deviation profile has been computed through a bootstrap procedure at 95 % confidence, iterating through the mean values of the MHW and reference profiles. Also, the Elzahaby and Schaeffer (2019) method allowed us to compute the mean depth of an MHW according to a threshold calculated through the accumulated positive anomaly along the vertical dimension. The threshold modulation depends on some parameterization, which in our case was chosen arbitrarily as the same that was used by the authors in order to acquire comparable results.
To obtain robust results according to the available data, we decided to focus on the BSC subregion (Fig. 1), given that this area contained a substantial number of ARGO profiles and MHWs during the year 2022. However, data limitations arose which implied that the long-term reference profiles were not consistent among the events, with the year of the first profile varying between 2004 and 2006 and the year of the last one between 2019 and 2021. We also had to deal with some data issues regarding fragmentation and low reliability. In this research, we discarded profiles that were too fragmented and the specific values that were not labeled as completely reliable by In Situ TAC.
To analyze the subsurface daily evolution of specific MHWs we used a Hovmöller diagram of daily mean θ anomalies. This methodology demands a dataset with regular data in time and space that is long enough to get a representative long-term reference. We achieved these requirements by using the IBI-REA from 2005 to 2021 and the IBI-NRT for 2022, calibrated as an elongation of the IBI-REA product. The calibration procedure consisted of (i) selecting the common period for both datasets (May to December 2021) for the first 100 m, (ii) averaging the IBI-NRT and IBI-REA θ values horizontally across the entire BSC region and interpolating both datasets to a common vertical grid of 0.5 m, (iii) computing the linear regression parameters of IBI-NRT to predict IBI-REA trough the ordinary least squares method (Chatterjee and Simonoff, 2020), concluding in β=0.9767, α=0.3298, R2=0.990, and significant F statistic, and (iv) correcting 2022 IBI-NRT with the regression parameters to compute the anomalies.
3.1 MHW characterization
The analysis of the 40-year SST time series (Fig. 2) showed that the MHWs in the IBI domain during this period took place from 1 to 2.5 times per year, concurring with the results of Oliver et al. (2018). The annual total days take annual mean values close to 30 d, a few more days per year than the estimations of Yao et al. (2022). As shown in Fig. 2, the frequency and the annual total days do not show any clear climatological zonation over the IBI domain, while for the case of the maximum intensity, it shows a clear increment near the coastal areas reaching values of 4 °C relative to the climatology; in relation to the duration, the maximum values of 30 d are located near the English Channel. The presence of abnormal values is also remarkable in some waters of England and Ireland, for instance the Humber estuary (0° E, 57° N), which in small areas showed mean values of five MHW events per year. This is probably due to its semi-enclosed waters, which have multiple biologically, chemically, and physically distinctive features (Elliott and Whitfield, 2011).
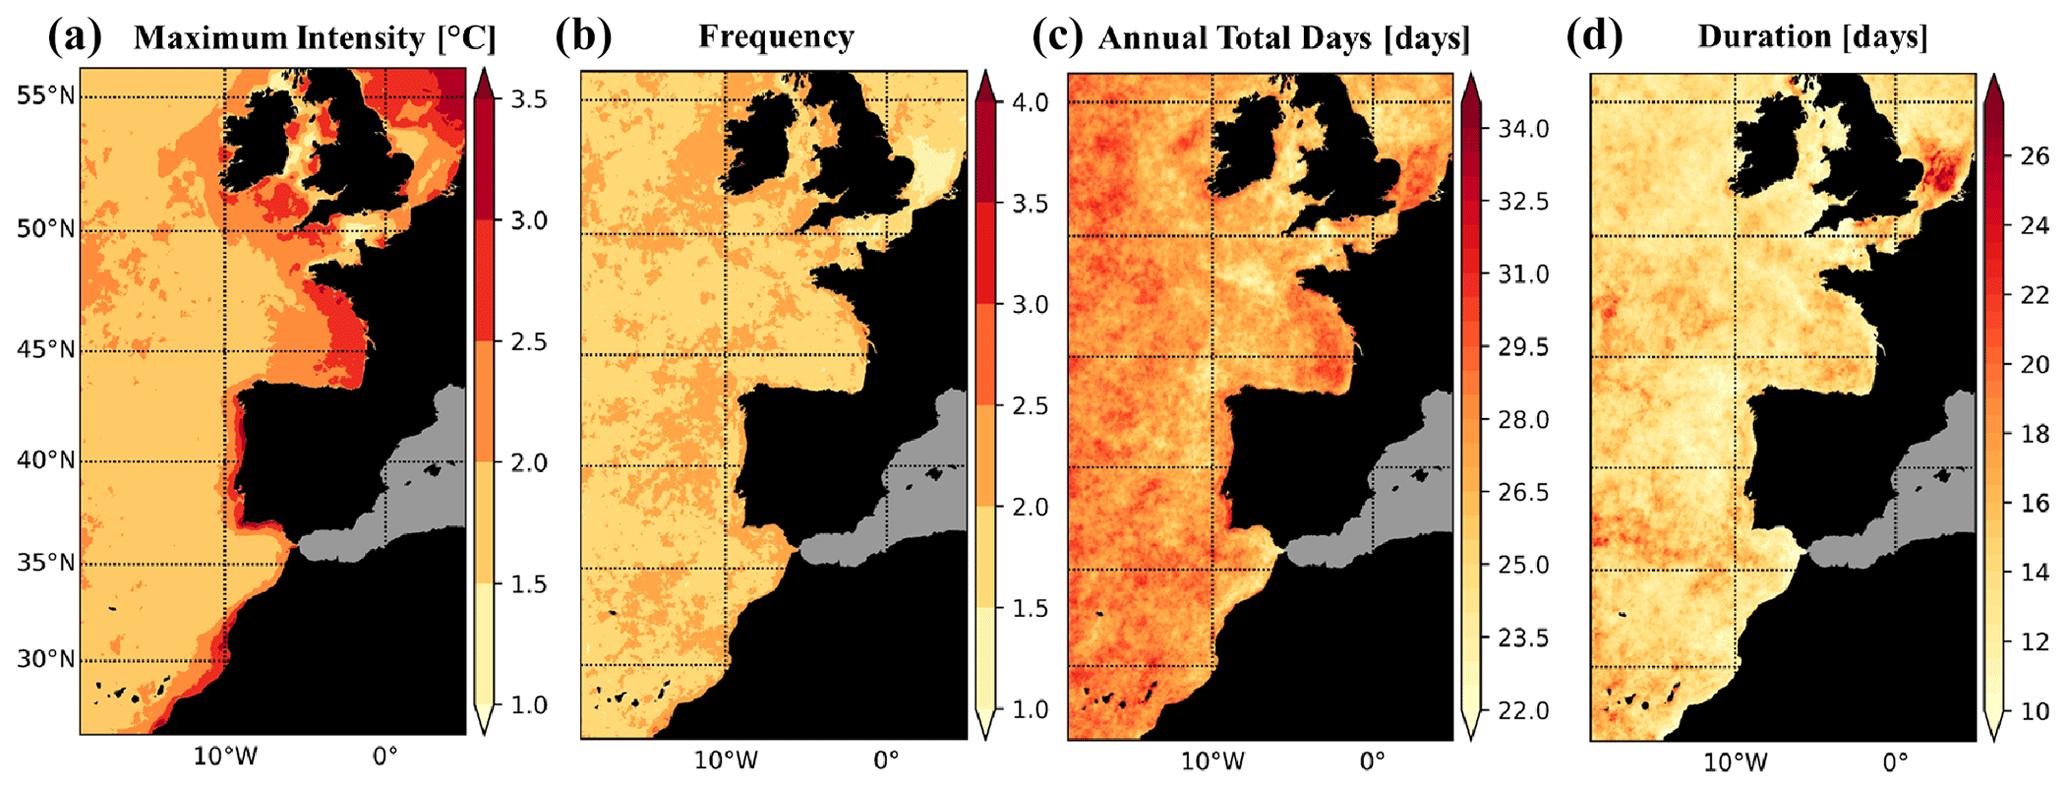
Figure 2Climatologic values of (a) maximum intensity, (b) frequency, (c) annual total days, and (d) duration for all the recorded events through the GLO-REP dataset from January 1982 to December 2022.
The annual mean properties from January to December 2022 indicate that the MHWs during this period were unusual (Fig. 3). Severe positive anomalies of frequency and total annual days are found in almost all the IBI region, especially in proximity to the Celtic Sea and the English Channel, reaching peak anomaly values of 15 events and 261 d of MHWs. Regarding the duration, it stands out for having locations with positive anomalies of 128 d and multiple areas with negative anomalies. As a generalization in the IBI domain, it seems that near the coast, there were more events but shorter than normal. The maximum intensity parameter is the only one with equivalent positive and negative anomaly values in a range from −3 to 3 °C. The area around 18° W, 37° N shows peak negative anomaly values for the maximum intensity, but this “low-activity area” is also appreciable for the rest of the studied parameters (Figs. 2 and 3). It is an interesting feature, but we do not find an explanation in our results or in the literature.
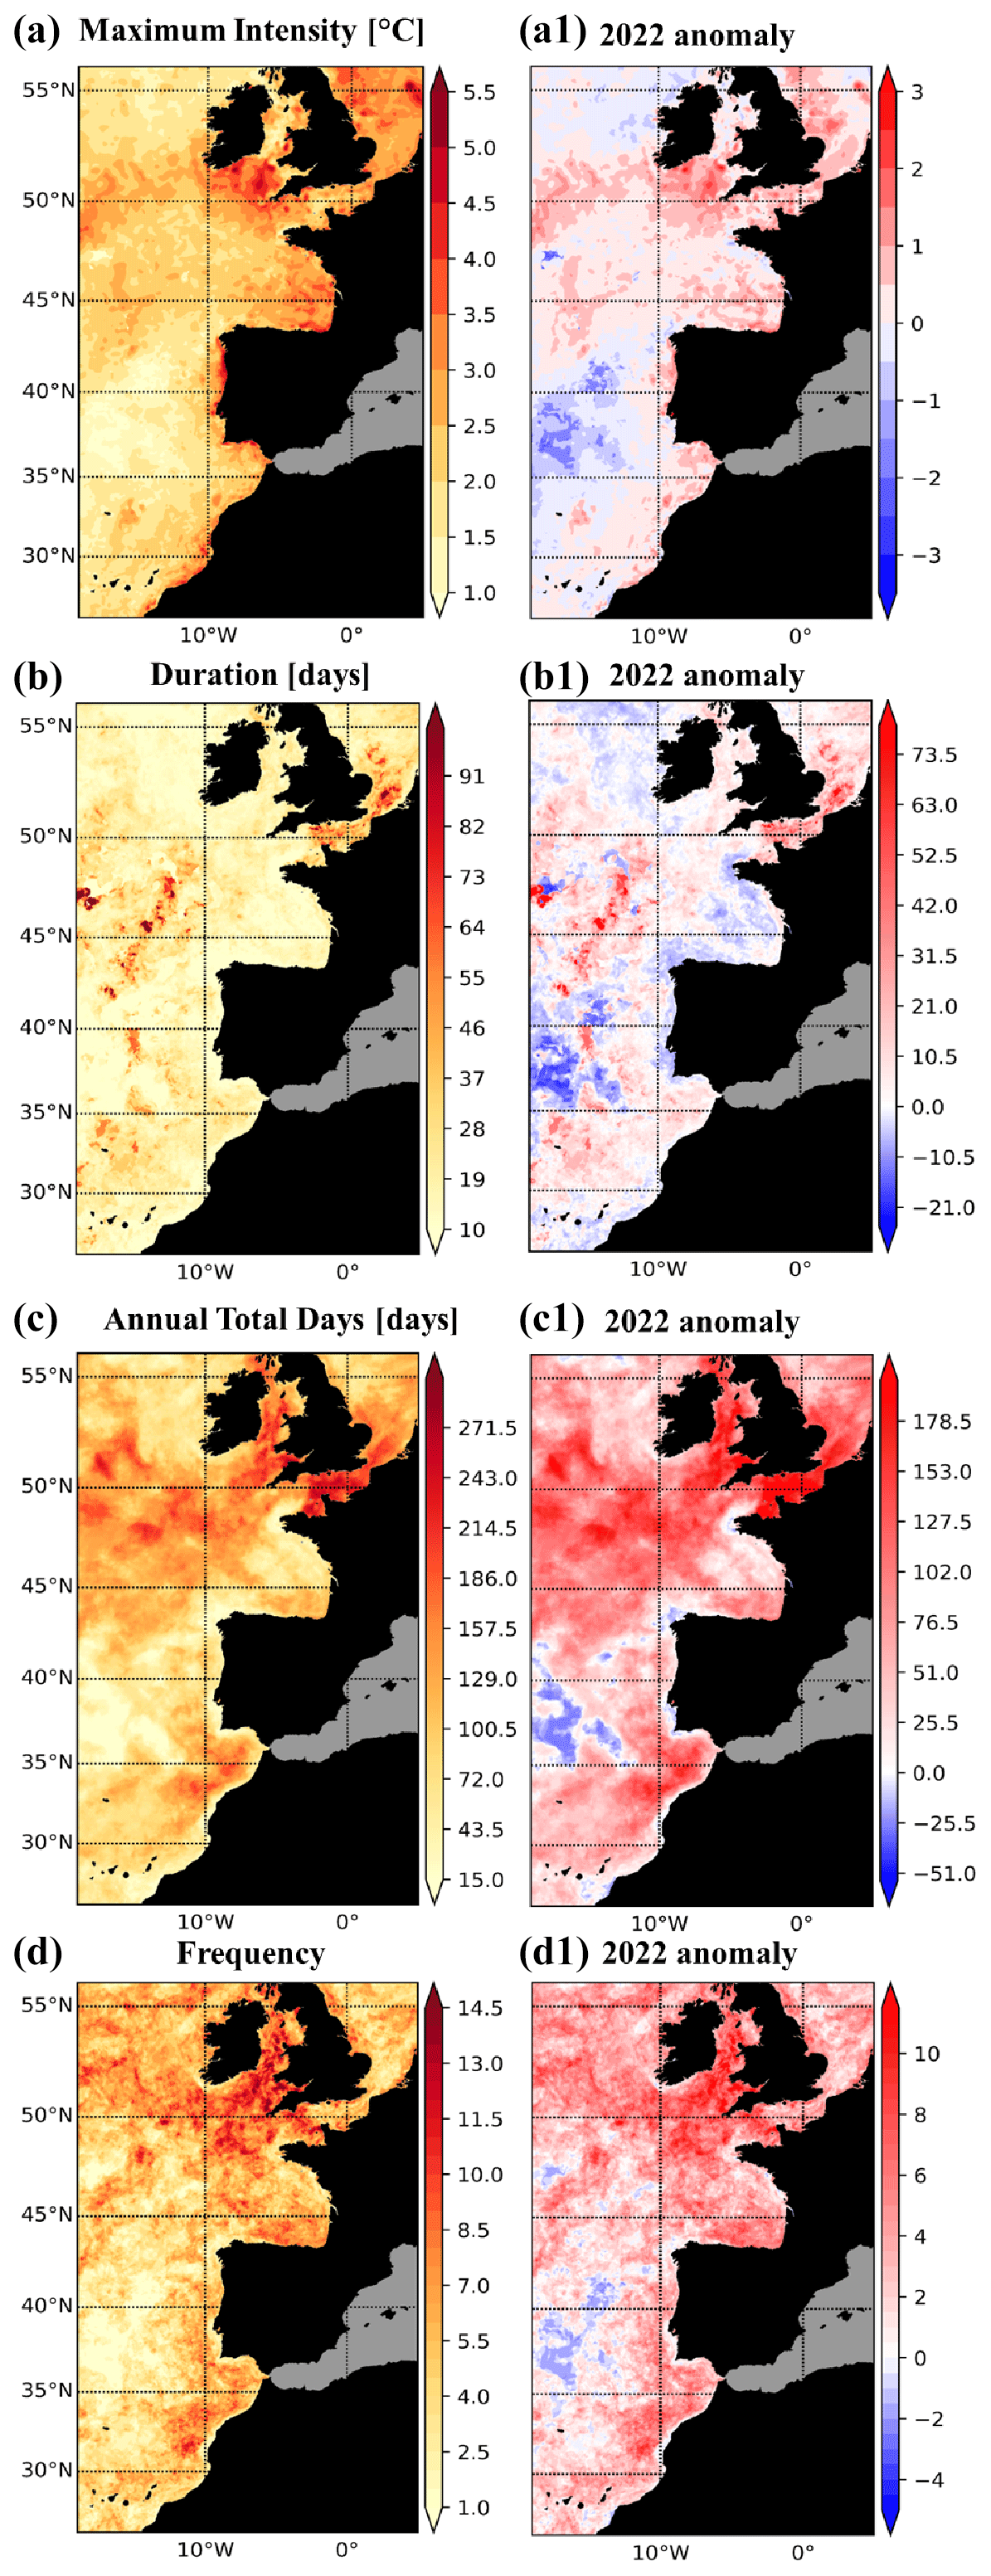
Figure 3The 2022 mean values of (a) maximum intensity, (b) frequency, (c) annual total days, and (d) duration and its respective 2022 anomaly for each parameter (a1–d1). The anomaly corresponds to the 2022 mean value minus the climatologic values of Fig. 2. The 2022 data correspond to the GLO-REP product.
Despite these results being, at least, quite alarming, we must point out that we understand that they may be strongly affected by the SST long-term trend. As mentioned above, different authors have addressed this issue but there is not a common agreement about how to deal with SST trends and MHWs. For the IBI domain, regional studies also corroborate the influence of the SST trends on the MHWs detected. For instance, in the Bay of Biscay, Izquierdo et al. (2022) demonstrated that SST trends may be responsible for a ∼ 20 % increase in the total MHW days during a decade. Also, in the English Channel, Simon et al. (2023) observed a positive correlation between the SST trend and the MHW duration, frequency, and extent. Furthermore, for the coastal areas subjected to an upwelling system such as the Canary Upwelling System, it is considered that global warming does not produce a direct effect on MHW trends (Varela et al., 2021). In summary, we consider Figs. 2 and 3 to manifest the need to establish a criterion about how to proceed with SST long-term trends because this method will be useless if all the days of the year are considered to be part of an MHW.
Table 2Record of the 2022 MHWs in the IBI area grouped by the subregions shown in Fig. 1. The MHW detection was applied to each subregion using the GLO-REP product (January 1982–December 2022). The listed events are ordered by the start date.
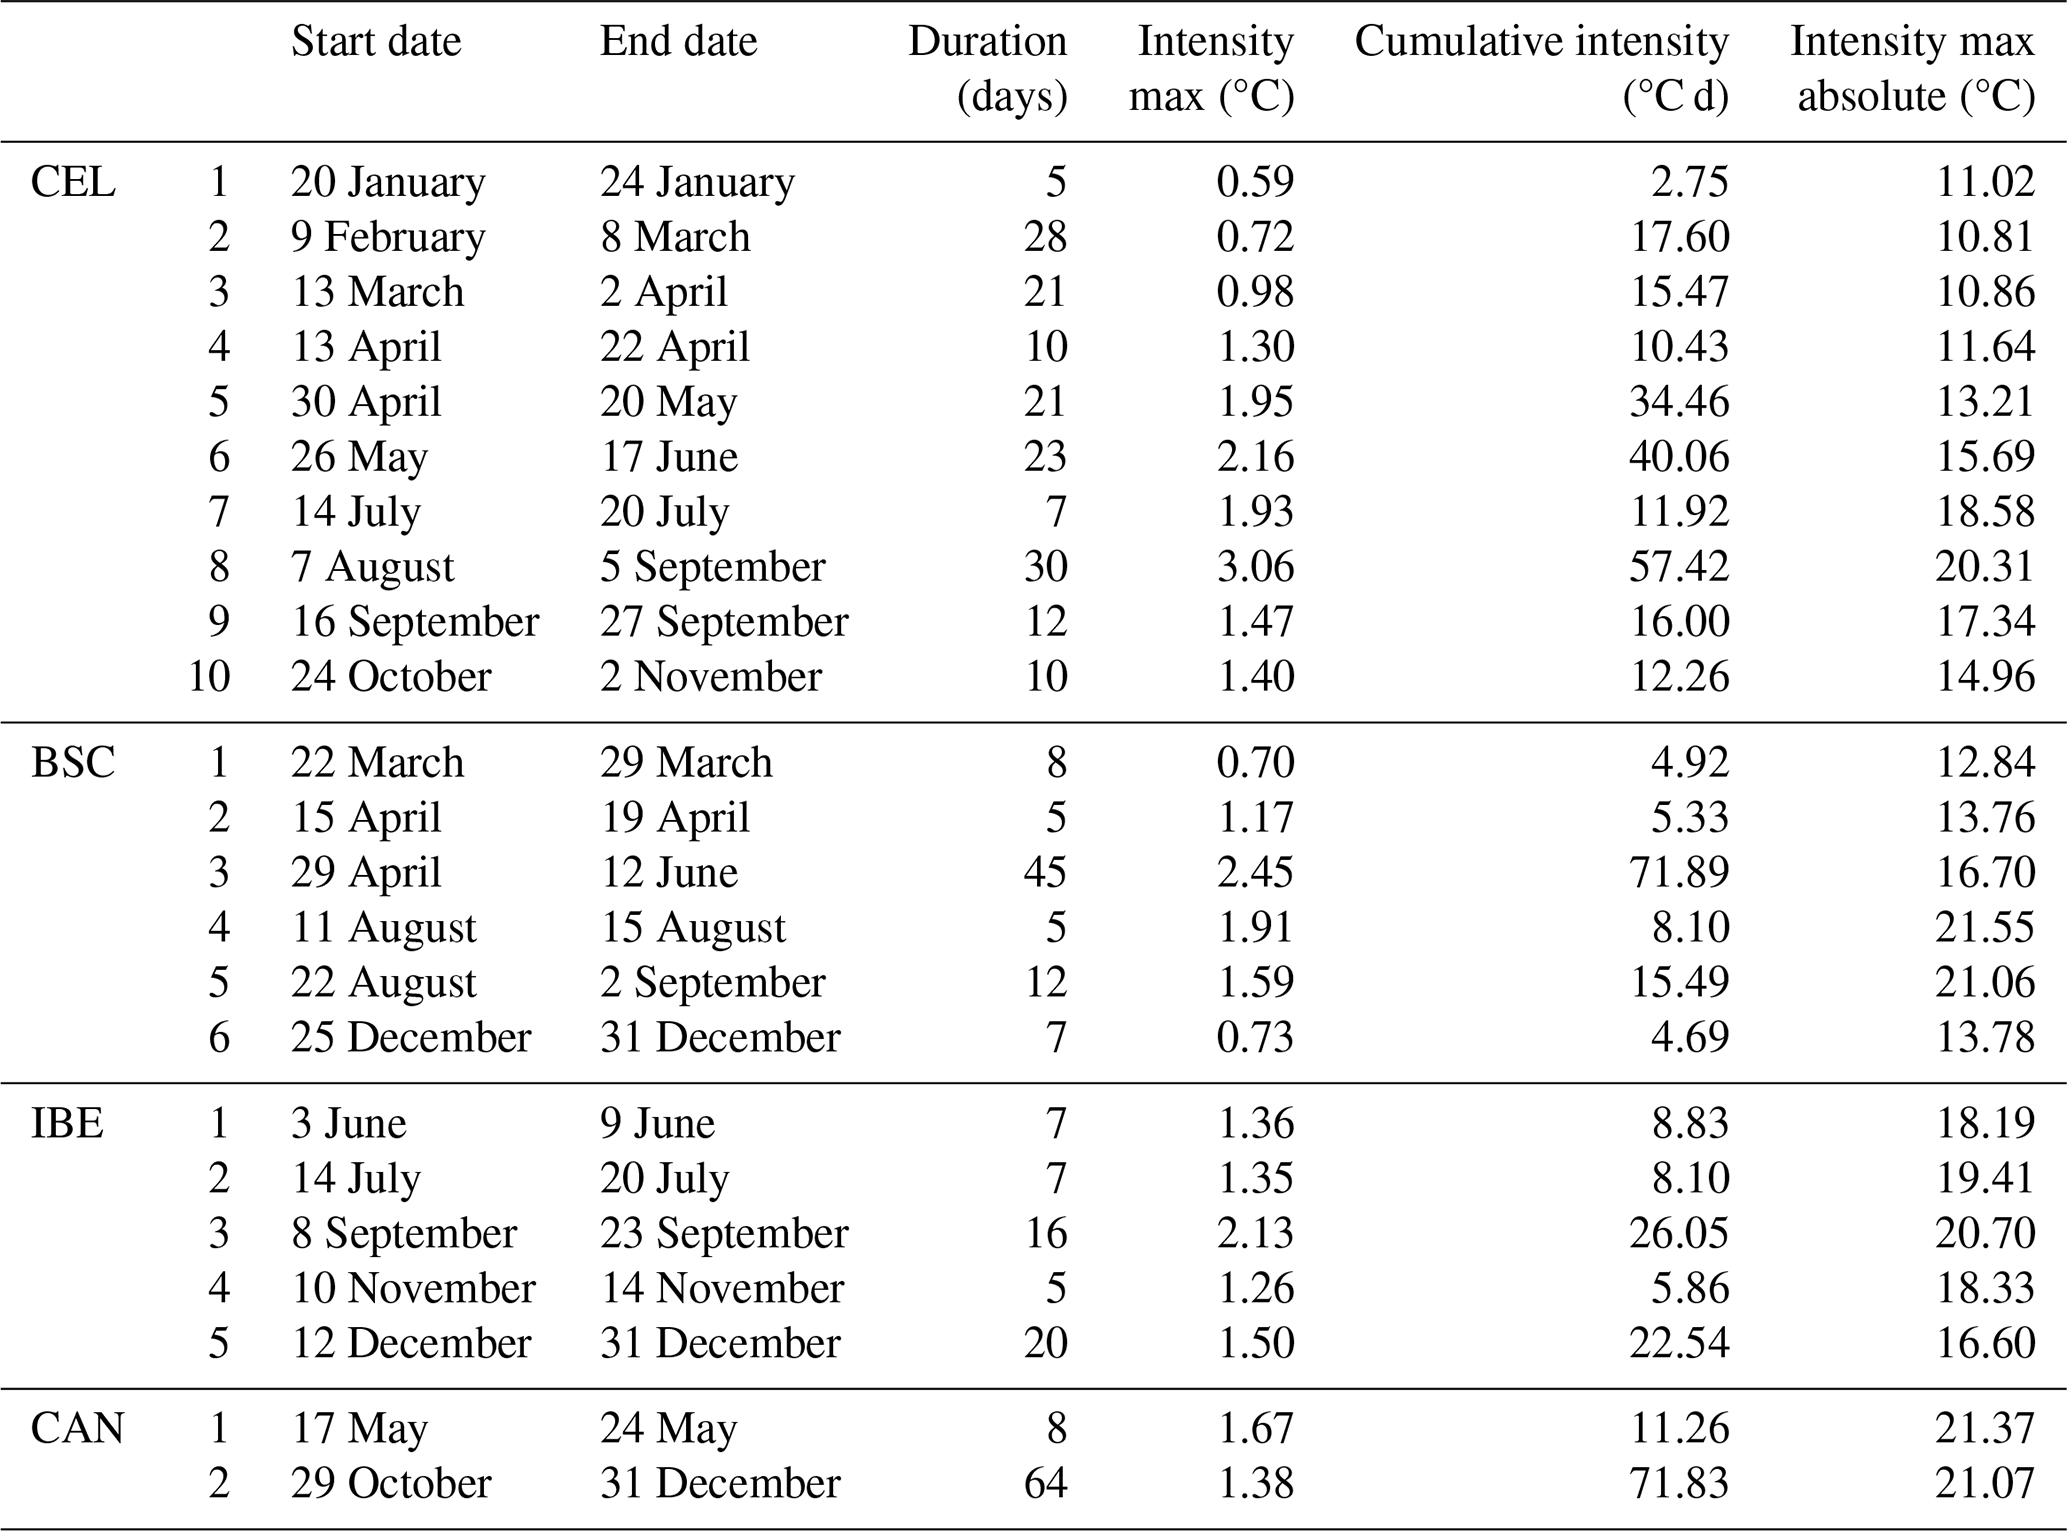
Table 3List of the record-breaking MHWs grouped by the subregions shown in Fig. 1. The first row of each group represents the strongest event in terms of maximum intensity, which is the peak point reached by the MHW relative to the climatology. The second one is the biggest event in terms of duration.
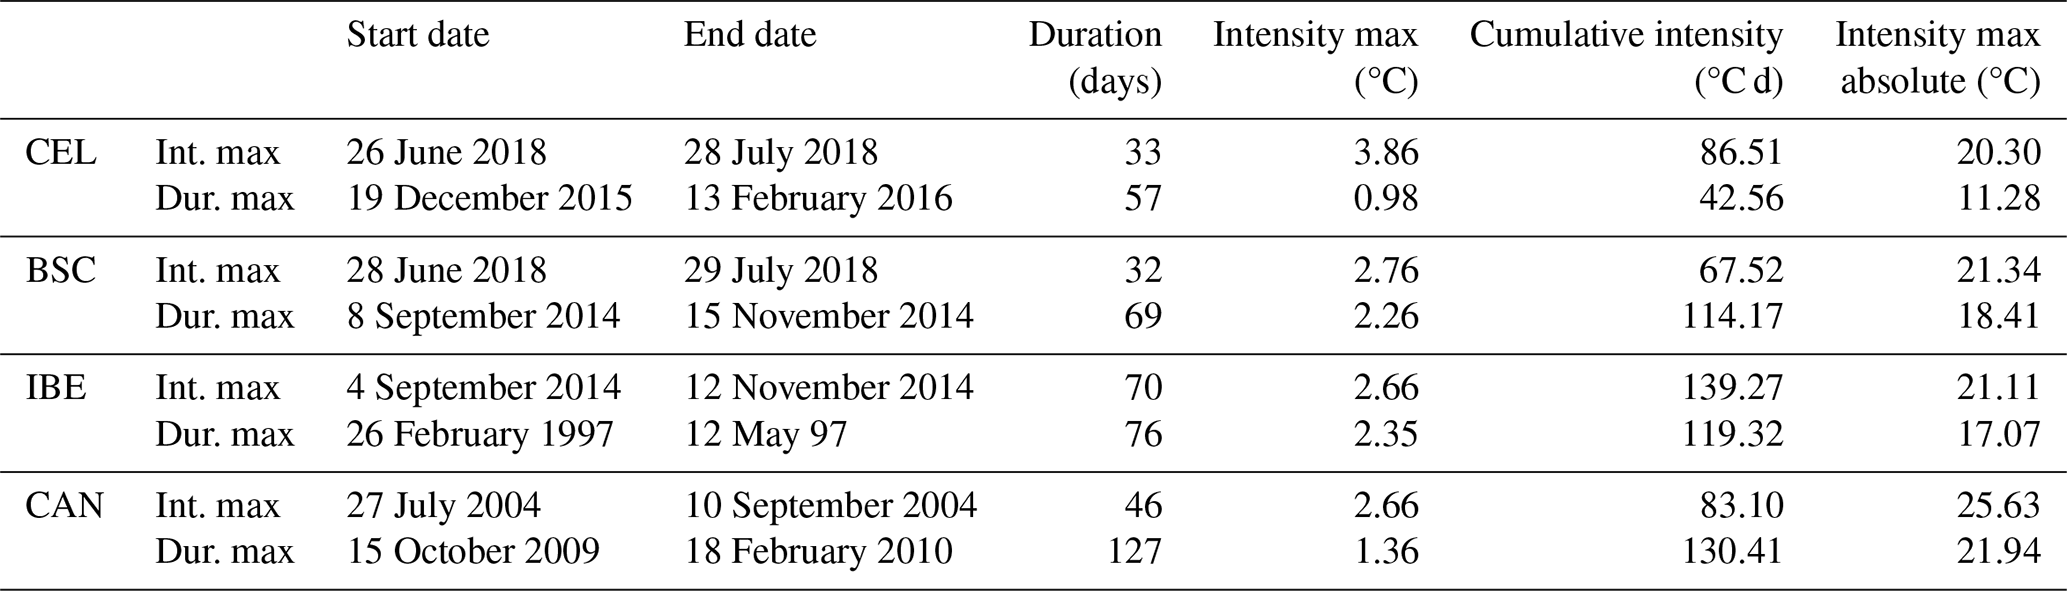
Another way to describe 2022 anomalies was by comparing the discrete events that occurred during 2022 and the record-breaking events over the past 40 years in four different subregions (Fig. 1), choosing for comparisons those events which reached the most extreme values of maximum intensity (int. max) and maximum duration (dur. max) (Table 3). From Table 2 we deduced that the number of events in 2022 increased with latitude and were more intense during the summer period as also shown for previous events by Sen Gupta et al. (2020). The event of 29 October in CAN almost reached the cumulative intensity value of the maximum intensity event of 2004 in the same area; almost all the 2022 MHWs in IBE showed bigger absolute maximum intensity values than the maximum duration event recorded in 1997, probably due to global warming. In the BSC area, the event starting on 29 April stands out for having 13 more days of duration and a greater cumulative intensity by 4.37 °C per day than the 2018 maximum intensity event. Lastly, from the CEL subregion we can highlight the event of 7 August for having 14.86 °C per day more cumulative intensity than the maximum duration event recorded in 2015–2016. Although it may not be strictly adequate to make direct comparisons between maximum duration and maximum intensity events given that intensity and duration are independent, an event can be very long and mild in intensity or vice versa, and these results demonstrate that the MHWs during the year 2022 were present in all the IBI domain with severe properties in various cases. Also, this comparison allowed us to embrace a general perspective and observe how, at least regarding the cumulative intensity, which represents the intensity–duration interaction fairly well, two 2022 events in two different subregions – the 29 April event in BSC and the 7 August event in CEL – surpassed two previous record-breaking events in their respective zones. The last remarkable result lies in the last events recorded for CAN, IBE, and BSC; in all cases the last event occurred until the last day of data, starting 29 October in CAN, 12 December in IBE, and 25 December in BSC. Despite this being something out of the scope of this study it could be related to abnormal atmospheric patterns not yet described in the literature. Coinciding in time and almost in space Marullo et al. (2023) described a record-breaking event in the Mediterranean Sea which started in May 2022 and lasted until 2023 spring. In this case, it seems to be related to persistent anticyclonic conditions and mid-tropospheric seasonal anomalies which could also influence the northeastern Atlantic.
The extreme events recorded in Table 3 allow us to link long-term physical processes with MHWs and, consequently, with some of their impacts. According to the literature, the influence of the NAO can be considered one of the main drivers, at least for the cases of 2010 in CAN and 2014 in IBE and BSC, years when Pereira et al. (2020) found the most negative (2010) and positive (2015) NAO index from 1870 to 2020. Also, as described by Hu et al. (2011), the event of 2010 in CAN is even more singular as it is the longest ever registered for the IBI domain, and it is considered to be influenced not only by the negative NAO but also by the ENSO. Finally, the event recorded during June 2018 is also remarkable as it reached the highest values of maximum intensity not only for CEL but also for BSC. This event can be linked to the NAO (Simon et al., 2023), and it is known to have had huge biological impacts in the area such as harmful phytoplankton blooms (Brown et al., 2022) and mass mortality events for mussels (Seuront et al., 2019).
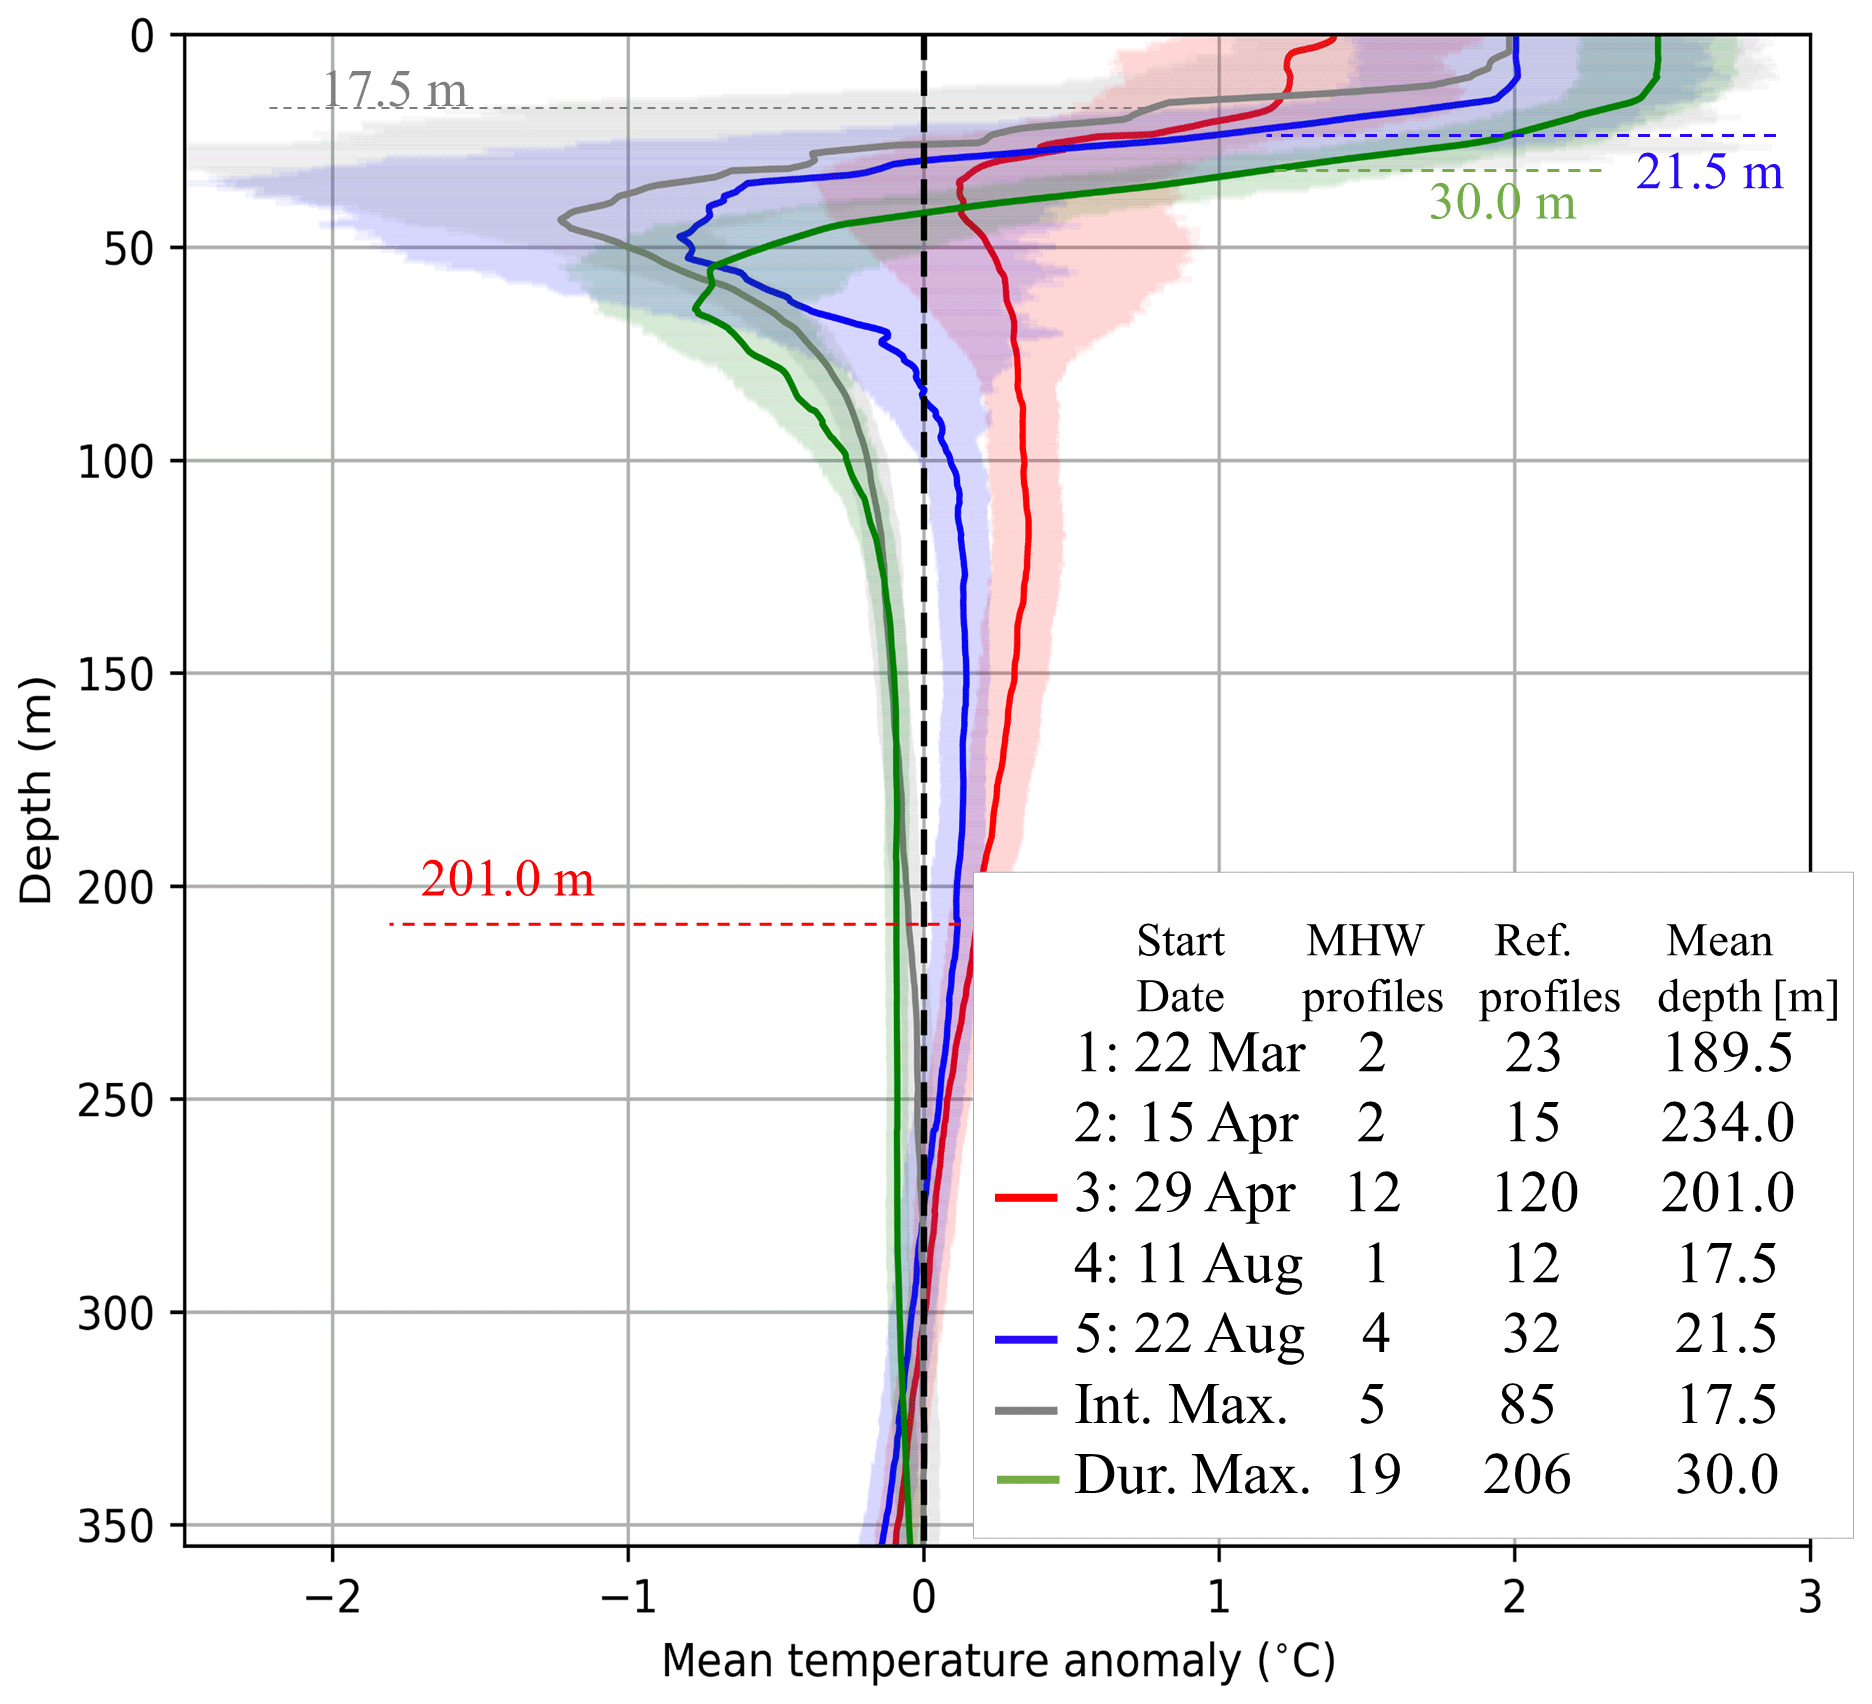
Figure 4Mean temperature anomaly profiles down to 350 m of depth for the BSC events with more than three MHW profiles and uncertainty at 95 % confidence. The position of the MHW profiles is shown in Fig. 1, and the colors are set for each event. MHW mean depth estimation by the Elzahaby and Schaeffer (2019) method is indicated in the legend and through dotted lines. In order to facilitate the identification of each event the start date is indicated, as is the number of profiles used in the computation of the mean profile during the MHW and the long-term reference for each event. All these results are from the ARGO dataset.
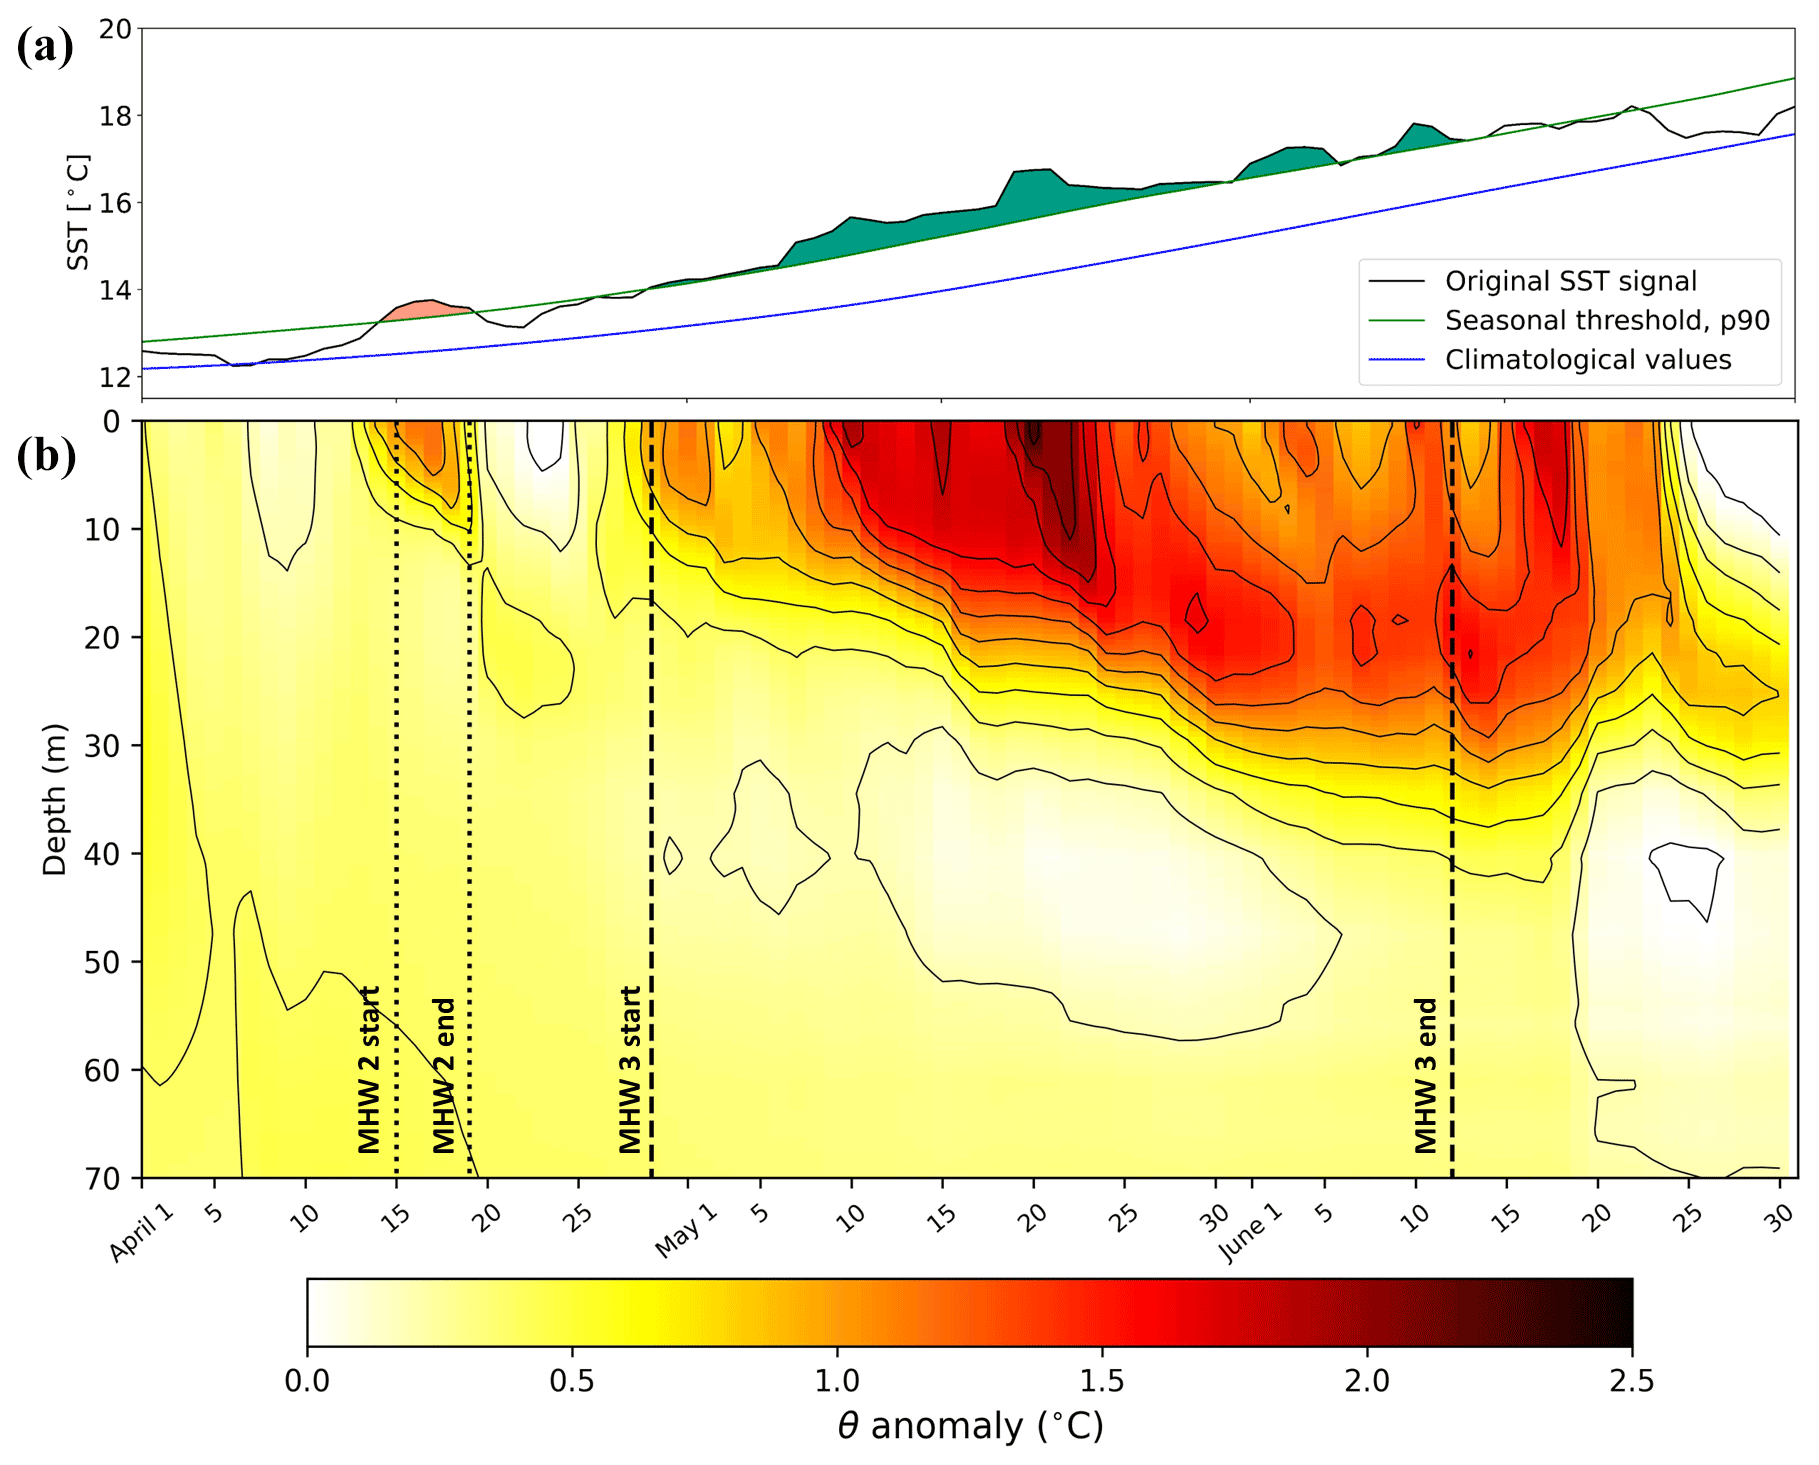
Figure 5(a) Time series from 1 April to 30 June of 2022 (GLO-REP dataset) where the black line represents the original SST signal, the blue line the climatological series from 1982 to 2022, the green line the seasonal threshold obtained through the 90th percentile, and the shaded areas the detected MHWs for the BSC during this period described in Table 2. (b) Hovmöller diagram of the mean potential temperature (θ) anomalies from 0 to 70 m depth between 1 April and 30 June of 2022. IBI-REA is used as a long-term reference from 2005 to 2021 and calibrated 2022 IBI-NRT for the MHW days. This section corresponds to a spatial average of temperature in the BSC subregion, where the dotted lines represent the start and end date of events 2 and 3 for the BSC area recorded in Table 2. Notice that the isotherms are drawn at 0.2 °C.
3.2 Subsurface 2022 BSC events
The next paragraphs assess the discrete events recorded for the BSC subregion. In Fig. 4 we can observe the temperature anomaly profiles for the events detected in 2022, which featured more than three ARGO profiles during the MHW, and for the maximum intensity and maximum duration events in BSC from 1982 to 2022 (Table 3), as well as the number of available ARGO profiles during the MHW, the reference period for each event, and the mean depth estimations through the Elzahaby and Schaeffer (2019) method. The anomaly profiles during the record-breaking events (gray and green profiles) show that the subsurface anomalies in BSC lie in an approximate range between −2.5 and 3 °C, where we ascribe the surface positive anomalies to the MHW processes and the negative ones, appearing at depths of 30 m and below, to the ascension of the thermocline in summer due to processes such as atmospheric blocking (Talley et al., 2011, p. 79). Other relevant results from Fig. 4 are the following: (i) the MHW mean depths calculated through the Elzahaby and Schaeffer (2019) method point to substantial differences between events during cold and warm seasons – MHWs during cold seasons are less intense but reach higher depths; (ii) the uncertainty inherent to the long-term reference and MHW profiles showed that subsurface interpretations had to be made carefully; (iii) for the maximum duration event (green profile), we detected a drastic reduction of the uncertainty, probably related to the higher number of ARGO observations available in this case; and (iv) the event of 22 August 2022 bore strong similarities in mean anomaly profile, mean depth, and also uncertainty ranges to the maximum intensity event for the region (gray profile).
From Fig. 5 we can observe the GLO-REP SST time series during MHW events 2 and 3 for the BSC (Table 2) and also a Hovmöller diagram during the same period, obtained using IBI-REA data as a long-term reference and IBI-NRT data for the 2022 days. The formation of a layer with an intense thermal gradient of approximately 0.2 to 0.7 °C is observed, expanding from 10 to 30 m in depth. If a suspected subsurface positive anomaly, which coincides in time with a detected MHW through the GLO-REP dataset in surface and that is limited downward by an intense thermal gradient, could be understood as a subsurface MHW, then MHW 2 and MHW 3 in Table 2 reach 10 and 30 m depth, respectively.
According to the positive anomalies in Fig. 5a and b, they coincide fairly well, even the peak points of the MHWs. On the other side, the MHW parameterization seems to fail at the end of the second event. The period from 12 to 21 June is not considered to be an MHW despite the fact that there are days above the threshold due to the default parameterization of the Hobday et al. (2016) method. Is this error relevant enough? We think it is, as we are assuming an error of 9 d when we consider an MHW from 5 d. Furthermore, if we want to assess and understand the regional drivers of MHWs we should probably consider a single event from 15 April to 21 June, as all this period remains in a single abnormal positive anomaly and follows an approximate common slope in the thermal gradient between the two events. In this way, future subsurface MHW characterization could help by being more precise in the parameterization and, in this way, expand our knowledge of this matter.
This study, through the usage of satellite-derived, observational, and modeling data, has assessed the mean 2022 properties of the MHWs in the IBI domain, the single events in four different subregions, and the subsurface structures of some of the events detected in the Bay of Biscay.
We showed that MHWs in the IBI domain from January 1982 to December 2022 happened on average from 1 to 2.5 times per year, with a maximum mean duration of 31 d and mean maximum intensities or deviations from the climatology of 4 °C (Fig. 2). For the year 2022, the MHW frequency ranged from 0 to 18 events, with maximum mean duration values of 145 d and mean maximum intensity values of 6 °C (Fig. 3). According to the observed SST long-term trends' effect on MHW detection by Schlegel et al. (2019) and Oliver et al. (2018), it is probably accurate to assume that these results are strongly modulated by those tendencies, meaning that we cannot be sure if extreme values are truly varying or if the MHW temperature threshold is surpassed more often due to global warming. From the catalogue of 2022 MHWs (Table 2) we singled out two of them for surpassing record-breaking events in each sub-domain. These are the 29 April event in BSC and the 7 August event in CEL, featuring 4.37 and 14.63 °C d more cumulative intensity, an approximation to the total energy of an event, than the maximum intensity event recorded on 26 June 2018 for the BSC subregion and the maximum duration event in CEL recorded on 19 December 2015, respectively (Table 2).
Subsurface MHW assessment in the BSC area through the ARGO dataset (Table 1) revealed a strong seasonal modulation. Cold-season events reached higher mean MHW depths of around 200 m, while the warm-season ones remained shallower at close to 20 m; despite the fact that it is out of the scope of this study, we understand that it may be directly related to the annual variability of the mixed layer thickness, which also could explain the observed negative thermal anomalies in summer events below 25–30 m (Fig. 4). Through model source data (Table 1) it is demonstrated how the increase in sea surface temperature, associated with the development of an MHW, is vertically moved downward in such a way that the positive anomalies persist at depth at least for weeks once the MHW has ended. In the case under investigation, the formation of a drastic thermal gradient is observed, descending from 10 to 30 m in depth within 1 month (Fig. 5).
The tools to detect and analyze MHWs can be found at https://github.com/ecjoliver/marineHeatWaves (Oliver, 2016).
The underlying data can be found in the product table (Table 1).
In this work all contributors participated in all the roles to a certain degree. But we can mention the role of ÁdPC as supervisor and project administrator, as well as conceptualization. The role of AAV was to provide data curation and formal analysis. And lastly, LCA took the role of developing software, investigation, and writing.
The contact author has declared that none of the authors has any competing interests.
Publisher's note: Copernicus Publications remains neutral with regard to jurisdictional claims made in the text, published maps, institutional affiliations, or any other geographical representation in this paper. While Copernicus Publications makes every effort to include appropriate place names, the final responsibility lies with the authors.
This work has been conducted under contract number 21002L6-COP-MFC IBI-5600, part of the ongoing partnership between Nologin and Mercator Ocean International.
We would like to thank Eric Oliver (Dalhousie University, Canada) for providing the main tools to detect and analyze MHWs through https://github.com/ecjoliver open-source. We are also grateful to the Copernicus Service for making available all kinds of oceanographic data. Lastly, thanks to Miriam Selwyn (Autonomous University of Barcelona, Spain) for her wise and kind notes, which have improved the text of this contribution.
This paper was edited by Piero Lionello and reviewed by two anonymous referees.
Amo-Baladrón, A., Levier, B., Aznar, R., and Sotillo, M. G.: EU Copernicus Marine Service Product User Manual for the Atlantic-Iberian Biscay Irish-Ocean Physics Reanalysis, IBI_MULTIYEAR_PHY_005_002, Issue 4.1, Mercator Ocean International, https://catalogue.marine.copernicus.eu/documents/PUM/CMEMS-IBI-PUM-005-002.pdf (last access: 2 April 2024), 2022.
Amo-Baladrón, A., Reffray, G., Levier, B., Escudier, R., Gutknecht, E., Aznar, R., and Sotillo, M. G.: EU Copernicus Marine Service Product User Manual for the Atlantic-Iberian Biscay Irish-Ocean Physics Analysis and Forecast, IBI_ANALYSISFORECAST_PHY_005_001, Issue 8.1, Mercator Ocean International, https://catalogue.marine.copernicus.eu/documents/PUM/CMEMS-IBI-PUM-005-001.pdf (last access: 2 April 2024), 2023.
Argo: Argo float data and metadata from Global Data Assembly Centre (Argo GDAC), SEANOE [data set], https://doi.org/10.17882/42182, 2019.
Brown, A. R., Lilley, M. K. S., Shutler, J., Widdicombe, C., Rooks, P., McEvoy, A., Torres, R., Artioli, Y., Rawle, G., Homyard, J., Tyler, C. R., and Lowe, C.: Harmful Algal Blooms and their impacts on shellfish mariculture follow regionally distinct patterns of water circulation in the western English Channel during the 2018 heatwave, Harmful Algae, 111, 102166, https://doi.org/10.1016/j.hal.2021.102166, 2022.
Chatterjee, S. and Simonoff, J. S.: Handbook of regression analysis with applications in R, 2nd edn., Wiley Series in Probability and Statistics, John Wiley & Sons, Hoboken (NJ), USA, ISBN 9781119392491, https://doi.org/10.1002/9781119392491, 2020.
Collins, M., Sutherland, M., Bouwer, L., Cheong, S.-M., Frölicher, T., Jacot Des Combes, H., Koll Roxy, M., Losada, I., McInnes, K., Ratter, B., Rivera-Arriaga, E., Susanto, R. D., Swingedouw, D., and Tibig, L.: Extremes, abrupt changes and managing risk, in: IPCC Special Report on the Ocean and Cryosphere in a Changing Climate, edited by: Pörtner, H.-O., Roberts, D.C., Masson-Delmotte, V., Zhai, P., Tignor, M., Poloczanska, E., Mintenbeck, K., Alegriìa, A., Nicolai, M., Okem, A., Petzold, J., Rama, B., and Weyer, N. M., Cambridge University Press, Cambridge, UK and New York, NY, USA, 589–655, https://doi.org/10.1017/9781009157964.008, 2019.
Cornes, R. C., Tinker, J., Hermanson, L., Oltmanns, M., Hunter, W. R., Lloyd-Hartley, H., Kent, E. C., Rabe, B., and Renshaw, R.: The impacts of climate change on sea temperature around the UK and Ireland, MCCIP Science Review 2023, 18 pp., https://doi.org/10.14465/2023.reu08.tem, 2023.
Elliott, M. and Whitfield, A. K.: Challenging paradigms in estuarine ecology and management, Estuar. Coast. Shelf S., 94, 306–314, https://doi.org/10.1016/j.ecss.2011.06.016, 2011.
Elzahaby, Y. and Schaeffer, A.: Observational insight into the subsurface anomalies of marine heatwaves, Front. Mar. Sci., 6, 745, https://doi.org/10.3389/fmars.2019.00745, 2019.
EU Copernicus Marine Service Product: ESA SST CCI and C3S Reprocessed Sea Surface Temperature Analyses, Mercator Ocean international [data set], https://doi.org/10.48670/moi-00169, 2021.
EU Copernicus Marine Service Product: Atlantic-Iberian Biscay Irish- Ocean Physics Reanalysis, Mercator Ocean International [data set], https://doi.org/10.48670/moi-00028, 2022.
EU Copernicus Marine Service Product: Atlantic Iberian Biscay Irish Ocean- In-Situ Near Real Time Observations, Mercator Ocean International [data set], https://doi.org/10.48670/moi-00043, 2023a.
EU Copernicus Marine Service Product: Atlantic-Iberian Biscay Irish- Ocean Physics Analysis and Forecast, Mercator Ocean International [data set], https://doi.org/10.48670/moi-00027, 2023b.
Fofonoff, N. P. and Millard Jr., R. C.: Algorithms for the computation of fundamental properties of seawater, UNESCO Technical Papers in Marine Sciences, 44, UNESCO, Paris, France, 53 pp., https://doi.org/10.25607/OBP-1450, 1993.
Fox-Kemper, B., Hewitt, H. T., Xiao, C., Aðalgeirsdóttir, G., Drijfhout, S. S., Edwards, T. L., Golledge, N. R., Hemer, M., Kopp, R. E., Krinner, G., Mix, A., Notz, D., Nowicki, S., Nurhati, I. S., Ruiz, L., Sallée, J.-B., Slangen, A. B. A., and Yu, Y.: Ocean, cryosphere and sea level change, in: Climate Change 2021: The Physical Science Basis. Contribution of Working Group I to the Sixth Assessment Report of the Intergovernmental Panel on Climate Change, edited by: Masson-Delmotte, V., Zhai, P., Pirani, A., Connors, S. L., Péan, C., Berger, S., Caud, N., Chen, Y., Goldfarb, L., Gomis, M. I., Huang, M., Leitzell, K., Lonnoy, E., Matthews, J. B. R., Maycock, T. K., Waterfield, T., Yelekçi, O., Yu, R., and Zhou, B., Cambridge University Press, Cambridge, United Kingdom and New York, NY, USA, 1211–1362, https://doi.org/10.1017/9781009157896.011, 2021.
Good, S.: EU Copernicus Marine Service Quality Information Document for the ESA SST CCI and C3S global Sea Surface Temperature Reprocessed product, SST-GLO-SST-L4-REP-OBSERVATIONS-010-024, Issue 2.3, Mercator Ocean International, https://catalogue.marine.copernicus.eu/documents/QUID/CMEMS-SST-QUID-010-024.pdf (last access: 6 June 2023), 2021.
Good, S.: EU Copernicus Marine Service Product User Manual for the ESA SST CCI and C3S global Sea Surface Temperature Reprocessed product, SST-GLO-SST-L4-REP-OBSERVATIONS-010-024, Issue 3.0, Mercator Ocean International, https://catalogue.marine.copernicus.eu/documents/PUM/CMEMS-SST-PUM-010-024.pdf (last access: 6 June 2023), 2022.
Good, S., Fiedler, E., Mao, C., Martin, M. J., Maycock, A., Reid, R., Roberts-Jones, J., Searle, T., Waters, J., While, J., and Worsfold, M.: The current configuration of the OSTIA system for operational production of foundation sea surface temperature and ice concentration analyses, Remote Sens., 12, 4, https://doi.org/10.3390/rs12040720, 2020.
Hobday, A. J., Alexander, L. V., Perkins, S. E., Smale, D. A., Straub, S. C., Oliver, E. C. J., Benthuysen, J. A., Burrows, M. T., Donat, M. G., Feng, M., Holbrook, N. J., Moore, P. J., Scannell, H. A., Sen Gupta, A., and Wernberg, T.: A hierarchical approach to defining marine heatwaves, Prog. Oceanogr., 141, 227–238, https://doi.org/10.1016/j.pocean.2015.12.014, 2016.
Hobday, A. J., Oliver, E. C. J., Sen Gupta, A., Benthuysen, J. A., Burrows, M. T., Donat, M. G., Holbrook, N. J., Moore, P. J., Thomsen, M. S., Wernberg, T., and Smale, D. A.: Categorizing and naming marine heatwaves, Oceanography, 31, 162–173, https://doi.org/10.5670/oceanog.2018.205, 2018.
Holbrook, N. J., Scannell, H. A., Sen Gupta, A., Benthuysen, J. A., Feng, M., Oliver, E. C. J., Alexander, L. V., Burrows, M., Donat, M. G., Hobday, A. J., Moore, P. J., Perkins-Kirkpatrick, S. E., Smale, D. A., Straub, S. C., and Wernberg, T.: A global assessment of marine heatwaves and their drivers, Nat. Commun., 10, 2624, https://doi.org/10.1038/s41467-019-10206-z, 2019.
Holbrook, N. J., Sen Gupta, A., Oliver, E. C. J., Hobday, A. J., Benthuysen, J. A., Scannell, H. A., Smale, D. A., and Wernberg, T.: Keeping pace with marine heatwaves, Nat. Rev. Earth Environ., 1, 482–493, https://doi.org/10.1038/s43017-020-0068-4, 2020.
Hu, Z.-Z., Kumar, A., Huang, B., Xue, Y., Wang, W., and Jha, B.: Persistent atmospheric and oceanic anomalies in the North Atlantic from Summer 2009 to Summer 2010, J. Climate, 24, 5812–5830, https://doi.org/10.1175/2011JCLI4213.1, 2011.
In Situ TAC partners: EU Copernicus Marine Service Product User Manual for the Atlantic Iberian Biscay Irish Ocean- In-Situ Near Real Time Observations, INSITU_IBI_PHYBGCWAV_DISCRETE_MYNRT_013_033, Issue 2.0, Mercator Ocean International, https://catalogue.marine.copernicus.eu/documents/PUM/CMEMS-INS-PUM-013-030-036.pdf (last access: 2 April 2024), 2023.
Izquierdo, P., Taboada, F. G., González-Gil, R., Arrontes, J., and Rico, J. M.: Alongshore upwelling modulates the Intensity of marine heatwaves in a temperate coastal sea, Sci. Total Environ., 835, 155478, https://doi.org/10.1016/j.scitotenv.2022.155478, 2022.
Lee, H., Calvin, K., Dasgupta, D., Krinner, G., Mukherji, A., Thorne, P., Trisos, C., Romero, J., Aldunce, P., Barrett, K., Blanco, G., Cheung, W. W. L., Connors, S. L., Denton, F., Diongue-Niang, A., Dodman, D., Garschagen, M., Geden, O., Hayward, B., Jones, C., Jotzo, F., Krug, T., Lasco, R., Lee, J.-Y., Masson-Delmotte, V., Meinshausen, M., Mintenbeck, K., Mokssit, A., Otto, F. E. L., Pathak, M., Pirani, A., Poloczanska, E., Pörtner, H.-O., Revi, A., Roberts, D. C., Roy, J., Ruane, A. C., Skea, J., Shukla, P. R., Slade, R., Slangen, A., Sokona, Y., Sörensson, A. A., Tignor, M., Van Vuuren, D. P., Wei, Y.-M., Winkler, H., Zhai, P., and Zommers, Z.: Synthesis Report of the IPCC Sixth Assessment Report (AR6): Longer Report, IPCC, Intergovernmental Panel on Climate Change, https://doi.org/10.59327/IPCC/AR6-9789291691647, 2023.
Levier, B., Reffray, G., and Sotillo, M. G.: EU Copernicus Marine Service Quality Information Document for the Atlantic-Iberian Biscay Irish- Ocean Physics Reanalysis, IBI_MULTIYEAR_PHY_005_002, Issue 5.1, Mercator Ocean International, https://catalogue.marine.copernicus.eu/documents/QUID/CMEMS-IBI-QUID-005-002.pdf (last access: 7 May 2024), 2022.
Levier, B., Reffray, G., Escudier, R., Gutknecht, E., Amo-Baladrón, A., Ciliberti, S., Aznar, R., and Sotillo, M. G.: EU Copernicus Marine Service Quality Information Document for the Atlantic-Iberian Biscay Irish- Ocean Physics Analysis and Forecast product, IBI_ANALYSISFORECAST_PHY_005_001, Issue 6.1, Mercator Ocean International, https://catalogue.marine.copernicus.eu/documents/QUID/CMEMS-IBI-QUID-005-001.pdf (last access: 7 May 2024), 2023.
Marullo, S., Serva, F., Iacono, R., Napolitano, E., di Sarra, A., Meloni, D., Monteleone, F., Sferlazzo, D., Silvestri, L. D., de Toma, V., Pisano, A., Bellacicco, M., Landolfi, A., Organelli, E., Yang, C., and Santoleri, R.: Record-breaking Persistence of the 2022/23 marine heatwave in the Mediterranean Sea, Environ. Res. Lett., 18, 114041, https://doi.org/10.1088/1748-9326/ad02ae, 2023.
Merchant, C. J., Embury, O., Bulgin, C. E., Block, T., Corlett, G. K., Fiedler, E., Good, S. A., Mittaz, J., Rayner, N. A., Berry, D., Eastwood, S., Taylor, M., Tsushima, Y., Waterfall, A., Wilson, R., and Donlon, C.: Satellite-based time-series of sea-surface temperature since 1981 for climate applications, Scientific Data, 6, 223, https://doi.org/10.1038/s41597-019-0236-x, 2019.
Oliver, E.: marineHeatWaves, GitHub [code], https://github.com/ecjoliver/marineHeatWaves (last access: 5 April 2024), 2016.
Oliver, E. C. J., Donat, M. G., Burrows, M. T., Moore, P. J., Smale, D. A., Alexander, L. V., Benthuysen, J. A., Feng, M., Sen Gupta, A., Hobday, A. J., Holbrook, N. J., Perkins-Kirkpatrick, S. E., Scannell, H. A., Straub, S. C., and Wernberg, T.: Longer and more frequent marine heatwaves over the past century, Nat. Commun., 9, 1324, https://doi.org/10.1038/s41467-018-03732-9, 2018.
Pereira, J., Paiva, V., Ceia, F., and Ramos, J.: Facing extremes: Cory's shearwaters adjust their foraging behaviour differently in response to contrasting phases of North Atlantic Oscillation, Reg. Environ. Change, 22, 77, https://doi.org/10.1007/s10113-020-01662-1, 2020.
Schlegel, R. W., Oliver, E. C. J., Hobday, A. J., and Smit, A. J.: Detecting marine heatwaves with sub-optimal data, Front. Mar. Sci., 6, 737, https://doi.org/10.3389/fmars.2019.00737, 2019.
Schlitzer, R.: Ocean Data View, https://odv.awi.de (last access: 30 July 2023), 2021.
Sen Gupta, A., Thomsen, M., Benthuysen, J. A., Hobday, A. J., Oliver, E., Alexander, L. V., Burrows, M. T., Donat, M. G., Feng, M., Holbrook, N. J., Perkins-Kirkpatrick, S., Moore, P. J., Rodrigues, R. R., Scannell, H. A., Taschetto, A. S., Ummenhofer, C. C., Wernberg, T., and Smale, D. A.: Drivers and impacts of the most extreme marine heatwave events, Sci. Rep., 10, 19359, https://doi.org/10.1038/s41598-020-75445-3, 2020.
Seuront, L., Nicastro, K. R., Zardi, G. I., and Goberville, E.: Decreased thermal tolerance under recurrent heat stress conditions explains summer mass mortality of the blue mussel Mytilus edulis, Sci. Rep., 9, 17498, https://doi.org/10.1038/s41598-019-53580-w, 2019.
Simon, A., Poppeschi, C., Plecha, S., Charria, G., and Russo, A.: Coastal and regional marine heatwaves and cold spells in the northeastern Atlantic, Ocean Sci., 19, 1339–1355, https://doi.org/10.5194/os-19-1339-2023, 2023.
Smale, D. A., Wernberg, T., Oliver, E. C., Thomsen, M., Harvey, B. P., Straub, S. C., Burrows, M. T., Alexander, L. V., Benthuysen, J. A., and Donat, M. G.:. Marine heatwaves threaten global biodiversity and the provision of ecosystem services, Nat. Clim. Change, 9, 306–312, https://doi.org/10.1038/s41558-019-0412-1, 2019.
Sotillo, M. G., Cailleau, S., Lorente, P., Levier, B., Aznar, R., Reffray, G., Amo-Baladrón, A., Chanut, J., Benkiran, M., and Alvarez Fanjul, E.: The MyOcean IBI Ocean Forecast and Reanalisys Systems: Operational products and roadmap to the future Copernicus Service, J. Oper. Oceanogr., 8, 63–79, https://doi.org/10.1080/1755876X.2015.1014663, 2015.
Talley, L. D., Pickard, G. L., Emery, W. J., and Swift, J. H.: Descriptive Physical Oceanography: An Introduction, 6th edn., Academic Press, Amsterdam, ISBN 978-0-08093-911-7, 2011.
Varela, R., Rodríguez-Díaz, L., De Castro, M., and Gómez-Gesteira, M.: Influence of eastern upwelling systems on marine heatwaves occurrence, Global Planet. Change, 196, 103379, https://doi.org/10.1016/j.gloplacha.2020.103379, 2021.
Wehde, H., Schuckmann, K. V., Pouliquen, S., Grouazel, A., Bartolome, T., Tintore, J., De Alfonso Alonso-Munoyerro, M., Carval, T., Racapé, V., and the INSTAC team: EU Copernicus Marine Service Quality Information Document for the Atlantic Iberian Biscay Irish Ocean- In-Situ Near Real Time Observations Product, IN-SITU_IBI_PHYBGCWAV_DISCRETE_MYNRT_013_033, Issue 2.3, Mercator Ocean International, https://catalogue.marine.copernicus.eu/documents/QUID/CMEMS-INS-QUID-013-030-036.pdf (last access: 7 May 2024), 2023.
Yao, Y., Wang, C., and Fu, Y.: Global marine heatwaves and cold-spells in present climate to future projections, Earths Future, 10, e2022EF002787, https://doi.org/10.1029/2022EF002787, 2022.