the Creative Commons Attribution 4.0 License.
the Creative Commons Attribution 4.0 License.
 | 30 Sep 2024 | OSR8 | Chapter 3.2
Event-based wave statistics for the Baltic Sea
Jan-Victor Björkqvist
Hedi Kanarik
Laura Tuomi
Lauri Niskanen
Markus Kankainen
Typical statistics, such as mean or percentiles, provide an excellent baseline for studying variations and changes in physical variables that have socioeconomic relevance. Nonetheless, they lack information on how often, and for how long, a certain wave height is exceeded, which might be needed for practical applications, such as planning marine operations. Using a 29-year wave hindcast, we determined the individual events where the significant wave height exceeded warning thresholds for Baltic Sea marine traffic (2.5, 4, and 7 m). During the summer months (JJA), the significant wave height exceeded 2.5 m less than twice a month. During the winter months (DJF), a significant wave height of 2.5 m was exceeded on average once a week in the larger Baltic Proper and Bothnian Sea sub-basins. Events with wave heights of over 7 m occurred roughly once every other year in the larger sub-basins. Our case study for fish-farm-related operations compared two sites that are located 10 and 30 km from the coast in the Bothnian Sea, where we determined wave events that could affect operations at the cage – meaning a significant wave height over 1 m. During the growth period of rainbow trout (May–October) there were roughly twice as many possibly disruptive events at the location further offshore than at the location closer to the coast. Even at the less-exposed location half of the wave events lasted more than 12 h, with a few events in September and October lasting around a week.
- Article
(2027 KB) - Full-text XML
- BibTeX
- EndNote


Wind-generated sea surface waves impact safety at seas and the planning of offshore structures and activities. These safety and financial considerations, along with scientific interest, have motivated studies mapping the global wave climate with in situ and remote sensing measurements and with numerical models (Semedo et al., 2011; Young et al., 2011; Semedo et al., 2015; Vanem et al., 2017). Wave statistics, trends, and extremes are therefore relatively well understood on a global and regional scale, but these general statistics might be too abstract for specific socioeconomic applications.
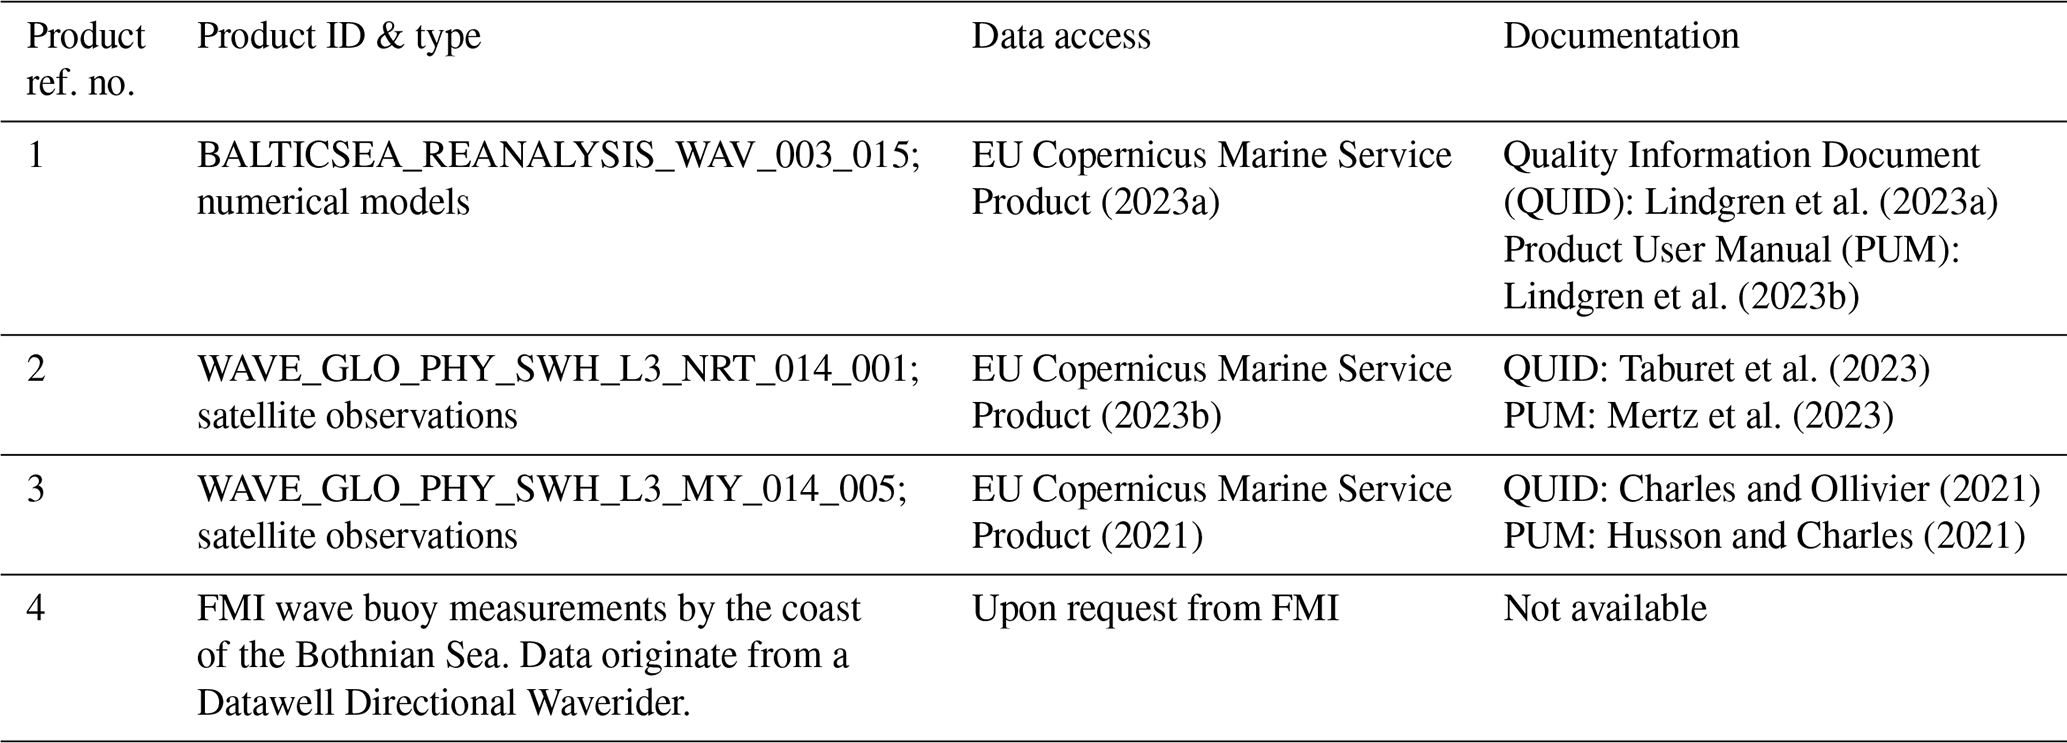
Table 1CMEMS and non-CMEMS products used in this study, including information on data documentation.
The Baltic Sea wave climate is relatively mild compared to the oceans (e.g. Cieślikiewicz et al., 2008; Tuomi et al., 2011; Björkqvist et al., 2018), but a significant wave height of 8 m has been measured during storms (Soomere et al., 2008; Björkqvist et al., 2017, 2020). Traditional mean, maximum, and percentile statistics have been used to determine the wave impact on sediment transport (Soomere and Viška, 2014) and the mean water level (Soomere et al., 2020), as well as the joint effects of waves and water-level variations (Hanson and Larson, 2008; Leijala et al., 2018; Kudryavtseva et al., 2020). Waves also affect structures in the sea, such as fish farms (Faltinsen and Shen, 2018; Karathanasi et al., 2022). Recommendations and best practices for the design of coastal and offshore structures typically rely on extreme values, such as 50-, 100-, or 250-year significant wave heights (e.g. NSF, 2003; Björkqvist et al., 2019).
The construction and maintenance of offshore structures require marine operations. While large cargo and passenger vessels can operate in the harshest wave conditions of the Baltic Sea, smaller vessels that are used for maintenance might be sensitive to lower sea states. Therefore, the planning of maintenance operations benefits from information on individual wave events that can affect these smaller vessels. A typical question might be as follows: how many times will a (possibly disruptive) wave event occur in May, and how long do such events typically last? This information cannot be deduced from traditional statistics.
This study aims to provide Baltic Sea-wide, practically applicable event-based wave statistics. The focus is on seasonal wave events occurring multiple times per year, thus impacting day-to-day operations at sea. The study also includes a nearshore case study applied to fish farming. This case study compares the wave conditions at two locations, of which one is further out to sea where the different pressures (i.e. societal and environmental) from the mainland are weaker and there is less eutrophication.
This paper is structured as follows: Sect. 2 introduces the model hindcast and the observational data. Section 3 presents the survey with fish farmers, and Sect. 4 defines the statistics. Section 5 gives wave event statistics for the entire Baltic Sea, while Sect. 6 presents the case study with a focus on the needs for fish farms. We end by discussing and concluding our findings.
This study is based on the Copernicus Marine Service's Baltic Sea wave hindcast (product ref. no. 1, Table 1). The hourly hindcast data cover the entire Baltic Sea with a resolution of 1 nautical mile (ca. 1.85 km) for the years 1993–2021. Of the available wave parameters we use the significant wave height, defined as , where m0 is the variance of the wave field. The simulated Hs had a bias and root-mean-square error (RMSE) of −0.04 and 0.24 m when validated against in situ wave measurements from the Baltic Sea (Lindgren et al., 2023a). Nonetheless, these results do not quantify the model accuracy in coastal areas. Also, buoys located in the north typically need to be recovered before the ice season, causing measurement gaps in late autumn, winter, and early spring.
As an additional validation we compared the hindcast against the satellite L 3 Significant Wave Height product (product ref. nos. 2 and 3, Table 1). This validation, covering 2002–2021, was performed by collocating each along-track satellite measurement to the closest model grid point, allowing a time difference of at most 30 min. The number of data points used for comparison was 1 246 075, and the mean and median distances between the compared points were 0.66 and 0.68 km. The −0.06 m bias and a 0.25 m RMSE over the whole domain were similar to those reported by Lindgren et al. (2023a).
Finally, we compared the hindcast against coastal wave buoy measurements collected by the Finnish Meteorological Institute (FMI) near the coast in the eastern Bothnian Sea (61.325° N, 21.369° E) from July 2017 to 5 January 2018 (product ref. no. 4, Table 1). The buoy was located less than 10 km from the coast, and data were available every 30 min, of which we used the values coinciding with the hourly model output. The −0.04 m bias and 0.18 m RMSE suggest that the hindcast is accurate enough in our nearshore study region (see Sect. 6).
In a small survey – conducted as part of the fish farming national spatial plan – we asked three fish farmers in which wave conditions they can operate. We interviewed three companies with farms in harsh conditions in the Baltic Sea: Lännenpuolen Lohi Oy (LL), Offshore Fish Finland Oy (OF), and Brändö Lax Ab (BL). We asked the companies to estimate the wave heights in which they can feed their fish and do other maintenance operations on their cages and also to describe the vessels with which they operate.
LL mostly uses a small 7 m feeding boat, and they reported that 0.5 m sharp waves can already complicate the feeding of the fish and that other operations also become difficult in the submerged cage they use. OF reported that they stop feeding at a 1.2 m wave height, while BL reported that they have fed the fish in up to 2 m waves but that other operations become difficult and unsafe in 1 m waves. Both OF and BL have 15–20 m vessels that are designed to be used at fish farms in harsh conditions. All fish farmers noted that the sea should be relatively calm during harvesting when using a crane to troll fish from cages.
Based on the above results, we decided to use 1 m as an approximate threshold for when it is possible to perform normal operations safely at the cages (see Sect. 6).
We define the first hour of a wave event as the time when a specific threshold is exceeded. The last hour of an event is when the Hs again drops below this threshold. The duration of an event (in hours) is determined as the number of (hourly) data points between (and including) the start and the end points of the event. Nonetheless, two events are regarded as one if they are less than 12 h apart and if the Hs does not drop below 90 % of the threshold in between. For monthly statistics each event is assigned to the month when the maximum is reached, even if the majority of the event took place during another month.
We used the thresholds of 1, 2.5, 4, and 7 m. The three highest values have been chosen by the FMI to trigger national wave warnings, since they are regarded as potentially dangerous for ship traffic. The lowest threshold is relevant for lighter operations at sea and is based on the survey described in Sect. 3.
A 2.5 m Hs was exceeded over 10 times per year in all the sub-basins of the Baltic Sea (Fig. 1a), with median durations typically between 10 and 16 h (Fig. 1d). A 4 m Hs was still exceeded several times per year in most of the Baltic Sea, but median durations over 10 h were rare. Previous studies have shown that a 7 m Hs is reached only during strong winds in the larger basins (e.g. Tuomi et al., 2011; Björkqvist et al., 2018). In our data the median duration of the 7 m events exceeded 10 h in some parts of the larger basins (Fig. 1f). The 7 m threshold was not exceeded in the Gulf of Riga, the Gulf of Finland, or the Bothnian Bay (Fig. 1c).
The wave conditions in the Baltic Sea are seasonal, with the highest waves occurring in late autumn or early winter (Tuomi et al., 2011). While large vessels operate in the Baltic Sea year round, many activities are limited to the calmer months between late spring and early autumn. We studied the seasonality at five points: four of them coincide with the location of FMI operational wave buoys, and the fifth is taken in the southern Baltic Sea where the wave climate is the harshest (Fig. 2).
The Hs in the Baltic Proper and Bothnian Sea exceeded 2.5 m (at least) about once per week between October and February but only once every 2 to 4 weeks in April to August. Even in the smaller basins (Gulf of Finland and Bothnian Bay) the Hs exceeded 2.5 m around once every 1 to 2 weeks in the harsher period between October and January.
An Hs of 4 m occurred on average less than once every other calendar month throughout the year in the smallest basins (Gulf of Finland and Bay of Bothnia); for the larger basins this was true only between April and August. In the winter months (DJF) Hs exceeded 4 m on average 1–2 times per calendar month in the Baltic Proper main basin. The 4 m wave events can last 12 to 24 h even in the smaller basins (Fig. 2a).
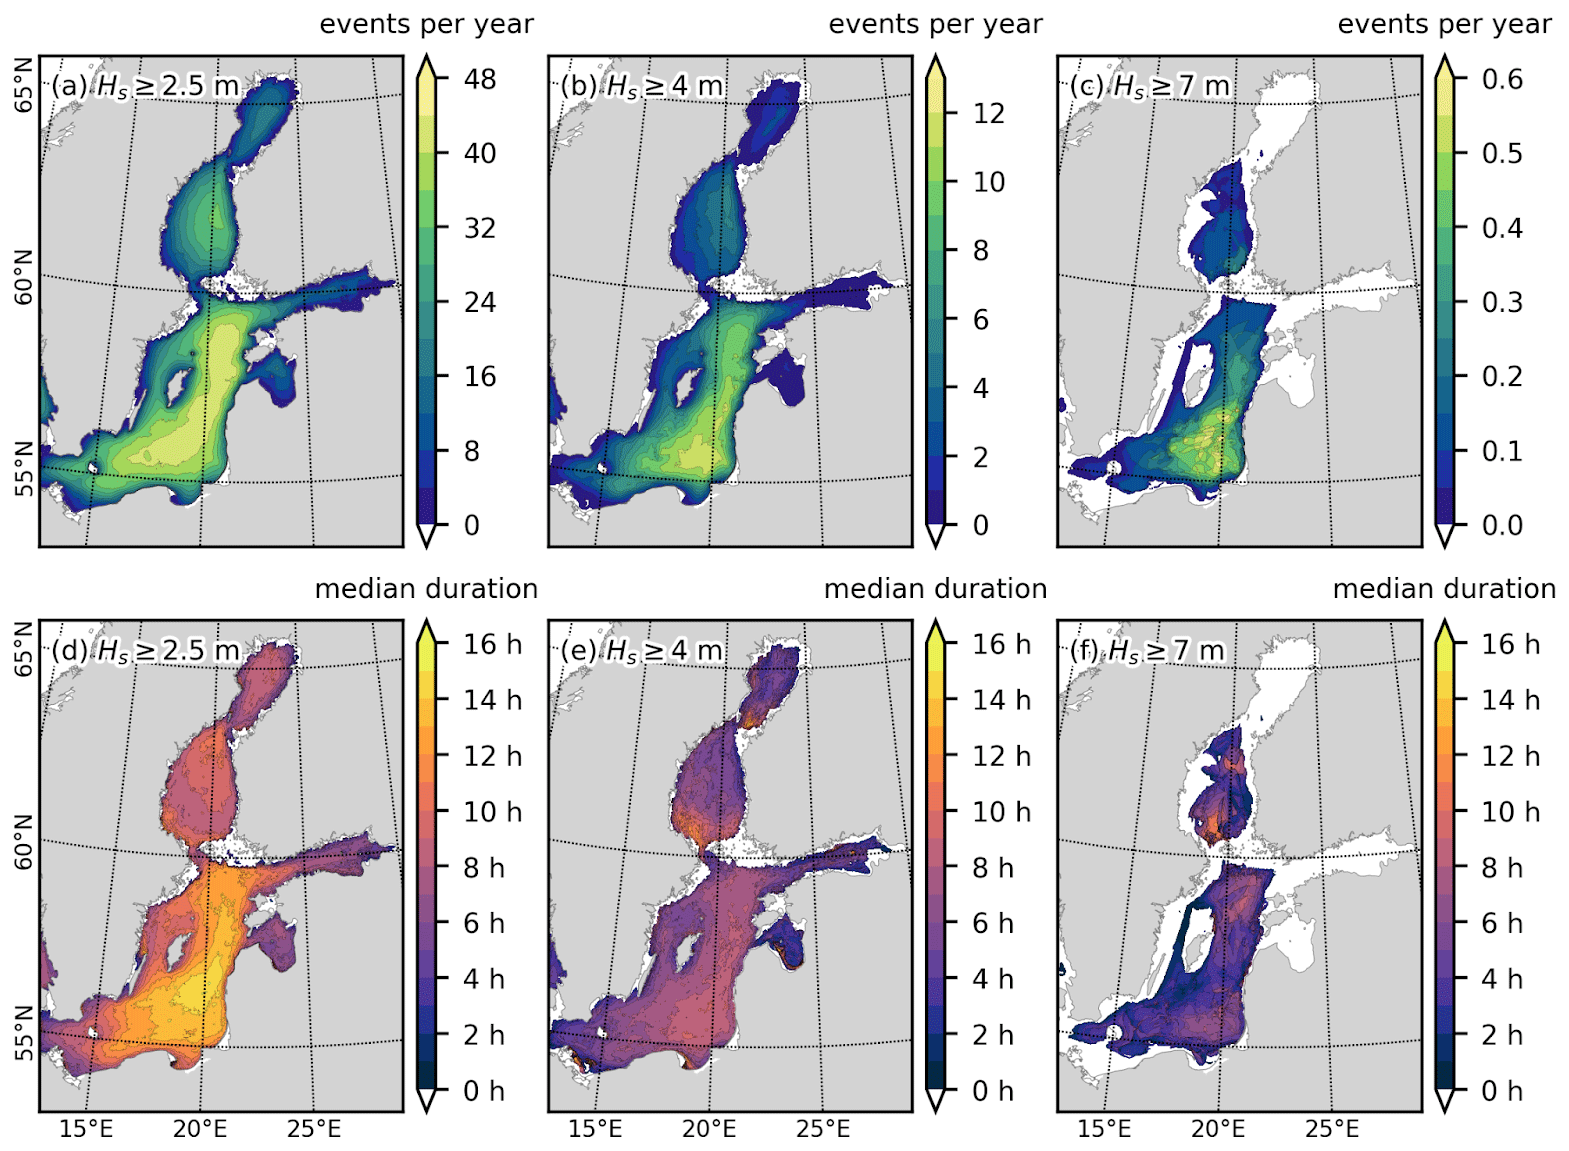
Figure 1Number of events per year (a–c) and median duration in hours (d–f) of cases where Hs exceeds different thresholds: 2.5 m (a, d), 4 m (b, e), and 7 m (c, f). Values are calculated from 29 years of hourly data from the Baltic Sea wave hindcast (product ref. no. 1, Table 1).
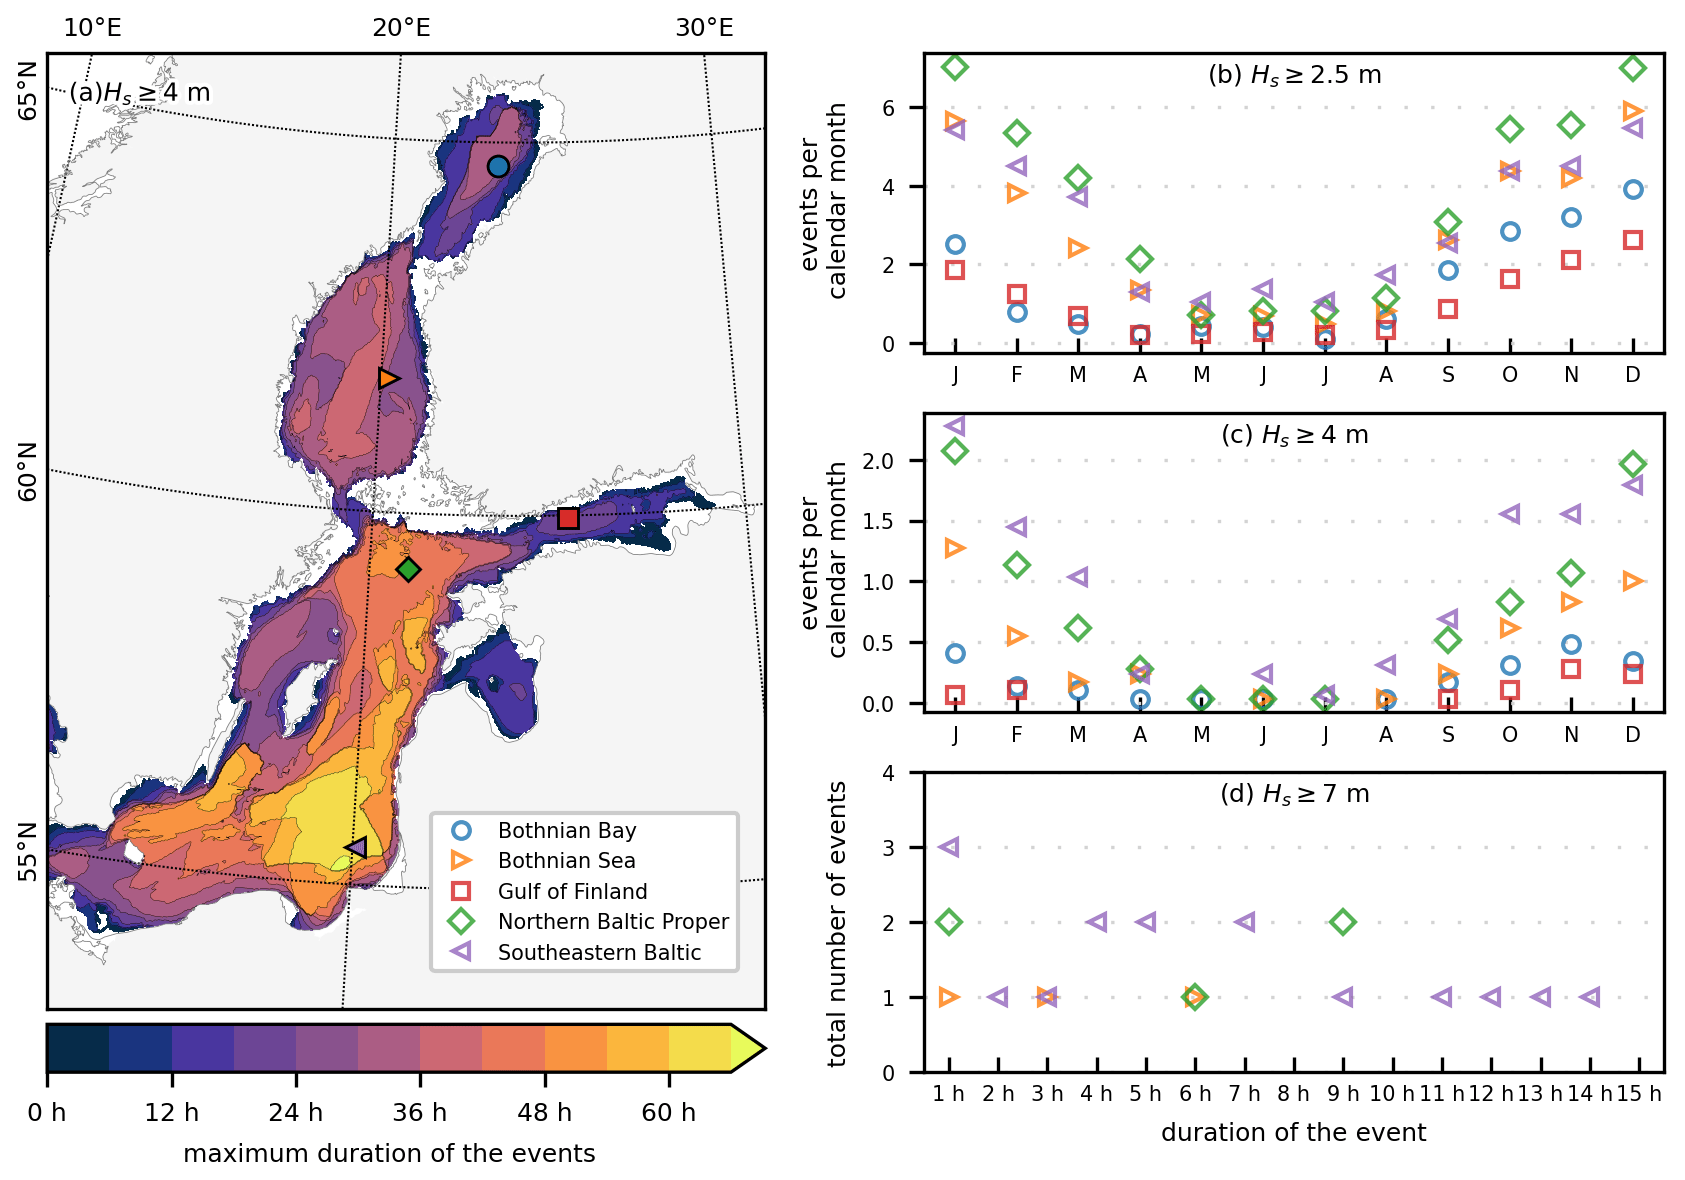
Figure 2The maximum duration of events during 1993–2021 where the significant wave height exceeded 4 m (a). The event incidence for thresholds of 2.5 and 4 m as a function of the calendar month (b and c). The number of events exceeding 7 m during the entire 29-year period as a function of the exceedance duration in hours (d). The symbols in panels (b)–(d) refer to the areas given in panel (a).
A 7 m wave event was rare enough that a monthly breakdown was not meaningful. Most such events (16 events) occurred in the southern part of the Baltic Sea, with only 5 events taking place in the northern Baltic Proper (Fig. 2d). The assessment of high waves as being most probable in the southeastern Baltic Proper is in line with Björkqvist et al. (2018), while e.g. Tuomi et al. (2011) and Räämet and Soomere (2010) place the highest waves in the northern part of the Baltic Proper. These differences might be explained by the shorter time period used by Tuomi et al. (2011) or the use of geostrophic winds by Räämet and Soomere (2010). No 7 m wave events occurred in the Gulf of Finland and the Bothnian Bay, which is in line with existing statistics (e.g. Tuomi et al., 2011; Björkqvist et al., 2018). The 7 m wave events typically lasted under 8 h, but one 14 h event was identified in the southeastern Baltic.
Wave conditions determine what operations, if any, fish farmers can perform near the facilities. Based on a survey with fish farmers, it is not feasible to feed the fish and do other operations in open-cage facilities when Hs is over 1 m. The EU Water Framework Directive requires aquaculture facilities to meet the environmental objectives for the ecological status. This asserts a pressure to establish new fish farms in open-sea areas, where their effect on the ecological status is mitigated by the more efficient transport and mixing of nutrients, instead of in coastal areas, where the ecological state of the water bodies is already weaker. Open-sea farms are exposed to harsher wave conditions, but the activities take place during the growth season for the fish (i.e. May–October for rainbow trout) when the waves are lower.
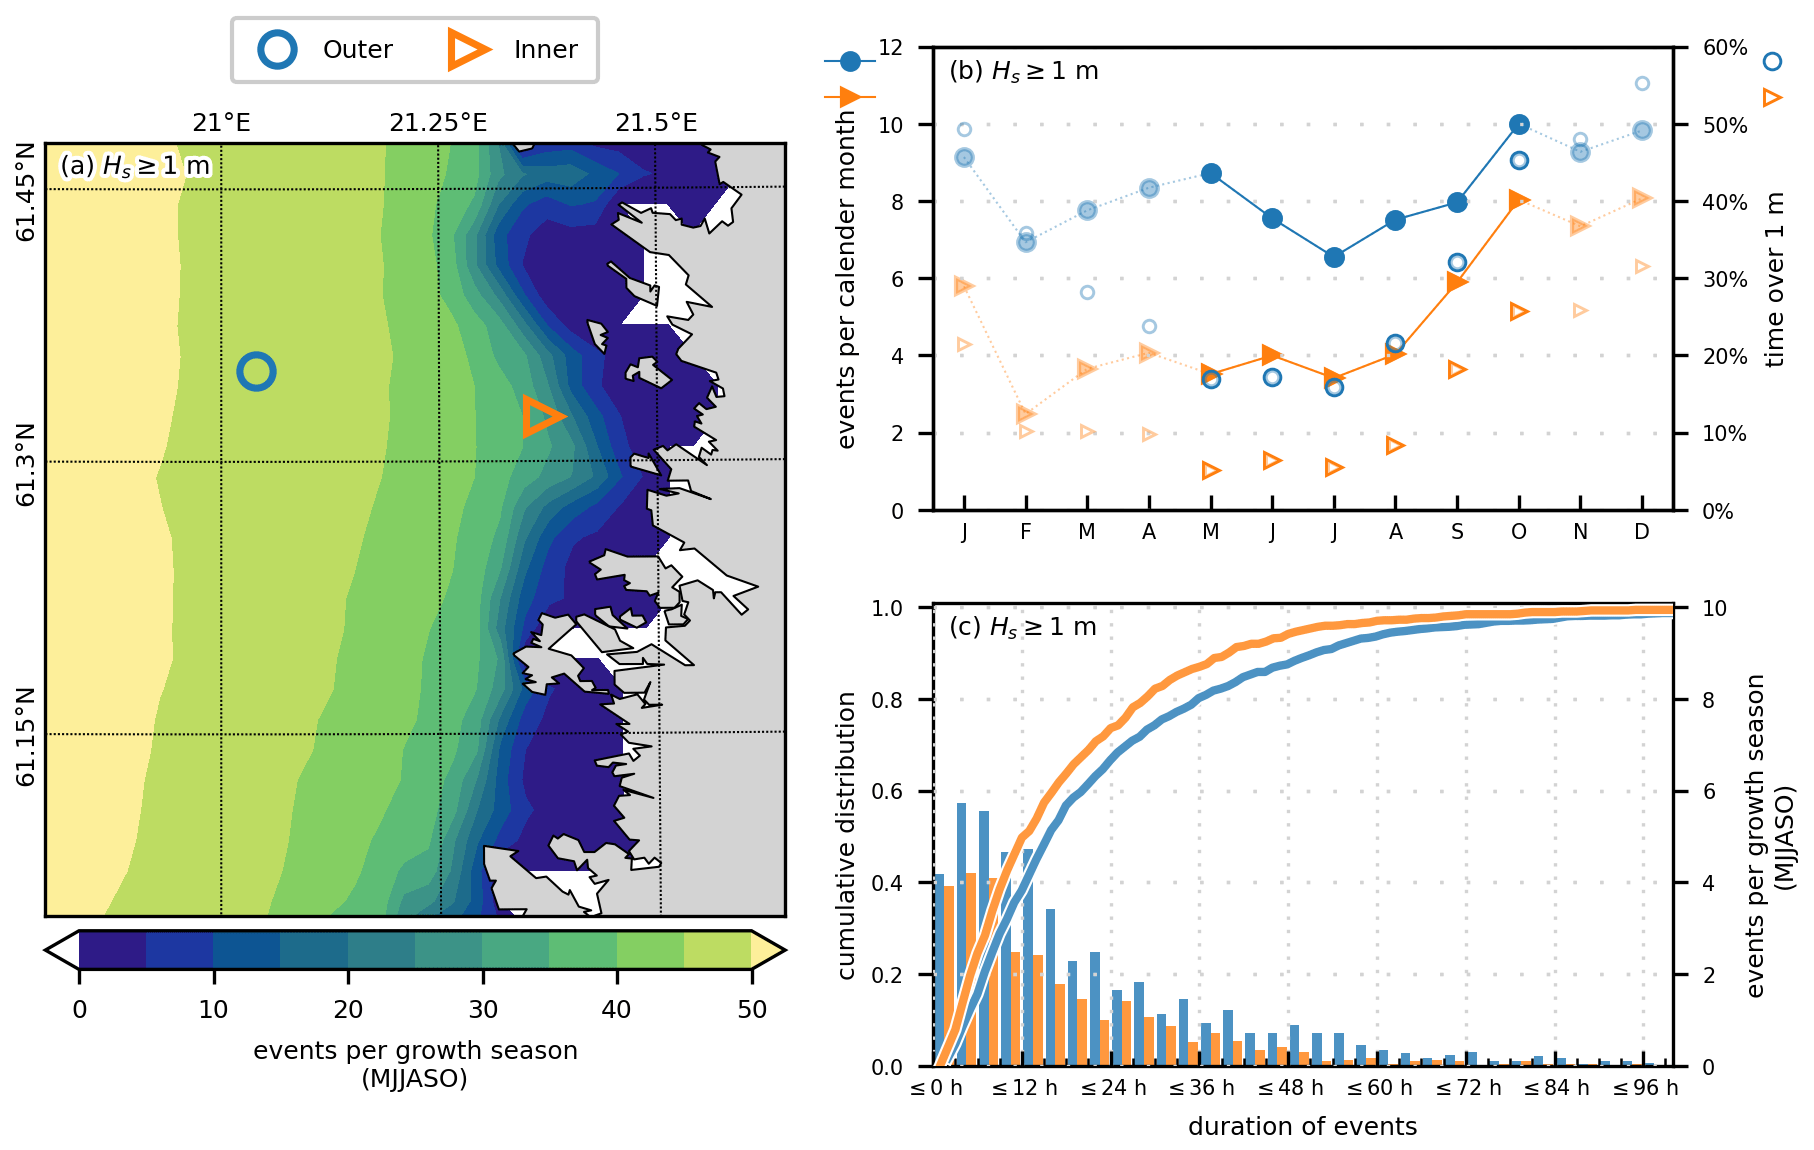
Figure 3Events when the significant wave height (Hs) exceeded 1 m during the growth season of rainbow trout in Finland (May to October). Number of exceedances per growth season (a), event occurrence from two locations as a function of calendar month (b, left axis, filled symbols), and percentage of time Hs stayed over 1 m (b, right axis, empty symbols). The duration of events during the growth season is presented as solid lines, and the number of each event length is indicated in a histogram (c). The bin size of the histogram is 3 h so that the first blue and orange bars correspond to event durations of 1, 2, and 3 h. Symbols and colours in panels (b) and (c) correspond to locations in panel (a).
We determined events when Hs exceeded 1 m for a nearshore area where fish farms are planned. We investigated the difference between two locations: one located ca. 10 km from the shoreline and the second ca. 20 km further out (Fig. 3). For the inner location, Hs exceeded 1 m around four times per calendar month during May–August. In September and October the numbers were six and eight times respectively – comparable to winter conditions. In the outer location, Hs exceeded 1 m roughly six to nine times per calendar month during May–September. Again, the conditions in October (10 times) were comparable to November–January outside the growth season.
For the more exposed location, Hs exceeded 1 m a larger percent of the times during the winter than during the summer, but this was not reflected in a significant increase in the number of 1 m wave events; the harsher winter wave climate simply caused longer events (Fig. 3). Half of the events lasted less than 12 h at the inner station and less than 15 h at the outer station. Nevertheless, even during the calmer growth season, 25 %–35 % of the events lasted over 24 h (Fig. 3c). An event lasting over 3 d is expected, on average, once every other growth season at the inner station and twice per growth season at the outer station. Still, considerably longer events are still possible: 5 events at the inner station and 18 at the outer station lasted over 100 h, all during September or October. The longest event in September 1997 lasted 13 d at the outer station.
For certain applications, such as fatigue calculations, time-averaged values contain relevant information. Nonetheless, for many operations at sea – heavy commercial traffic, light recreational boating, or operations at installations like fish farms – information on how often and for how long a certain wave height is exceeded might be more important than simply knowing how many hours per year the threshold is exceeded.
A number of hours per year can mean a few long events or frequent shorter events. The type of operation and the amount of flexibility allowed in the planning and execution determine the impact of the event frequency and length. For example, fish farm operations with a small boat might need to be put on hold by a relatively low sea state. Nonetheless, the flexibility in the timing will allow for adaptive execution if adequate wave forecasts exist. Larger vessels, again, can withstand higher wave heights but typically run on a tight schedule, although with a possible slight leeway to accommodate passenger comfort, in the case of passenger ferries, and fuel consumption (Jalkanen et al., 2012).
The wave conditions in the Baltic Sea depend on the season and the ice cover (e.g. Tuomi et al., 2011). Our results suggest that wave conditions also vary significantly within one season, highlighting the value of monthly statistics. Monthly statistics are especially useful when activities span only part of the year, with operations carried out at the beginning and end of the season.
The example used in this study is fish farming, where high waves make it difficult to feed the fish or conduct other operations. Floating fish farms also need to be installed and removed at specific time windows at the beginning and the end of the growth season for the fish. Moreover, all operations also depend on what kind of equipment, e.g. boat, is used. Fish farmers install fish cages around May and remove them in September or October. The towing of the fish cages should be done during calm sea conditions, but the process can take a considerable time since it is done at a speed of only 2–4 knots. Finding a window of possibility for towing is therefore highly relevant for the fish farmers.
The EU Water Framework Directive and, especially, the ECJ Weser ruling 2015 impact where it is feasible to grow fish. The ruling directly obligates member states, unless given an exemption, to reject projects that could potentially degrade the condition of a water body or endanger the achievement of its objectives. This ruling is central in balancing between the ecological status of the water and the desire to increase sustainable growth in the marine and maritime sectors as laid out in e.g. the EU Blue Growth Strategy. Therefore, even if aquaculture accounts for only 1 %–2 % of the total nutrient load to the Baltic Sea, this ruling has had a great impact on the allocation of new fish farms. The directive favours broad and open-sea areas where the impact of open-caged fish farms on the environment is mitigated, even though harsher environmental conditions mean less favourable conditions for practical operations, such as towing.
Also, other offshore operations might benefit from event-based statistics. For example, similar statistics can be used to plan the construction and maintenance of offshore wind farms. The method presented here can be applied to any threshold and variable relevant for the given operation. Furthermore, simultaneous information about, for example, the wave direction or wave period can also be extracted. This can be used to analyse wave events from a certain direction or with a certain steepness.
Based on a numerical hindcast we determined all individual wave events where the significant wave height (Hs) exceeded 2.5, 4, and 7 m in the Baltic Sea for the years 1993–2021. For a limited nearshore area in the Bothnian Sea we also determined events where the significant wave height exceeded 1 m.
The number of 2.5 and 4 m wave events was seasonal. A 7 m wave event occurred at most around 0.6 times per year on average and only in the Baltic Proper and Bothnian Sea. The median duration of 4 m wave events was less than 10 h in almost the entire Baltic Sea, but even 7 m wave events that last up to 15 h seem to be possible. Such long events are difficult to circumvent, and, while heavy marine traffic can mostly operate in any conditions in the Baltic Sea, the sea state will affect the fuel consumption and might cause delays.
The Bothnian Sea case study targeted conditions relevant specifically for fish farming and therefore focused on the growth season for rainbow trout (May–October). Based on a questionnaire, a 1 m Hs was found to be potentially disruptive for operations at fish farms that are typically carried out with small boats. We determined that the number of 1 m wave events in the growth season can potentially double if the fish farms are moved from 10 to 30 km from the shore. Since open-sea locations might otherwise be favoured because of e.g. nutrient loads, the challenges from harsher weather conditions need to be balanced with regulatory requirements and environmental concerns.
The data containing the individual wave events for the thresholds used in this paper and the Python code to determine wave events for other thresholds from the original data, along with code to reproduce the figures of the papers, are available from the FMI data storage (https://doi.org/10.57707/fmi-b2share.fad6a08688ab493b9f8e5d0fdf5db432, Kanarik et al., 2024). Please see Table 1 for additional data sets that have been used in this study.
The study was initiated by LT, JVB, and HK. The methodology for computing the statistics was designed by HK, JVB, and LT and implemented by HK. HK calculated the wave statistics and performed the additional model validation. The case study was designed by LN and MK in collaboration with the other authors. The original version of the paper was prepared by JVB and HK and revised by all authors.
The contact author has declared that none of the authors has any competing interests.
Publisher’s note: Copernicus Publications remains neutral with regard to jurisdictional claims made in the text, published maps, institutional affiliations, or any other geographical representation in this paper. While Copernicus Publications makes every effort to include appropriate place names, the final responsibility lies with the authors.
We want to thank Tarmo Soomere and the two ananymous reveiwers. Their constructive comments helped us improve the final version of our manuscript.
This research has been supported by the European Maritime and Fisheries Fund (grant no. 33436) and the EU Copernicus Marine Service Programme.
This paper was edited by Joanna Staneva and reviewed by Tarmo Soomere and two anonymous referees.
Björkqvist, J.-V., Tuomi, L., Tollman, N., Kangas, A., Pettersson, H., Marjamaa, R., Jokinen, H., and Fortelius, C.: Brief communication: Characteristic properties of extreme wave events observed in the northern Baltic Proper, Baltic Sea, Nat. Hazards Earth Syst. Sci., 17, 1653–1658, https://doi.org/10.5194/nhess-17-1653-2017, 2017.
Björkqvist, J.-V., Lukas, I., Alari, V., van Vledder, G. Ph., Hulst, S., Pettersson, H., Behrens, A., and Männik, A.: Comparing a 41-year model hindcast with decades of wave measurements from the Baltic Sea, Ocean Eng., 152, 57–71, https://doi.org/10.1016/J.OCEANENG.2018.01.048, 2018.
Björkqvist, J.-V., Kahma, K. K., Johansson, M., Jokinen, H., Leijala, U., Särkkä, J., Tikka K., and Tuomi, L.: Turvalliset rakentamiskorkeudet Helsingin rannoilla, Kaupunkiympäristön julkaisuja 2019:20, https://www.hel.fi/static/liitteet/kaupunkiymparisto/julkaisut/julkaisut/julkaisu-20-19.pdf (last access: 12 June 2023), 2019.
Björkqvist, J.-V., Rikka, S., Alari, V., Männik, A., Tuomi, L., and Pettersson, H.: Wave height return periods from combined measurement–model data: a Baltic Sea case study, Nat. Hazards Earth Syst. Sci., 20, 3593–3609, https://doi.org/10.5194/nhess-20-3593-2020, 2020.
Charles, E. and Ollivier, A.: EU Copernicus Marine Service Quality Information Document for Global Ocean L 3 Significant Wave Height From Reprocessed Satellite Measurements, WAVE_GLO_PHY_SWH_L3_MY_014_005, Issue 1.0, Mercator Ocean International, https://catalogue.marine.copernicus.eu/documents/QUID/CMEMS-WAV-QUID-014-005.pdf (last access: 13 June 2023), 2021.
Cieślikiewicz, W. and Paplińska-Swerpel, B.: A 44-year hindcast of wind wave fields over the Baltic Sea, Coast. Eng., 55, 894–905, https://doi.org/10.1016/j.coastaleng.2008.02.017, 2008.
EU Copernicus Marine Service Product: Global Ocean L 3 Significant Wave Height From Reprocessed Satellite Measurements, Mercator Ocean International [data set], https://doi.org/10.48670/moi-00176, 2021.
EU Copernicus Marine Service Product: Baltic Sea Wave Hindcast, Mercator Ocean International [data set], https://doi.org/10.48670/moi-00014, 2023a.
EU Copernicus Marine Service Product: Global Ocean L 3 Significant Wave Height From Nrt Satellite Measurements, Mercator Ocean International [data set], https://doi.org/10.48670/moi-00179, 2023b.
Faltinsen, O. M. and Shen, Y.: Wave and Current Effects on Floating Fish Farms, J. Marine. Sci. Appl., 17, 284–296, https://doi.org/10.1007/s11804-018-0033-5, 2018.
Hanson, H. and Larson, M.: Implications of extreme waves and water levels in the southern Baltic Sea, J. Hydraul. Res., 46, 292–302, https://doi.org/10.1080/00221686.2008.9521962, 2008.
Husson, R., and Charles, E.: EU Copernicus Marine Service Product User for Global Ocean L 3 Significant Wave Height From Reprocessed Satellite Measurements, WAVE_GLO_PHY_SWH_L3_MY_014_005, Issue 2.0, Mercator Ocean International, https://catalogue.marine.copernicus.eu/documents/PUM/CMEMS-WAV-PUM-014-005-006-007.pdf (last access: 13 June 2023), 2021.
Jalkanen, J.-P., Johansson, L., Kukkonen, J., Brink, A., Kalli, J., and Stipa, T.: Extension of an assessment model of ship traffic exhaust emissions for particulate matter and carbon monoxide, Atmos. Chem. Phys., 12, 2641–2659, https://doi.org/10.5194/acp-12-2641-2012, 2012.
Kanarik, H., Björkqvist, J.-V., and Tuomi, L.: Data and code for the article “Event-based wave statistics for the Baltic Sea” by Björkqvist et al. (2024), Finnish Meteorological Institute [code and data set], https://doi.org/10.57707/fmi-b2share.fad6a08688ab493b9f8e5d0fdf5db432, 2024.
Karathanasi F. E., Soukissian T. H., and Hayes D. R.: Wave Analysis for Offshore Aquaculture Projects: A Case Study for the Eastern Mediterranean Sea, Climate, 10, 2, https://doi.org/10.3390/cli10010002, 2022.
Kudryavtseva, N., Räämet, A., and Soomere, T.: Coastal Flooding: Joint Probability of Extreme Water Levels and Waves along the Baltic Sea Coast, J. Coastal Res., 95, 1146–1151, https://doi.org/10.2112/SI95-222.1, 2020.
Leijala, U., Björkqvist, J.-V., Johansson, M. M., Pellikka, H., Laakso, L., and Kahma, K. K.: Combining probability distributions of sea level variations and wave run-up to evaluate coastal flooding risks, Nat. Hazards Earth Syst. Sci., 18, 2785–2799, https://doi.org/10.5194/nhess-18-2785-2018, 2018.
Lindgren, E., Tuomi, L., and Huess, V.: EU Copernicus Marine Service Quality Information Document for the Baltic Sea Wave Hindcast, BALTICSEA_REANALYSIS_WAV_003_015, Issue 1.1, Mercator Ocean International, https://catalogue.marine.copernicus.eu/documents/QUID/CMEMS-BAL-QUID-003-015.pdf (last access: 8 April 2024), 2023a.
Lindgren, E., Tuomi, L., Huess, V. and Kanarik, H.: EU Copernicus Marine Service Product User for the Baltic Sea Wave Hindcast, BALTICSEA_REANALYSIS_WAV_003_015, Issue 1.2, Mercator Ocean International, https://catalogue.marine.copernicus.eu/documents/PUM/CMEMS-BAL-PUM-003-015.pdf (last access: 8 April 2024), 2023b.
Mertz, F., Husson, R., Taburet, N., Charles E., Estimbre, J.-J. and Ghantous, M.: EU Copernicus Marine Service Product User Manual for Global Ocean L 3 Significant Wave Height From Nrt Satellite Measurements, WAVE_GLO_PHY_SWH_L3_NRT_014_001, Issue 2.3, Mercator Ocean International, https://catalogue.marine.copernicus.eu/documents/PUM/CMEMS-WAV-PUM-014-001-002-003-004.pdf (last access: 8 April 2024), 2023.
NSF: Flytende oppdrettsanlegg, Krav til utforming, dimensjonering, utførelse, installasjon og drift (Marine fish farms, Requirements for design, dimensioning, production, installation and operation), Norsk Standard NS 9415, 75 pp., https://online.standard.no/nb/ns-9415-2003 (last access: 27 May 2024), 2003.
Räämet, A. and Soomere, T.: The wave climate and its seasonal variability in the northeastern Baltic Sea, Est. J. Earth Sci., 59, 100–113, https://doi.org/10.3176/earth.2010.1.08, 2010.
Semedo, A., Sušelj, K., Rutgersson, A., and Sterl, A.: A global view on the wind sea and swell climate and variability from ERA-40, J. Climate, 24, 1461–1479, https://doi.org/10.1175/2010JCLI3718.1, 2011.
Semedo, A., Vettor, R., Breivik, Ø., Sterl, A., Reistad, M., Soares, C. G., and Lima, D.: The wind sea and swell waves climate in the Nordic seas, Ocean Dynam., 65, 223–240, https://doi.org/10.1007/s10236-014-0788-4, 2015.
Soomere, T. and Viška, M.: Simulated wave-driven sediment transport along the eastern coast of the Baltic Sea, J. Marine Syst., 129, 96–105, https://doi.org/10.1016/j.jmarsys.2013.02.001, 2014.
Soomere, T., Behrens, A., Tuomi, L., and Nielsen, J. W.: Wave conditions in the Baltic Proper and in the Gulf of Finland during windstorm Gudrun, Nat. Hazards Earth Syst. Sci., 8, 37–46, https://doi.org/10.5194/nhess-8-37-2008, 2008.
Soomere, T., Pindsoo, K., Kudryavtseva, N., and Eelsalu, M.: Variability of distributions of wave set-up heights along a shoreline with complicated geometry, Ocean Sci., 16, 1047–1065, https://doi.org/10.5194/os-16-1047-2020, 2020.
Taburet, N., Husson, R., Charles, E., Jettou, G., Philip, A., Philipps, S., Ghantous, M., and Kocha, C.: EU Copernicus Marine Service Quality Information Document for Global Ocean L 3 Significant Wave Height From Nrt Satellite Measurements, WAVE_GLO_PHY_SWH_L3_NRT_014_001, Issue 3.4, Mercator Ocean International, https://catalogue.marine.copernicus.eu/documents/QUID/CMEMS-WAV-QUID-014-001.pdf (last access: 8 April 2024), 2023.
Tuomi, L., Kahma, K. K., and Pettersson, H.: Wave hindcast statistics in the seasonally ice-covered Baltic Sea, Boreal Environ. Res., 16, 451–472, 2011.
Vanem, E.: A regional extreme value analysis of ocean waves in a changing climate, Ocean Eng., 144, 277–295, https://doi.org/10.1016/j.oceaneng.2017.08.027, 2017.
Young, I. R., Zieger, S., and Babanin, A. V.: Global Trends in Wind Speed and Wave Height, Science, 332, 451–455, https://doi.org/10.1126/science.1197219, 2011.
- Abstract
- Introduction
- Data and model accuracy
- Survey with fish farmers
- Definition of wave events
- Baltic Sea-wide statistics
- Coastal case study
- Discussion
- Conclusions
- Code and data availability
- Author contributions
- Competing interests
- Disclaimer
- Acknowledgements
- Financial support
- Review statement
- References