the Creative Commons Attribution 4.0 License.
the Creative Commons Attribution 4.0 License.
 | 27 Sep 2023 | OSR7 | Chapter 2.7
Ocean heat content in the Iberian–Biscay–Ireland regional seas
Álvaro de Pascual-Collar
Roland Aznar
Bruno Levier
Marcos García-Sotillo
The ocean has the largest heat capacity of any single component of the climate system and plays a key dominant role in global heat content changes. To analyse ocean heat content (OHC) variability in the Iberia–Biscay–Ireland (IBI) region, several Copernicus Marine reanalysis and observational products are used together to provide multi-product estimations of OHC anomalies over the water column (at upper layers 150, 700, and 2000 m). This work provides a study of spatial and temporal variability of OHC in the northeastern Atlantic region through the analysis of area-averaged time series, trend maps, and trends linked with the main water masses found in the IBI region.
The work states the key role that subsurface water masses play in the OHC trends in the IBI region. The study shows that, although no significant trends are detected for the surface water layers, the intermediate and deep water layers show significant trends (with rates of +0.40 W m−2). However, the high interannual variability of the subsurface water masses masks these trends. Two of the main water masses described in the region (i.e. Sub-Arctic Intermediate Water and Mediterranean Outflow Water) are found to explain more than 50 % of the OHC variability. Since the variability of both water masses is linked to the North Atlantic Oscillation, the work shows the mechanisms by which atmospheric forcing is able to affect the subsurface water layers without showing a signal in the surface.
- Article
(4671 KB) - Full-text XML
-
Supplement
(621 KB) - BibTeX
- EndNote


Table 1List of Copernicus Marine products used for the computation of ocean heat content (OHC) in the Iberia–Biscay–Ireland region (IBI).

It is well established that the main storage (> 90 %) of extra heat from increasing greenhouse gases is absorbed by the oceans; consequently, oceans are the dominant source of changes in global warming (Levitus et al., 2005, 2012; Trenberth et al., 2014; Cheng et al., 2017; von Schuckmann et al., 2020; Gulev et al., 2021). Additionally, the heat stored in oceans has increased during the last decades at basin and global scales (Gulev et al., 2021; Abraham et al., 2013). Therefore, ocean heat content (OHC) is one of the six global climate indicators recommended by the World Meteorological Organization for Sustainable Development Goal 13 implementation (WMO, 2017).
Ideally, the estimations of OHC are integrated over the full depth of the ocean, but for limitations related to the observing system, this is typically done from the ocean's surface down to a reduced depth (such as 700 or 2000 m). The choice of these levels is due to the fact before the year 2000, temperature measurements were most often taken in the upper 700 m of the water column, but by about 2005 the Argo array had sufficient space–time sampling to yield an improved measurement of OHC down to a depth of 2000 m (von Schuckmann et al., 2016; Abraham et al., 2013; Cheng et al., 2022, 2017).
The Copernicus Marine service provides marine data covering the global ocean and European seas, splitting them into six different regions. One of those, the Iberian–Biscay–Ireland (IBI) region, covers the northeastern Atlantic from the Canary Islands (26∘ N) up to Ireland (55∘ N), being limited by the 20∘ W meridian and the continental margin. Among the variety of hydrographic processes taking place in the IBI region we could mention the northern limit of the Canary Current, the upwelling system that influences the Iberian Peninsula and African coasts, the spreading Mediterranean waters that influence the intermediate hydrographic properties and promote the formation of long-lasting eddies, and the influence of the eastern closure of the subtropical gyre that brings warm waters from the Gulf Stream, influencing the climate of western Europe. In this region, the literature describes a number of water masses but three groups of salinity extrema mainly determine the intermediate hydrographic structure: a subsurface salinity minima connected with Sub-Arctic Intermediate Water (SAIW) at potential density anomalies 27.3 < σθ kg m−3, salinity maxima connected with Mediterranean Outflow Water (MOW) at the neutral density 27.25 < σθ < 27.45 kg m−3, and salinity minima connected with Labrador Sea Water (LSW) underneath the isopycnal 27.8 > σθ kg m−3 (Talley and McCarney, 1982; Iorga and Lozier, 1999a, b; van Aken, 2000; Prieto et al., 2013; de Pascual-Collar et al., 2019). The density ranges for these water masses show considerable overlap, which allows both diapycnal and isopycnal mixing.
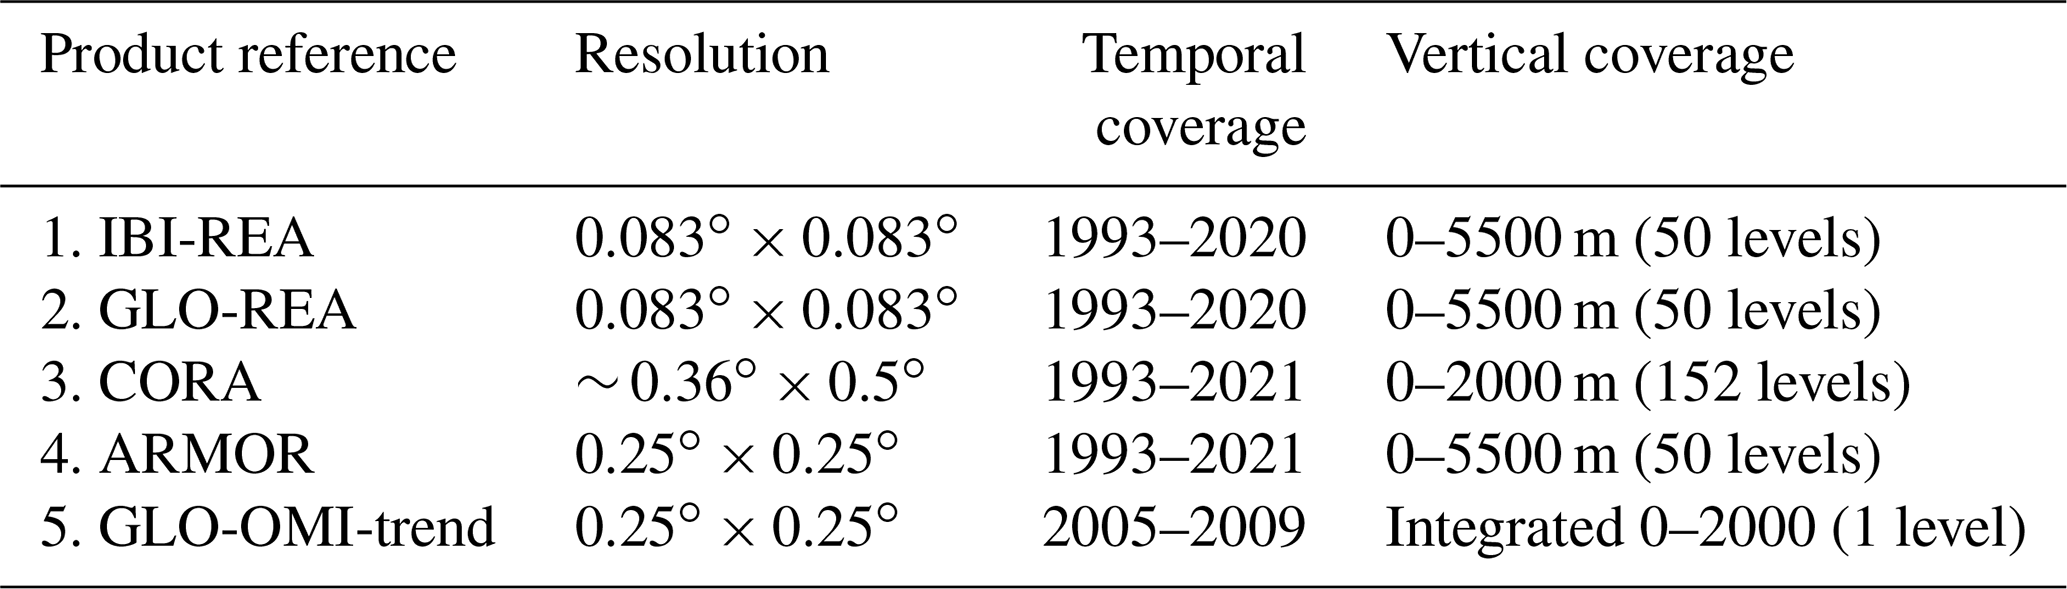
Among the Copernicus Marine Service products are the Ocean Monitoring Indicators (OMIs), which are free downloadable trends and datasets covering the past quarter of a century. These are indicators that allow us to track the vital health signs of the ocean and changes in line with climate change. These OMIs are proposed to cover the blue ocean, e.g. the mean volume transport across sections from Reanalysis OMI (GLOBAL_OMI_WMHE_voltrp); the green ocean, e.g. the chlorophyll a time series and trends from Observations Reprocessing OMI (OMI_HEALTH_CHL_GLOBAL_OCEANCOLOUR_trend); and the white ocean, e.g. the sea ice extent OMI (ARCTIC_OMI_SI_extent). Among the multiple OMIs provided by Copernicus Marine, an important family includes the indicators focused on evaluating OHC trends and variability. Particularly, the indicator GLOBAL_OMI_OHC_trend (see Tables 1 and 2 for more details on the product; hereafter this product will be referred to as GLO-OMI-trend) provides a global map of trends of OHC integrated in the upper 2000 m. Attending to the spatial variability of trends in the IBI region, this global OMI shows spatial variability of trends, ranging from negative trends of −5 W m−2 northward of the parallel 40∘ N up to positive trends of 2.5 W m−2 observed westward of the Gulf of Cádiz. However, this global information should be treated cautiously when looking at regions close to coastal areas and marked by the combination of on-shelf and open waters, such as occurs in the IBI domain.
In the last decades, the upper North Atlantic Ocean experienced a reversal of climatic trends for temperature and salinity. While the period 1990–2004 is characterised by decadal-scale ocean warming, the period 2005–2014 shows a substantial cooling and freshening (González-Pola et al., 2020; Holliday et al., 2020; Somavilla et al., 2009). Such changes are discussed to be linked to ocean internal dynamics and air–sea interactions (Fox-Kemper et al., 2021; Collins et al., 2019; Robson et al., 2016), together with changes linked to the connectivity between the North Atlantic Ocean and the Mediterranean Sea (Masina et al., 2022). Previous works show a consistency of regional OHC with this decadal-scale variability in the IBI region (von Schuckmann et al., 2016, 2018); however, in spite of the year-to-year variability, a long-term warming trend of 0.9 ± 0.4 W m−2 in the upper 700 m of the IBI region is also detected. These studies concluded that the Earth's positive energy imbalance dominates the observed regional changes around Europe, but the year-to-year variability in the region potentially masks the long-term warming trend.
Since the distribution of various water masses is one of the main sources of variability (spatial and temporal) in the IBI region, analysis of the heat stored by them can provide information on OHC trends at regional and local scales. For example, Potter and Lozzier (2004), based on 50 years of hydrographic data, studied the temperature and salinity trends of the MOW, finding positive trends that lead to a heat content gain in the MOW reservoir that surpasses the average gain of the North Atlantic basin. Nonetheless, the literature on OHC variability of specific water masses in the IBI region is rather limited. Alternatively, since several studies have concentrated efforts on assessing the thermohaline variability of water masses, they may provide some clues as to what can be expected with respect to OHC.
Regarding the SAIW, Leadbetter et al. (2007) studied the temperature variability of the water column in the period 1981–2005 in a section at 36∘ N, concluding that the variability in the SAIW is consistent with the displacement of neutral density surfaces driven by changes in surface wind forcing and linked with North Atlantic Oscillation (NAO).
Several studies have focused on the temporal variability of MOW. The analysis of hydrographic properties in the MOW core concluded that changes in MOW properties are not dominated by changes in Mediterranean Sea Water properties (Lozier and Sindlinger, 2009; Bozec et al., 2011). However, the variability of MOW is strongly influenced by year-to-year processes. Some studies described the MOW interannual variability as an oscillation of the water tongue shifting the dominant spreading pathway and interacting with the underlying water masses such as North Atlantic Deep Water and LSW (Bozec et al., 2011; de Pascual-Collar et al., 2019); this variability is also correlated with NAO.
The interannual variability of LSW has been described in previous works, concluding that some of the variability in the water mass can be explained by diapycnal mixing with the overlying MOW (van Aken, 2000) as well as changes in the source regions over the North Atlantic basin (Leadbetter et al., 2007). Additionally, Bozec et al. (2011) studied the distribution of LSW and MOW from 1950 to 2006, observing a coupling between the spreading areas of both water masses and the NAO index.
The present work pursues two main objectives: on one hand, the availability of higher-resolution specific regional products allows us to refine the study of OHC trends in the IBI region; thus, this work explores the spatial and temporal variability of OHC trends in the region as well as explaining its causes in the period 1993–2021, providing a better understanding of the processes controlling such trends. Additionally, since OMIs are simplified indicators that statistically summarise ocean information, a study of the oceanographic processes behind each indicator is needed to have a proper understanding of the changes represented by the OMI. Thus, the work analyses the use and interpretation of OHC OMIs on regional scales and its sources of variability and uncertainty.
This paper is organised as follows: Sect. 2 presents the datasets used, as well as the methodology applied, to compute the OHC in the IBI region. In Sect. 3 the time series of OHC averaged over the whole IBI region are discussed to provide a general view of the regional trends estimated. Section 4 is devoted to showing and discussing maps of trends computed in the same way as the ones provided in the GLO-OMI-trend product. Section 5 analyses the vertical profiles of OHC trends, studying the variability associated with different water masses. Section 6 summarises the availability of the data used in this article. Finally, main conclusions are summed up in Sect. 7.
Following the same methodology as in previous Copernicus Marine Ocean State Report contributions (Lima et al., 2020; Mayer et al., 2021), the estimates of OHC anomalies were computed in the IBI region according to the follow equation:
where ρ0 is the density at a reference depth (ρ0 = 1020 kg m−3), Cp is the specific heat capacity (Cp = 4181.3 J kg−1 ∘C−1), z1 and z2 are the range of depths to compute the total OHC, Tm is the monthly average potential temperature at a specific depth, and Tclim is the climatological potential temperature of the corresponding month and depth.
As can be seen in Eq. (1), the OHC anomalies are obtained from integrated differences between the monthly temperature and the climatological one along a vertical profile in the ocean. In the present work the anomalies have been referenced to the monthly climatology computed between 1993 and 2019. Additionally, the OHC is presented for the typical depths of 700 and 2000 m, but also for the upper 150 m to analyse the OHC variability in the upper layer.
In order to allow assessing uncertainties of results, different Copernicus products were used to provide multi-product estimations of OHC; therefore, all results were previously computed for a collection of Copernicus products and combined to give an ensemble mean and the standard deviation of the ensemble. Since the objective of this work is the analysis of OHC in the IBI region integrating results from the surface down to a maximum of 2000 m depth, this study has included all Copernicus Marine products that deliver gridded data on potential temperature with vertical coverage from the surface down to at least 2000 m. As shown in Tables 1 and 2, four different products meet these stated conditions: two model reanalyses (the global and regional ones: GLO-REA and IBI-REA, respectively) and two observation-based products (CORA and ARMOR). It is worth mentioning that when OHC was computed, the GLO-REA product did not cover the year 2020, so that year was not considered in the mentioned product.
Each product used is supplied for specific vertical levels with specific thickness; all vertical integrations were computed taking into consideration the thickness of each product level. Similarly, since most of the products used are provided with regular lat–long grids, the surface of each grid cell depends on the latitude, and the spatial averages (when used in this study) were computed considering the specific surface of each product grid cell.
This work shows different results of OHC, mixing different products with specific spatial resolutions (see Table 2). The OHC has been computed for all products using Eq. (1) on the grid of the distributed products and integrating results (from the surface down to 150, 700, and 2000 m) using the product layer thicknesses. The presentation of the results as time series or as maps implies a difference in the way the results are averaged to compute the ensemble mean and spread. Regarding the time series of OHC, anomalies were calculated referenced to the climatic mean of the period 1993–2019. Then the vertical integrations and spatial average were obtained, preserving the service grid of each product. Therefore, the ensemble time series are averaged from time series computed over the service grid of each product. However, to compute ensemble results that comprise spatial information (i.e. results presented as maps), each ensemble member must be interpolated to obtain all estimations on the same grid. Since IBI-REA and GLO-REA products share the same grid, it was considered to be the reference grid; thus, CORA and ARMOR products were spatially interpolated. This interpolation was made over the OHC integrated on the respective layer before averaging the ensemble. The comparison of interpolated and non-interpolated results of each ensemble member did not show relevant changes in the field structure or mathematical artefacts.
This paper focuses on the analysis of OHC trends in the IBI regions. For this purpose, OHC trends are analysed on different time periods within the registry. The selection of time periods corresponds to different criteria such as the detection of trend changes, comparison of results with other works, or selection of periods representative of large-scale patterns. In the case of the analysis of vertical trend profiles (Sect. 5), the time record 1993–2021 has been divided into two periods characterised by a differentiated behaviour of the NAO (NOAA, 2022), considering that (i) the NAO index in 1994 was moderately positive and (ii) it has a minimum in 2010 and (iii) a maximum in 2018; the periods 1993–2010 and 2010–2019 were selected as representative of NAO changes in phase from positive to negative (period 1993–2010) and vice versa, from negative to positive (period 2010–2019; see Fig. S1 in the Supplement).
Figure 1 shows combined results of products IBI-REA, GLO-REA, CORA, and ARMOR (listed in Tables 1 and 2), with panels displaying the ensemble mean and the ensemble standard deviation of OHC for the period 1993–2021. Corresponding to the ensemble spread, time series reveal an increase in uncertainties when deeper layers are included (0–700 and 0–2000 m); this result can be explained by the decrease in observational data available in deeper levels. It is worth noting the decrease in uncertainties observed after 2003 in the time series integrated over the upper 2000 m. These differences in uncertainties are explained considering the remarkable improvement in the global ocean observing system achieved with the implementation of the global Argo array in 2005 (von Schuckmann et al., 2016; Abraham et al., 2013; Cheng et al., 2022, 2017). The period 1999–2001 shows larger uncertainties observed in the record. This indicates larger discrepancies between ensemble members in representing the minimum of OHC observed in this period. These discrepancies affect both the year when the minimum is reached (while GLO-PHY-REA estimates the minimum in 2000, the other products reach the minimum in 2001) and the magnitude of the minimum values (with all products agreeing on observed negative anomalies during this year).
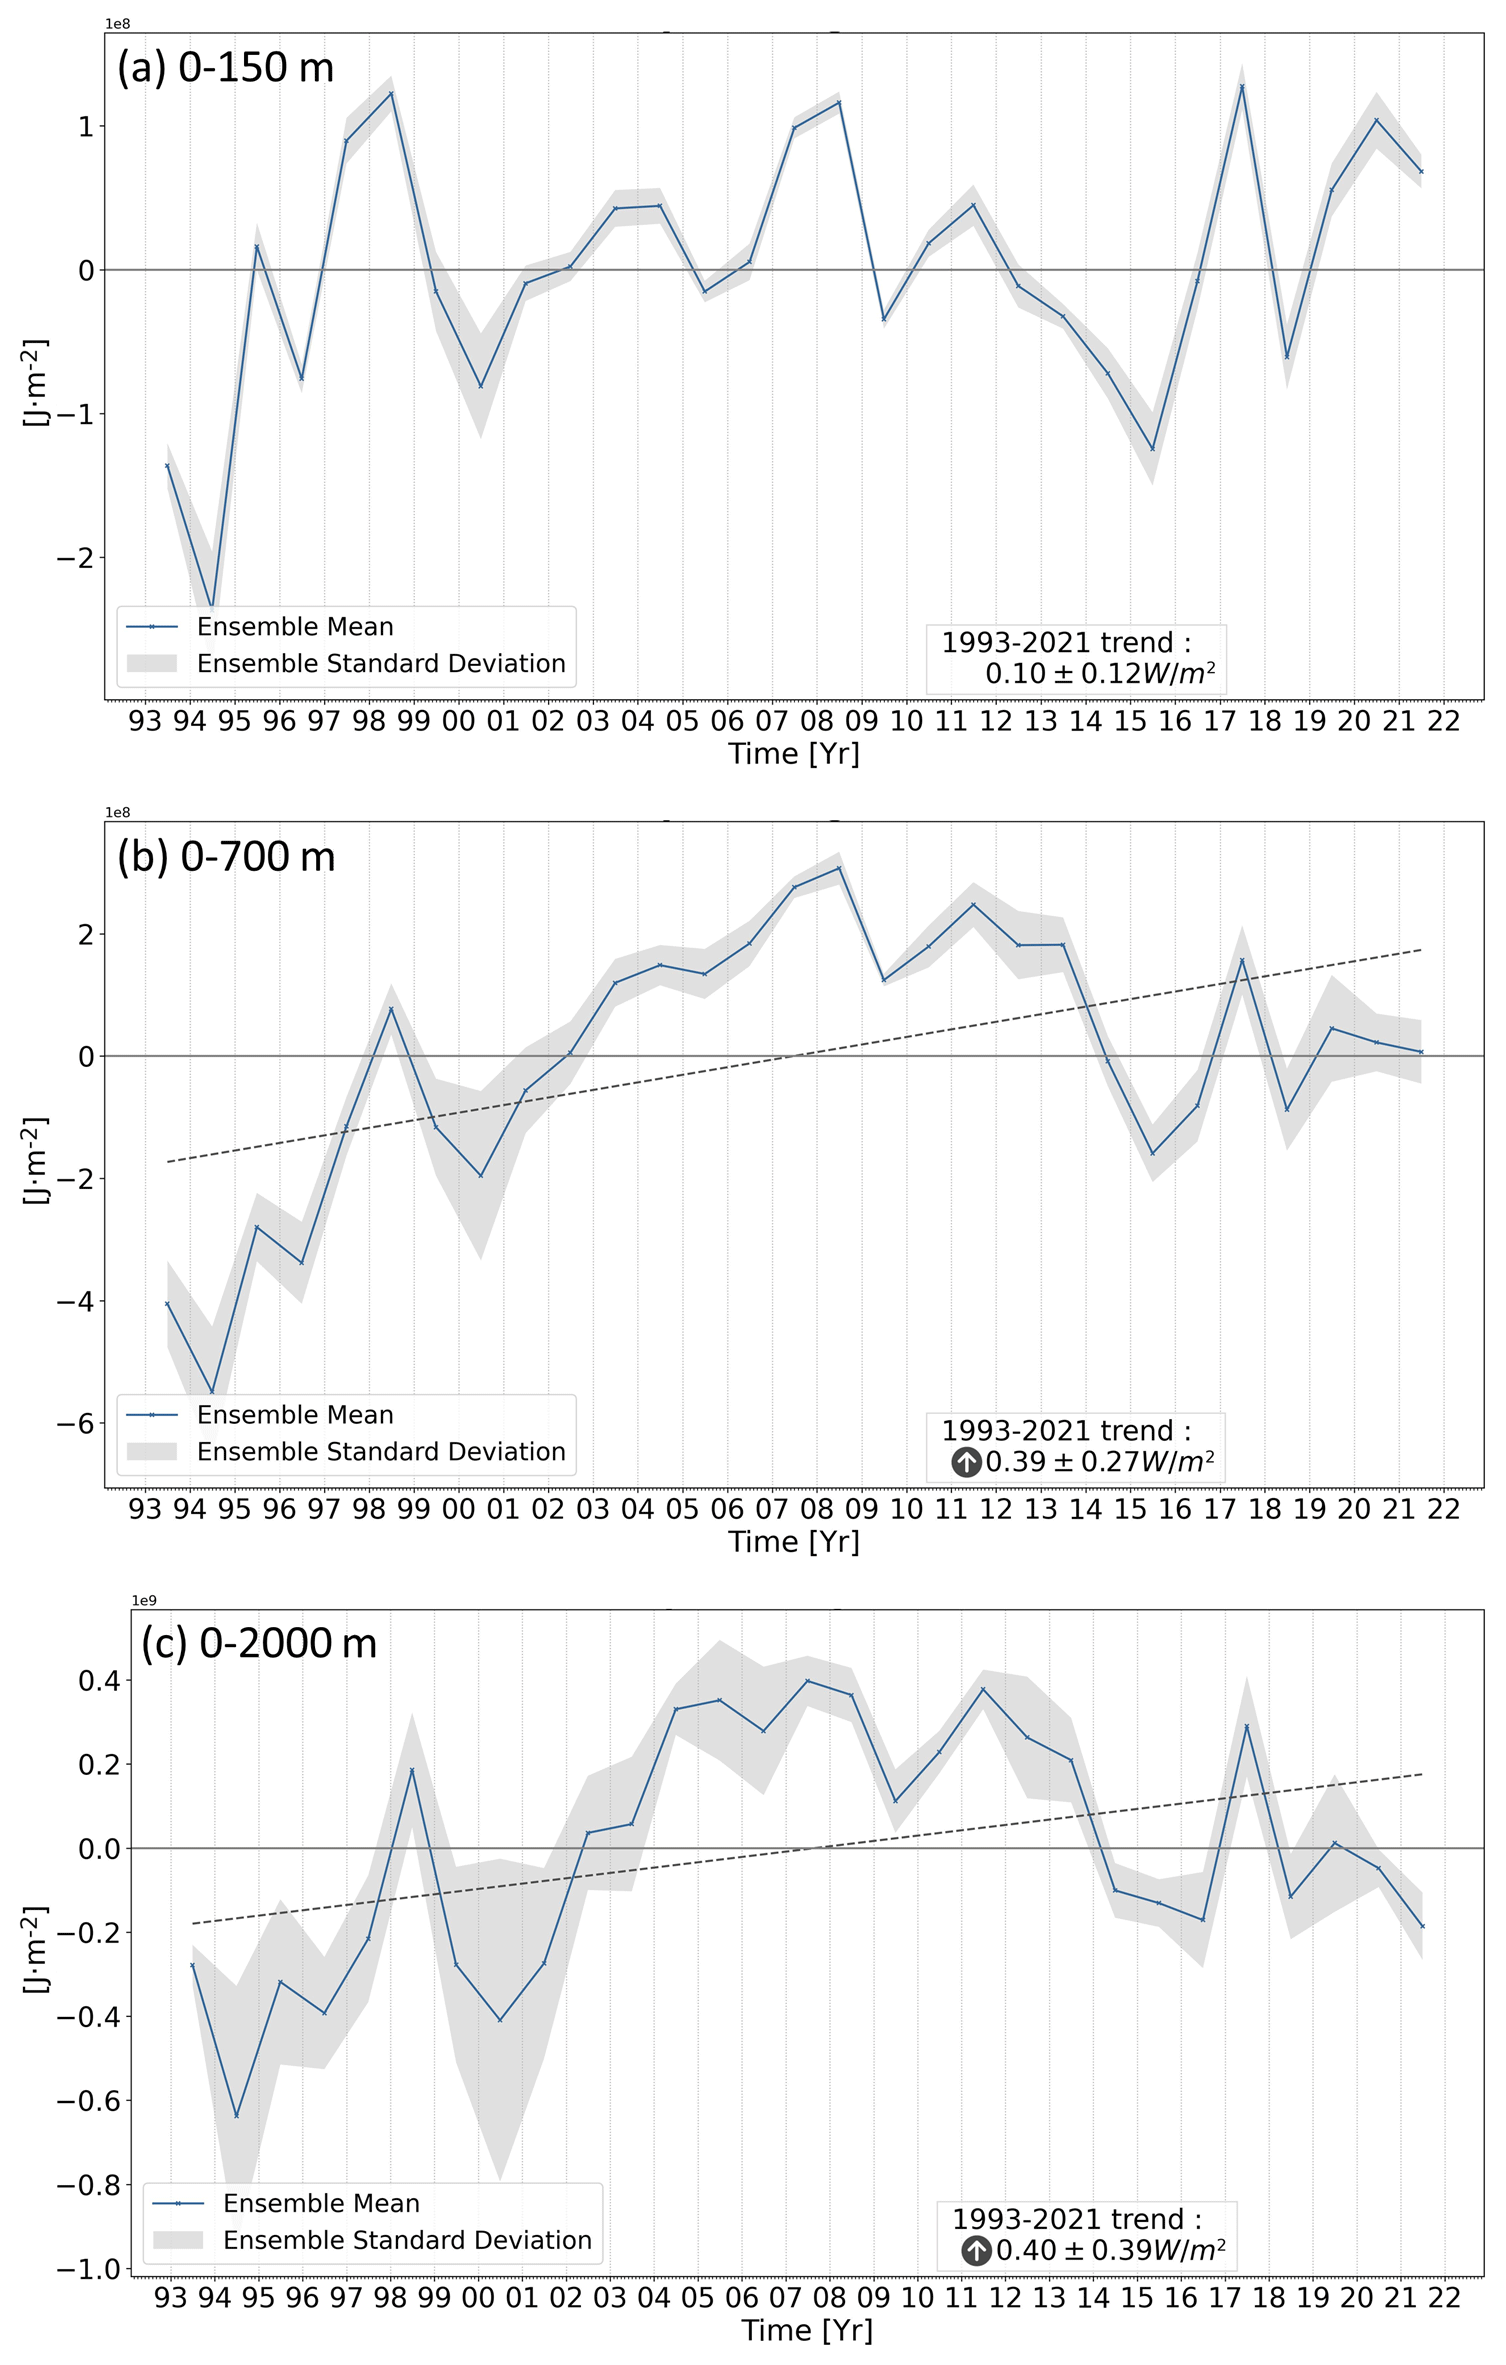
Figure 1OHC averaged in the IBI domain integrated from the ocean's surface down to 150 m (a), 700 m (b), and 2000 m (c). Time series computed from four Copernicus Marine products (i.e. IBI-REA, GLO-REA, CORA, and ARMOR), providing a multi-product approach. The blue line represents the ensemble mean, and shaded grey areas represent the standard deviation of the ensemble. The analysis of trends (at 95 % confidence interval) computed in the period 1993–2020 is included (bottom right box). Trend lines (dashed line) are only included in the figures when a significant trend is obtained.
Trends of time series obtained in Fig. 1 show a barely significant warming of the IBI region in the upper (0–700 m; 0.39 ± 0.27 W m−2) and intermediate to deep layers (0–2000 m; 0.40 ± 0.39 W m−2); conversely, such a trend does not affect the surface layer, where the trend is not significant. Considering that the trend integrated at 0–2000 m is at the limit of significance, we can consider this to be a mathematical result; thus, results suggest a dominance of the variability at intermediate levels over the OHC trend. It is worth mentioning that, despite the positive trends observed in the whole period (1993–2020) of time series integrated down to 700 and 2000 m, a change in trends of these time series after the year 2005 can be appreciated. Table 3 shows the trend analysis by dividing the time record into two halves: the period 1993–2005 and the period 2005–2021. While the results show a significant warming of integration depths 0–700 and 0–2000 in the period 1993–2005, the period 2005–2021 is characterised by a cooling of both integration layers. This result is consistent with the decadal-scale warming and freshening observed in the North Atlantic Ocean in the period 1990–2020 (González-Pola et al., 2020; Holliday et al., 2020; Somavilla et al., 2009). Additionally, this reversal of the trend explains the discrepancies observed between the long-term trends estimated in this work and the ones observed at 0–700 m in von Schuckmann et al. (2016) (0.8 ± 0.3 W m−2) and von Schuckmann et al. (2018) (0.9 ± 0.4 W m−2) for the periods 1993–2015 and 1993–2016, respectively. The cited works exclude the last years, which have a large influence on the overall trend.
Table 3Mean OHC trends (in W m−2) averaged in the IBI domain and integrated from the ocean's surface down to 150, 700, and 2000 m. The confidence interval of trends is computed with 95 % confidence. In bold are the values for which the absolute trend exceeds the confidence interval.
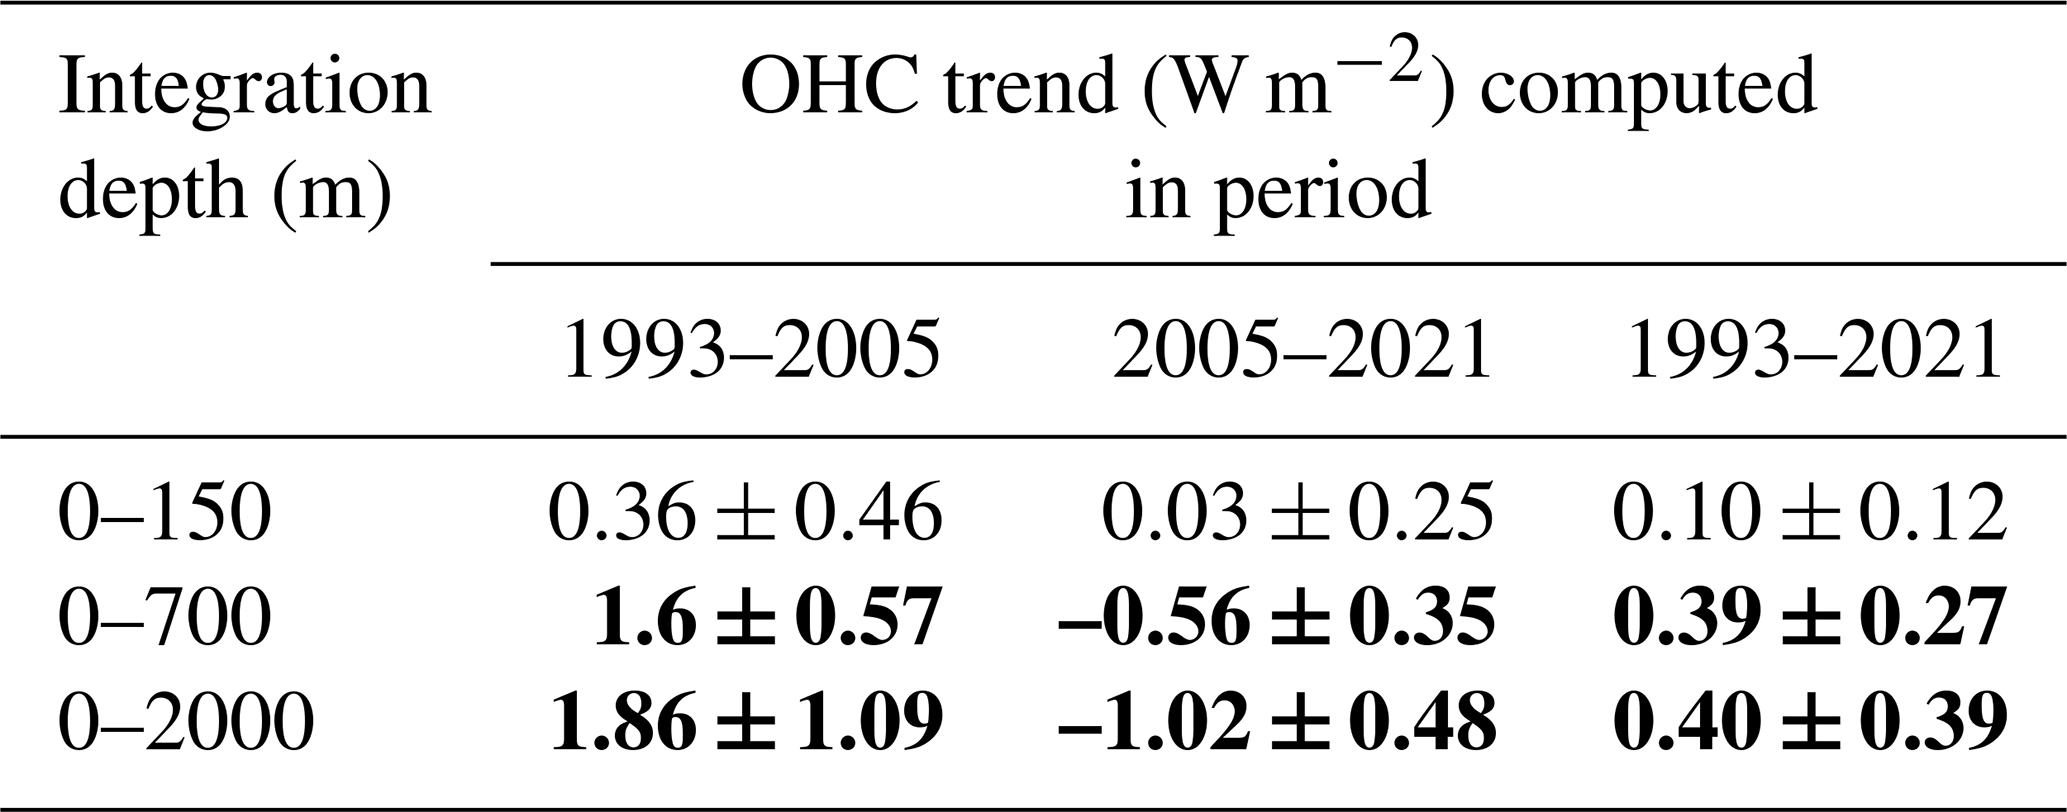
Figure 2 shows trend maps of OHC computed at 0–2000 m for the IBI region. The figure includes the computation of trends considering two different periods. The period 2005–2019 was selected to allow comparison of results obtained in this work (Fig. 2a) with those obtained with the product GLO-OMI-trend (Fig. 2b), computed for the same period and cropped in the figure to only show the study region. On the other hand, the period 1993–2021 was selected to study the spatial distribution of long-term trends in the IBI region (Fig. 2c). The comparison of results obtained in this work with the GLO-OMI-trend (Fig. 2a and b) shows a high level of agreement, with differences mostly being related to the different resolution. Thus, both figures estimate a negative trend that mainly affects the offshore ocean north of 38∘ N and a tongue between 31 and 38∘ N that shows warming trends.

Figure 2Regional maps of OHC trend computed at 0–2000 m (a) over the periods 2005–2019 and (c) 1993–2021. Trends computed using the four Copernicus Marine products (IBI-REA, GLO-REA, CORA, and ARMOR), providing a multi-product approach. Shaded colours represent mean trends (using all products), while shaded grey indicates areas with less robust signatures (where the noise – ensemble standard deviation of trends – exceeds the signal – ensemble mean). (b) Same as panels (a) and (c) but obtained from the product GLO-OMI-trend over the period 2005–2019.
It worth mentioning that the higher resolutions of the products used in this work allow computing OHC trends along the northwestern European shelf, showing a significant warming of the region. This warming may seem low when compared with the values observed in open ocean, but it should be considered that this warming is affected by the shallower depths in the region. For the sake of brevity, Fig. 2 only shows results for the 0–2000 m layer; however, as occurred in the time series analysed in the previous section, the observed trends (positive and negative) are subsurface-intensified, so the larger the integration depth, the larger the observed trend (results not shown). Such intensification of trends suggests that both signals are stronger underneath the upper layer, suggesting that they are more related to the evolution of intermediate and deep water masses than to the year-to-year interaction with the atmosphere.
Examining trends computed for the whole time record (Fig. 2c) we conclude that, as estimated by the averaged time series in the previous section, the trend calculated for the whole time record indicates a generalised warming of the IBI area. However, the significance of such warming is smaller, existing in regions with no evidence of OHC trend.
As occurred with the analysis of time series, trend maps show a dependence of the results on the time period selected for the analysis (comparing Fig. 2a and c). This suggests a strong influence of interannual processes on the observed trends. However, it is worth mentioning that the warming trend of the region around 34∘ N latitude is consistent for both analyses.
Since it has been observed in the data that OHC trends are accentuated in depth, the following section analyses the vertical profile of trends in the region. However, this analysis cannot be carried out for all products and for all points of the grid. Therefore, it has been decided to study the trend profile obtained from the IBI-REA product for two characteristic subregions centred at 35 and 48∘ N (Fig. 3a and b). Hereafter these subregions will be referred to as 35N and 48N, respectively.

Figure 3(a, b) Maps of regional trends of OHC (0–2000 m) over the periods 1993–2010 (a) and 2010–2019 (b) derived from the IBI-REA product. Grey shaded areas represent regions where the trend is not significant (95 % confidence). Dashed rectangles denote the subregions 35 and 48∘ N where diagrams are averaged in other panels. (c–f) diagrams averaged in subregions (35 and 48∘ N) and over the periods 1993–2010 and 2010–2019. (c) Region 48∘ N period 1993–2010, (d) region 48∘ N period 2010–2019, (e) region 35∘ N period 1993–2010, and (f) region 35∘ N period 2010–2019.
The IBI-REA product was selected for this purpose because it assimilates observational (in situ and satellite) data and uses the GLO-REA product as initial and boundary conditions, therefore indirectly incorporating from the parent products information from the other products. On the other hand, the subregions chosen were selected to provide a detailed analysis of the main features described in the previous section. A first analysis has shown that, as seen with vertically integrated data, the resulting trends show a dependency on the selected period. Hence, as explained in the “Data and methods” section (Sect. 2), in order to provide information on the temporal variability of the water bodies in the IBI area, the trend analysis has been performed by dividing the time period into two periods representative of the positive and negative trend of the NAO index: the period 1993–2010 when the NAO evolves from positive to negative and the period 2010–2019 representing the NAO transition from negative to positive.
The analysis of OHC trend maps for these two periods shows that during the transition to negative NAO phases (Fig. 3a), the water masses in the region undergo significant warming over almost the entire IBI area. However, this warming is not significant in part of the southern half of the domain, in the vicinity of the Gulf of Cádiz and the Seine and Horseshoe Abyssal Plains. In contrast, the trend map associated with the NAO transition period towards positive values (Fig. 3b) reveals a generalised cooling pattern with a warming trend around the Horseshoe region similar to that observed in Fig. 2b. Take into account, however, the fact that Figs. 2b and 3b are not directly comparable, since temporal coverage differs.
The trends of OHC averaged for the subregions defined at 35N and 48N have been computed at each level to obtain a vertical profile of trends. These trend profiles are presented in Fig. 3c, d, e, and f combined with the temperature and salinity data on a yearly basis. Each profile shown in the diagrams corresponds to the annual mean temperature and salinity observed in the selected period (1993–2010 or 2010–2021) and averaged over the corresponding study region (35N or 48N). The different markers used correspond to the different OHC trends observed for each depth. Therefore, the shown diagrams allow discussing the trends of OHC at each layer, linking these results with the different water masses observed in the region.
The profiles shown in Fig. 3c, d, e, and f are consistent with the water masses that the literature has described in the northeastern Atlantic: the SAIW characterised by a salinity minima at potential density σθ = 27.2 kg m−3, the salinity maxima connected with MOW at the neutral density surface σθ = 27.6 kg m−3, and a deeper salinity minima corresponding to LSW underneath the isopycnal σθ = 27.8 kg m−3 (Talley and McCarney, 1982; Iorga and Lozier, 1999a, b; van Aken, 2000; Prieto et al., 2013; de Pascual-Collar et al., 2019); however, the core of LSW is only clearly visible in subregion 48N where this water mass has a greater presence.
Regarding the OHC variability of SAIW, results in Fig. 3 show a similar behaviour of the water mass at 48N and 35N. Thus, at both latitudes, the SAIW shows a warming (cooling) associated with the negative (positive) NAO transition. On the contrary, the OHC trends of MOW shows an inverse behaviour between the subregions 35N and 48N. Thus, while in subregion 35N, the MOW experiences a cooling (warming) associated with the negative (positive) NAO transition (periods 1993–2010 and 2010–2021, respectively), in subregion 48N the opposite occurs, and a warming (cooling) of the MOW associated with the negative (positive) NAO transition is observed. These are consistent with the processes described in the literature. Thus, the SAIW trends are coherent with the changes in wind forcing associated with NAO as described by Hurrel (1995) and Leadbetter et al. (2007), and the MOW results are consistent with studies that observed a significant anticorrelation between the westward and northward transport of MOW (Bozec et al., 2011) as well as works that describe the east–west shift of water mass boundaries in the Horseshoe basin (de Pascual-Collar et al., 2019).
Apart from the estimation of density levels defining each water mass (shown in Fig. 3), an estimation of the heat trends for each water mass was done for the entire study period of 1993–2021 (see results in Table 4). It is observed that, in line with the results shown in Fig. 2, the overall OHC trends in both regions are positive. Considering that each water mass has different thickness (SAIW approximately 300 m and MOW approximately 400–500 m), we must conclude that although the total trend shown in Table 4 is of the same magnitude for both water masses, the heat gain per cubic metre is higher for SAIW than for MOW. Additionally, the relative influence should be noted that both water masses have on the water column trends down to 2000 m, explaining the sum of the two water masses (a layer approximately 700–800 m thick): 88 % (51 %) of the OHC trend in 35N (48N), respectively.
Table 4Mean thermic trends (in W m−2) of SAIW, MOW, and 0–2000 m in the IBI subregions (35N and 48N) computed for the period 1993–2021 with the product IBI-REA. Significance of trends computed with 95 % confidence.

The present work uses several Copernicus Marine products to generate a multi-product OMI of ocean heat content from the surface down to a set of depths over the period 1993–2021. These indicators are able to detect decadal trends of OHC. Specifically, the IBI region presents a warming of +0.39 W m−2 in the upper 700 m. However, the study of both time series trends and spatial distribution of trends shows a high sensitivity to the time period selected, and therefore the high inter-decadal variability detected makes these trends not very significant. On the other hand, the OMIs integrated up to 150 and 2000 m does not allow detecting clear significant trends of results, which suggest that OHC variability in the upper 2000 m may be mainly controlled by intermediate levels.
Although the regional analysis of OHC trends integrated in different depths may provide some clues about the origin of such trends, a finer analysis focusing on the different water masses involved concludes that the vertically integrated trend is the result of different trends (positive and negative) contributing at different layers. The analysis of water masses in the region shows the existence of three water masses (well referenced in the literature): SAIW, MOW, and LSW. Since the LSW is found in the depth limit established here (2000 m), we put the focus on studying the temporal variability of the heat stored by the other two involved water masses: the SAIW and MOW. The study states that the IBI-REA can simulate the OHC behaviour of SAIW and MOW in a consistent way, with the OHC variability being associated with the NAO, consistent with the variability described in the literature.
Despite the results showing a strong relationship between the variability of the NAO and the OHC of SAIW and MOW, both water masses show a differentiated behaviour. While SAIW shows a homogeneous behaviour over the whole IBI area (OHC trends associated with NAO have the same sign in subregions 35N and 48N), MOW shows an anticorrelated behaviour between subregions 35N and 48N (when the trend is positive in 35N, in 48N it is negative and vice versa).
The work states the key role that subsurface water masses play in the OHC trends in the IBI region by computing the OHC trends for SAIW and MOW over the period 1993–2021. The results show that, despite high interannual variability, both water masses have experienced significant warming in the study period. Additionally, the relative influence that these two water masses have on the integrated OHC trends down to 2000 m is remarkable. Thus, it is found that the sum of both water masses accounts for up to 88 % of the integrated OHC variability from the surface down to 2000 m. However, at more northerly latitudes, this relative influence decreases to 50 %. The greater presence of LSW in the northern regions of the IBI domain suggests that this water mass may share relevance with respect to OHC trends with SAIW and MOW; however, this hypothesis has not been demonstrated in the present work.
The code developed for the current work is the property of Nologin Consulting. The code can be accessed by request to Nologin Consulting, Avda. de Ranillas 1D, 50018 Zaragoza, Spain, or by email to the main author (alvaro.depascual@nologin.es).
All data used in this article can be downloaded from the Copernicus Marine Environment Monitoring Service web page (https://doi.org/10.48670/moi-00052, EU Copernicus Marine Service Product, 2021a; https://doi.org/10.48670/moi-00236, EU Copernicus Marine Service Product, 2021b; https://doi.org/10.48670/moi-00028, EU Copernicus Marine Service Product, 2022a: https://doi.org/10.48670/moi-00021, EU Copernicus Marine Service Product, 2022b; and https://doi.org/10.17882/46219, EU Copernicus Marine Service Product, 2022c). A description of the data products, as well as their names, spatial and temporal coverages, and documentation, is summarised in Table 1.
The supplement related to this article is available online at: https://doi.org/10.5194/sp-1-osr7-9-2023-supplement.
This work was conceptualised through the participation of all authors. Data analysis and drafting of the first version were carried out by AdPC. Additionally, RA, BL, and MGS contributed to the final writing and subsequent revisions of the manuscript.
The contact author has declared that none of the authors has any competing interests.
Publisher's note: Copernicus Publications remains neutral with regard to jurisdictional claims in published maps and institutional affiliations.
The authors thank the Copernicus Marine Environment Monitoring Service for providing the data for the article. Additionally, the helpful comments of Karina von Schuckmann and the other referees are gratefully acknowledged.
This paper was edited by Marta Marcos and reviewed by Carolina M. L. Camargo and Cesar Gonzalez-Pola.
Abraham, J. P., Baringer, M., Bindoff, N. L., Boyer, T., Cheng, L. J., Church, J. A., Conroy, J. L., Domingues, C. M., Fasullo, J. T., Gilson, J., Goni, G., Good, S. A., Gorman, J. M., Gouretski, V., Ishii, M., Johnson, G. C., Kizu, S., Lyman, J. M., Macdonald, A. M., Minkowycz, W. J., Moffitt, S. E., Palmer, M. D., Piola, A. R., Reseghetti, F., Schuckmann, K., Trenberth, K. E., Velicogna, I., and Willis, J. K.: A review of global ocean temperature observations: Implications for ocean heat content estimates and climate change, Rev. Geophys., 51, 450–483, 2013.
Amo-Baladrón, A., Levier, B., Aznar, R., and Sotillo, M. G.: EU Copernicus Marine Service Product User Manual for the Atlantic-Iberian Biscay Irish-Ocean Physics Reanalysis, IBI_MULTIYEAR_PHY_005_002, issue 4.1, Mercator Ocean International, https://catalogue.marine.copernicus.eu/documents/PUM/CMEMS-IBI-PUM-005-002.pdf (last access: 4 April 2023), 2022.
Bozec, A., Lozier, M. S., Chasignet, E. P., and Halliwel, G. R.: On the variability of the Mediterranean Outflow Water in the North Atlantic from 1948 to 2006, J. Geophys. Res.-Oceans, 116, C09033, https://doi.org/10.1029/2011JC007191, 2011.
Cheng, L., Trenberth, K. E., Fasullo, J., Boyer, T., Abraham, J., and Zhu, J.: Improved estimates of ocean heat content from 1960–2015, Sci. Adv., 3, e1601545, https://doi.org/10.1126/sciadv.1601545, 2017.
Cheng, L., Foster, G., Hausfather, Z., Trenberth, K. E., and Abraham, J.: Improved quantification of the rate of ocean warming, J. Climate, 35, 1–37, https://doi.org/10.1175/JCLI-D-21-0895.1, 2022.
Collins, M., Sutherland, M., Bouwer, L., Cheong, S.-M., Frölicher, T., Jacot Des Combes, H., Koll Roxy, M., Losada, I., McInnes, K., Ratter, B., Rivera-Arriaga, E., Susanto, R. D., Swingedouw, D., and Tibig, L.: Extremes, Abrupt Changes and Managing Risk, in: IPCC Special Report on the Ocean and Cryosphere in a Changing Climate, edited by: Pörtner, H.-O., Roberts, D. C., Masson-Delmotte, V., Zhai, P., Tignor, M., Poloczanska, E., Mintenbeck, K., Alegría, A., Nicolai, M., Okem, A., Petzold, J., Rama, B., and Weyer, N. M., Cambridge University Press, Cambridge, UK and New York, NY, USA, 589–655, https://doi.org/10.1017/9781009157964.008, 2019.
de Pascual-Collar, Á., G. Sotillo, M., Levier, B., Aznar, R., Lorente, P., Amo-Baladrón, A., and Álvarez-Fanjul, E.: Regional circulation patterns of Mediterranean Outflow Water near the Iberian and African continental slopes, Ocean Sci., 15, 565–582, https://doi.org/10.5194/os-15-565-2019, 2019.
Drévillon, M., Lellouche, J. M., Régnier, C., Garric, G., Bricaud, C., Hernandez, O., and Bourdalé-Badie, R.: EU Copernicus Marine Service Quality Information Document for the Global Ocean Physics Reanalysis, GLOBAL_REANALYSIS_PHY_001_030, issue 1.6, Mercator Ocean International, https://catalogue.marine.copernicus.eu/documents/QUID/CMEMS-GLO-QUID-001-030.pdf (last access: 4 April 2023), 2022a.
Drévillon, M., Fernandez, E., and Lellouche, J. M.: EU Copernicus Marine Service Product User Manual for the Global Ocean Physics Reanalysis, GLOBAL_REANALYSIS_PHY_001_030, Issue 1.4, Mercator Ocean International, https://catalogue.marine.copernicus.eu/documents/PUM/CMEMS-GLO-PUM-001-030.pdf (last access: 4 April 2023), 2022b.
EU Copernicus Marine Service Product: Multi Observation Global Ocean 3D Temperature Salinity Height Geostrophic Current and MLD, Mercator Ocean International [data set], https://doi.org/10.48670/moi-00052, 2021a.
EU Copernicus Marine Service Product: Global Ocean Heat Content trend map from Reanalysis & Multi-Observations Reprocessing, Mercator Ocean International [data set], https://doi.org/10.48670/moi-00236, 2021b.
EU Copernicus Marine Service Product: Atlantic-Iberian Biscay Irish-Ocean Physics Reanalysis Forecast, Mercator Ocean International [data set], https://doi.org/10.48670/moi-00028, 2022a.
EU Copernicus Marine Service Product: Global Ocean Physics Reanalysis, Mercator Ocean International [data set], https://doi.org/10.48670/moi-00021, 2022b.
EU Copernicus Marine Service Product: Global Ocean – Delayed Mode gridded CORA – In-situ Observations objective analysis in Delayed Mode, Mercator Ocean International [data set], https://doi.org/10.17882/46219, 2022c.
Fox-Kemper, B., Hewitt, H. T., Xiao, C., Aðalgeirsdóttir, G., Drijfhout, S. S., Edwards, T. L., Golledge, N. R., Hemer, M., Kopp, R. E., Krinner, G., Mix, A., Notz, D., Nowicki, S., Nurhati, I. S., Ruiz, L., Sallée, J.-B., Slangen, A. B. A., and Yu, Y.: Ocean, Cryosphere and Sea Level Change, in: Climate Change 2021: The Physical Science Basis. Contribution of Working Group I to the Sixth Assessment Report of the Intergovernmental Panel on Climate Change, edited by: Masson-Delmotte, V., Zhai, P., Pirani, A., Connors, S. L., Péan, C., Berger, S., Caud, N., Chen, Y., Goldfarb, L., Gomis, M. I., Huang, M., Leitzell, K., Lonnoy, E., Matthews, J. B. R., Maycock, T. K., Waterfield, T., Yelekçi, O., Yu, R., and Zhou, B., Cambridge University Press, Cambridge, United Kingdom and New York, NY, USA, 1211–1362, 2021.
González-Pola, C., Larsen, K. M. H., Fratantoni, P., and Beszczynska-Möller, A. (Eds.): ICES Report on Ocean Climate 2019, ICES Cooperative Research Reports No. 350, 136 pp., https://doi.org/10.17895/ices.pub.7537, 2020.
Greiner, E., Verbrugge, N., Mulet, S., and Guinehut, S.: EU Copernicus Marine Service Quality Information Document for the Multi Observation Global Ocean 3D Temperature Salinity Heights Geostrophic Currents and MLD Product, MULTIOBS_GLO_PHY_TSUV_3D_MYNRT_015_012, issue 1.1, Mercator Ocean International, https://catalogue.marine.copernicus.eu/documents/QUID/CMEMS-MOB-QUID-015-012.pdf (last access: 4 April 2023), 2021.
Guinehut, S.: EU Copernicus Marine Service Product User Manual for the Multi Observation Global Ocean 3D Temperature Salinity Heights Geostrophic Currents and MLD Product, MULTIOBS_GLO_PHY_TSUV_3D_MYNRT_015_012, issue 1.1, Mercator Ocean International, https://catalogue.marine.copernicus.eu/documents/PUM/CMEMS-MOB-PUM-015-012.pdf (last access: 4 April 2023), 2021.
Gulev, S. K., Thorne, P. W., Ahn, J., Dentener, F. J., Domingues, C.M., Gerland, S., Gong, D., Kaufman, D. S., Nnamchi, H. C., Quaas, J., Rivera, J. A., Sathyendranath, S., Smith, S. L., Trewin, B., von Schuckmann, K., and Vose, R. S.: Changing State of the Climate System, in: Climate Change 2021: The Physical Science Basis. Contribution of Working Group I to the Sixth Assessment Report of the Intergovernmental Panel on Climate Change, edited by: Masson Delmotte, V., Zhai, P., Pirani, A., Connors, S. L., Péan, C., Berger, S., Caud, N., Chen, Y., Goldfarb, L., Gomis, M. I., Huang, M., Leitzell, K., Lonnoy, E., Matthews, J. B. R., Maycock, T. K., Waterfield, T., Yelekçi, O., Yu, R., and Zhou, B., Cambridge University Press, Cambridge, United Kingdom and New York, NY, USA, 287–422, 2021.
Holliday, N. P., Bersch, M., Berx, B., Chafik, L., Cunningham, S., Florindo-López, C., Hátún, H., Johns, W., Josey, S. A., Larsen, K. M. H., Mulet, S., Oltmanns, M., Reverdin, G., Rossby, T., Thierry, V., Valdimarsson, H., and Yashayaev, I.: Ocean circulation causes the largest freshening event for 120 years in eastern subpolar North Atlantic, Nat. Commun., 11, 585, https://doi.org/10.1038/s41467-020-14474-y, 2020.
Hurrell, J.: Decadal trends in the North Atlantic Oscillation: Regional temperatures and precipitation, Science, 269, 676–679, 1995.
Iorga, M. C. and Lozier, M. S.: Signatures of the Mediterranean outflow from a North Atlantic climatology 1. Salinity and density fields, J. Geophys. Res., 104, 25985–26009, 1999a.
Iorga, M. C. and Lozier, M. S.: Signatures of the Mediterranean outflow from a North Atlantic climatology 2. Diagnostic velocity fields, J. Geophys. Res., 104, 26011–26029, 1999b.
Leadbetter, S. J., Williams, R. G., McDonagh, E. L., and King, B. A.: A twenty year reversal in water mass trends in the subtropical North Atlantic, Geophys. Res. Lett., 34, 1–6, https://doi.org/10.1029/2007GL029957, 2007.
Levier, B., Reffray, G., and Sotillo, M. G.: EU Copernicus Marine Service Quality Information Document for the Atlantic-Iberian Biscay Irish-Ocean Physics Reanalysis, IBI_MULTIYEAR_PHY_005_002, issue 5.1, Mercator Ocean International, https://catalogue.marine.copernicus.eu/documents/QUID/CMEMS-IBI-QUID-005-002.pdf (last access: 4 April 2023), 2022.
Levitus, S., Antonov, J., and Boyer, T.: Warming of the world ocean, 1955–2003, Geophys. Res. Lett., 32, L02604, https://doi.org/10.1029/2004GL021592, 2005.
Levitus, S., Antonov, J. I., Boyer, T. P., Baranova, O. K., Garcia, H. E., Locarnini, R. A., Mishonov, A. V., Reagan, J. R., Seidov, D., Yarosh, E. S., and Zweng, M. M.: World ocean heat content and thermosteric sea level change (0–2000 m), 1955–2010, Geophys. Res. Lett., 39, L10603, https://doi.org/10.1029/2012GL051106, 2012.
Lima, L., Peneva, E., Ciliberti, E., Masina, S., Lemieux, B., Storto, A., and Chtirkova, B.: Ocean heat content in the Black Sea, in: Copernicus marine service ocean state report, issue 4, edited by: von Schuckmann, K., Le Traon, P. Y., Smith, N., Pascual, A., Djavidnia, S., Gattuso, J. P., Grégoire, M., Nolan, G., Aaboe, S., Álvarez-Fanjul, E., Aouf, L., Aznar, R., Badewien, T. H., Behrens, A., Berta, M., Bertino, L., Blackford, J., Bolzon, G., Borile, F., Bretagnon, M., Brewin, R. J. W., Canu, D., Cessi, P., Ciavatta, S., Chapron, B., Trang Chau, T. T., Chevallier, F., Chtirkova, B., Ciliberti, S., Clark, J. R., Clementi E., Combot, C., Comerma, E., Conchon, A., Coppini, G., Corgnati, L., Cossarini, G., Cravatte, S., de Alfonso, M., de Boyer Montégut, C., De Lera Fernández, C., de los Santos, F. J., Denvil-Sommer, A., de Pascual-Collar, A., Dias Nunes, P. A. L., Di Biagio, V., Drudi, M., Embury, O., Falco, P., Fanton d'Andon, O., Ferrer, L., Ford, D., Freund, H., García León, M., García-Sotillo. M., García-Valdecasas, J. M., Garnesson, P., Garric, G., Gasparin, F., Gehlen, M., Genua-Olmedo, A., Geyer, G., Ghermandi, A., Good, S. A., Gourrion, J., Greiner, E., Griffa, A., González, M., Hernández-Carrasco, I., Isoard, E., Kenned, J. J., Kay. S., Korosov, A., Laanemäe, K., Land, P. E., Lavergne, T., Lazzari, P., Legeais, J. F., Lemieux, B., Levier, B., Llovel, W., Lyubartsev, V., Le Traon, P. Y., Lien, V. S., Lima, L., Lorente, P., Mader, J., Magaldi, M. G., Maljutenko, I., Mangin, A., Mantovani, C., Marinova, V., Masina, S., Mauri, E., Meyerjürgens, J., Mignot, A., McEwan, R., Mejia, C., Melet, A., Menna, M., Meyssignac, B., Mouche, A., Mourre, B., Müller, M., Notarstefano, G., Orfila, A., Pardo, S., Peneva, E., Pérez-Gómez, B., Perruche, C., Peterlin, M., Poulain, PM., Pinardi, N., Quilfen, Y., Raudsepp, U., Renshaw, R., Révelard, A., Reyes-Reyes, E., Ricker, M., Rodríguez-Rubio, P., Rotllán, P., Royo Gelabert, E., Rubio, A., Ruiz-Parrado, I., Sathyendranath, S., She, J., von Schuckmann, K., Solidoro, C., Stanev, E.V., Staneva, J., Storto, A., Su, J., Tajalli Bakhsh, T., Tilstone, G. H., Tintoré, J., Toledano, C., Tournadre, J., Tranchant, B., Uiboupin, R., Valcarcel, A., Valcheva, N., Verbrugge, N., Vrac, M., Wolff, J. O., Zambianchi, E., Zielinski, O., Zinck, A. S., and Zunino, S., J. Oper. Oceanogr., 13, S1–S172, https://doi.org/10.1080/1755876X.2020.1785097, 2020.
Lozier, M. S. and Sindlinger, L.: On the Source of Mediterranean OverflowWater Property Changes, J. Phys. Oceanogr., 39, 1800–1817, https://doi.org/10.1175/2009JPO4109.1, 2009.
Masina, S., Pinardi, N., Cipollone, A., Banerjee, D. S., Lyubartsev, V., von Schuckmann, K., Jackson, L., Escudier, R., Clementi, E., Aydogdu, A., and Iovino D.: The Atlantic Meridional Overturning Circulation forcing the mean se level in the Mediterranean Sea through the Gibraltar transport, in: Copernicus Ocean State Report, Issue 6, edited by: von Schuckmann, K. and Le Traon, P.-Y., J. Oper. Oceanogr., 15, s119–s126, https://doi.org/10.1080/1755876X.2022.2095169, 2022.
Mayer, M., Lien, V. S., Mork, K. A., von Schuckmann, K., Monier, M., and Greiner, E.: Ocean heat content in the High North, in: Copernicus Marine Service Ocean State Report, Issue 5, edited by: von Schuckmann, K., Le Traon, P. Y., Smith, N., Pascual, A., Djavidnia, S., Gattuso, J. P., Grégoire, M., Aaboe, S., Alari, V., Alexander, B. E., Alonso-Martirena, A., Aydogdu, A., Azzopardi, J., Bajo, M., Barbariol, F., Batistić, M., Behrens, A., Ben Ismail, S., Benetazzo, A., Bitetto, I., Borghini, M., Bray, L., Capet, A., Carlucci, R., Chatterjee, S., Chiggiato, J., Ciliberti, S., Cipriano, G., Clementi, E., Cochrane, P., Cossarini, G., D'Andrea, L, Davison, S., Down, E., Drago, A., Druon, J. N., Engelhard, G., Federico, I., Garić, R., Gauci, A., Gerin, R., Geyer, G., Giesen, R., Good, S., Graham, R., Grégoire, M., Greiner, E., Gundersen, K., Hélaouët, P., Hendricks, S., Heymans, J. J., Holt, J., Hure, M., Juza, M., Kassis, D., Kellett, P., Knol-Kauffman, M., Kountouris, P., Kõuts, M., Lagemaa, P., Lavergne, T., Legeais, J. F., Le Traon, P. Y., Libralato, S., Lien, V. S., Lima, L., Lind, S., Liu, Y., Macías, D., Maljutenko, I., Mangin, A., Männik, A., Marinova, V., Martellucci, R., Masnadi, F., Mauri, E., Mayer, M., Menna, M., Meulders, C., Møgster, J. S., Monier, M., Arne Mork, K., Müller, M., Øie Nilsen, J. E., Notarstefano, G., Oviedo, J. L., Palerme, C., Palialexis, A., Panzeri, D., Pardo, S., Peneva, E., Pezzutto, P., Pirro, A., Platt, T., Poulain, P. M., Prieto, L., Querin, S., Rabenstein, L., Raj, R. P., Raudsepp, U., Reale, M., Renshaw, R., Ricchi, A., Ricker, R., Rikka, S., Ruiz, J., Russo, T., Sanchez, J., Santoleri, R., Sathyendranath, S., Scarcella, G., Schroeder, K., Sparnocchia, S., Spedicato, M. T., Stanev, E., Staneva, J., Stocker, A., Stoffelen, A., Teruzzi, A., Townhill, B., Uiboupin, R., Valcheva, N., Vandenbulcke, L., Vindenes, H., von Schuckmann, K., Vrgoč, N., Wakelin, S., and Zupa, W., J. Oper. Oceanogr., 14, 1–185, https://doi.org/10.1080/1755876X.2021.1946240, 2021.
Monier, M., Derval, C., and Fernandez, E.: EU Copernicus Marine Service Product User Manual for the Global Ocean Heat Content trend map from Reanalysis and Multi-Observations Reprocessing, GLOBAL_OMI_OHC_trend, issue 4.0, Mercator Ocean International, https://catalogue.marine.copernicus.eu/documents/PUM/CMEMS-OMI-PUM-GLO-OHC.pdf (last access: 4 April 2023), 2021.
NOAA: North Atlantic Oscillation (NAO), NOAA, https://www.ncei.noaa.gov/access/monitoring/nao/, last access: December 2022.
Potter, R. A. and Lozier, M. S.: On the warming and salinification of the Mediterranean outflow waters in the North Atlantic, Geophys. Res. Lett., 31, 1–4, https://doi.org/10.1029/2003GL018161, 2004.
Prieto, E., González-Pola, C., Lavín, A., Sánchez, R. F., and Ruiz-Villarreal, M.: Seasonality of intermediate waters hydrography west of the Iberian Peninsula from an 8 yr semiannual time series of an oceanographic section, Ocean Sci., 9, 411–429, https://doi.org/10.5194/os-9-411-2013, 2013.
Robson, J., Ortega, P., and Sutton, R.: A reversal of climatic trends in the North Atlantic since 2005, Nat. Geosci., 9, 513–517, https://doi.org/10.1038/ngeo2727, 2016.
Somavilla, R., González-Pola, C., Rodriguez, C., Josey, S. A., Sánchez, R. F., and Lavín, A.: Large changes in the hydrographic structure of the Bay of Biscay after the extreme mixing of winter 2005, J. Geophys. Res.-Oceans, 114, C01001, https://doi.org/10.1029/2008JC004974, 2009.
Szekely, T.: EU Copernicus Marine Service Quality Information Document for the Global Ocean – Delayed Mode gridded CORA – In-situ Observations objective analysis in Delayed Mode, INSITU_GLO_PHY_TS_OA_MY_013_052, issue 1.2, Mercator Ocean International, https://catalogue.marine.copernicus.eu/documents/QUID/CMEMS-INS-QUID-013-052.pdf (last access: 4 April 2023), 2022a.
Szekely, T.: EU Copernicus Marine Service Product User Manual for the Global Ocean – Delayed Mode gridded CORA – In-situ Observations objective analysis in Delayed Mode, INSITU_GLO_PHY_TS_OA_MY_013_052, issue 1.10, Mercator Ocean International, https://catalogue.marine.copernicus.eu/documents/PUM/CMEMS-INS-PUM-013-002-052.pdf (last access: 4 April 2023), 2022b.
Talley, L. D. and McCartney, M. S.: Distribution and Circulation of Labrador Sea Water, J. Phys. Oceanogr., 12, 1189–1205, https://doi.org/10.1175/1520-0485(1982)012<1189:DACOLS>2.0.CO;2, 1982.
Trenberth, K. E., Fasullo, J. T., and Balmaseda, M.: Earth's energy imbalance, J. Climate, 27, 3129–3144, https://doi.org/10.1175/JCLI-D-13-00294.1, 2014.
van Aken, H. M.: The hydrography of the mid-latitude North- east Atlantic Ocean II: The intermediate water masses, Deep-Sea Res., 47, 789–824, https://doi.org/10.1016/S0967-0637(99)00112-0, 2000.
von Schuckmann, K., Balmaseda, M., and Simoncelli, S.: Ocean Heat Content, in: The Copernicus Marine Environment Monitoring Service Ocean State Report, Journal of Operational Oceanography, Volume 9 – Issue sup2, edited by: von Schuckmann, K., Le Traon, P. Y., Alvarez-Fanjul, E., Axell, L., Balmaseda, M., Breivik, L. A., Brewin, R. J. W., Bricaud, C., Drevillon, M., Drillet, Y., Dubois, C., Embury, O., Etienne, H., García-Sotillo, M., Garric, G., Gasparin, F., Gutknecht, E., Guinehut, S., Hernandez, F., Juza, M., Karlson, B., Korres, G., Legeais, J. F., Levier, B., Lien, V. S., Morrow, R., Notarstefano, G., Parent, L., Pascual-Collar, A., Pérez-Gómez, B., Perruche, C., Pinardi, N., Pisano, A., Poulain, P. M., Pujol, I. M., Raj, R. P., Raudsepp, U., Roquet, H., Samuelsen, A., Sathyendranath, S., She, J., Simoncelli, S., Solidoro, C., Tinker, J., Tintoré, J., Viktorsson, J., Ablain, M., Almroth-Rosell, E., Bonaduce, A., Clementi, E., Cossarini, G., Dagneaux, Q., Desportes, C., Dye, S., Fratianni, C., Good, S., Greiner, E., Gourrion, J., Hamon, M., Holt, J., Hyder, P., Kennedy, J., Manzano-Muñoz, F., Melet, A, Meyssignac, B., Mulet, S., Buongiorno Nardelli, B., O'Dea, E., Olason, E., Paulmier, A., Pérez-González, I., Reid, R., Racault, M. F., Raitsos, D. E., Ramos, A., Sykes, P., Szekely, T., and Verbrugge, N., The Copernicus Marine Environment Monitoring Service Ocean, https://doi.org/10.1080/1755876X.2016.1273446, 2016.
von Schuckmann, K., Storto, A., Simoncelli, S., Raj, R. P., Samuelsen, A., Pascual-Collar, A., Garcia-Sotillo, M., and Szerkely, T.: Ocean Heat Content, in: Copernicus Marine Service Ocean State Report, edited by: von Schuckmann, K., Le Traon, P. Y., Smith, N., Pascual, A., Brasseur, P., Fennel, K., Djavidnia, S., Aaboe, S., Fanjul, E. A., Autret, E., Axell, L., Aznar, R., Benincasa, M., Bentamy, A., Boberg, F., Bourdallé-Badie, R., Nardelli, B. B., Brando, V. E., Bricaud, C., Breivik, L. A., Brewin, R. J. W., Capet, A., Ceschin, A., Ciliberti, S., Cossarini, G., de Alfonso, M., Pascual-Collar, A., de Kloe, J., Deshayes, J., Desportes, C., Drévillon, M., Drillet, Y., Droghei, R., Dubois, C., Embury, O., Etienne, E., Fratianni, C., García Lafuente, J., Garcia-Sotillo, M., Garric, G., Gasparin, F., Gerin, R., Good, S., Gourrion, J., Grégoire, M., Greiner, E, Guinehut, S., Gutknecht, E., Hernandez, F., Hernandez, O., Høyer, J., Jackson, L., Jandt, S., Josey, S., Juza, M., Kennedy, J., Kokkini, Z., Korres, G., Kõuts, M., Lagemaa, P., Lavergne, T., le Cann, B., Legeais, J. F., Lemieux-Dudon, B., Levier, B., Lien, V., Maljutenko, I., Manzano, F., Marcos, M., Marinova, V., Masina, S., Mauri, E., Mayer, M., Melet, A., Mélin, F., Meyssignac, B., Monier, M., Müller, M., Mulet, S., Naranjo, C., Notarstefano, G., Paulmier, A., Pérez Gomez, B., Pérez Gonzalez, I., Peneva, E., Perruche, C., Peterson, K. A., Pinardi, N., Pisano, A., Pardo, S., Poulain, P. M., Raj, R. P., Raudsepp, U., Ravdas, M., Reid, R., Rio, M. H., Salon, S., Samuelsen, A., Sammartino, M., Sammartino, S., Britt Sandø, A., Santoleri, R., Sathyendranath, S., She, J., Simoncelli, S., Solidoro, C., Stoffelen, A., Storto, A., Szerkely, T., Tamm, S., Tietsche, S., Tinker, J., Tintore, J., Trindade, A., van Zanten, D., Vandenbulcke, L., Verhoef, A., Verbrugge, N., Viktorsson, L., Wakelin, S. L., Zacharioudaki, A., and Zuo, H., J. Oper. Oceanogr., 11, S1–S142, https://doi.org/10.1080/1755876X.2018.1489208, 2018.
von Schuckmann, K., Cheng, L., Palmer, M. D., Hansen, J., Tassone, C., Aich, V., Adusumilli, S., Beltrami, H., Boyer, T., Cuesta-Valero, F. J., Desbruyères, D., Domingues, C., García-García, A., Gentine, P., Gilson, J., Gorfer, M., Haimberger, L., Ishii, M., Johnson, G. C., Killick, R., King, B. A., Kirchengast, G., Kolodziejczyk, N., Lyman, J., Marzeion, B., Mayer, M., Monier, M., Monselesan, D. P., Purkey, S., Roemmich, D., Schweiger, A., Seneviratne, S. I., Shepherd, A., Slater, D. A., Steiner, A. K., Straneo, F., Timmermans, M.-L., and Wijffels, S. E.: Heat stored in the Earth system: where does the energy go?, Earth Syst. Sci. Data, 12, 2013–2041, https://doi.org/10.5194/essd-12-2013-2020, 2020.
von Schuckmann, K., Monier, M., and Drévillon, M.: EU Copernicus Marine Service Quality Information Document for the Global Ocean Heat Content trend map from Reanalysis & Multi-Observations Reprocessing, GLOBAL_OMI_OHC_trend, issue 1.0, Mercator Ocean International, https://catalogue.marine.copernicus.eu/documents/QUID/CMEMS-OMI-QUID-GLO-OHC.pdf (last access: 4 April 2023), 2021.
WMO: Weather ready, Climate smart – Supporting the 2030 Agenda for Sustainable Development, World Meteorological Organisation Bulletin, 66, edited by: Mananekova, E. and Castonguay, S., World Meteorological Organisation, Geneva, Switzerland, https://library.wmo.int/?lvl=notice_display&id=20022 (last access: May 2023), 2017.
- Abstract
- Introduction
- Data and methods
- Analysis of OHC time series
- Analysis of regional trends of OHC
- Analysis of OHC trends across different water masses
- Conclusions
- Code availability
- Data availability
- Author contributions
- Competing interests
- Disclaimer
- Acknowledgements
- Review statement
- References
- Supplement