the Creative Commons Attribution 4.0 License.
the Creative Commons Attribution 4.0 License.
 | 27 Sep 2023 | OSR7 | Chapter 2.6
High-frequency radar-derived coastal upwelling index
Pablo Lorente
Anna Rubio
Emma Reyes
Lohitzune Solabarrieta
Silvia Piedracoba
Joaquín Tintoré
Julien Mader
Coastal upwelling has been extensively studied since it plays a critical role in the connectivity between offshore waters and coastal ecosystems, which has impacts on water quality, fisheries, and aquaculture production. Significant efforts have been devoted to the quantification of the intensity, duration, and variability of this phenomenon by means of coastal upwelling indexes (CUIs), derived from wind, sea level pressure, or sea surface temperature data. Although valuable, first-order descriptors, such classical indexes have been reported to present some limitations. As one of the major shortcomings is the omission of the direct influence of ocean circulation, this work introduces a novel CUI, generated from remotely sensed hourly surface current observations provided by a high-frequency radar (HFR). The consistency of the proposed index (CUI-HFR) is assessed in two different oceanographic areas during two distinct time periods: in the north-western Iberian (NWI) peninsula for 2021 and in the Bay of Biscay (BOB) for 2014. To this aim, CUI-HFR is compared against a traditional CUI based on hourly wind observations (CUI-WIND) provided by two buoys. Likewise, the skill of CUI-HFR to identify upwelling and downwelling processes is also qualitatively evaluated. Complementarily, the prognostic capabilities of the GLOBAL analysis and forecasting system to accurately reproduce upwelling and downwelling events in the NWI area are also analysed (CUI-GLOBAL). Results obtained in these two pilot areas revealed the following: (i) noticeable agreement between CUI-HFR and CUI-WIND, with correlation coefficients above 0.67; and (ii) a proven ability of CUI-HFR and CUI-GLOBAL to categorize a variety of upwelling and downwelling episodes, which highlights their potential applicability for direct upwelling monitoring over any coastal area of the global ocean.
- Article
(3859 KB) - Full-text XML
- BibTeX
- EndNote


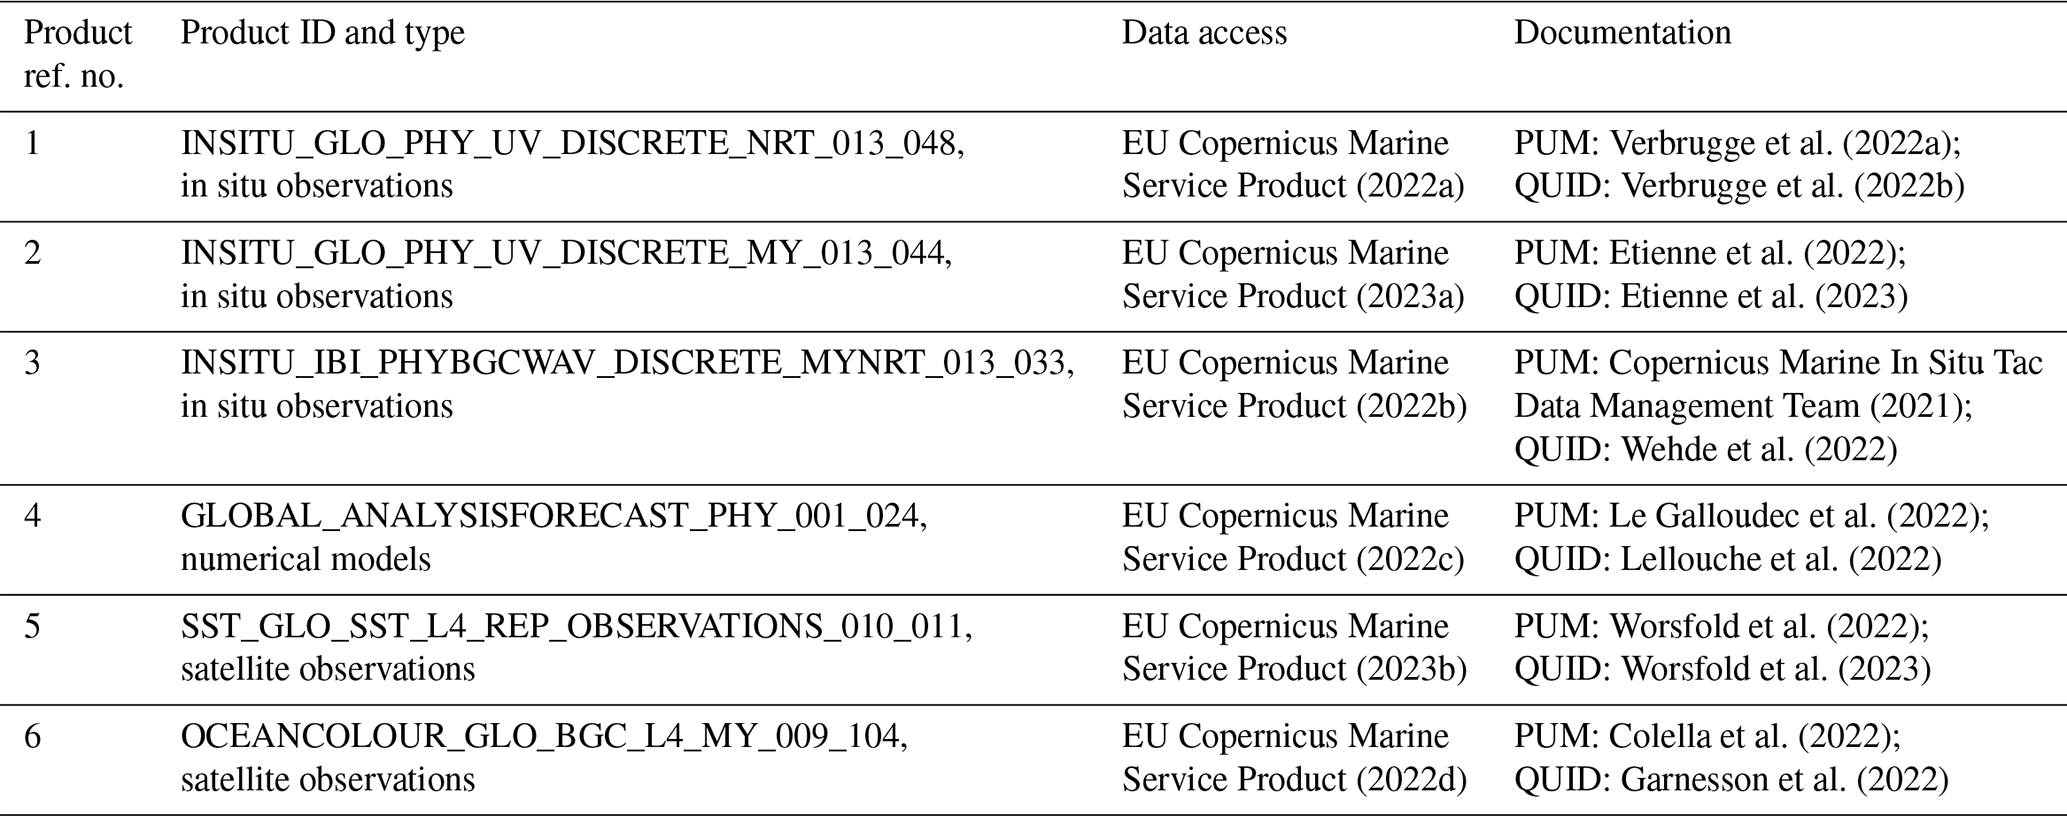
Table 1Products from the Copernicus Marine Service used in this study, including the Product User Manual (PUM) and QUality Information Document (QUID). Last access for all web pages cited in this table: 2 June 2023.
Since coastal waters encompass many unique habitats and support a wide range of anthropogenic activities (tourism, transportation, fisheries, etc.), accurate monitoring is required for efficient marine resources management, the preservation of vulnerable ecosystems, and the sustained development of the so-called blue economy (Trincardi et al., 2020).
Cutting-edge technology that has been steadily gaining worldwide recognition as an effective shore-based remote sensing instrument is high-frequency radar – HFR (Roarty et al., 2019). HFR networks have become an essential component of ocean observatories as they collect, in near-real time, fine-resolution maps of the upper-layer flow over broad coastal areas, providing a dynamical framework for other traditional in situ observation platforms (Lorente et al., 2022; Rubio et al., 2017). HFR-derived surface circulation is a reliable source of information for search-and-rescue operations and oil spill tracking, among other practical applications (Reyes et al., 2022; Roarty et al., 2019; Rubio et al., 2017). Equally, it can be used for a detailed investigation of upwelling (UPW) and downwelling (DOW) processes that modulate the connectivity between offshore waters and coastal ecosystems (Lorente et al., 2020; Paduan et al., 2018; Kaplan and Largier, 2006). It occurs when alongshore winds and the Coriolis effect (due to Earth's rotation) combine to drive a near-surface layer of water offshore, a process referred to as Ekman transport (Ekman, 1905). Such cross-shelf transport is compensated for by the vertical uplift of cold and enriched waters that fertilize the uppermost layer. Conversely, during DOW events winds induce net onshore displacement and subduction of surface coastal waters that foster the retention of organic matter and pollutants onto the shoreline with a subsequent impact on residence times and water renewal mechanisms.
Nowadays, there is an emerging question about the impact of anthropogenic pressures on future changes in coastal UPW ecosystems and the potential implications for biodiversity conservation (IPCC, 2022; Abrahams et al., 2021a; Xiu et al., 2018; Bakun et al., 2015; Cropper et al., 2014; Di Lorenzo, 2015). It has been hypothesized that climate change could promote greater land–sea temperature gradients together with stronger alongshore winds, eventually resulting in intensified wind-driven coastal UPW (Di Lorenzo, 2015; Varela et al., 2015; Barton et al., 2013). In Wang et al. (2015), results from an ensemble of climate models showed relevant changes in the timing, duration, intensity, and spatial heterogeneity of coastal UPW in response to future warming in most eastern boundary upwelling systems.
Since there is no available ground-truth observation of vertical currents, diverse coastal upwelling indexes (CUIs) have been derived from historical estimations of other met-ocean parameters (e.g. wind, sea level pressure, or sea surface temperature) to indirectly infer seasonal trends of UPW along the shoreline (Gunduz et al., 2022; Mourre et al., 2023; Abrahams et al., 2021a, b; González-Nuevo et al., 2014; Benazzouz et al., 2014; Wooster et al., 1976; Bakun, 1973). Despite being valuable first-order descriptors, such classical indexes have been reported to provide an incomplete picture of coastal UPW due to a number of limitations, encompassing uncertainties related to the estimation of wind stress or derived from the coarse spatio-temporal resolution of the atmospheric pressure fields used (Jacox et al., 2018).
As one of the major shortcomings is the omission of the direct influence of ocean circulation, the present work intends to fill this gap by introducing a novel CUI, generated from HFR-derived hourly surface current observations (CUI-HFR). Although such an ocean-based index was firstly presented in Lorente et al. (2020) as a proof-of-concept investigation, here we gain further insight into the credibility of the proposed approach by analysing two different regions (Fig. 1a), the north-western Iberian (NWI) peninsula upwelling system and the Bay of Biscay (BOB), for distinct time periods (2021 and 2014, respectively).
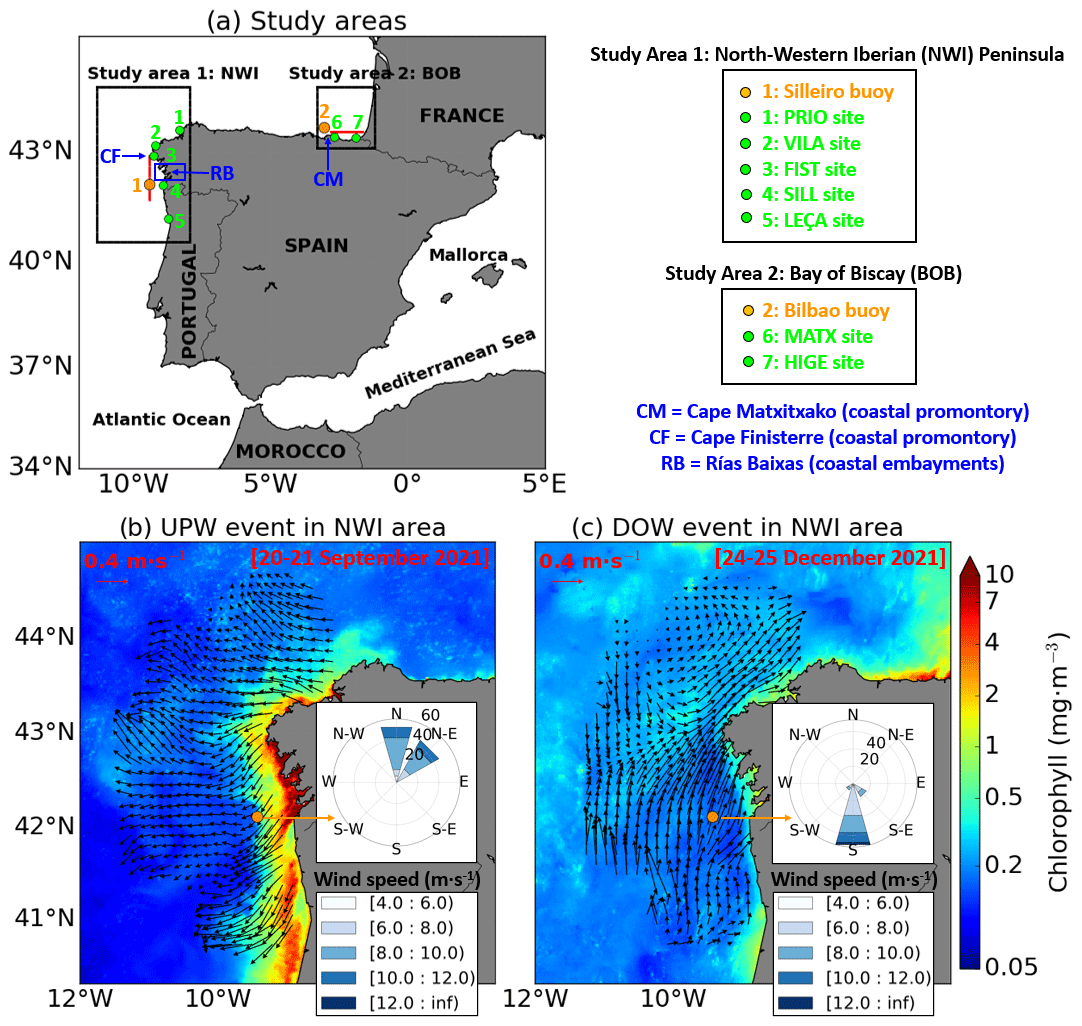
Figure 1(a) Study areas are marked with black squares: the north-western Iberian (NWI) peninsula upwelling system and the Bay of Biscay (BOB), where two high-frequency radars (HFRs) are deployed – product ref. nos. 1 and 2 (Table 1). Green dots denote HFR sites, while orange dots represent the Silleiro buoy and Bilbao buoy locations (product ref. no. 3) (Table 1), moored within the NWI and BOB areas, respectively. Red lines indicate selected transects: HFR-derived surface circulation and satellite-derived chlorophyll distribution – product ref. no. 6 (Table 1) – during a 2 d (b) summer upwelling event and (c) winter downwelling event in the NWI area, when intense northerly and southerly winds were predominant, respectively.
In the NWI region, which extends from 40 to 44∘ N (Fig. 1a), the ocean dynamics are regulated by the relative changes in the strength and position of the Azores high-pressure system with respect to the Iceland low-pressure system, defining two largely wind-driven oceanographic seasons (Lorente et al., 2020). The UPW season is predominant from March to October when northerly winds prevail and induce a south-westward surface flow. The upward flux of cold deep waters supplies nutrients to the euphotic zone, resulting in an elongated alongshore strip of maximum concentration of chlorophyll (Fig. 1b). During the rest of the year, the predominant DOW season is characterized by (i) prominent southerly winds that drive the surface circulation northwards and (ii) low biological productivity, with nutrient concentrations confined in shallower coastal areas (Fig. 1c).
The south-eastern BOB (Fig. 1a) is characterized by complex topography wherein a combination of different temporal and spatial ocean processes (i.e. slope currents, eddies) governs the local hydrodynamics (Llope et al., 2006). Coastal UPW and DOW processes depict a marked seasonal variability, linked to seasonal changes in the wind regime (Prego et al., 2012; Botas et al., 1990). During autumn and winter, south-westerly winds are prevalent and induce DOW events. In spring and summer, winds are less intense and more variable, with the dominance of easterlies and north-easterlies driving weak but frequent UPW episodes (Fontán et al., 2008). Although UPW (whenever present) can be considered weak in comparison with typical UPW areas worldwide (Borja et al., 2008), this phenomenon has been investigated in the BOB region as they are significantly correlated with the recruitment of commercial fish species (Caballero et al., 2018). In particular, 55 % of the recruitment variability of anchovy fisheries can be explained by upwelling over the spawning area (Borja et al., 2008). Therefore, the HFR deployed in this region might be very useful to monitor the surface circulation and characterize the UPW variability by means of a CUI (Caballero et al., 2018).
The main goal of this contribution is twofold: firstly, to assess the validity of the proposed ocean-based CUI-HFR through its comparison against a traditional CUI based on hourly wind observations (CUI-WIND) provided by adjacent in situ buoys (Fig. 1a). Likewise, the skill of CUI-HFR to categorize UPW and DOW events was also qualitatively evaluated. The second part of the goal is to infer the prognostic capabilities of the GLOBAL analysis and forecasting system (Lellouche et al., 2018) to accurately reproduce UPW and DOW events previously detected in the NWI region. In this context, hydrodynamic models can serve as ancillary tools for gappy HFR surface current maps by offering a seamless predictive picture of the ocean state.
This work is structured as follows: Sect. 2 outlines the observational and modelled data sources. Section 3 describes the methodology adopted. Results are presented and discussed in Sect. 4. Finally, principal conclusions are drawn in Sect. 5.
All the observational and modelled products used in this study are gathered in Table 1 and thoroughly described below.
2.1 The HFR system deployed in NWI
A five-site CODAR SeaSonde HFR network, deployed along the Galician–Portuguese coast (Fig. 1b) since 2004, was used in this work (product ref. nos. 1 and 2 in Table 1). The network is jointly operated by Puertos del Estado, INTECMAR–Xunta de Galicia, and the Portuguese Hydrographic Institute. While the southernmost HFR site operates at 13.5 MHz, the other four sites operate at a central frequency of 4.86 MHz, providing hourly radial vectors that are representative of the currents moving toward or away from the site. All radial current vectors (from two or several sites) within a predefined search radius of 25 km are geometrically combined to estimate hourly total current vectors on a Cartesian regular mesh of 6×6 km horizontal resolution and 200 km range (Lorente et al., 2015, 2020). Data are quality-controlled and delivered freely through the European HFR Node, which oversees the harvesting, harmonization, formatting, and distribution of HFR data (Corgnati et al., 2021).
HFR-derived data used in this study were collected from August to December 2021, once the southernmost site (LEÇA) was calibrated and integrated into the pre-existing network. During this 5-month period, the five sites were simultaneously operational, and the spatial coverage was at its maximum extent. The specific geometry of the HFR domain and, hence, the intersection angles of radial vectors handicap the accuracy of the total current vectors resolved at each grid point. Such a source of uncertainty is quantified by a dimensionless parameter called geometrical dilution of precision – GDOP (Chapman et al., 1997; Barrick, 2006), which typically increases with the distance from the HFR sites. In this work, a cut-off filter of 3 was imposed for the GDOP to get rid of estimations affected by higher uncertainties (Fig. A1a).
2.2 The HFR system deployed in BOB
This HFR system, deployed in the south-eastern BOB since 2009 and owned by Euskalmet (product ref. nos. 1 and 2 in Table 1), is a two-site CODAR SeaSonde network (Fig. 1a) that operates at a central frequency of 4.46 MHz, providing hourly current maps (representative of the first 1.5 m of the water column) with a spatial resolution of 5 km in an area up to 150 km from the coast (Solabarrieta et al., 2014). The consistent performance of this system and its potential for the study of ocean processes and transport patterns have already been demonstrated by previous works (Manso-Narvarte et al., 2018; Solabarrieta et al., 2014, 2015, 2016; Rubio et al., 2011, 2018).
Data are collected, processed, and quality-controlled following standard recommendations (Mantovani et al., 2020). They are later distributed in near-real time through the European HFR Node as part of the Copernicus Marine Service products. Again, a cut-off filter of 3 was imposed for the GDOP parameter to mitigate the impact of geometrical uncertainties on total current vectors accuracy (Fig. A1b). Finally, HFR-derived current estimations used in this work were collected from April to August 2014, when the system operated consistently and provided the longest data series (Solabarrieta et al., 2015).
2.3 In situ buoys
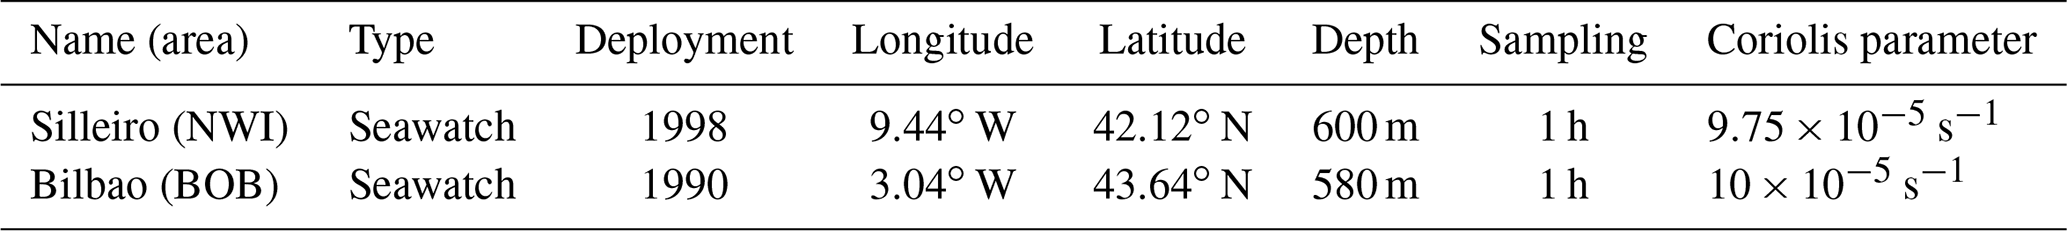
Basic features of two deep-ocean buoys (product ref. no. 3 in Table 1), deployed within each HFR footprint (Fig. 1a) and operated by Puertos del Estado, are gathered in Table 2. Both in situ devices collect quality-controlled estimations of sea surface temperature, salinity, and currents, among other physical parameters. Furthermore, both buoys are equipped with a wind sensor, providing hourly averaged wind vectors at 3 m height.
Table 2Description of the buoys (product ref. no. 3 in Table 1) deployed within the coverage of each HFR system (product ref. no. 1 and no. 2 in Table 1), as shown in Fig. 1. More information on products can be found in the text and in the product table.
2.4 GLOBAL analysis and forecasting system
The operational Mercator global ocean analysis and forecast system provides 10 d of 3D global ocean forecasts updated daily. This product (product ref. no. 4 in Table 1), named GLOBAL_ANALYSIS_FORECAST_PHY_001_024 and freely available through the Copernicus Marine Service catalogue, includes daily and monthly mean files of temperature, salinity, currents, sea level, mixed layer depth, and ice parameters from the surface to seafloor (5500 m depth) over the global ocean. It also includes hourly mean surface fields for sea level height, temperature, and currents. The global ocean output files are displayed on 50 vertical levels with a ∘ horizontal resolution over a regular latitude and longitude equirectangular projection. This product presents temporal coverage from November 2020 to the present.
The system is based on the Nucleus for European Modelling of the Ocean (NEMO) v3.1 ocean model (Madec and the NEMO team, 2008) and is forced with 3-hourly atmospheric fields provided by the European Centre for Medium-Range Weather Forecasts. The GLOBAL system does not include tides or pressure forcing. Altimeter data, in situ temperature and salinity vertical profiles, and satellite sea surface temperature data are jointly assimilated to estimate the initial conditions for numerical ocean forecasting. For further details, the reader is referred to the GLOBAL Product User Manual (Le Galloudec et al., 2022) and to Lellouche et al. (2018).
2.5 Satellite-derived data
Surface fields of temperature and chlorophyll (product ref. nos. 5 and 6 in Table 1, respectively) provided by satellite missions were downloaded from the Copernicus Marine Service catalogue and used to analyse the impact of UPW and DOW events on their spatial distribution.
Bakun (1973, 1975) proposed a CUI (the so-called Bakun index) based on Ekman theory (Ekman, 1905) and available estimates of atmospheric conditions to derive estimates of cross-shore Ekman transport as a proxy for coastal UPW. Following the same approach, in the present contribution two CUIs were computed (as benchmarks to compare CUI-HFR against) from hourly wind estimations provided by in situ buoys moored within each HFR coverage (Fig. 1a). Then, the CUI-WIND is defined as follows.
Here, ρa is the air density at standard temperature and pressure conditions (1.22 kg m−3), ρw is the seawater density (1025 kg m−3), Cd is a dimensionless empirical drag coefficient (), and f is the latitude-dependent Coriolis parameter (whose values are shown in Table 2). In this case, u and v denote the hourly time series of zonal and meridional wind at 3 m height, respectively, as measured by each buoy. The sign is changed to define positive (negative) magnitudes of CUI-WIND as a response to the predominant equatorward (poleward) wind over NWI and the predominant westward (eastward) wind over BOB.
Assuming the prompt and direct reaction of the upper ocean layer to intense and prolonged wind forcing in NWI (Herrera et al., 2005) and BOB (Solabarrieta et al., 2015), it seems reasonable to develop an ocean-based indicator for UPW and DOW conditions. Analogously, the CUI-HFR is defined as follows.
Here, u and v represent the filtered hourly time series of zonal and meridional surface current velocities (m s−1) provided by the HFR, respectively. A 25 h running-mean filter was used to smooth time series data by suppressing the main diurnal and semidiurnal tidal constituents (Shirahata et al., 2016), particularly the M2 signal, which is the largest harmonic constituent in the study area. Furthermore, C represents a dimensionless parameter that acts as a proportionality constant between wind and surface current observations, assuming a direct relationship between the two parameters (Lorente et al., 2020; Solabarrieta et al., 2015). The value of this parameter, which depends on the selected study area, can be easily derived from the best linear fit against CUI-WIND. For instance, C is equal to 2300 (3500) for the NWI (BOB) region.
In order to obtain a single time series of CUI-HFR, which is representative of the entire study area, hourly 2D maps were spatially averaged over a delimited HFR spatial subdomain (see Fig. A1). In particular, two prerequisites were imposed to select such a subdomain: (i) it should be between 60 and 1200 m bathymetric depths to represent coastal waters while avoiding shallow water effects and the potential impact of impulsive-type freshwater discharges on the coastal circulation, and (ii) a predefined threshold of 3 was established for the GDOP parameter to minimize geometrical uncertainties in the remotely sensed currents. Finally, as a rough approximation, we also assumed that the local coastline was perfectly aligned in the south–north axis for the NWI region and in the east–west axis for the BOB region, which implies that v and u surface current components were parallel to the coastline.
Representative UPW and DOW episodes were selected for each study area to analyse the prevailing met-ocean conditions (wind and surface circulation, among others) along with the spatial distribution of CUI. In the case of the NWI area, a CUI was also derived from the surface currents predicted by the GLOBAL analysis and forecast system (Lellouche et al., 2018) following Eq. (3). CUI-GLOBAL and CUI-HFR were intercompared to infer strengths and weaknesses of each index and infer the potential of the GLOBAL model as a predictive tool for UPW conditions in this specific region. To this aim, a variety of outcomes were computed, ranging from 2D maps, time series, and the best linear fit of scatter plots to Hovmöller diagrams, which are the common way of plotting met-ocean data to depict changes over time of scalar quantities such as the CUI (Benazzouz et al., 2014).
To quantify the consistency of both CUI-HFR and CUI-GLOBAL in the NWI area, hourly time series were compared against CUI-WIND, derived from wind estimations provided by the Silleiro buoy (Fig. 2a–b). The visual resemblance between the three different CUIs was noticeable, with significantly high correlation coefficients: (i) 0.72 and 0.74 between CUI-GLOBAL and CUI-WIND for the entirety of 2021 and for August–December 2021, respectively, as reflected by their best linear fit of scatter plots (Fig. A2a–b); (ii) 0.80 between CUI-HFR and CUI-WIND for August–December 2021 (Fig. A2c); (iii) 0.91 between CUI-GLOBAL and CUI-HFR for August–December 2021 (Fig. A2d). According to the statistical results in Fig. A2a–c, we can state that (i) the slope and intercept values were close to 1 and moderately low, respectively, and (ii) ocean-based CUI and CUI-WIND are strongly correlated, likely due to the role of alongshore wind stress as a primary driver of UPW conditions in the NWI area. Hourly alongshore winds (from Silleiro buoy) and HFR-derived alongshore currents (at the grid point closest to the buoy) are highly correlated (0.80) for August–December 2021 (not shown). It is also worth highlighting the ability of the GLOBAL model to capture many of the most relevant UPW (positive values) and DOW (negative values) episodes such as those observed during February 2021, whose values were higher than 3000 m3 s−1 km−1 and lower than −5000 m3 s−1 km−1, respectively (Fig. 2a).
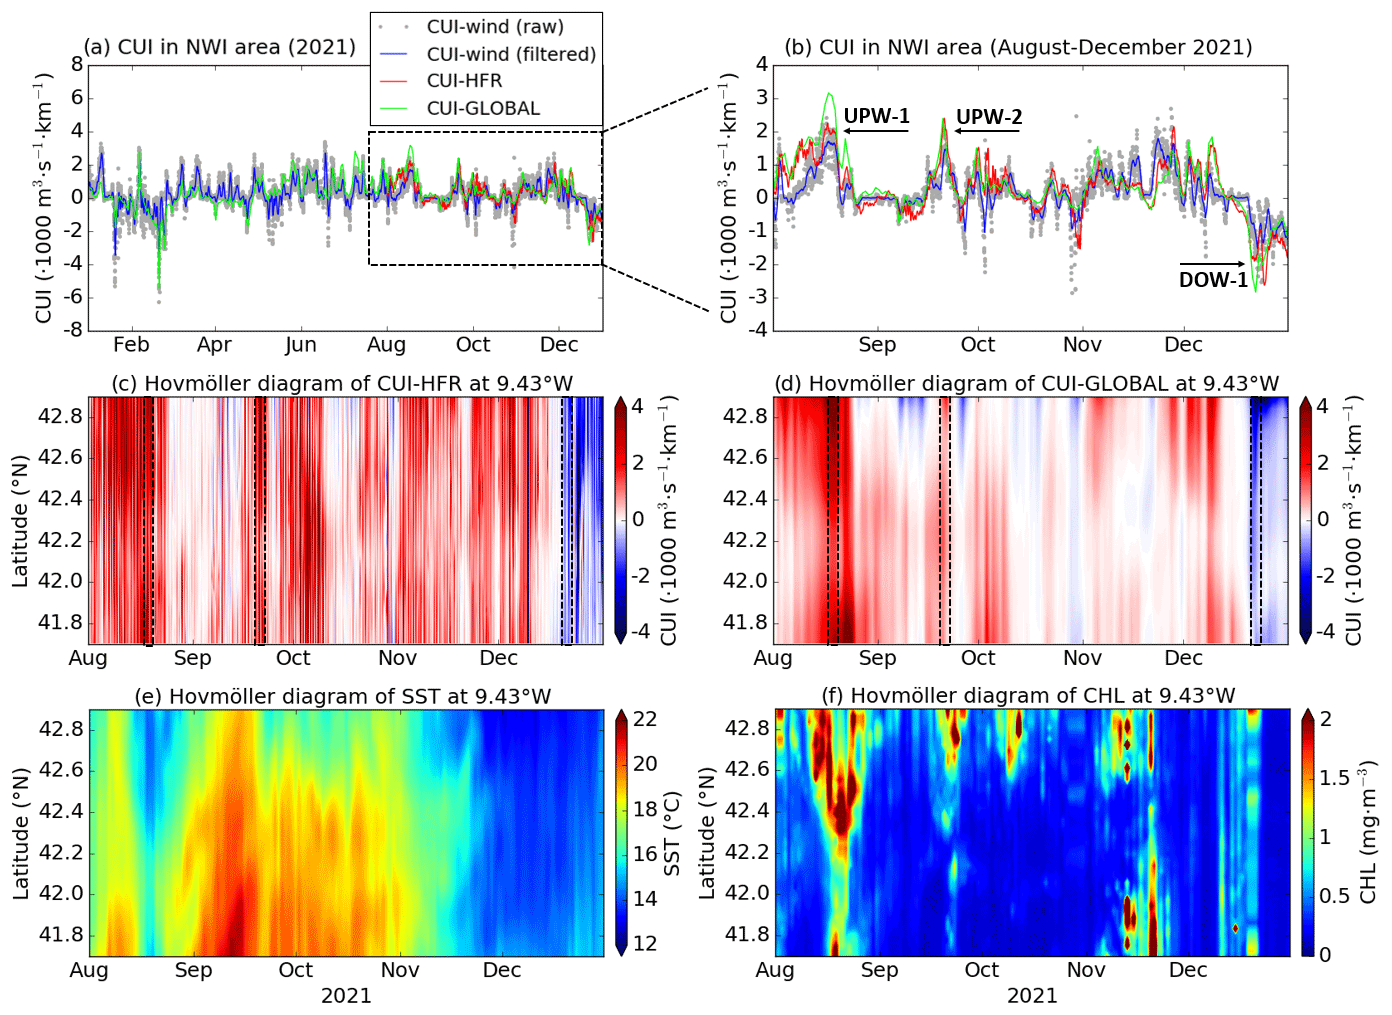
Figure 2Time series of diverse hourly coastal upwelling index (CUI) in the north-western Iberia (NWI) region (a) for the entirety of 2021 and (b) for August–December 2021, as derived from wind observations from the Silleiro buoy (CUI-WIND) (product ref. no. 3; Table 1), HFR surface currents (CUI-HFR) (product ref. nos. 1 and 2; Table 1), and modelled surface currents (CUI-GLOBAL) (product ref. no. 4; Table 1). CUI-WIND raw (grey dots) was filtered by applying a 24 h moving mean (blue line). Hovmöller diagrams of (c) CUI-HFR, (d) CUI-GLOBAL, (e) sea surface temperature (SST) (product ref. no. 5; Table 1), and (f) chlorophyll (Chl) (product ref. no. 6; Table 1) concentration during the period August–December 2021 for a selected transect of constant longitude (9.43∘ W), depicted in Fig. 1a.
With regard to the 5-month period (August–December 2021) of concurrent CUI estimations (Fig. 2b), the degree of agreement was rather satisfactory. Both ocean-based CUIs were able to reproduce the temporal variability, capturing the most prominent events fairly well (marked and denoted in black). Hovmöller diagrams of CUI were computed at a selected transect of constant longitude (9.43∘ W, shown in Fig. 1a) to infer its spatio-temporal evolution (Fig. 2c–d). There were clear similarities (in terms of intensity and timing) between CUI-HFR and CUI-GLOBAL during the entire 5-month period, with a predominance of UPW (DOW) events during the summer and autumn (early winter) of 2021.
The Hovmöller diagrams of sea surface temperature (SST) and chlorophyll a (Chl) concentration at the same transect corroborated the consistency of the proposed approach (Fig. 2e–f). An abrupt cooling (with SST below 14 ∘C) and a relevant peak of Chl (with values above 2 mg m−3) were observed by mid-August 2021, coincident with the UPW-1 event previously categorized (Fig. 2b–d). Equally, the moderate UPW episode that took place on 20 September 2021 (denoted as UPW-2 in Fig. 2b) could also be related to a local drop in SST (Fig. 2e) and a maximum of Chl (Fig. 2f) at the northernmost sector of the transect, in the vicinity of Cape Finisterre (Fig. 1a), which has been largely documented to act as the locus of frequent UPW (Lorente et al., 2020; Torres et al., 2003). Finally, the intense DOW event identified by CUI-HFR and CUI-GLOBAL for 21 December 2021 (denoted as DOW-1 in Fig. 2b) was coincident with a general minimum of Chl concentration (Fig. 2f), resulting in reduced primary production. These findings confirm the strong connection between the wind-induced circulation, coastal UPW, and the modulation of SST and Chl fields at the uppermost layer, in line with previous works. For instance, Alvarez et al. (2012) postulated that the high seasonal variability of Chl in NWI was mainly related to UPW episodes during spring and summer, while Chl variations depended on other additional factors (such as the input of nutrients from land run-off) during autumn and winter.
To gain further insight into the three specific events previously identified (Fig. 2b), daily averaged maps of CUI and circulation patterns were computed from current estimations provided by both HFR and the GLOBAL model (Fig. 3). During the UPW-1 (Fig. 3a–b) and UPW-2 (Fig. 3c–d) events, intense northerlies (with gusts above 10 m s−1) were predominant over the study area according to the wind roses derived from Silleiro buoy observations. Despite the observed discrepancies in magnitude and direction, maps of wind-induced surface currents shared some common features: (i) the prevailing S-SW surface circulation (as a response to northerly winds) along with the typical offshore deflection of the flow, associated with UPW-favourable conditions; (ii) the rather uniform circulation westwards (south-westwards) to the north (south) of Cape Finisterre (indicated in Fig. 1a); (iii) the absence of submesoscale structures (i.e. eddies, small meanders) due to the strong wind-induced homogenization. It is also worth mentioning that the GLOBAL model predicted a more pronounced alongshore circulation (i.e. a more intense meridional – v – velocity component) to the south of this coastal promontory, which probably gave rise to higher CUI values (Fig. 3b) than those derived from HFR current estimations (Fig. 3a), according to Eq. (3). Indeed, this could be also observed in Fig. 2b where the peak of CUI-GLOBAL (green line) was higher than the concomitant peak of CUI-HFR (red line) during the UPW-1 episode. By contrast, local maximums of CUI-GLOBAL and CUI-HFR time series during the UPW-2 event were rather alike in terms of timing and strength (Fig. 2b). Analogously, the spatial distribution of CUI was quite similar for HFR (Fig. 3c) and GLOBAL (Fig. 3d), with a core of maximum UPW observed to the south of Rías Baixas (several coastal embayments characterized by high biodiversity, denoted in Fig. 1a). The main discrepancy between the two patterns was that in the case of GLOBAL, the peak appeared in the form of an elongated belt of positive values of CUI (confined landward close to the shoreline), whereas the HFR-derived pattern revealed a wider dipole-like structure, with two main cores of maximum CUI-HFR (close to 4000 m3 s−1 km−1). The drop in CUI-HFR is consistent (in timing and location) with the drop in Chl concentration shown in Fig. 1b, supporting this HFR pattern, which was already documented in Lorente et al. (2020). Finally, during the DOW-1 event (Fig. 2b), both HFR and GLOBAL captured the so-called Iberian poleward current fairly well, a narrow surface poleward flow along the NWI shelf edge (Torres and Barton, 2006). As reflected in Fig. 3e–f, DOW-favourable southerly winds induced a net flow to the north that settled in the continental shelf and circuited the western and northern Iberia margins. Again, the main difference resided in the existence of both a longitudinal gradient and a narrow strip of very negative CUI values close to the coastline in the case of GLOBAL (Fig. 3f), while the HFR-derived map of CUI exhibited a dipole-like distribution wherein the values were not so negative (Fig. 3e). This was also evidenced in the spatially averaged hourly time series of CUI shown in Fig. 2b, where the drop in CUI-GLOBAL was sharper than observed in CUI-HFR.
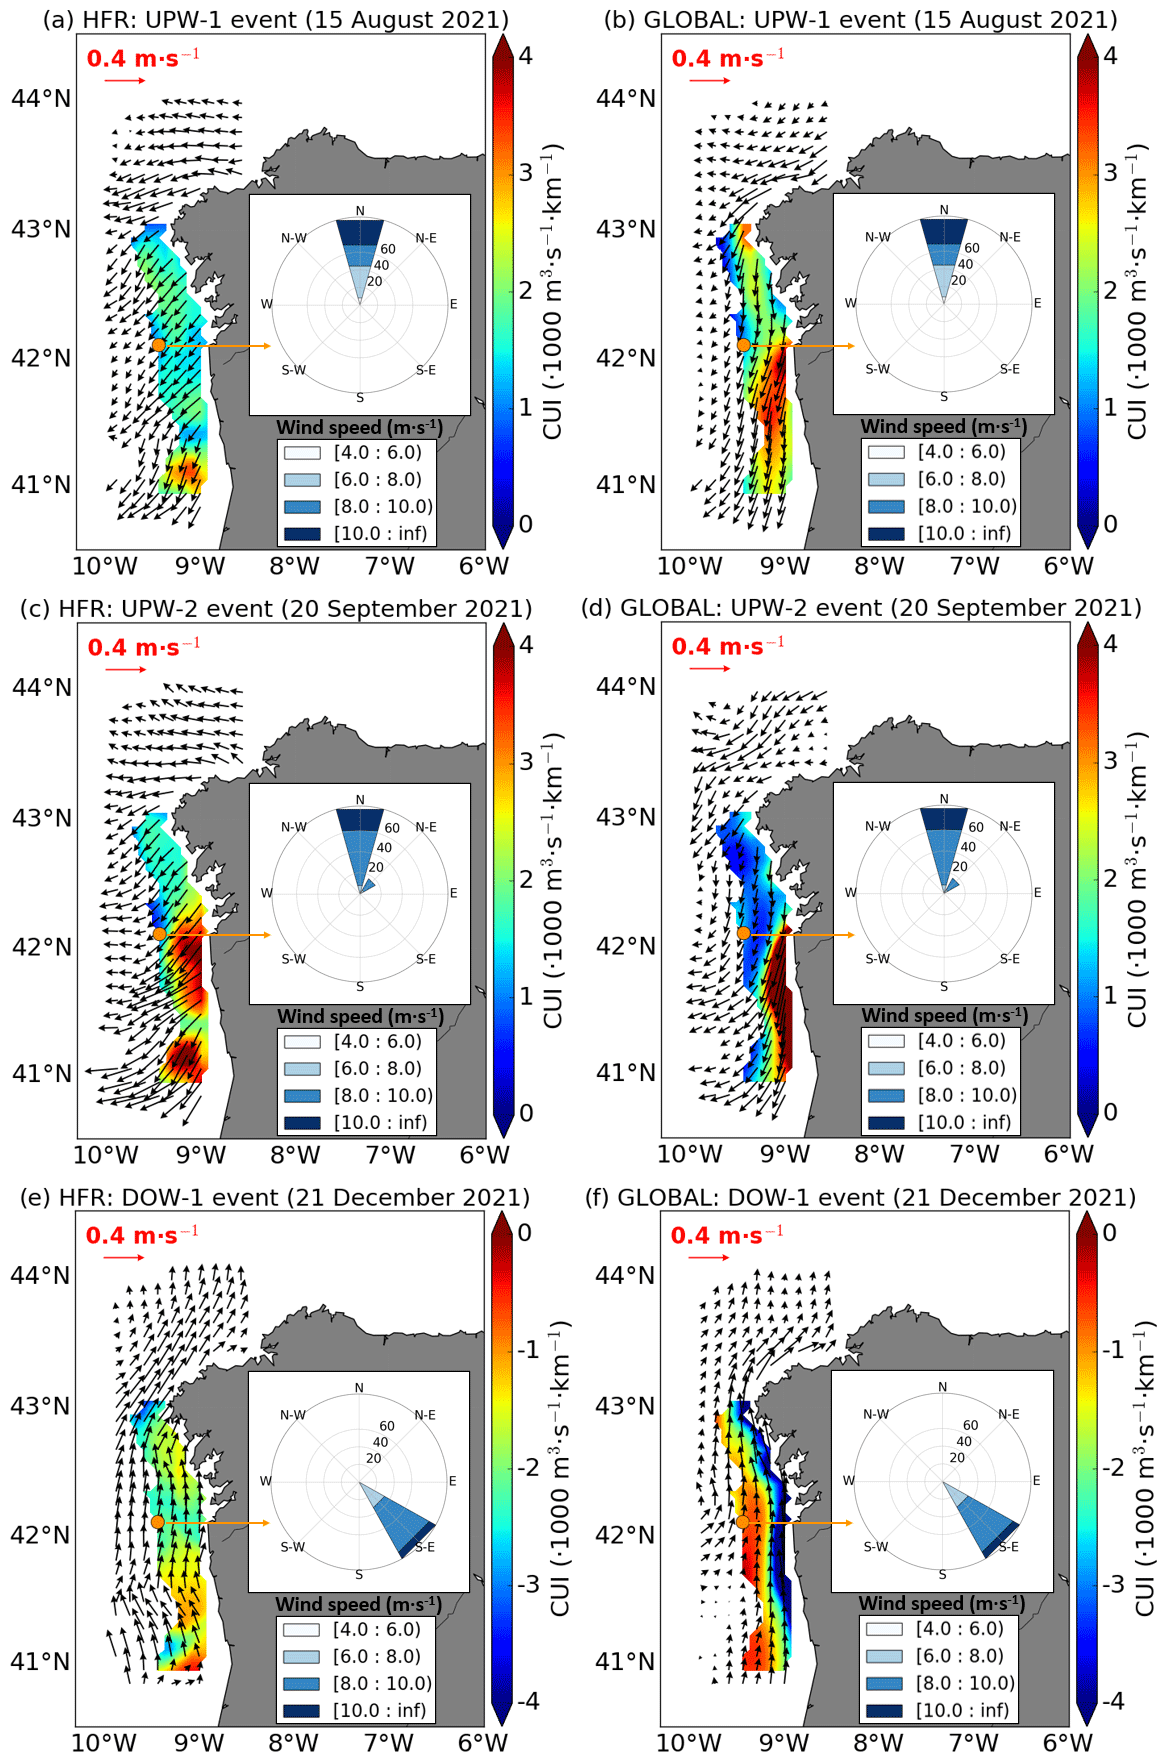
Figure 3Daily averaged maps of circulation and coastal upwelling index (CUI) as derived from surface current estimations provided by a high-frequency radar (HFR, left column, product ref. no. 1 and no. 2 in Table 1) and the GLOBAL model (right column, product ref. 4) for each specific upwelling (UPW) and downwelling (DOW) episode categorized in Fig. 2b. Daily wind roses derived from hourly wind estimations from the Silleiro buoy (represented by an orange dot, product ref. no. 3 in Table 1) are also provided, indicating incoming wind direction and speed.
To further verify the validity of the proposed methodology, a similar CUI was generated for a 5-month period (April–August 2014) from an hourly surface current estimation provided by another HFR system deployed in the BOB since 2009 (Solabarrieta et al., 2014). This CUI-HFR was validated against a CUI-WIND based on hourly estimations provided by the Bilbao buoy (located within the HFR footprint and depicted in Fig. 1a), used here as a reference benchmark (Fig. 4a). The visual resemblance between the two time series was significantly high, with a correlation coefficient and a slope of 0.68 and 1, respectively, for a set of 3672 hourly data (Fig. A2e). During the analysed period, DOW events (5) were predominant with respect to UPW episodes (1). It seemed that CUI-HFR tended to slightly underestimate the intensity of some DOW events (i.e. DOW-2, DOW-3, and DOW-4), while it clearly overestimated the strength of the UPW-1 episode (Fig. 4a).
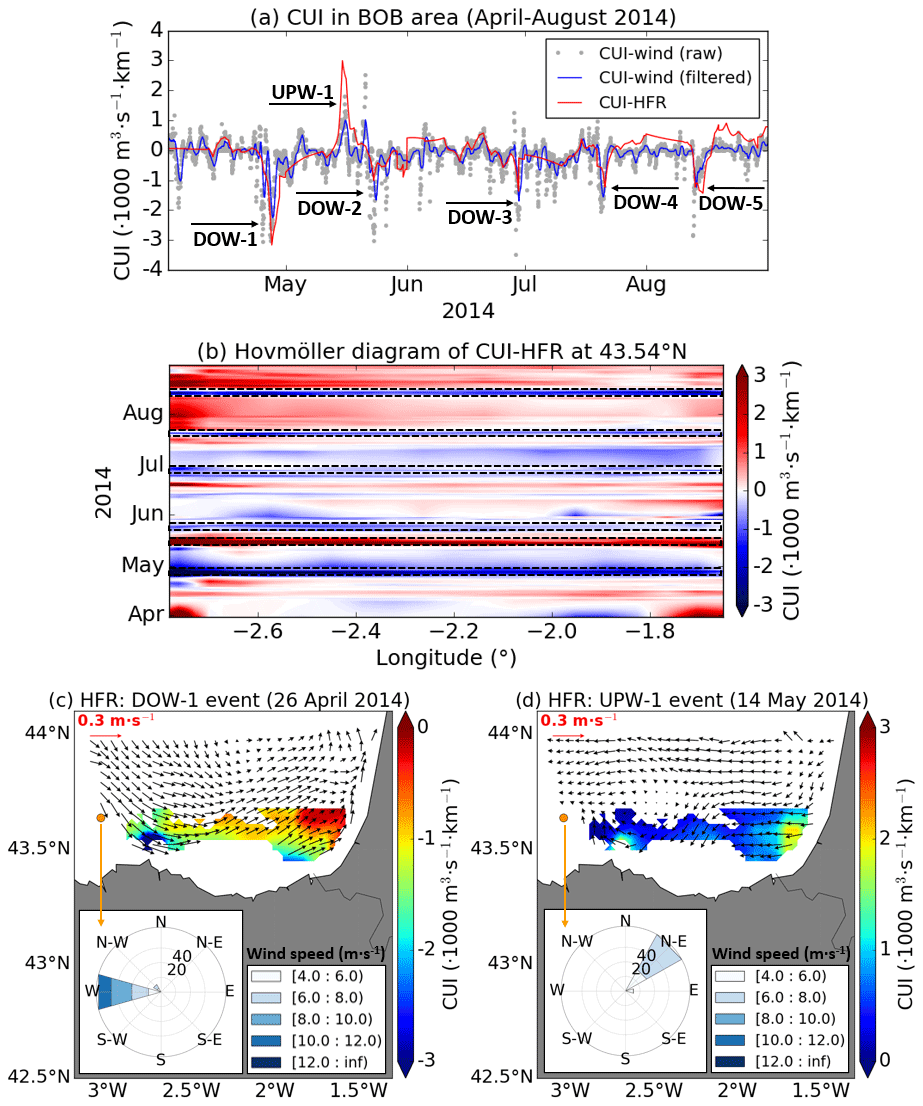
Figure 4(a) Coastal upwelling indexes (CUIs) in the Bay of Biscay (April–August 2014) based on hourly wind observations (from the Bilbao buoy, product ref. no. 3 in Table 1) and hourly surface currents (from an HFR system, product ref. no. 1 and no. 2 in Table 1). CUI-WIND raw (grey dots) was filtered by applying a 24 h moving mean (blue line). Identification of six UPW–DOW events. (b) Hovmöller diagram of CUI-HFR for a transect of constant latitude, where UPW (DOW) events are marked with black dotted squares. (c–d) Daily averaged maps of surface circulation and CUI-HFR for two events. Daily wind roses from the Bilbao buoy (represented by an orange dot, product ref. no. 3 in Table 1) are also provided, indicating incoming wind direction and speed.
A Hovmöller diagram of CUI-HFR was computed at a selected transect of constant latitude (43.54∘ N, denoted in Fig. 1a) to deduce its spatio-temporal variability (Fig. 4b). The six events previously categorized were clearly observed and marked in the diagram, where the UPW and DOW features were evidenced throughout the entire transect. A number of secondary UPW events could be observed: although relevant in strength and duration, they were spatially confined to the westernmost sector of the transect (coincident with Cape Matxitxako, denoted in Fig. 1a) during the beginning of April, late July, and early August 2014. This fact highlighted the importance of coastal promontories as modulators of UPW processes by inducing important wind stress variations and zones of retention (Pitcher et al., 2010).
During DOW-1 event (Fig. 4c), intense westerly winds (up to 10–12 m s−1) were dominant and a counterclockwise recirculation pattern prevailed, revealing the associated mechanisms of convergence and subduction (and the subsequent vertical mixing), especially in the vicinity of Cape Matxitxako (denoted in Fig. 1a) where a local minimum of CUI (down to −3000 m3 s−1 km−1) was detected. By contrast, weak north-easterly winds induced a general surface flow to the west during UPW-1 (Fig. 4d). Two local cores of UPW (ranging from 1000 to 1500 m3 s−1 km−1) could be observed: one on the south-western French coast and a secondary one near Cape Matxitxako. The rest of the DOW events denoted in Fig. 4a (not shown) were very similar to the DOW-1 case shown here (Fig. 4c), sharing common circulation features and comparable spatial distributions of CUI. Most of the surface current patterns were clearly related to specific wind patterns that are recurrent in the study area, in line with Borja et al. (2008) and Solabarrieta et al. (2015).
Over the last decades, relevant efforts have been dedicated to the indirect quantification of the intensity, duration, and variability of UPW since it seriously impacts biogeochemical cycles and ecosystem productivity (Lachkar and Gruber, 2011). Diverse CUIs have been traditionally derived from wind or sea level pressure estimations, but they present some limitations such as the omission of the direct influence of ocean circulation (Jacox et al., 2018). In the present contribution, attention was placed on the development of a purely ocean-based CUI for the NWI and BOB regions (Fig. 1a), constructed from reliable hourly surface current maps provided by two different HFR remote sensing systems.
In this context, the proposed CUI-HFR presents additional advantages with respect to previous traditional CUIs, namely the following.
- i.
It takes into consideration the direct influence of coastal waters dynamics, thereby providing a more complete portrait of this phenomenon.
- ii.
It provides high-resolution two-dimensional maps that can aid in elucidating the spatial distribution and magnitude of the coastal, together with the potential existence of recurrent patterns and/or filaments in intricate regions with complex geometry configurations. The small-scale belt of UPW, confined in shallower coastal areas and evidenced in Fig. 3a and c, is consistent with HFR-derived maps of horizontal divergence previously published in Lorente et al. (2020). In this previous work, it was suggested that positive divergence, localized at the tip of Cape Finisterre, induced topographic UPW and then upwelled waters were advected southwards away from the promontory. Similar initiatives with HFR current observations were effectively addressed on the west coast of the USA (Roughan et al., 2005), proposing that confined areas of semi-persistent UPW were not due to local or remote wind forcing but rather to the divergence of the prevailing southerly flow as it passed the Point Loma headland.
- iii.
It is generated from consistent remotely sensed hourly surface current observations, not from coarse-resolution atmospheric forecasts, which are probably affected by higher uncertainties. This interpretation is supported by the fact that operational atmospheric and ocean models include assimilation schemes in which remote observations are routinely ingested to improve their predictive skills (Wilczak et al., 2019; Hernandez-Lasheras et al., 2021).
To assess the credibility of the proposed CUI-HFR indexes, they were spatially averaged over specific subdomains (Fig. A1) and later validated against CUI-WIND time series, based on hourly wind observations collected by two in situ buoys moored within each HFR footprint, during two distinct time periods: in NWI for August–December 2021 (Fig. 2) and in BOB for April–August 2014 (Fig. 4), respectively. The results obtained evidenced the significant agreement between CUI-HFR and CUI-WIND, with correlation coefficients of 0.80 (Fig. A2c) and 0.68 (Fig. A2e), respectively, for these two pilot areas. Furthermore, CUI-HFRs were able to adequately identify a variety of UPW and DOW episodes, regardless of their length and intensity, corroborating the recurrent relationship between the surface circulation and predominant wind patterns in NWI (Herrera et al., 2005) and BOB (Solabarrieta et al., 2015). Thanks to the computation of Hovmöller diagrams at selected transects, coastal promontories such as Cape Finisterre (NWI) and Cape Matxitxako (BOB) were revealed as important modulators of UPW processes, in line with previous works that acknowledged that capes and bays may induce significant variations in wind stress (Torres and Barton, 2006; Enriquez and Friehe, 1995).
The strong link between HFR-derived wind-induced circulation and the modulation of surface fields of temperature and chlorophyll (provided by two independent satellite missions) was also shown in the NWI area, coherent with prior literature (Picado et al., 2013). Intense northerly winds and the general flow induced to the south-west are closely associated with the cooling and fertilization of coastal waters with nutrients, fuelling high primary production that ultimately supports the notable biological diversity in this region. Within this framework, future investigations should explore the connection between ocean dynamics and marine communities as well as how the latter respond to persistent changes in the former. This could be achieved by analysing the relationship between the proposed CUI-HFRs and food availability, which is often represented by recruitment indexes (Borja et al., 1996, 2008).
As a proof-of-concept investigation, the prognostic capabilities of the GLOBAL analysis and forecasting system to accurately reproduce UPW–DOW events in the NWI area were also assessed (Figs. 2 and 3). Following the same approach, CUI-GLOBAL demonstrated significant consistency, with annual correlation coefficients of 0.74 and 0.72 for 2020 (Fig. A3) and 2021 (Fig. 2a). From a qualitative perspective, the daily maps of surface circulation and spatial patterns of CUI-GLOBAL presented similarities with those derived from HFR remotely sensed observations, namely (i) the rather uniform S-SW surface circulation as well as the related offshore deflection of the main flow during UPW-favourable conditions (Fig. 3a–d) and (ii) the narrow surface poleward flow along the NWI shelf edge during DOW-favourable conditions (Fig. 3e–f). The discrepancies detected between CUI-HFR and CUI-GLOBAL maps in this specific subregion could be attributed to the fact that coastal and shelf phenomena are still poorly replicated or even misrepresented as the model grid mesh is too coarse (e.g. nominal ∘). This is especially true for complex geometry regions like semi-enclosed coastal embayments where the coastline, seamounts, and bottom topography are not well resolved. In this context, mixing schemes, river inflows, and atmospheric forcings have been traditionally identified as areas of further research in global ocean modelling (Holt et al., 2017). Nevertheless, this comparison potentially opens future pathways for the design of fit-for-purpose metrics that quantify the model skill in reproducing specific ocean processes and their seasonal variability.
Therefore, the obtained outcomes support the potential implementation of a predictive application to infer UPW–DOW conditions even 10 d ahead, which is the maximum forecast horizon provided by the GLOBAL ocean model. Complementarily, the methodology proposed in this work could also be applied to the GLOBAL ocean physics reanalysis product (which covers the period 1 January 1993–31 December 2020) to analyse long-term seasonal trends in both study areas, as extremely active and persistent UPW and DOW episodes might negatively impact coastal ecosystems. During periods of increased offshore advection, some fish and invertebrate populations are exported from coastal habitats and exhibit reduced recruitment success (Bjorkstedt and Roughgarden, 1997). Moreover, an excessive enrichment of surface waters inshore may support the proliferation of harmful algal blooms (Pitcher et al., 2010). By contrast, the opposite-phase circulation patterns during DOW-favourable wind conditions might be related to the transport and retention of pollutants onto the shoreline, with subsequent biological and socioeconomic consequences.
In summary, results seem to suggest that the HFR performances were sound and credible for the two distinct periods and areas analysed, providing reliable surface current estimations that could be effectively used for coastal monitoring and the characterization of recurring UPW and DOW episodes. Future research endeavours should include the synergetic combination of HFRs and GLOBAL model products to implement a valuable long-term ocean monitoring indicator that might be used over any coastal area of the global ocean for wise decision-making to mitigate adverse effects of climate change.
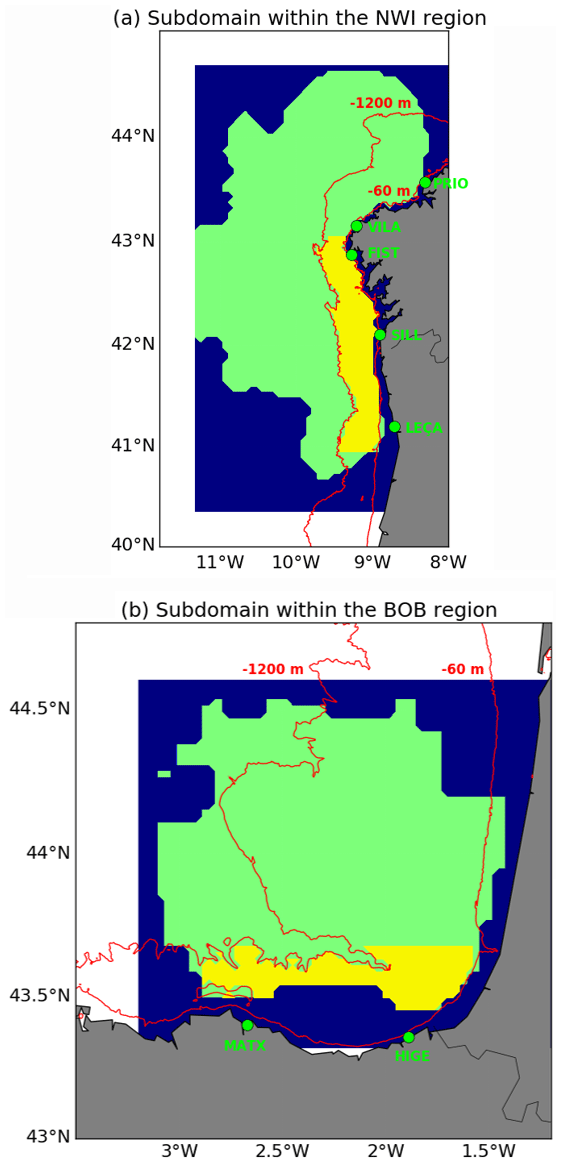
Figure A1Selection of subdomains within each HFR coverage – product ref. nos. 1 and 2 (Table 1). The blue area represents the entire HFR spatial grid, while the green area denotes the subdomain where the value of the dimensionless GDOP parameter is below 3. The yellow area is the selected HFR subdomain to compute the coastal upwelling index (CUI) and must fulfil two requirements: (i) GDOP must be below 3, and (ii) it must be between bathymetric contours (red lines) of 60 and 1200 m depth. Green dots represent the HFR sites that compose each network deployed in the NWI (a) and BOB (b) regions.
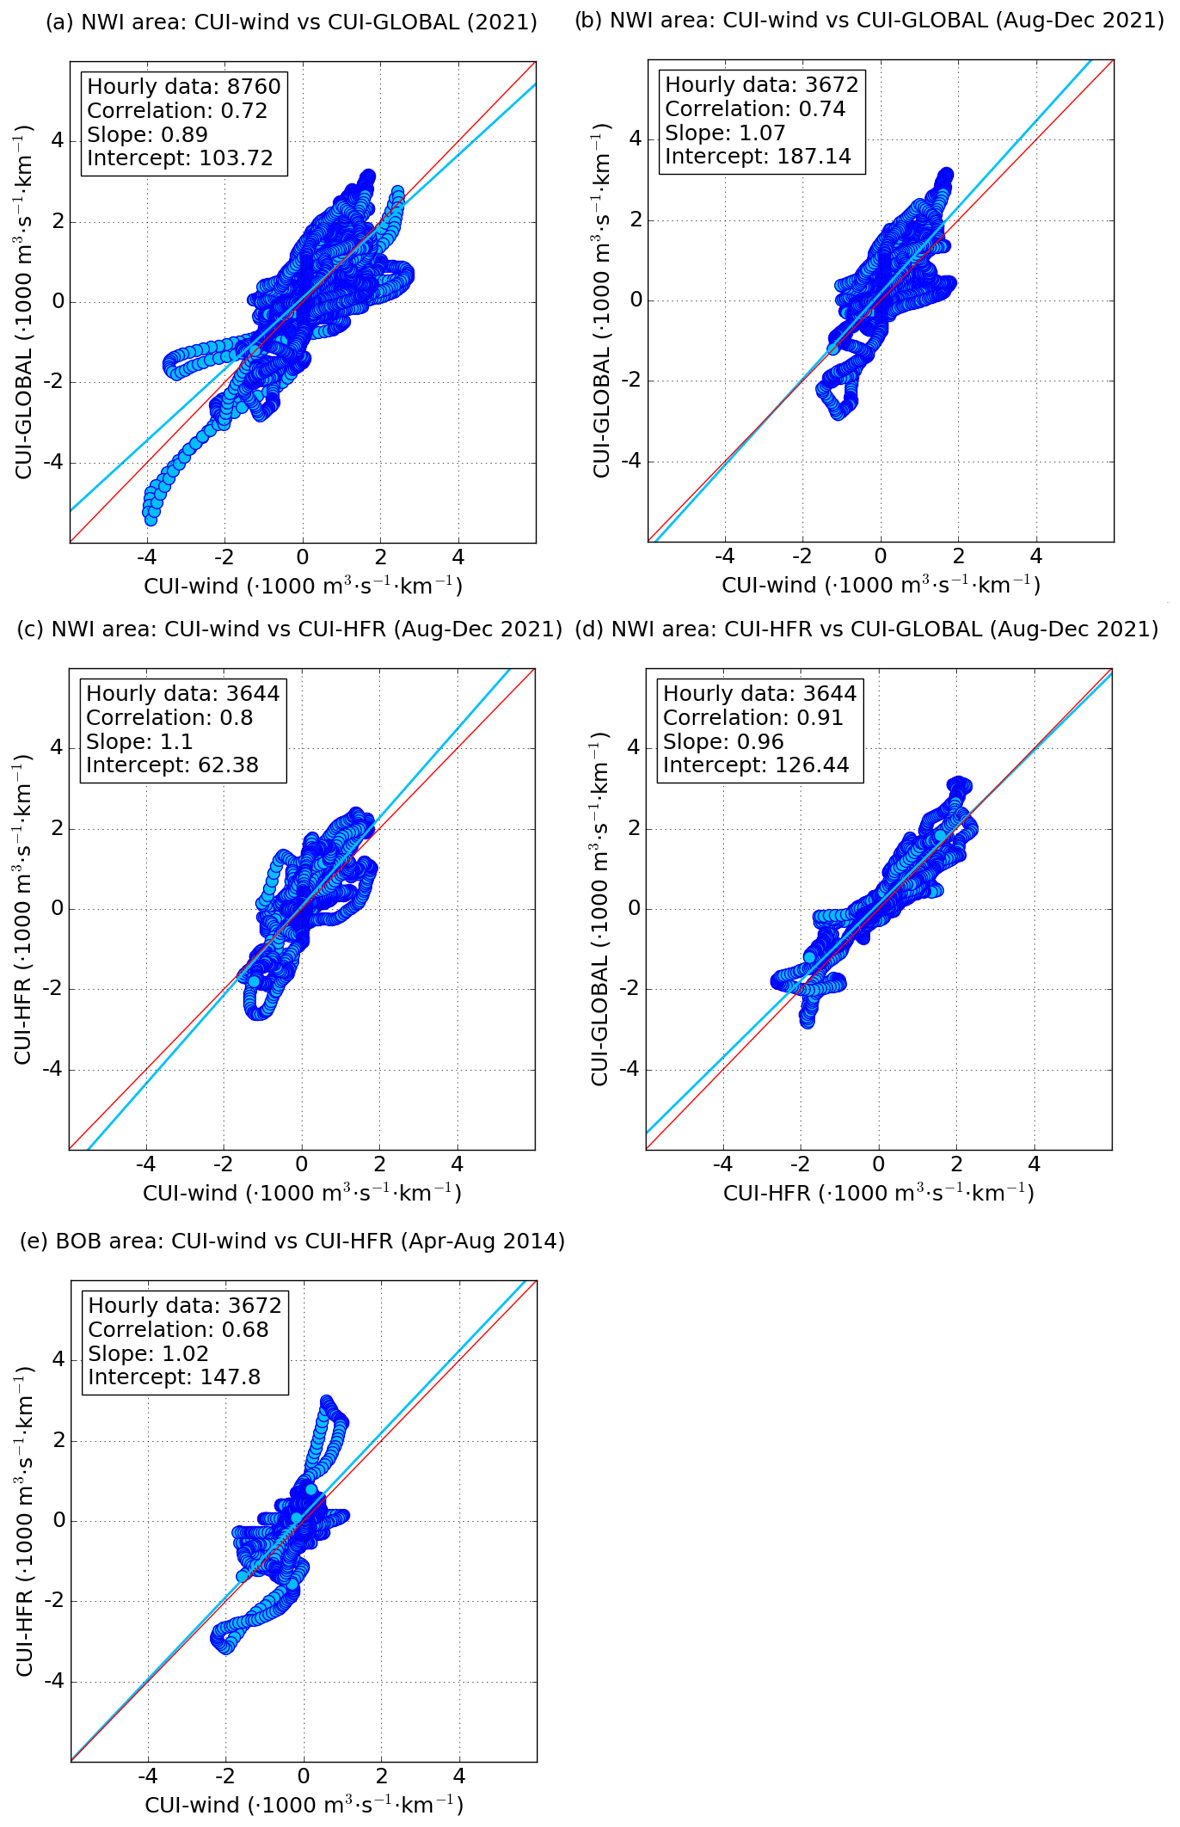
Figure A2Best linear fit of scatter plots between the following: (a–b) CUI-GLOBAL (product ref. no. 4 in Table 1) and CUI-WIND (filtered), product ref. no. 3 (Table 1), in the NWI area for the entirety of 2021 and August–December 2021; (c) CUI-HFR, product ref. nos. 1 and 2 (Table 1), and CUI-WIND (filtered), product ref. no. 2 (Table 1), in the NWI area for August–December 2021; (d) CUI-GLOBAL, product ref. no. 4 (Table 1), and CUI-HFR, product ref. nos. 1 and 2 (Table 1) in the NWI area for August–December 2021; (e) CUI-HFR, product ref. nos. 1 and 2 (Table 1), and CUI-WIND (filtered), product ref. no. 3 (Table 1), in the BOB area for April–August 2014. Statistical metrics are gathered in white boxes.
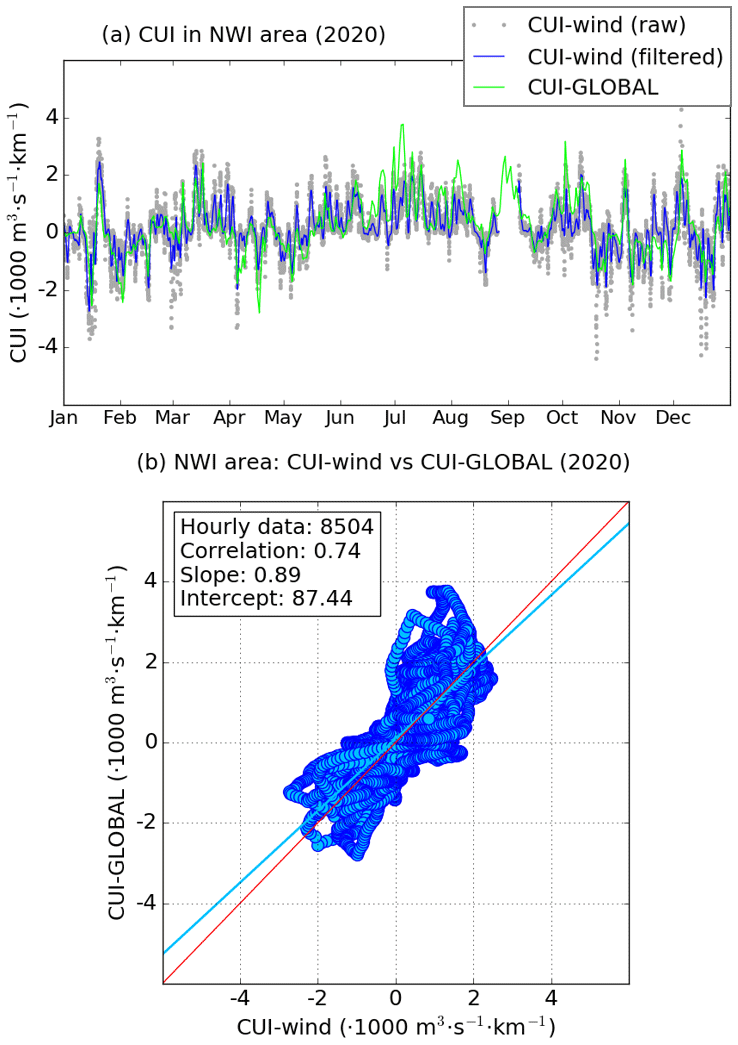
Figure A3(a) Time series of hourly coastal upwelling index (CUI) in the north-western Iberia (NWI) region for the entirety of 2020 as derived from wind observations from Silleiro Buoy (CUI-WIND), product ref. no. 3 (Table 1), and from modelled surface currents (CUI-GLOBAL), product ref. no. 4 (Table 1). CUI-WIND raw (grey dots) was filtered by applying a 25 h moving mean (blue line); (b) best linear fit of the scatter plot between CUI-GLOBAL and CUI-WIND (filtered). Statistical metrics are gathered in the white box.
The model and observation products used in this study from both the Copernicus Marine Service and other sources are listed in Table 1.
PL, AR, ER, LS, JT, SP, and JM conducted the pilot study through fruitful discussions in the framework of working team meetings. PL, SP, LS, and ER created the figures. PL prepared a first version of the draft with inputs from all co-authors. AR and LS analysed HF radar and in situ observations from the Bay of Biscay, while ER, PL, and SP provided expertise in the definition of upwelling indices. All authors participated in the iterations and revision of the paper.
The contact author has declared that none of the authors has any competing interests.
Publisher's note: Copernicus Publications remains neutral with regard to jurisdictional claims in published maps and institutional affiliations.
This study has been developed in the framework of the Work Package WP3 of EuroSea project (https://eurosea.eu/, last access: 29 June 2023), which is aimed at improving and integrating the European ocean observing and forecasting system. The authors acknowledge the financial support of the EU H2020 Programme's JERICO-S3 project. It is also worth mentioning that this work builds upon a previous proof-of-concept investigation conducted within the context of the RADAR_ON_RAIA project (Interreg V, a Spain–Portugal programme). Finally, the authors are grateful to INTECMAR–Consellería do Mar–Xunta de Galicia and the Hydrographic Institute of Portugal for the strong cooperation to jointly operate the Galician HFR network. Equally, the authors thank the Emergencies and Meteorology Directorate (Security Department) of the Basque Government for public data provision from the Basque Operational Oceanography System EuskOOS. This study has been conducted using EU Copernicus Marine Service Information.
This research has been partially funded through the EU H2020 Programme's JERICO-S3 project (grant agreement no. 871153).
This paper was edited by Joanna Staneva and reviewed by Charles-Antoine Guerin and one anonymous referee.
Abrahams, A., Schlegel, R. W., and Smit, A. J.: Variation and change of upwelling dynamics detected in the world's eastern boundary upwelling systems, Frontiers in Marine Science, 8, 626411, https://doi.org/10.3389/fmars.2021.626411, 2021a.
Abrahams, A., Schlegel, R. W., and Smit, A. J.: A novel approach to quantify metrics of upwelling intensity, frequency, and duration, PLoS ONE, 16, e0254026, https://doi.org/10.1371/journal.pone.0254026, 2021b.
Alvarez, I., Lorenzo, M. N., and deCastro, M.: Analysis of chlorophyll a concentration along the Galician coast: seasonal variability and trends, ICES J. Mar. Sci., 69, 728–738, https://doi.org/10.1093/icesjms/fss045, 2012.
Bakun, A.: Coastal upwelling indices, west coast of North America, 1946-71, NOAA technical report NMFS SSRF; 671, https://repository.library.noaa.gov/view/noaa/9041 (last access: 29 June 2023), 1973.
Bakun, A.: Daily and weekly upwelling indices, west coast of North America, 1967-73, NOAA technical report NMFS SSRF; 693, https://repository.library.noaa.gov/view/noaa/15387 (last access: 29 June 2023), 1975.
Bakun, A., Black, B. A., Bograd, S. J., García-Reyes, M., Miller, A. J., Rykaczewski, R. R., and Sydeman, W. J.: Anticipated effects of climate change on coastal upwelling ecosystems, Current Climate Change Reports, 1, 85–93, https://doi.org/10.1007/s40641-015-0008-4, 2015.
Barrick, D.: Geometrical Dilution of Statistical Accuracy (GDOSA) in Multi-Static HF Radar Networks, CODAR Ocean Sensors Ltd., Mountain View, CA, USA, http://www.codar.com/images/about/2006Barrick_GDOSA.pdf (last access: 29 June 2023), 2006.
Barton, E. D., Field, D. B., and Roy, C.: Canary current upwelling: More or less?, Prog. Oceanogr., 116, 167–178, 2013.
Benazzouz, A., Mordane, S., Orbi, A., Chagdali, M., Hilmi, K., Atillah, A., Pelegrí, J. L., and Hervé, D.: An improved coastal upwelling index from sea surface temperature using satellite-based approach – The case of the Canary Current upwelling system, Cont. Shelf Res., 81, 38–54, https://doi.org/10.1016/j.csr.2014.03.012, 2014.
Bjorkstedt, E. and Roughgarden, J.: Larval transport and coastal upwelling: An application of HF radar in ecological research, Oceanography, 10, 64–67, 1997.
Borja, A., Uriarte, A., Valencia, V., Motos, I., and Uriarte, A.: Relationship between anchovy (Engraulis encrasicolus L.) recruitment and the environment in the Bay of Biscay, Sci. Mar., 60, 179–192, 1996.
Borja, A., Fontán, A., Sáenz, J., and Valencia, V.: Climate, oceanography, and recruitment: the case of the Bay of Biscay anchovy (Engraulis encrasicolus), Fish. Oceanogr., 17, 477–493, https://doi.org/10.1111/j.1365-2419.2008.00494.x, 2008.
Botas, J. A., Fernández, E., Bode, A., and Anadón, R.: A persistent upwelling off the Central Cantabrian coast (Bay of Biscay), Estuar. Coast. Shelf S., 30, 185–199, 1990.
Caballero, A., Rubio, A., and Manso, I.: Exploring the potential of HF radar data to monitor upwelling events in the SE Bay of Biscay, EGU General Assembly, Vienna, Austria, 4–13 April 2018, EGU2018-13624, 2018.
Chapman, R. D., Shay, L. K., Graber, H. C., Edson, J. B., Karachintsev, A., Trump, C. L., and Ross, D. B.: On the accuracy of HF radar surface current measurements: Intercomparisons with ship-based sensors, J. Geophys. Res.-Oceans, 102, 18737–18748, https://doi.org/10.1029/97JC00049, 1997.
Colella, S., Böhm, E., Cesarini, C., Garnesson, P., Netting, J., and Calton, B.: EU Copernicus Marine Service Product User Manual for the Global Ocean Colour (Copernicus-GlobColour), Bio-Geo-Chemical, L4 (monthly and interpolated) from Satellite Observations (1997-ongoing), OCEANCOLOUR_GLO_BGC_L4_MY_009_104, Issue: 3.0, Mercator Ocean International, https://catalogue.marine.copernicus.eu/documents/PUM/CMEMS-OC-PUM.pdf (last access: 2 June 2023), 2022.
Corgnati, L., Mantovani, C., Rubio, A., Reyes, E., Rotllan, P., Novellino, A., Gorringe, P., Solabarrieta, L., Griffa, A., and Mader, J.: The Eurogoos High Frequency radar task team: a success story of collaboration to be kept alive and made growing, in 9th EuroGOOS International conference, Shom, Ifremer, EuroGOOS AISBL, May 2021, Brest, France, 467–474, Brest, France, https://hal.archives-ouvertes.fr/hal-03328829 (last access: 27 June 2023), 2021.
Cropper, T. E., Hanna, E., and Bigg, G. R.: Spatial and temporal seasonal trends in coastal upwelling off Northwest Africa, 1981-2012, Deep-Sea Res. Pt. I, 86, 94–111, https://doi.org/10.1016/j.dsr.2014.01.007, 2014.
Di Lorenzo, E.: The future of coastal ocean upwelling, Nature, 518, 310–311, https://doi.org/10.1038/518310a, 2015.
Ekman, W.: On the influence of the Earth's rotation on ocean currents, Ark. Mat. Astr. Fys., 2, 1–52, 1905.
Enriquez, A. G. and Friehe, C. A.: Effects of wind stress and wind stress curl variability on coastal upwelling, J. Phys. Oceanogr., 25, 1651–1671, 1995.
Etienne, H., Boone, C., Verbrugge, N., Reyes, E., Rotllán, P., Rubio, A., Solabarrieta, L., Corgnati, L., Mantovani, C., Mader, J., and Carval, T.: EU Copernicus Marine Service Product User Manual for the Global Ocean-Delayed Mode in-situ Observations of surface (drifters and HFR) and subsurface (vessel-mounted ADCPs) water velocity, INSITU_GLO_PHY_UV_DISCRETE_MY_013_044, Issue: 3.3, Mercator Ocean International, https://catalogue.marine.copernicus.eu/documents/PUM/CMEMS-INS-PUM-013-044.pdf (last access: 2 June 2023), 2022.
Etienne, H., Verbrugge, N., Boone, C., Rubio, A., Solabarrieta, L., Corgnati, L., Mantovani, C., Reyes, E., Chifflet, M., Mader, J., and Carval, T.: EU Copernicus Marine Service Quality Information Document for the Global Ocean-Delayed Mode in-situ Observations of surface (drifters and HFR) and subsurface (vessel-mounted ADCPs) water velocity, INSITU_GLO_PHY_UV_DISCRETE_MY_013_044, Issue: 3.4, Mercator Ocean International, https://catalogue.marine.copernicus.eu/documents/QUID/CMEMS-INS-QUID-013-044.pdf (last access: 2 June 2023), 2023.
EU Copernicus Marine Service Product: Global Ocean- in-situ Near real time observations of ocean currents, Mercator Ocean International [data set], https://doi.org/10.48670/moi-00041, 2022a.
EU Copernicus Marine Service Product: Atlantic Iberian Biscay Irish Ocean- In-Situ Near Real Time Observations, Mercator Ocean International [data set], https://doi.org/10.48670/moi-00043, 2022b.
EU Copernicus Marine Service Product: Global Ocean Physics Analysis and Forecast, Mercator Ocean International [data set], https://doi.org/10.48670/moi-00016, 2022c.
EU Copernicus Marine Service Product: Global Ocean Colour (Copernicus-GlobColour), Bio-Geo-Chemical, L4 (monthly and interpolated) from Satellite Observations (1997–ongoing), Mercator Ocean International [data set], https://doi.org/10.48670/moi-00281, 2022d.
EU Copernicus Marine Service Product: Global Ocean-Delayed Mode in-situ Observations of surface (drifters and HFR) and sub-surface (vessel-mounted ADCPs) water velocity, Mercator Ocean International [data set], https://doi.org/10.17882/86236, 2023a.
EU Copernicus Marine Service Product: Global Ocean OSTIA Sea Surface Temperature and Sea Ice Reprocessed, Mercator Ocean International [data set], https://doi.org/10.48670/moi-00168, 2023b.
Fontán, A., Valencia, V., Borja, A., and Goikoetxea, N.: Oceano-meteorological conditions and coupling in the south-eastern Bay of Biscay, for the period 2001-2005: A comparison with the past two decades, J. Marine Syst., 72, 167–177, 2008.
Garnesson, P., Mangin, A., Bretagnon, M., and Jutard, Q.: EU Copernicus Marine Service Quality Information Document for the Global Ocean Colour (Copernicus-GlobColour), Bio-Geo-Chemical, L4 (monthly and interpolated) from Satellite Observations (1997-ongoing), OCEANCOLOUR_GLO_BGC_L4_MY_009_104, Issue: 3.0, Mercator Ocean International, https://catalogue.marine.copernicus.eu/documents/QUID/CMEMS-OC-QUID-009-101to104-111-113-116-118.pdf (last access: 2 June 2023), 2022.
González-Nuevo, G., Gago, J., and Cabanas, J. M.: Upwelling Index: A powerful tool for marine research in the NW Iberian upwelling system, J. Oper. Oceanogr., 7, 47–57, 2014.
Gunduz, M., Causio, S., Bonino, G., Vandenbulcle, L., Gtregorie, M., Lima, L., Ciliberti, S., LLicak, M., Aydogdu, A., Masina, S., Coppini, G. H., and Pinardi, N.: Coastal upwelling along the Turkish coast of the black Sea: its role in the distribution of the hydrographic properties, J. Oper. Oceanogr., Special Issue: Ocean State Report 6, Sect. 4.8, 205–210, 2022.
Hernandez-Lasheras, J., Mourre, B., Orfila, A., Santana, A., Reyes, E., and Tintoré, J.: Evaluating high-frequency radar data assimilation impact in coastal ocean operational modelling, Ocean Sci., 17, 1157–1175, https://doi.org/10.5194/os-17-1157-2021, 2021.
Herrera, J. L., Piedracoba, S., Varela, R., and Rosón, G.: Spatial analysis of the wind field on the western coast of Galicia (NW Spain) from in situ measurements, Cont. Shelf Res., 25, 1728–1748, 2005.
Holt, J., Hyder, P., Ashworth, M., Harle, J., Hewitt, H. T., Liu, H., New, A. L., Pickles, S., Porter, A., Popova, E., Allen, J. I., Siddorn, J., and Wood, R.: Prospects for improving the representation of coastal and shelf seas in global ocean models, Geosci. Model Dev., 10, 499–523, https://doi.org/10.5194/gmd-10-499-2017, 2017.
Copernicus Marine In Situ Tac Data Management Team: Product User Manual for multiparameter Copernicus In Situ TAC (PUM), https://doi.org/10.13155/43494, 2021.
IPCC, 2022: Climate Change 2022: Impacts, Adaptation and Vulnerability. Contribution of Working Group II to the Sixth Assessment Report of the Intergovernmental Panel on Climate Change, edited by: Pörtner, H.-O., Roberts, D. C., Tignor, M., Poloczanska, E. S., Mintenbeck, K., Alegría, A., Craig, M., Langsdorf, S., Löschke, S., Möller, V., Okem, A., and Rama, B., Cambridge University Press, Cambridge, UK and New York, NY, USA, 3056 pp., https://doi.org/10.1017/9781009325844, 2022.
Jacox, M. G., Edwards, C. A., Hazen, E. L., and Bograd, S. J.: Coastal upwelling revisited: Ekman, Bakun, and improved upwelling indices for the U.S. West Coast, J. Geophys. Res.-Oceans, 123, 7332–7350, https://doi.org/10.1029/2018JC014187, 2018.
Kaplan, D. M. and Largier, J. L.: HF radar-derived origin and destination of surface waters off Bodega Bay, California, Deep-Sea Res. Pt. II, 53, 2906–2930, 2006.
Lachkar, Z. and Gruber, N.: What controls biological production in coastal upwelling systems? Insights from a comparative modeling study, Biogeosciences, 8, 2961–2976, https://doi.org/10.5194/bg-8-2961-2011, 2011.
Le Galloudec, O., Law Chune, S., Nouel, L., Fernandez, E., Derval, C., Tressol, M., Dussurget, R., Biardeau, A., and Tonani, M.: EU Copernicus Marine Service Product User Manual for the Global Ocean Physics Analysis and Forecast, GLOBAL_ANALYSISFORECAST_PHY_001_024, Issue: 1.9, Mercator Ocean International https://catalogue.marine.copernicus.eu/documents/PUM/CMEMS-GLO-PUM-001-024.pdf (last access: 2 June 2023), 2022.
Lellouche, J.-M., Le Galloudec, O., Regnier, C., Van Gennip, S., Law Chune, S., Levier, B., Greiner, E., Drevillon, M., and Szczypta, C.: EU Copernicus Marine Service Quality Information Document for the Global Ocean Physics Analysis and Forecast, GLOBAL_ANALYSISFORECAST_PHY_001_024, Issue: 1.0, https://catalogue.marine.copernicus.eu/documents/QUID/CMEMS-GLO-QUID-001-024.pdf (last access: 2 June 2023), 2022.
Lellouche, J.-M., Greiner, E., Le Galloudec, O., Garric, G., Regnier, C., Drevillon, M., Benkiran, M., Testut, C.-E., Bourdalle-Badie, R., Gasparin, F., Hernandez, O., Levier, B., Drillet, Y., Remy, E., and Le Traon, P.-Y.: Recent updates to the Copernicus Marine Service global ocean monitoring and forecasting real-time high-resolution system, Ocean Sci., 14, 1093–1126, https://doi.org/10.5194/os-14-1093-2018, 2018.
Llope, M., Anadón, R., Viesca, L., Quevedo, M., González-Quirós, R., and Stenseth, N. C.: Hydrography of the southern Bay of Biscay shelf-break region: Integrating the multiscale physical variability over the period 1993–2003, J. Geophys. Res., 111, C09021, https://doi.org/10.1029/2005JC002963, 2006.
Lorente, P., Piedracoba, S., and Álvarez-Fanjul, E.: Validation of high-frequency radar ocean surface current observations in the NW of the Iberian Peninsula, Cont. Shelf Res., 92, 1–15, 2015.
Lorente, P., Piedracoba, S., Montero, P., Sotillo, M.G., Ruiz, M.I. and Álvarez-Fanjul, E.: Comparative analysis of summer upwelling and downwelling events in NW Spain: a model-observations approach, Remote Sens., 12, 2762, https://doi.org/10.3390/rs12172762, 2020.
Lorente, P., Aguiar, E., Bendoni, M., Berta, M., Brandini, C., Cáceres-Euse, A., Capodici, F., Cianelli, D., Ciraolo, G., Corgnati, L., Dadić, V., Doronzo, B., Drago, A., Dumas, D., Falco, P., Fattorini, M., Gauci, A., Gómez, R., Griffa, A., Guérin, C.-A., Hernández-Carrasco, I., Hernández-Lasheras, J., Ličer, M., Magaldi, M. G., Mantovani, C., Mihanović, H., Molcard, A., Mourre, B., Orfila, A., Révelard, A., Reyes, E., Sánchez, J., Saviano, S., Sciascia, R., Taddei, S., Tintoré, J., Toledo, Y., Ursella, L., Uttieri, M., Vilibić, I., Zambianchi, E., and Cardin, V.: Coastal high-frequency radars in the Mediterranean – Part 1: Status of operations and a framework for future development, Ocean Sci., 18, 761–795, https://doi.org/10.5194/os-18-761-2022, 2022.
Madec, G. and the NEMO team: NEMO ocean engine, Note du Pôlede modélisation, Institut Pierre-Simon Laplace (IPSL), France, No 27, ISSN 1288-1619, 2008.
Manso-Narvarte, I., Caballero, A., Rubio, A., Dufau, C., and Birol, F.: Joint analysis of coastal altimetry and high-frequency (HF) radar data: observability of seasonal and mesoscale ocean dynamics in the Bay of Biscay, Ocean Sci., 14, 1265–1281, https://doi.org/10.5194/os-14-1265-2018, 2018.
Mantovani, C., Corgnati, L., Horstmann, J., Rubio, A., Reyes, E., Quentin, C., Cosoli, S., Asensio, J. L., Mader, J., and Griffa, A.: Best practices on High Frequency Radar deployment and operation for ocean current measurement, Frontiers in Marine Science, 7, 210, https://doi.org/10.3389/fmars.2020.00210, 2020.
Mourre, B., Reyes, E., Lorente, P., Santana, A., Hernández-Lasheras, J., Hernández-Carrasco, I., Garcia-Jove, M., and Zarokanellos, N. D.: Intense wind-driven coastal upwelling in the Balearic Islands in response to Storm Blas (November 2021), in: 7th edition of the Copernicus Ocean State Report (OSR7), edited by: von Schuckmann, K., Moreira, L., Le Traon, P.-Y., Grégoire, M., Marcos, M., Staneva, J., Brasseur, P., Garric, G., Lionello, P., Karstensen, J., and Neukermans, G., Copernicus Publications, State Planet, 1-osr7, 15, https://doi.org/10.5194/sp-1-osr7-15-2023, 2023.
Paduan, J. D., Cook, M. S., and Tapia, V. M.: Patters of upwelling and relaxation around Monterrey Bay based on long-term observations of surface currents from High Frequency radar, Deep-Sea Res. Pt. II, 151, 129–136, 2018.
Picado, A., Álvarez, I., Vaz, N., and Dias, J. M.: Chlorophyll concentration along the north-western coast of the Iberian Peninsula vs. atmosphere-ocean-land conditions, J. Coast. Res., 65, 2047–2052, 2013.
Pitcher, G. C., Figueiras, F. G., Hickey, B. M., and Moita, M. T.: The physical oceanography of upwelling systems and the development of harmful algal blooms, Prog. Oceanogr., 85, 5–32, 2010.
Prego, R., Varela, M., deCastro, M., Ospina-Alvarez, N., Garcia-Soto, C., and Gómez-Gesteira, M.: The influence of summer upwelling at the western boundary of the Cantabrian coast. Estuarine, Coast. Shelf Sci., 98, 138–144, 2012.
Reyes, E., Aguiar, E., Bendoni, M., Berta, M., Brandini, C., Cáceres-Euse, A., Capodici, F., Cardin, V., Cianelli, D., Ciraolo, G., Corgnati, L., Dadić, V., Doronzo, B., Drago, A., Dumas, D., Falco, P., Fattorini, M., Fernandes, M. J., Gauci, A., Gómez, R., Griffa, A., Guérin, C.-A., Hernández-Carrasco, I., Hernández-Lasheras, J., Ličer, M., Lorente, P., Magaldi, M. G., Mantovani, C., Mihanović, H., Molcard, A., Mourre, B., Révelard, A., Reyes-Suárez, C., Saviano, S., Sciascia, R., Taddei, S., Tintoré, J., Toledo, Y., Uttieri, M., Vilibić, I., Zambianchi, E., and Orfila, A.: Coastal high-frequency radars in the Mediterranean – Part 2: Applications in support of science priorities and societal needs, Ocean Sci., 18, 797–837, https://doi.org/10.5194/os-18-797-2022, 2022.
Roarty, H., Cook, T., Hazard, L., Harlan, J., Cosoli, S., Wyatt, L., Fanjul, E. A., Terrill, E., Otero, M., Largier, J., Glenn, S., Ebuchi, N., Whitehouse, B., Bartlett, K., Mader, J., Rubio, A., Corgnati, L. P., Mantovani, C., Griffa, A., Reyes, E., Lorente, P., Flores-Vidal, X., Rogowski, P., Prukpitikul, S., Lee, S. H., Lai, J. W., Guerin, C., Sanchez, J., Hansen, B., Grilli, S., and Matta, K. S.: The Global High Frequency Radar Network, Frontiers in Marine Science, 6, 164, https://doi.org/10.3389/fmars.2019.00164, 2019.
Roughan, M., Terril, E. J., Largier, J. L., and Otero, M.: Observations of divergence and upwelling around Point Loma, California, J. Geophys. Res., 110, C04011, https://doi.org/10.1029/2004JC002662, 2005.
Rubio, A., Reverdin, G., Fontán, A., González, M., and Mader, J.: Mapping near-inertial variability in the SE Bay of Biscay from HF radar data and two offshore moored buoys, Geophys. Res. Lett., 38, L19607, https://doi.org/10.1029/2011GL048783, 2011.
Rubio, A., Mader, J., Corgnati, L., Mantovani, C., Griffa, A., Novellino, A., Quentin, C., Wyatt, L., Schulz-Stellenfleth, J., Horstmann, J., Lorente, P., Zambianchi, E., Hartnett, M., Fernandes, C., Zervakis, V., Gorringe, P., Melet, A., and Puillat, I.: HF radar activity in European coastal seas: next steps towards a pan-European HF radar network, Frontiers in Marine Science, 4, 8, https://doi.org/10.3389/fmars.2017.00008, 2017.
Rubio, A., Caballero, A., Orfila, A., Hernández-Carrasco, I., Ferrer, L., González, M., Solabarrieta, L., and Mader, J.: Eddy-induced cross-shelf export of high Chl-a coastal waters in the SE Bay of Biscay, Remote Sens. Environ., 205, 290–304, https://doi.org/10.1016/j.rse.2017.10.037, 2018.
Shirahata, K., Yoshimoto, S., Tsuchihara, T., and Ishida, S. Digital Filters to Eliminate or Separate Tidal Components in Groundwater Observation Time-Series Data, JARQ-Jpn. Agr. Res. Q., 50, 241–252, https://doi.org/10.6090/jarq.50.241, 2016.
Solabarrieta, L., Rubio, A., Castanedo, S., Medina, R., Charria, G., and Hernández, C.: Surface water circulation patterns in the southeastern Bay of Biscay: New evidences from HF radar data, Cont. Shelf Res., 74, 60–76, https://doi.org/10.1016/j.csr.2013.11.022, 2014.
Solabarrieta, L., Rubio, A., Cárdenas, M., Castanedo, S., Esnaola, G., Méndez, F. J., Medina, R., and Ferrer, L.: Probabilistic relationships between wind and surface water circulation patterns in the SE Bay of Biscay, Ocean Dynam., 65, 1289–1303, https://doi.org/10.1007/s10236-015-0871-5, 2015.
Solabarrieta, L., Frolov, S., Cook, M., Paduan, J., Rubio, A., González, M., Mader, J., and Charria, G.: Skill assessment of HF radar–derived products for lagrangian simulations in the Bay of Biscay, J. Atmos. Ocean. Tech., 33, 2585–2597, https://doi.org/10.1175/JTECH-D-16-0045.1, 2016.
Torres, R. and Barton, E. D.: Onset and development of the Iberian poleward flow along the Galician coast, Cont. Shelf Res., 26, 1134–1153, 2006.
Torres, R., Barton, E. D., Miller, P., and Álvarez-Fanjul, E.: Spatial patterns of wind and sea surface temperature in the Galician upwelling region, J. Geophys. Res., 108, 3130, https://doi.org/10.1029/2002JC001361, 2003.
Trincardi, F., Cappelletto, M., Barvanti, A., Cadiou, J.-F., Bataille, A., Campillos Llanos, M., Chacón Campollo, E., and Trujillo Quintela, A.: BlueMED, Preliminary implementation plan D2.9 (Core Document), European Union's Horizon 2020, https://ec.europa.eu/research/participants/documents/downloadPublic?documentIds=080166e5d180fcbd&appId=PPGMS (last access: 28 June 2023), 2020.
Varela, R., Álvarez, I., Santos, F., deCastro, M., and Gómez-Gesteira, M.: Has upwelling strengthened along worldwide coasts over 1982–2010?, Scientific Reports, 5, 10016, https://doi.org/10.1038/srep10016, 2015.
Verbrugge, N., Etienne, H., Boone, C., Corgnati, L., Mantovani, C., Reyes, E., Solabarrieta, L., Rubio, A., Rotllán, P., Carval, T., Mader, J., and Drouineau, L.: EU Copernicus Marine Service Product User Manual for the Global Ocean- in-situ Near real time observations of ocean currents, INSITU_GLO_PHY_UV_DISCRETE_NRT_013_048, Issue: 2.2, Mercator Ocean International, https://catalogue.marine.copernicus.eu/documents/PUM/CMEMS-INS-PUM-013-048.pdf (last access: 2 June 2023), 2022a.
Verbrugge, N., Etienne, H., Corgnati, L., Mantovani, C., Reyes, E., Solabarrieta, L., Rubio, A., Carval, T., Mader, J., and Drouineau, L.: EU Copernicus Marine Service Quality Information Document for the Global Ocean- in-situ Near real time observations of ocean currents, INSITU_GLO_PHY_UV_DISCRETE_NRT_013_048, Issue: 2.2, Mercator Ocean International, https://catalogue.marine.copernicus.eu/documents/QUID/CMEMS-INS-QUID-013-048.pdf (last access: 2 June 2023), 2022b.
Wang, D., Gouhier, T., Menge, B., and Ganguly, A. R.: Intensification and spatial homogenization of coastal upwelling under climate change, Nature, 518, 390–394, https://doi.org/10.1038/nature14235, 2015.
Wehde, H., Schuckmann, K. V., Pouliquen, S., Grouazel, A., Bartolome, T., Tintore, J., De Alfonso Alonso-Munoyerro, M., Carval, T., Racapé, V., and the INSTAC team: EU Copernicus Marine Service Quality Information Document for the Atlantic Iberian Biscay Irish Ocean- In-Situ Near Real Time Observations, INSITU_IBI_PHYBGCWAV_DISCRETE_MYNRT_013_033, Issue 2.2, Mercator Ocean International, https://catalogue.marine.copernicus.eu/documents/QUID/CMEMS-INS-QUID-013-030-036.pdf (last access: 2 June 2023), 2022.
Wilczak, J. M., Olson, J. B., Djalalova, I., Bianco, L., Berg, L. K., Shaw, W. J., Coulter, R. L., Eckman, R. M., Freedman, J., Finley, C., and Cline, J.: Data assimilation impact of in situ and remote sensing meteorological observations on wind power forecasts during the first Wind Forecast Improvement Project (WFIP), Wind Energy, 22, 932–944, https://doi.org/10.1002/we.2332, 2019.
Wooster, W. S., Bakun, A., and McLain, D. R.: Seasonal upwelling cycle along eastern boundary of North-Atlantic, J. Mar. Res., 34, 131–141, 1976.
Worsfold, M., Good, S., Martin, M., McLaren, A., Roberts-Jones, J., and Fiedler, E.: EU Copernicus Marine Service Product User Manual for the Global Ocean OSTIA Sea Surface Temperature Reprocessing, SST-GLO-SST-L4-REP-OBSERVATIONS-010-011, Issue: 1.4, Mercator Ocean International, https://catalogue.marine.copernicus.eu/documents/PUM/CMEMS-SST-PUM-010-011.pdf (last access: 2 June 2023), 2022.
Worsfold, M., Good, S., McLaren, A., Fiedler, E., Roberts-Jones, J., and Martin, M.: EU Copernicus Marine Service Quality Information Document for the Global Ocean OSTIA Sea Surface Temperature Reprocessing, SST-GLO-SST-L4-REP-OBSERVATIONS-010-011, Issue: 3.0, Mercator Ocean International, https://catalogue.marine.copernicus.eu/documents/QUID/CMEMS-SST-QUID-010-011.pdf (last access: 2 June 2023), 2023.
Xiu, P., Chai, F., Curchitser, E. N., and Castruccio, F. S.: Future changes in coastal upwelling ecosystems with global warming: The case of the California Current System, Scientific Reports, 8, 2866, https://doi.org/10.1038/s41598-018-21247-7, 2018.