the Creative Commons Attribution 4.0 License.
the Creative Commons Attribution 4.0 License.
 | 27 Sep 2023 | OSR7 | Chapter 2.3
Satellite monitoring of surface phytoplankton functional types in the Atlantic Ocean over 20 years (2002–2021)
Marine Bretagnon
Svetlana N. Losa
Vanda Brotas
Mara Gomes
Ilka Peeken
Leonardo M. A. Alvarado
Antoine Mangin
Astrid Bracher
An analysis of multi-satellite-derived products of four major phytoplankton functional types (PFTs – diatoms, haptophytes, prokaryotes and dinoflagellates) was carried out to investigate the PFT time series in the Atlantic Ocean between 2002 and 2021. The investigation includes the 2-decade trends, climatology, phenology and anomaly of PFTs for the whole Atlantic Ocean and its different biogeochemical provinces in the surface layer that optical satellite signals can reach. The PFT time series over the whole Atlantic region showed mostly no clear trend over the last 2 decades, except for a small decline in prokaryotes and an abrupt increase in diatoms during 2018–2019, which is mainly observed in the northern Longhurst provinces. The phenology of diatoms, haptophytes and dinoflagellates is very similar: at higher latitudes bloom maxima are reached in spring (April in the Northern Hemisphere and October in the Southern Hemisphere), in the oligotrophic regions in winter time and in the tropical regions during May to September. In general, prokaryotes show opposite annual cycles to the other three PFTs and present more spatial complexity. The PFT anomaly (in percent) of 2021 compared to the 20-year mean reveals mostly a slight decrease in diatoms and a prominent increase in haptophytes in most areas of the high latitudes. Both diatoms and prokaryotes show a mild decrease along coastlines and an increase in the gyres, while prokaryotes show a clear decrease at mid-latitudes to low latitudes and an increase on the western African coast (Canary Current Coastal Province, CNRY and Guinea Current Coastal Province, GUIN) and southwestern corner of North Atlantic Tropical Gyral Province (NATR). Dinoflagellates, as a minor contributor to the total biomass, are relatively stable in the whole Atlantic region. This study illustrated the past and current PFT state in the Atlantic Ocean and acted as the first step to promote long-term consistent PFT observations that enable time series analyses of PFT trends and interannual variability to reveal potential climate-induced changes in phytoplankton composition on multiple temporal and spatial scales.
- Article
(10383 KB) - Full-text XML
- BibTeX
- EndNote


Phytoplankton in the sunlit layer of the ocean act as the base of the marine food web fueling fisheries and also regulate key biogeochemical processes. Climate-induced changes causing temperature rise, ocean acidification and ocean deoxygenation stress the ocean's contemporary biogeochemical cycles and ecosystems, thereby impacting the phytoplankton communities (Gruber, 2011; Gruber et al., 2021; Bindoff et al., 2019). Related to this, the changing nutrient and light availability, particularly in the polar oceans, is also critical for the development of phytoplankton communities (Käse and Geuer, 2018). In the past decades, satellite observations of ocean color (OC) information, especially the surface chlorophyll a concentration (chl a) as a proxy for phytoplankton biomass, have been able to revolutionize our understanding of biogeochemical processes and provide insights into the changes in phytoplankton and inferred productivity driven by climate change (e.g., Antoine et al., 2005; Gregg and Rousseaux, 2014; McClain, 2009; Behrenfeld et al., 2016; Kulk et al., 2020). However, phytoplankton biomass does not provide a full description of the complex nature of phytoplankton community and function. Phytoplankton composition varies across ocean biomes, and the different phytoplankton groups influence marine ecosystem and biogeochemical processes differently (Bracher et al., 2017). Continuous monitoring of phytoplankton composition is important not only to understand the biogeochemical processes such as nutrient uptake and carbon and energy transfer, but also for fisheries, ocean environment, water quality and even human health when certain species cause, for example, harmful algal blooms (Quéré et al., 2005; Bindoff et al., 2019; Bracher et al., 2022).
Phytoplankton diversity is very high, summarized in phytoplankton functional types (PFTs) as prokaryotes (cyanobacteria) and eukaryotes, including diatoms, haptophytes and dinoflagellates. Depending on area, season and size class, different PFTs can act as dominating organisms in the food web and, therefore, regulate the seasonality of the predators (Käse and Geuer, 2018). Diatoms, known as major silicifiers, have silica frustules that surround and protect the cells and sink rapidly out of the surface layer of the ocean, contributing to the transport of carbon, nitrogen and silica to deeper waters (IOCCG, 2014). Haptophytes are another very abundant PFT in the global ocean occurring mainly in the middle-sized (2–20 µm) range. The prominent subgroup within haptophytes consists of coccolithophores, which have been considered a critical component of marine environments because of their dual capacity to fix environmental carbon via biomineralization (calcium carbonate, calcite) and through photosynthesis (Reyes-Prieto et al., 2009). Dinoflagellates are also one of the largest groups of marine eukaryotes, although most species are, on average, smaller than the average of diatom species. The majority of dinoflagellate species are autotrophic and tend to thrive under stable conditions. Due to their motility and ability to regulate their position in the water column, they can outcompete other phytoplankton and sometimes accumulate rapidly, resulting in a visible coloration of the water, known as harmful algal blooms (IOCCG, 2014). Prokaryotes as picophytoplankton are abundant in many ocean regions (notably at mid-latitudes to low latitudes but also others) and also account for a substantial fraction of marine primary production, with the two taxa being Synechococcus and Prochlorococcus in tropical regions (Flombaum et al., 2013).
PFTs have been the focus of various studies carried out worldwide as well as in the Atlantic Ocean, providing rich and valuable knowledge of PFT assessments in terms of their abundance, distribution, phenology, roles in the primary production, and relationship to other physical and biological parameters (e.g., Head and Pepin, 2010; Brotas et al., 2013, 2022; Soppa et al., 2016; Brewin et al., 2017; Moisan et al., 2017; Bolaños et al., 2020; Yang et al., 2020). Information of phytoplankton composition with respect to the functional types and size classes can be retrieved by ocean color algorithms based on different types of input data. However, most of the studies focus on either a certain PFT (e.g., Lange et al., 2020), a short time period or a limited spatial coverage (e.g., Bracher et al., 2020; Brotas et al., 2022). A complete, systematic frame for the long-term monitoring of multiple PFTs on a wide scale is yet to be established. Previously, we have developed and further improved an approach (referred to as EOF-PFT) consisting of a set of empirical-orthogonal-function-based PFT algorithms thanks to a large global in situ PFT data set based on HPLC (high-performance liquid chromatography)-measured pigments (Xi et al., 2020, 2021). These algorithms use multi-spectral reflectance data from OC satellites and sea surface temperature data to estimate chl a concentration of six major phytoplankton groups. Here, we focus only on four PFTs, which on the whole account for the major part of the biomass in the Atlantic Ocean. Applied to multi-sensor merged products and Sentinel 3A Ocean and Land Colour Instrument (OLCI) data, the algorithms enable us to generate global PFT products, which have been available from the EU Copernicus Marine Service since 2020 and are updated regularly, providing global chl a data with per-pixel uncertainty for diatoms, haptophytes, dinoflagellates, chlorophytes and phototrophic prokaryotes spanning the period from 2002 until today.
In this section, we combine these PFT data sets of different sensors, covering various lifespans and radiometric characteristics, into consistent long-term satellite PFT products. The 2-decade quality-assured global PFT data sets for the Atlantic Ocean (50∘ S to 50∘ N, 60∘ W to 10∘ E) are derived by correcting the input-sensor-specific PFT products using inter-sensor comparisons with uncertainty estimations, which then allow us to (1) evaluate Copernicus Marine Service PFT products and improve their continuity along the products derived from different satellite sensors and (2) analyze PFT time series in the last 2 decades in terms of climatology, trends, anomaly and phenology of multiple PFTs in the Atlantic Ocean and its different biogeochemical provinces (Longhurst, 2007).
2.1 PFT products from Copernicus Marine Service
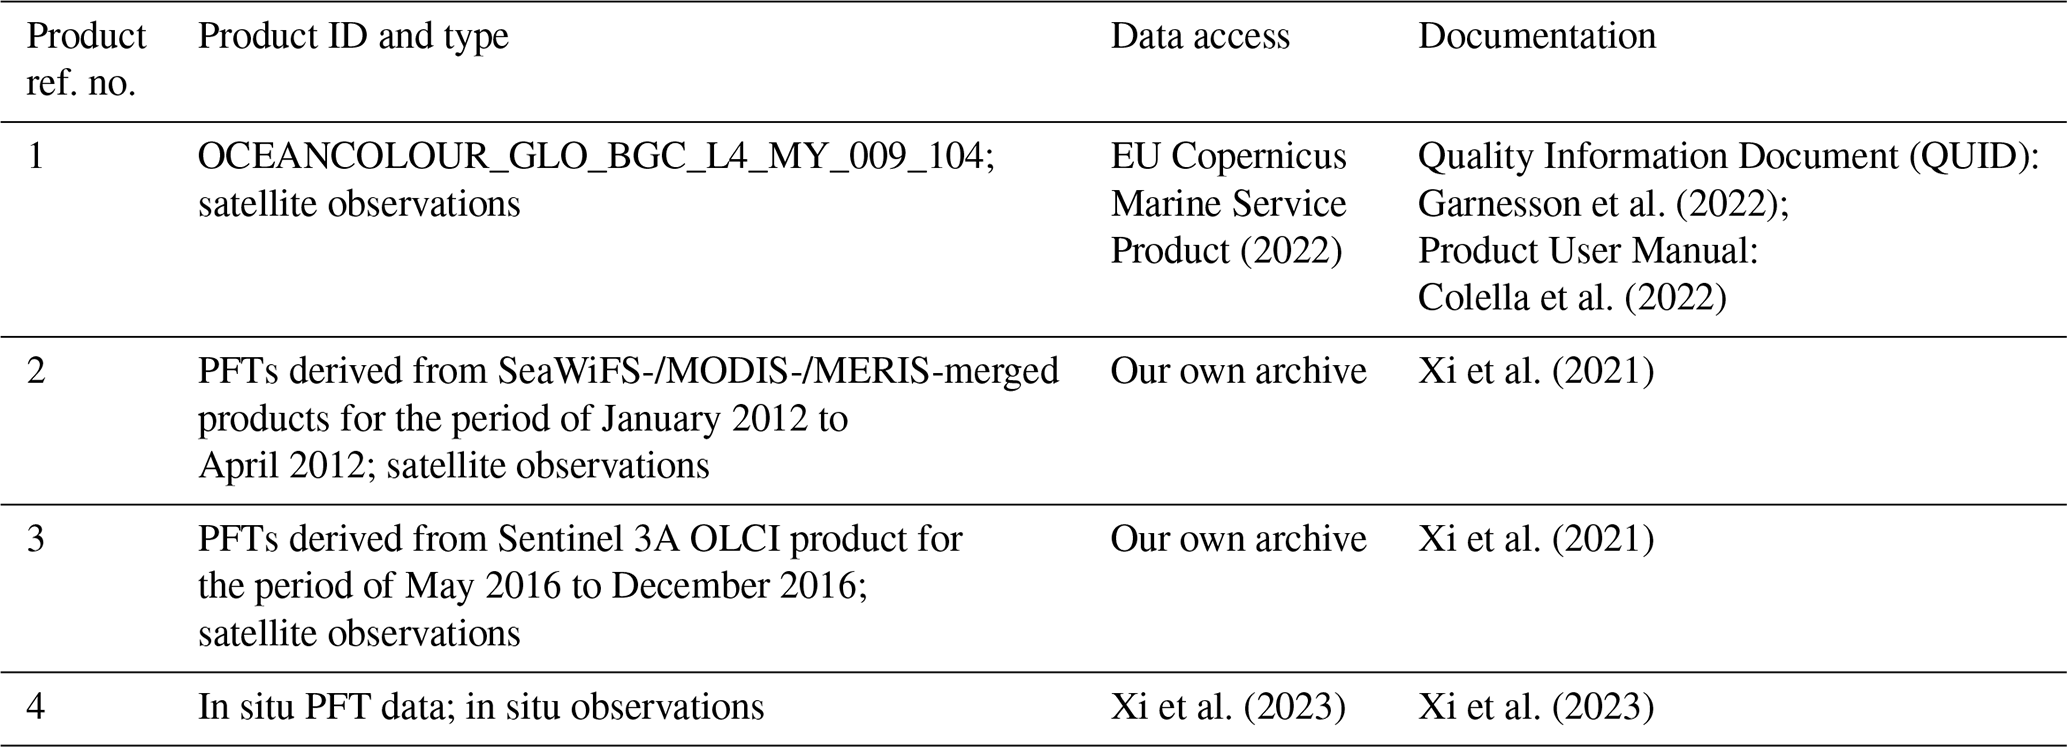
Satellite data used in this study are listed in Table 1. Multiple PFT chl a products with per-pixel uncertainty have been available from the Copernicus Marine Service since May 2020, with updates in 2021 and 2022, and were derived from three sets of OC products (product ref. no. 1 in Table 1): (1) merged remote sensing reflectance (Rrs) products at 9 bands from SeaWiFS, MODIS and MERIS from July 2002 to December 2011; (2) merged Rrs products at 9 bands from MODIS and VIIRS from January 2012 to December 2016; and (3) Rrs products at 11 bands from Sentinel 3A OLCI from January 2017 to December 2021 (Table 1; Xi et al., 2021). In this section, monthly PFT products with 25 km resolution in the open ocean (depth >200 m) are used for spatiotemporal analysis in the Atlantic Ocean spanning the period from July 2002 to December 2021.
Consistency of satellite data is checked with the following details. As the product developer we have additionally generated PFT retrievals from different sensor combinations but with overlapping time periods. PFT products from SeaWiFS-/MODIS-/MERIS-merged data and that from MODIS-/VIIRS-merged data have a 4-month overlap from January to April 2012 (product ref. no. 2 in Table 1), and MODIS-/VIIRS-derived PFTs are overlapped with the OLCI-derived PFTs since May 2016 (product ref. no. 3 in Table 1). To produce consistent PFT products over the last 2 decades for the Atlantic Ocean, we compare PFT retrievals within these overlapped periods to identify the systematic differences between two data sources and then set up the correction functions through linear regressions by taking into account the per-pixel uncertainty. Sections 2.3 and 3.3 in Xi et al. (2021) may be referred to for a detailed description of the per-pixel uncertainty assessment of the PFT products. Similar to how the OC-CCI chl a product was merged (Jackson, 2020), one of the three sets of PFT products that has been verified to have the lowest uncertainties (produced on a pixel basis) and smallest biases when evaluated by in situ data will be chosen as the reference product. The other two sets of PFT products will be corrected to it. In the EOF-PFT approach development stage (Xi et al., 2020, 2021), we noticed that the PFT products derived from SeaWiFS-/MODIS-/MERIS-merged Rrs data show the lowest per-pixel uncertainties for nearly all the PFT quantities because their corresponding algorithms were trained based on a larger and more widely covered matchup data set between the satellite and in situ observations. Therefore, we take SeaWiFS-/MODIS-/MERIS-derived PFTs as a reference to correct the other two PFT data sets derived from MODIS-/VIIRS-merged data and OLCI data, respectively.
2.2 In situ PFT data and matchup extraction
To evaluate the satellite PFT products, we use in situ HPLC pigment data from past expeditions between 2009 and 2019 covering the whole Atlantic pole-to-pole region (65∘ S to 80∘ N), which included 11 expeditions from the North Atlantic to the Arctic Fram Strait (PS74, PSS76, PS78, PS80, PS85, PS93.2, PS99.1, PS99.2, PS106, PS107, PS121), four expeditions in the Atlantic Ocean (PS113, PS120, AMT28 and AMT29) and one expedition in the Southern Ocean (PS103). All pigment data were quality-controlled by applying the method by Aiken et al. (2009). Diagnostic pigment analysis was carried out to determine the in situ PFT chl a concentrations with newly tuned weighting coefficients by Alvarado et al. (2022), according to Vidussi et al. (2001) and Uitz et al. (2006), modified as in Hirata et al. (2011) and Brewin et al. (2015). In situ PFT data (product ref. no. 1 in Table 1) are then used to validate the corrected PFTs by extracting matchups between daily 4 km PFT products from the Copernicus Marine Service and the in situ data. For each in situ measurement a matchup of 3×3 pixels around the in situ location on the same day was extracted. Averaged data based on 3×3 pixels were computed following the matchup protocol as in Xi et al. (2020, 2021), including only matchups containing at least 50 % of valid pixels with a coefficient of variation (CV) of the valid pixel values lower than 0.15.
2.3 Time series analysis
We focus on preliminary explorations of the calibrated PFT products to reveal and understand the trends of and variations in Atlantic PFTs in the last 2 decades. We derive the PFT time series of the whole Atlantic region, on different regional scales and also at the per-pixel level. For regional scales, PFT data of the Atlantic Ocean are partitioned into smaller regions using Longhurst's geographic classification system of biomes and provinces (Longhurst, 2007; Flanders Marine Institute, 2009). We determine the annual cycle (climatology) based on both pixel data and regional log-based mean values and derive anomalies to observe the interannual changes and detect trends reflected by the satellite observations. Time series analysis is done both per pixel and for the whole region or province. We investigate the trends in the PFTs for the last 20 years using linear regression in the format of , where Y is the monthly PFT chl a either per pixel or of the regional log-based mean, X is the time on a monthly basis, S is the slope of the regression, and I is the intercept. Only trends with statistically significant correlations of the regression (p<0.05) are shown. Indicators of PFT phenology and the anomaly of 2021 (the last year of the considered time period) are also extracted in order to identify potential changes/shifts in PFTs. Abundance maxima time, as one of the phenology indicators, is identified for each pixel by finding the month when the maximum PFT chl a occurred during the year. Anomaly in percent is determined by computing the relative difference between the PFT state of 2021 and the average state of the last 2 decades (i.e., climatology).
3.1 Inter-sensor corrections of PFT products and validation with in situ data
Figure 1 shows the comparison between monthly PFTs from SeaWiFS-/MODIS-/MERIS-merged and MODIS-/VIIRS-merged data for the overlapped 4 months (January–April 2012). PFT retrievals from different satellite sensors show some differences but overall correlate well with each other (R2>0.82). Type II linear regression between the retrievals from two satellite data sources is determined for each PFT by accounting for the per-pixel uncertainty. The slope and intercept values are then used to correct the MODIS-/VIIRS-derived PFTs to the SeaWiFS-/MODIS-/MERIS-derived ones so that they are overall consistent, though the pixelwise discrepancy still exists. The same is applied to the Sentinel 3A OLCI-derived PFTs by comparing them to the corrected MODIS-/VIIRS-derived PFTs for the overlapped period April–December 2016 so that all PFT data from both MODIS/VIIRS and OLCI are now referenced to SeaWiFS-/MODIS-/MERIS-derived PFTs. Though R2 is slightly weaker (R2 between 0.77 and 0.83) compared to that from the MODIS-/VIIRS- versus SeaWiFS-/MODIS-/MERIS-derived PFTs (R2 between 0.82 and 0.98), OLCI-derived PFTs still showed overall good correlations to the corrected MODIS/VIIRS data, with regression slopes between 0.83 and 1.03, despite prokaryote chl a retrievals from OLCI data being higher in general.
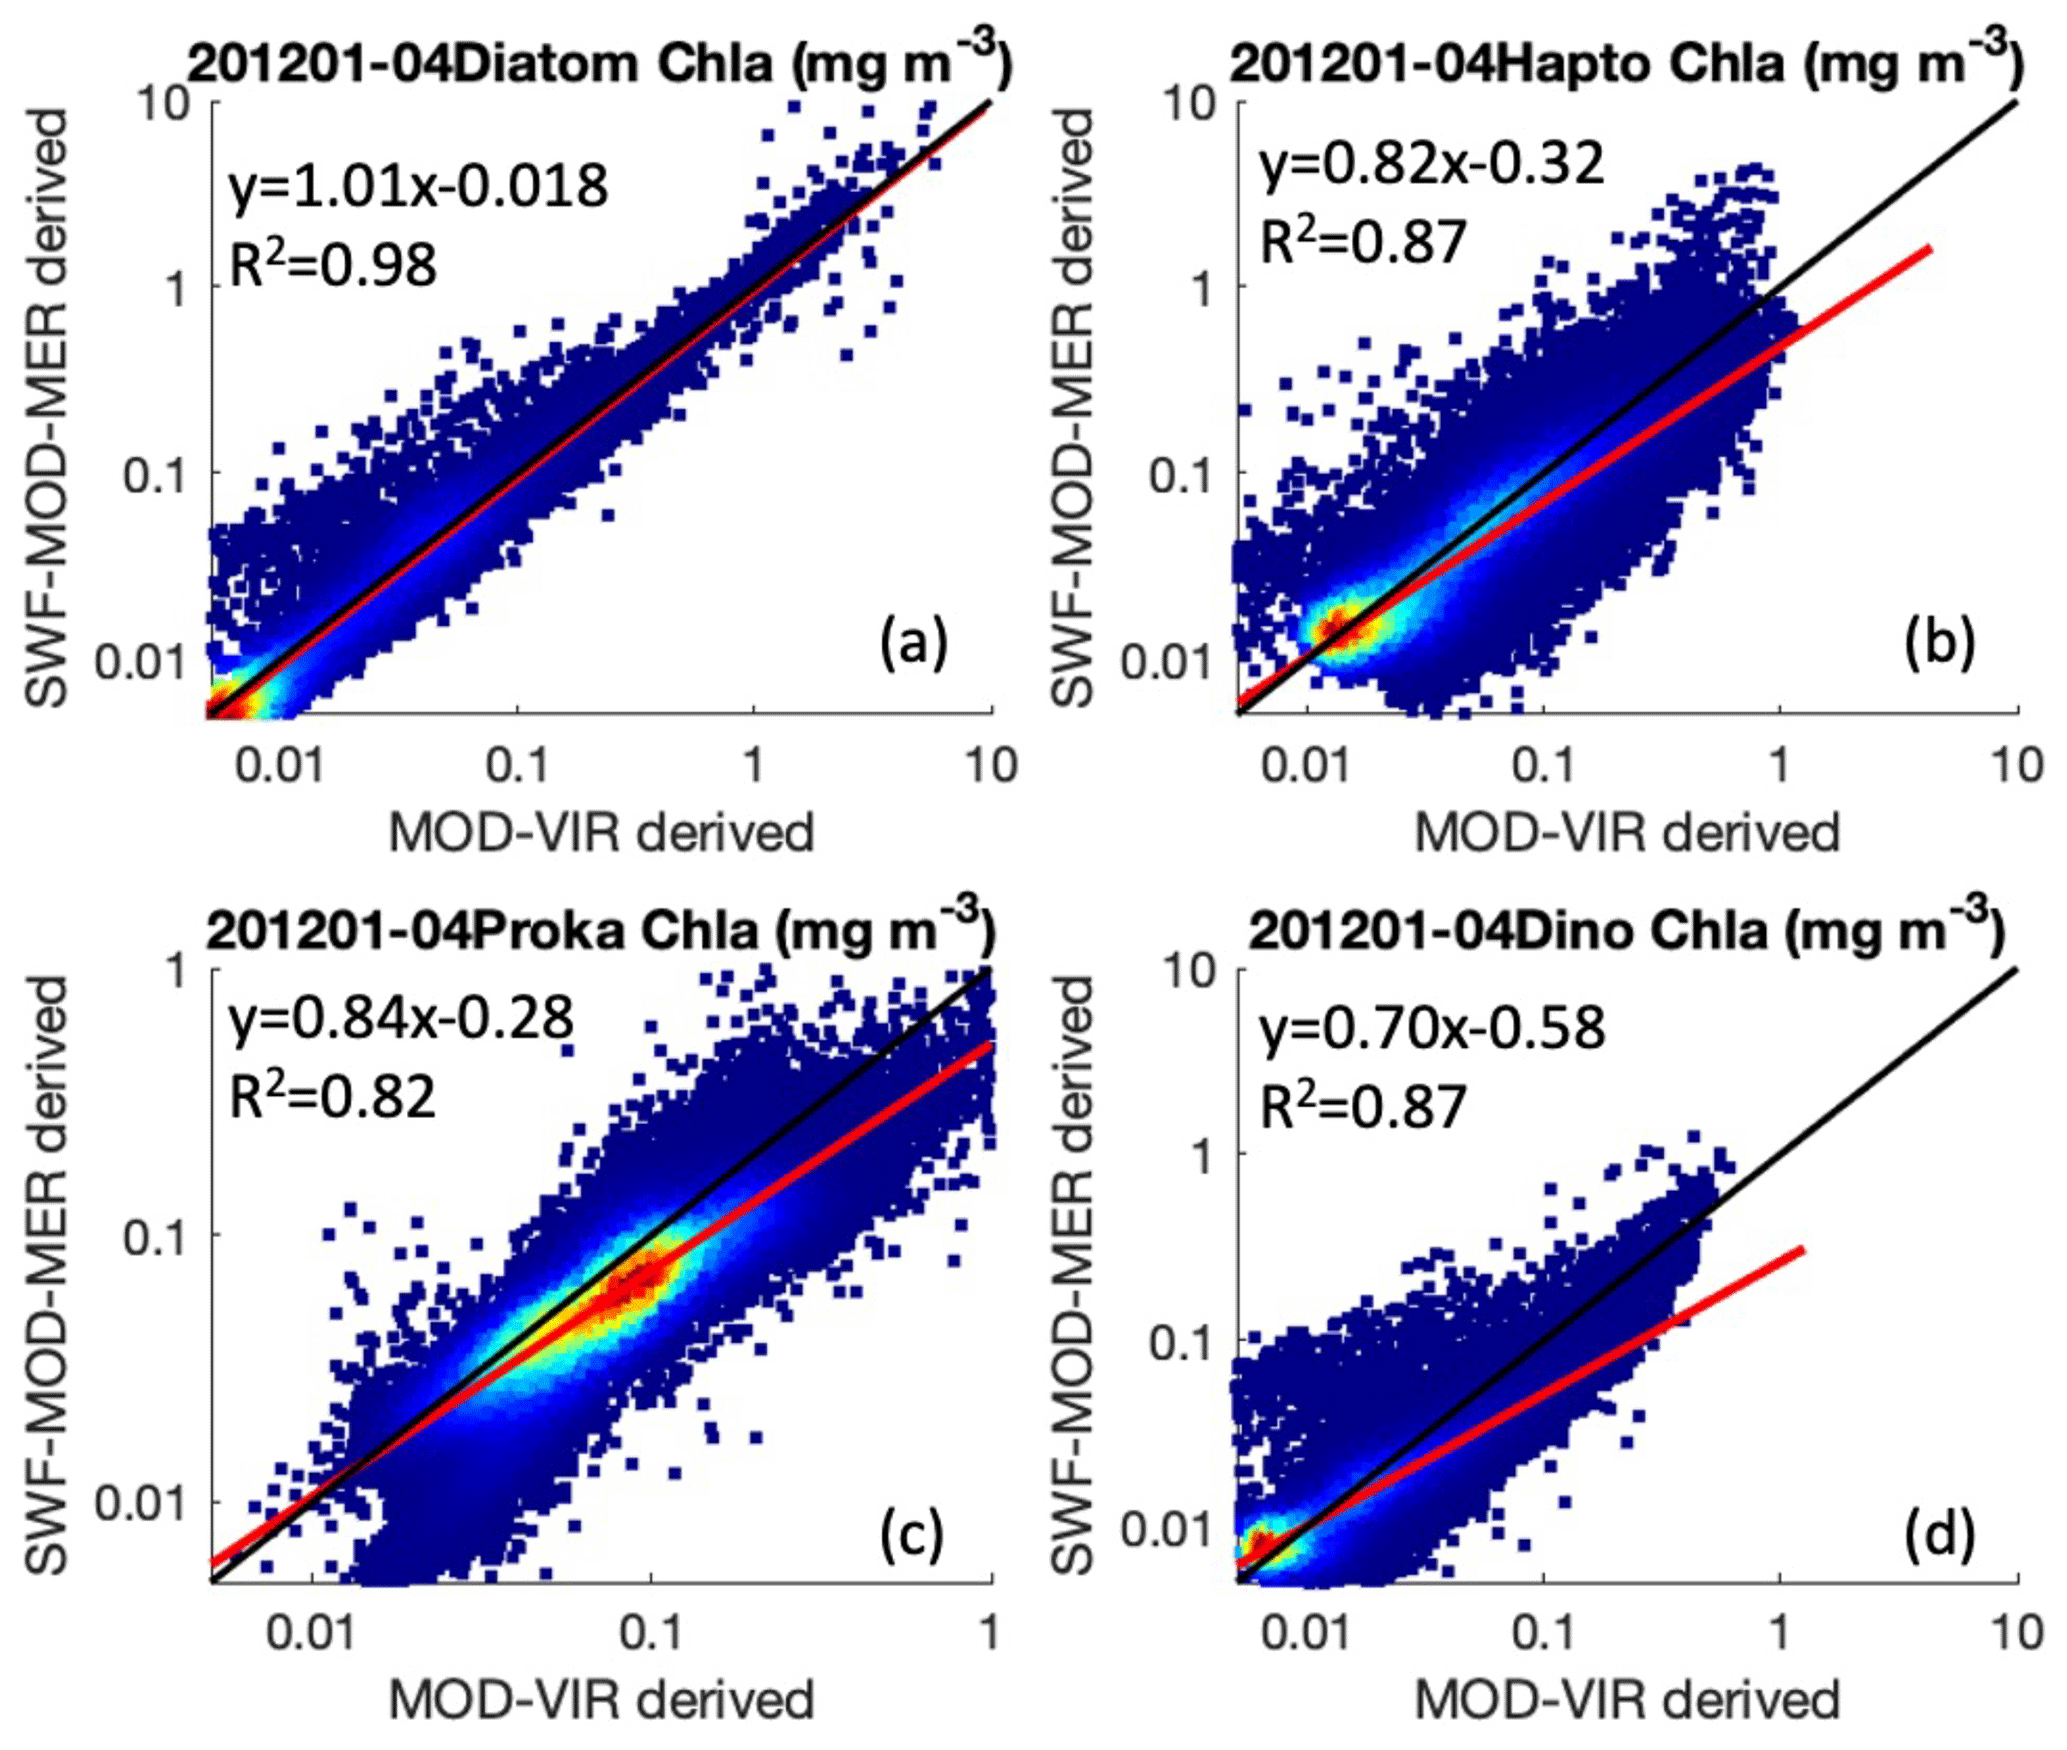
Figure 1Scatterplots of monthly PFTs derived from SeaWiFS-/MODIS-/MERIS-merged and MODIS-/VIIRS-merged Rrs data for the overlapping period January–April 2012. (a) Diatoms, (b) haptophytes, (c) prokaryotes and (d) dinoflagellates. The 1:1 line is shown in black and the linear regression line (using type II regression with per-pixel uncertainty) in red. R2, slopes and offsets determined in log-10 scale are also presented.
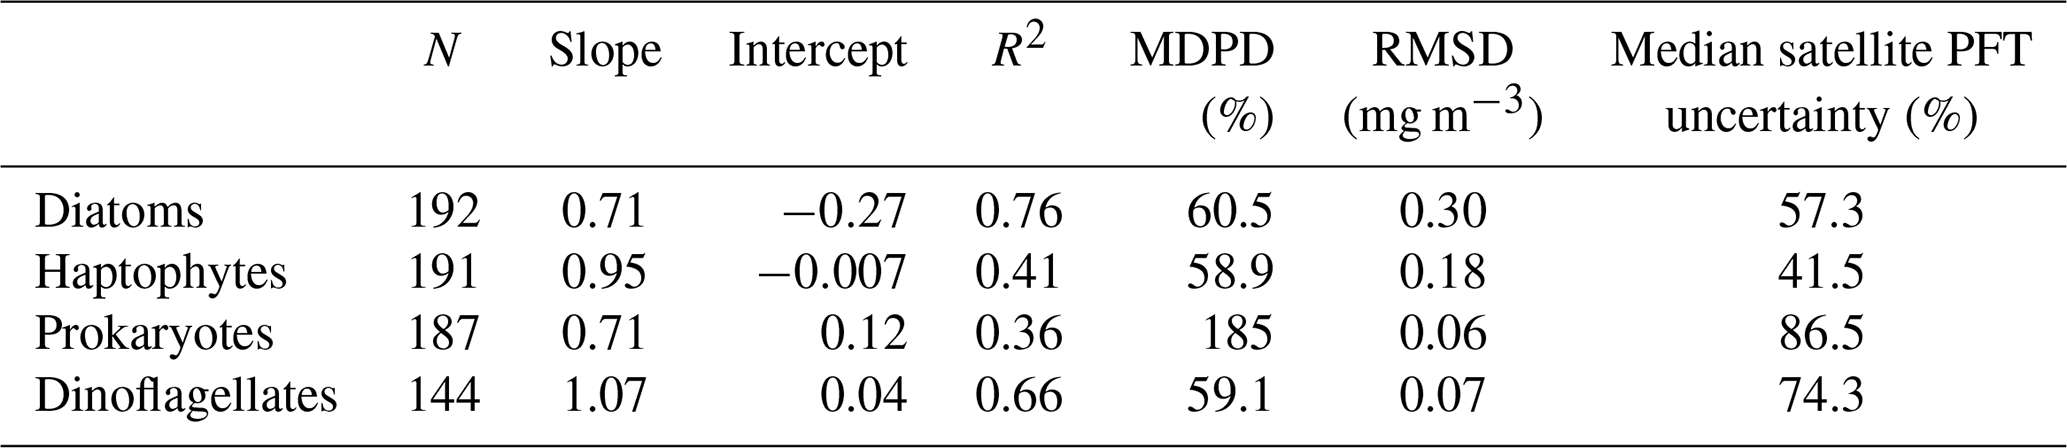
Validation was carried out by comparing the collocated satellite PFTs with the in situ PFTs using the extracted matchup data. Statistical results of the validation in Table 2 in general show acceptable agreement between the in situ and satellite-derived PFTs. Median percent differences (MDPDs) are consistent with the median satellite PFT uncertainties (relative error in percent) estimated through Monte Carlo simulation and error propagation in Xi et al. (2021), and for dinoflagellates they are notably lower. A higher MDPD is found for prokaryotes due to a systematic overestimation of the picophytoplankton in the retrieval algorithms for all the three sets of satellite OC sensors; however, no significant bias of satellite prokaryote products is detected between different sensors. Therefore the overestimation should have minor influence on the time series data of prokaryotes. In addition, a coarser evaluation by directly comparing the monthly satellite PFTs (which have better spatial coverage) to the in situ PFTs for the whole cruise track has shown that the PFT variation regarding regional phytoplankton dynamics observed by the in situ PFT is very well revealed by satellite PFT maps (images not shown). These evaluations assure the quality of the satellite PFTs for time series analysis.
Table 2Statistical validation results of satellite-derived PFT chl a (after inter-mission correction) as a function of in situ PFT chl a using least square fit in logarithmic scale. N: number of matchups; R2: coefficient of determination; MDPD: median percent difference; RMSD: root mean square difference; for a definition of equations of these terms please refer to Xi et al. (2020). Note that slope, intercept and R2 were calculated based on a logarithmic scale. Median uncertainties calculated based on satellite per-pixel PFT uncertainty (equivalent to relative error in percent, adapted from Xi et al., 2021) are also shown in the last column.
3.2 PFT climatology (2002–2021)
Figure 2 shows the climatology (2002–2021) of the four PFTs generated using satellite monthly PFT products, depicting differences and similarities in terms of PFT chl a magnitude and spatial variation among different PFTs. Diatoms, as major silicifiers, are typically large-celled (>20 µm, though species with smaller cells also exist) and highly dependent on nutrient levels. They are sensitive to the global temperature, especially to the Equator–pole temperature gradient. The 2-decade climatology of diatoms in the Atlantic region shows a clearly higher abundance at high latitudes and in coastal regions and the lowest abundance (or even undetectable) in the vast subtropical gyres. Similarly, haptophytes, which are mostly classified as nanophytoplankton (2–20 µm), also have a higher abundance at high latitudes and in coastal regions but span a larger coverage than diatoms. Enhanced abundance level is also found in the equatorial belt. The lowest abundance of haptophytes is also found in the gyres, but their abundance is not as low as that of diatoms. Prokaryotes, commonly referred to as picophytoplankton (<2 µm), show the highest abundance at mid-latitudes to low latitudes of the open Atlantic Ocean. Though spatially showing the lowest abundance in the gyres, prokaryotes are still the most dominant phytoplankton group in the majority of these regions. Dinoflagellates as a relatively minor contributor to the total biomass follow a similar distribution pattern to diatoms but are much lower in abundance at higher latitudes.
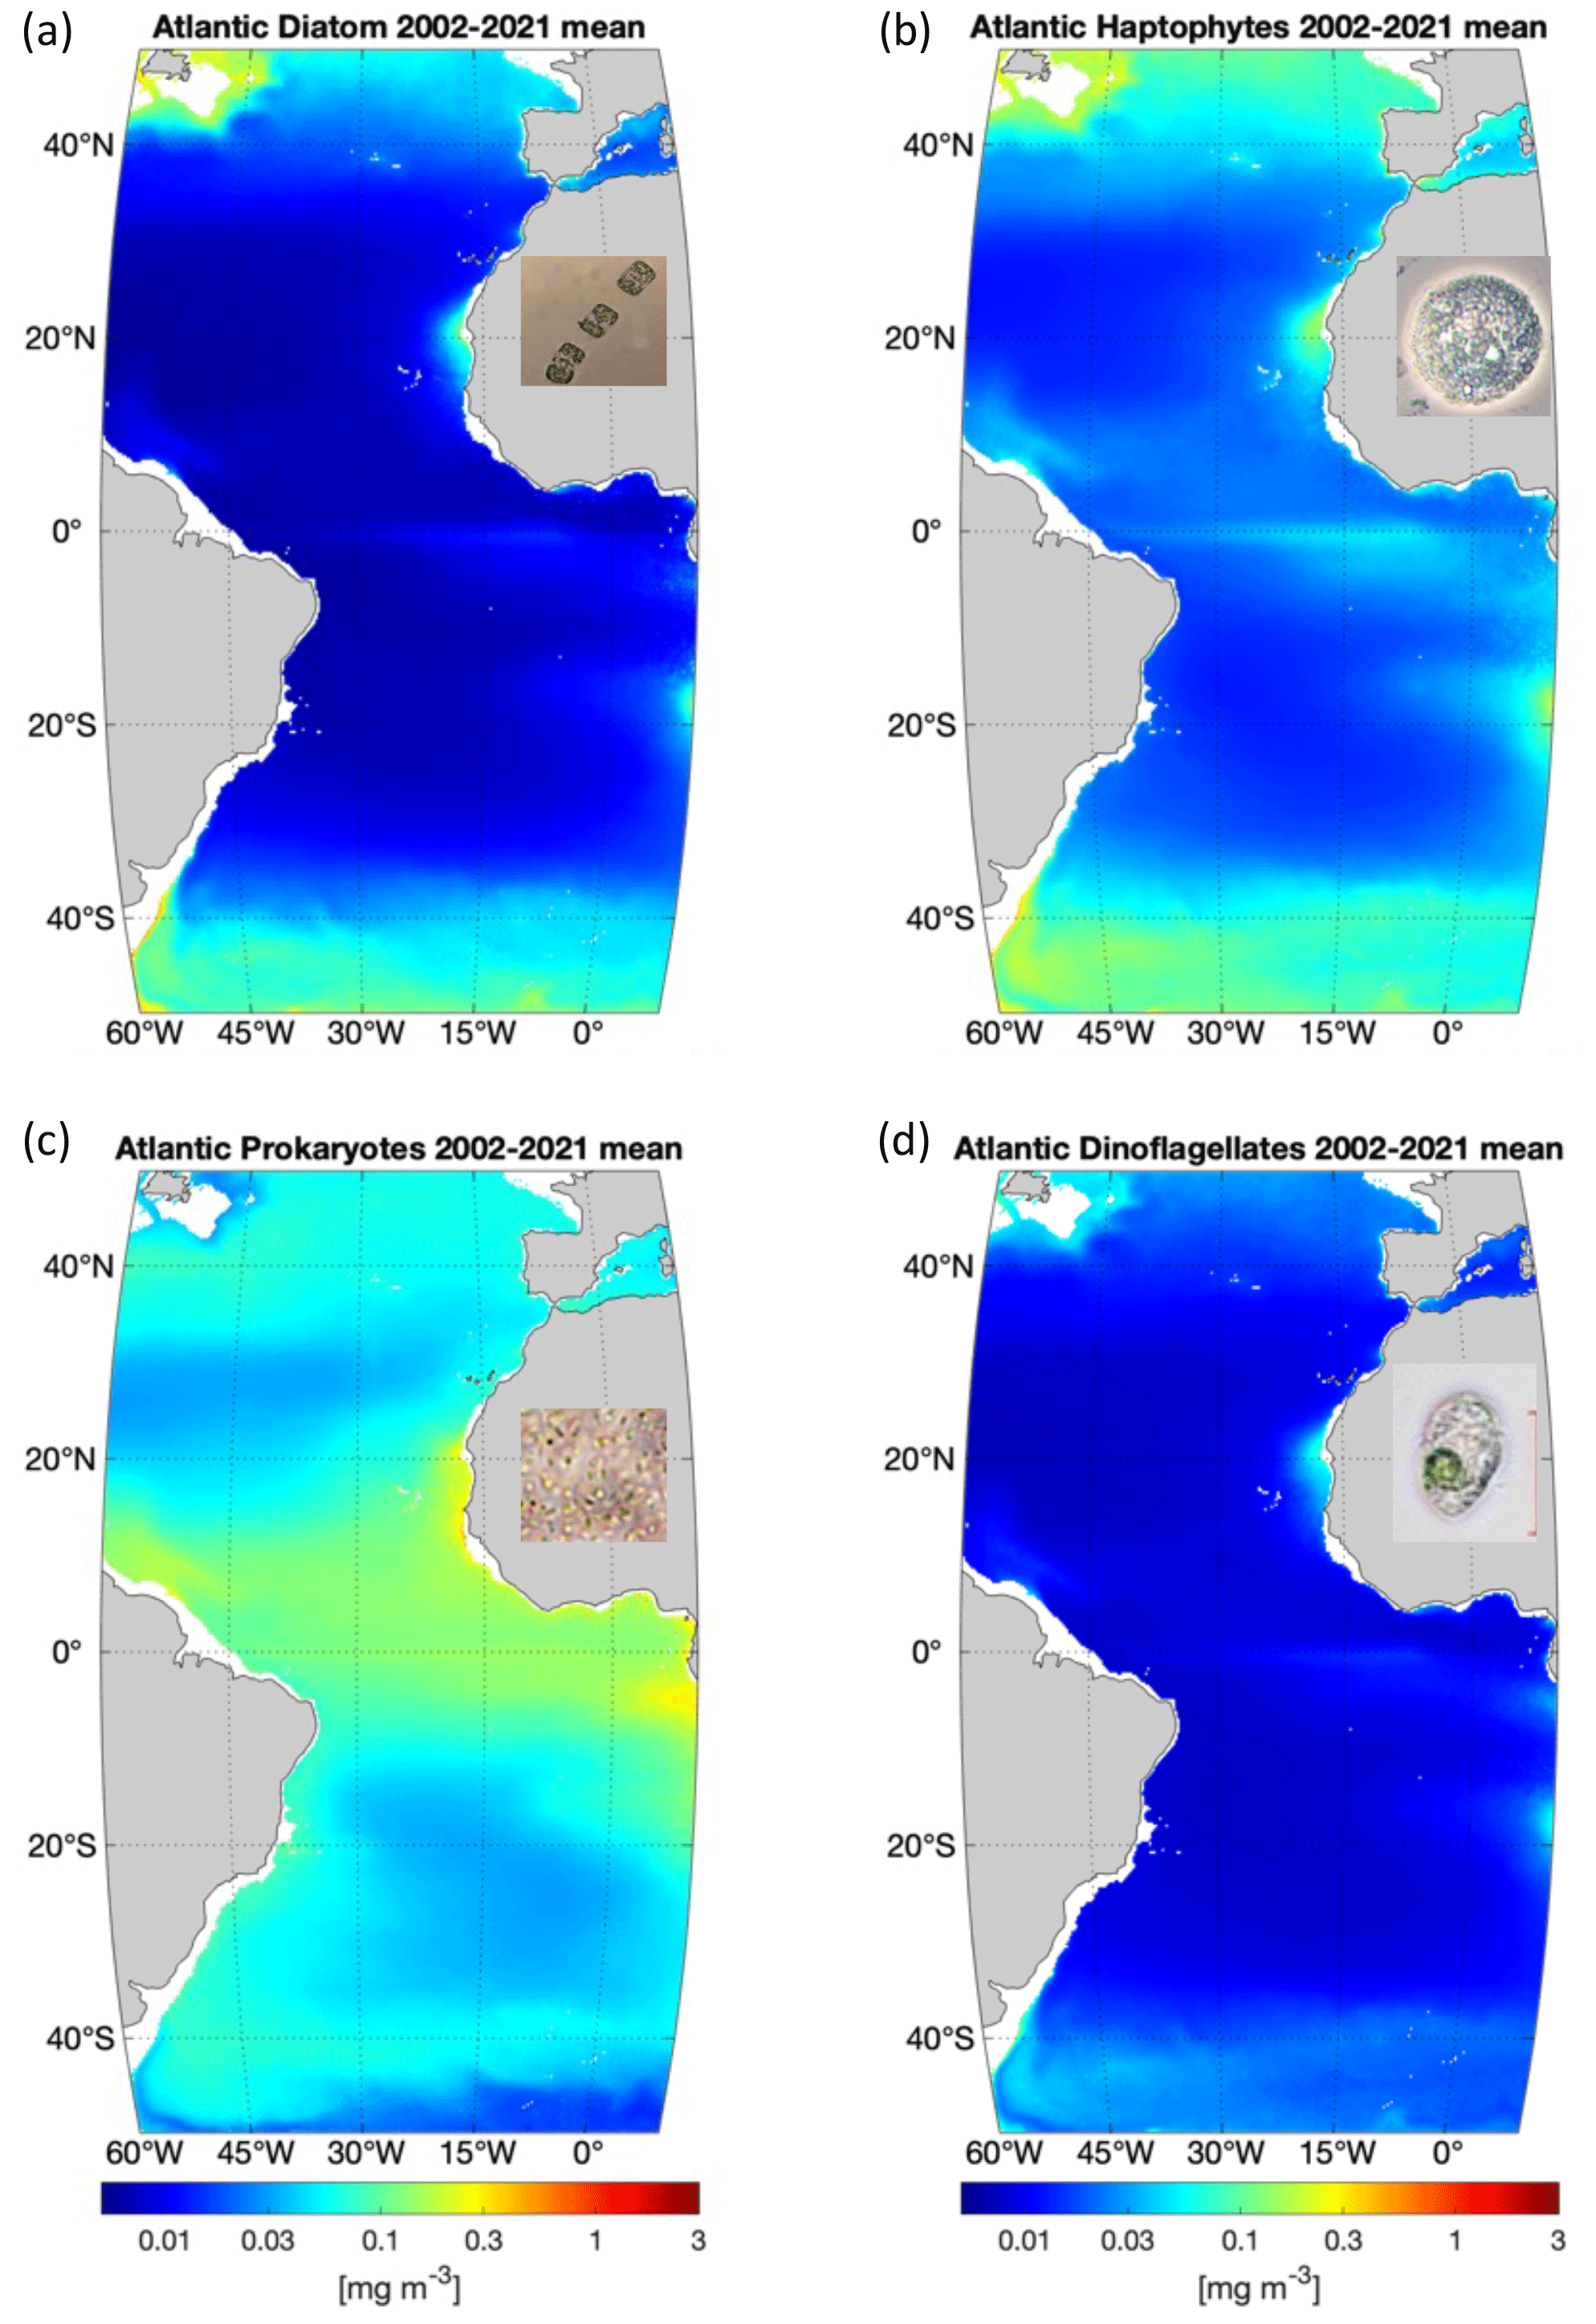
Figure 2PFT climatology based on monthly PFT chl a products from 2002 to 2021: (a) diatoms, (b) haptophytes, (c) prokaryotes and (d) dinoflagellates. Microscopic photos of the representative species for the four PFTs are presented (photo credit: Alfred Wegener Institute).
3.3 PFT trends during 2002–2021 in the Atlantic Ocean
Following the climatology study, the annual cycles of the four PFTs over the whole Atlantic Ocean are also derived by extracting the mean biomass of the 2 decades for each month (Fig. 3a). Prokaryotes are clearly the most dominant group, showing the highest mean of the chl a (0.062–0.072 mg m−3) over the Atlantic all year round, followed by haptophyte chl a, which varies from 0.03 to 0.045 mg m−3. Diatom chl a varies from 0.017 to 0.026 mg m−3, and dinoflagellates, with the lowest mean chl a, are below 0.015 mg m−3. Despite different magnitudes, diatoms, haptophytes and dinoflagellates present very similar annual cycles, with two biomass peaks in April and November, indicating the spring blooming especially at high latitudes in both the Northern Hemisphere and Southern Hemisphere. In contrast, prokaryotes show a distinct biomass peak in June–July and a less prominent increase in December–January due to the suppressed growth of the other PFTs in these periods.
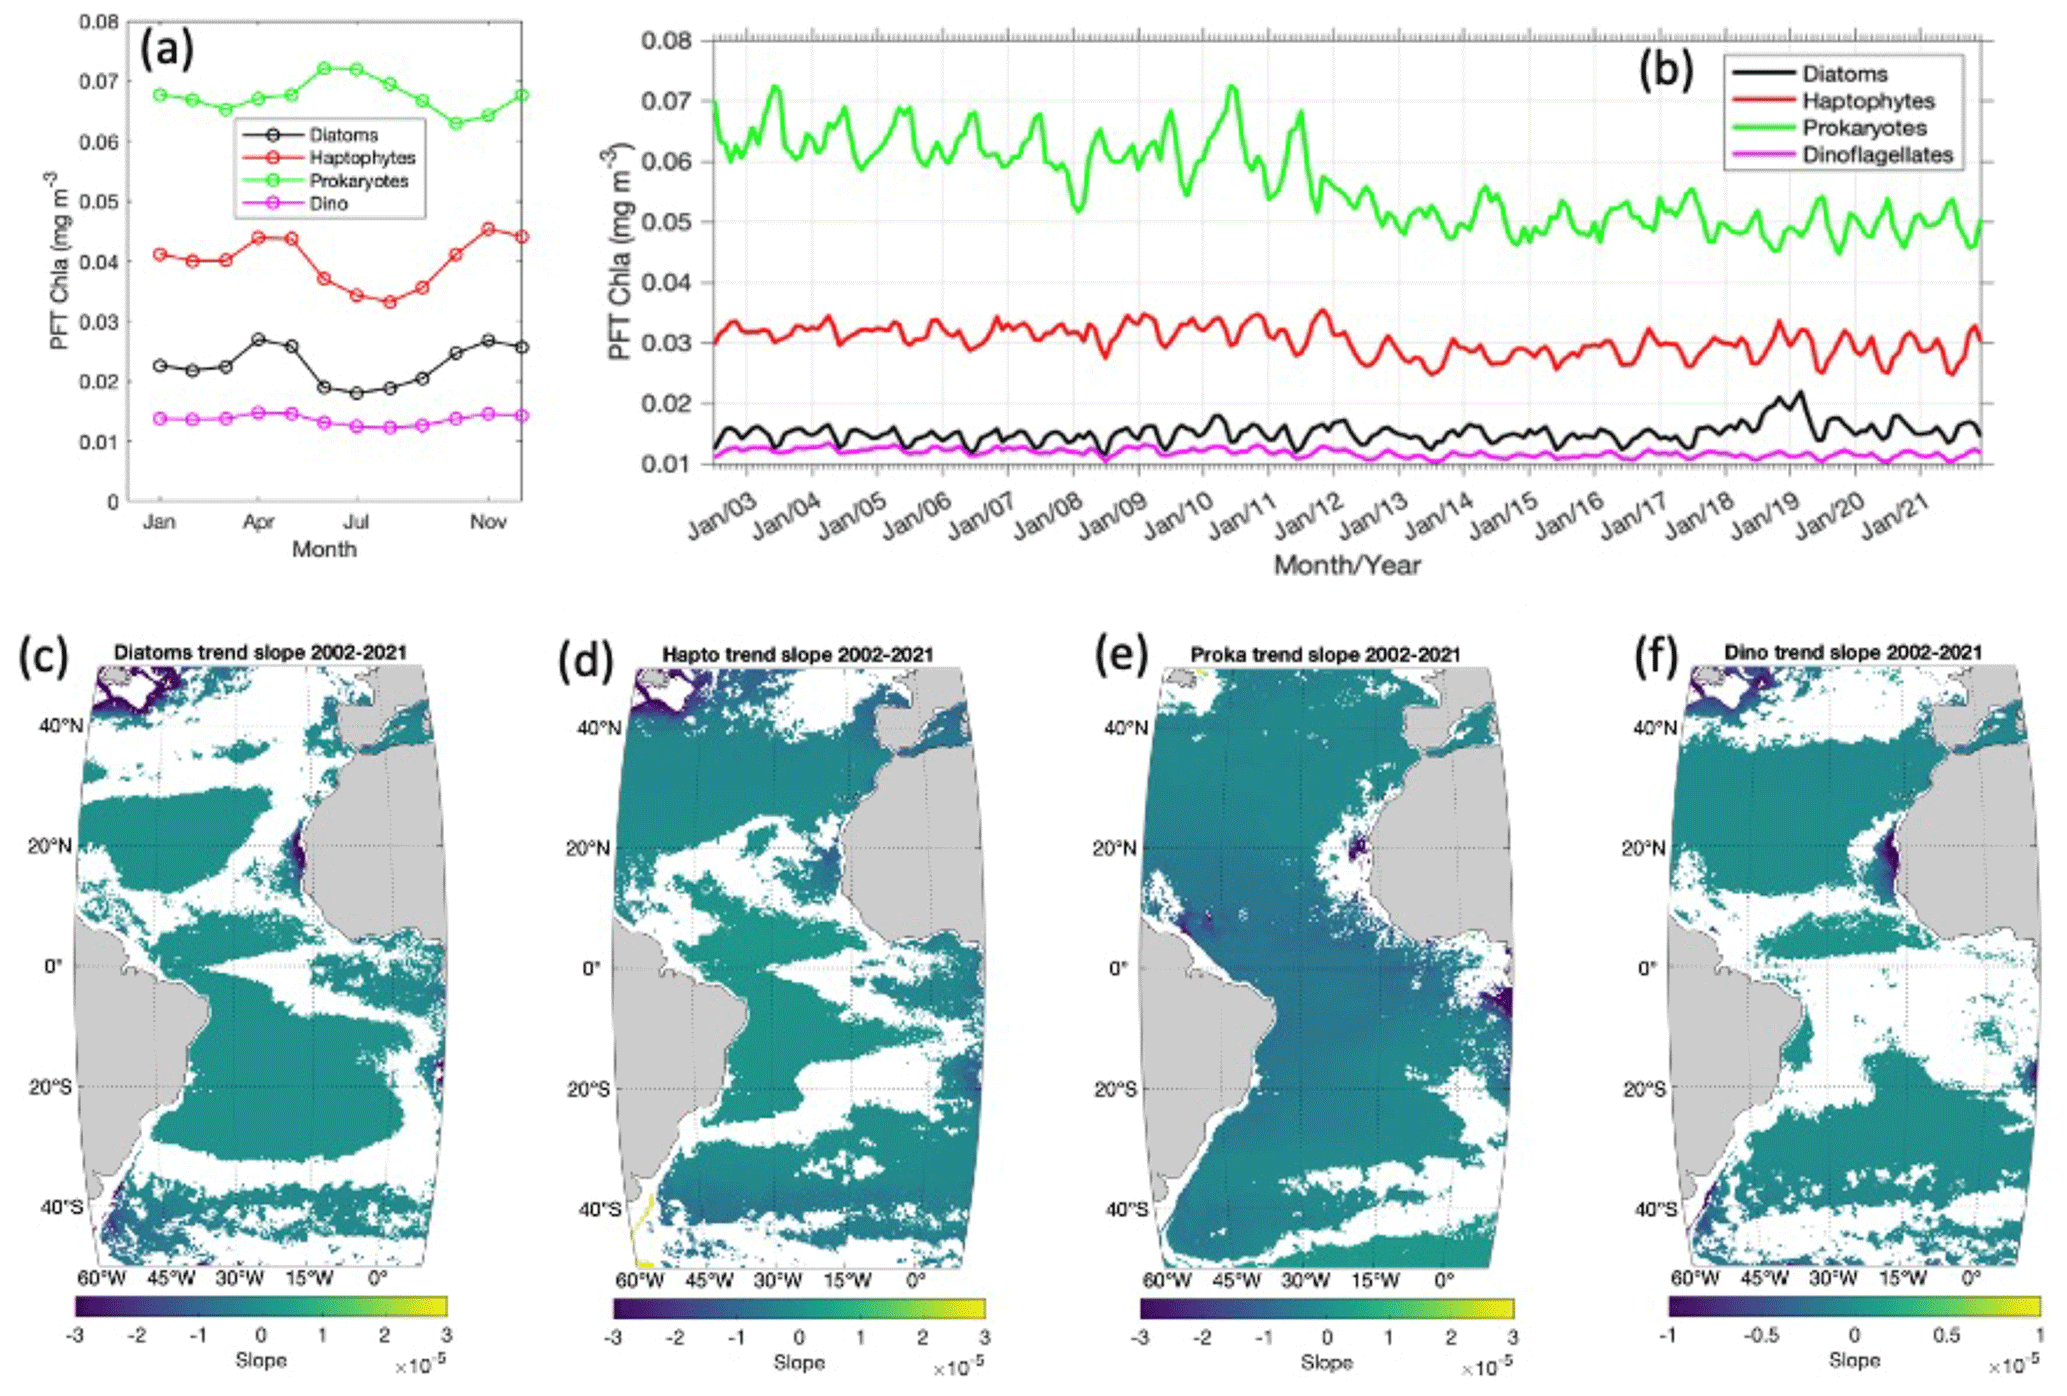
Figure 3(a) Annual cycle of the four PFTs of diatoms, haptophytes, prokaryotes and dinoflagellates in the Atlantic Ocean (−50∘ S to 50∘ N, 60∘ W to 10∘ E); (b) 20-year time series from 2002 to 2021; and (c) per-pixel slope based on monthly chl a products of diatoms, (d) haptophytes, (e) prokaryotes and (f) dinoflagellates from 2002 to 2021 (where p<0.05 is shown; slope unit: chl a mg m−3 per month).
Time series of the monthly PFT data averaged for the whole Atlantic are shown in Fig. 3b, depicting a significant decrease (0.0001 chl a mg m−3 per month, p<0.01) in prokaryote chl a, but no significant trend is observed for the other three PFTs, although some interannual changes are visible. Between the time window of 2003 and 2008, a slight decline in prokaryote chl a is observed, followed by a 2-year increase (2009–2010), but from 2011 onwards a continuous decline is again observed. The per-pixel trend of prokaryotes in Fig. 3e shows that the decreasing trend of prokaryotes is mainly found at low latitudes and particularly on the west coast of Africa (Canary Current Coastal Province, CNRY, and Guinea Current Coastal Province, GUIN; refer to Fig. 4 for Longhurst provinces). Haptophyte time series show the lowest abundance during 2013–2015, which is then elevated slightly from 2016 (Fig. 3b). A slight increasing trend of haptophytes on the pixel level is found at mid-latitudes to low latitudes, and a decrease is found near the coast at higher latitudes (Fig. 3d). Diatom chl a is rather stable until 2017, with an abrupt increase in 2018–2019 and then a decrease in 2020–2021 to the average level of the last 20 years (Fig. 3b). The per-pixel time series in Fig. 3c shows that a significant decrease is found only on the west coast of Africa (CNRY), northwest of the North Atlantic (Northwest Atlantic Shelves Province, NWCS) and on the Patagonian coast. A very slight increasing trend of diatoms is presented in the gyres and equatorial region. Dinoflagellate chl a contributes a very minor proportion to the total biomass (<10 %) and has been relatively stable over the last 2 decades in the whole Atlantic region (Figs. 3b and f).
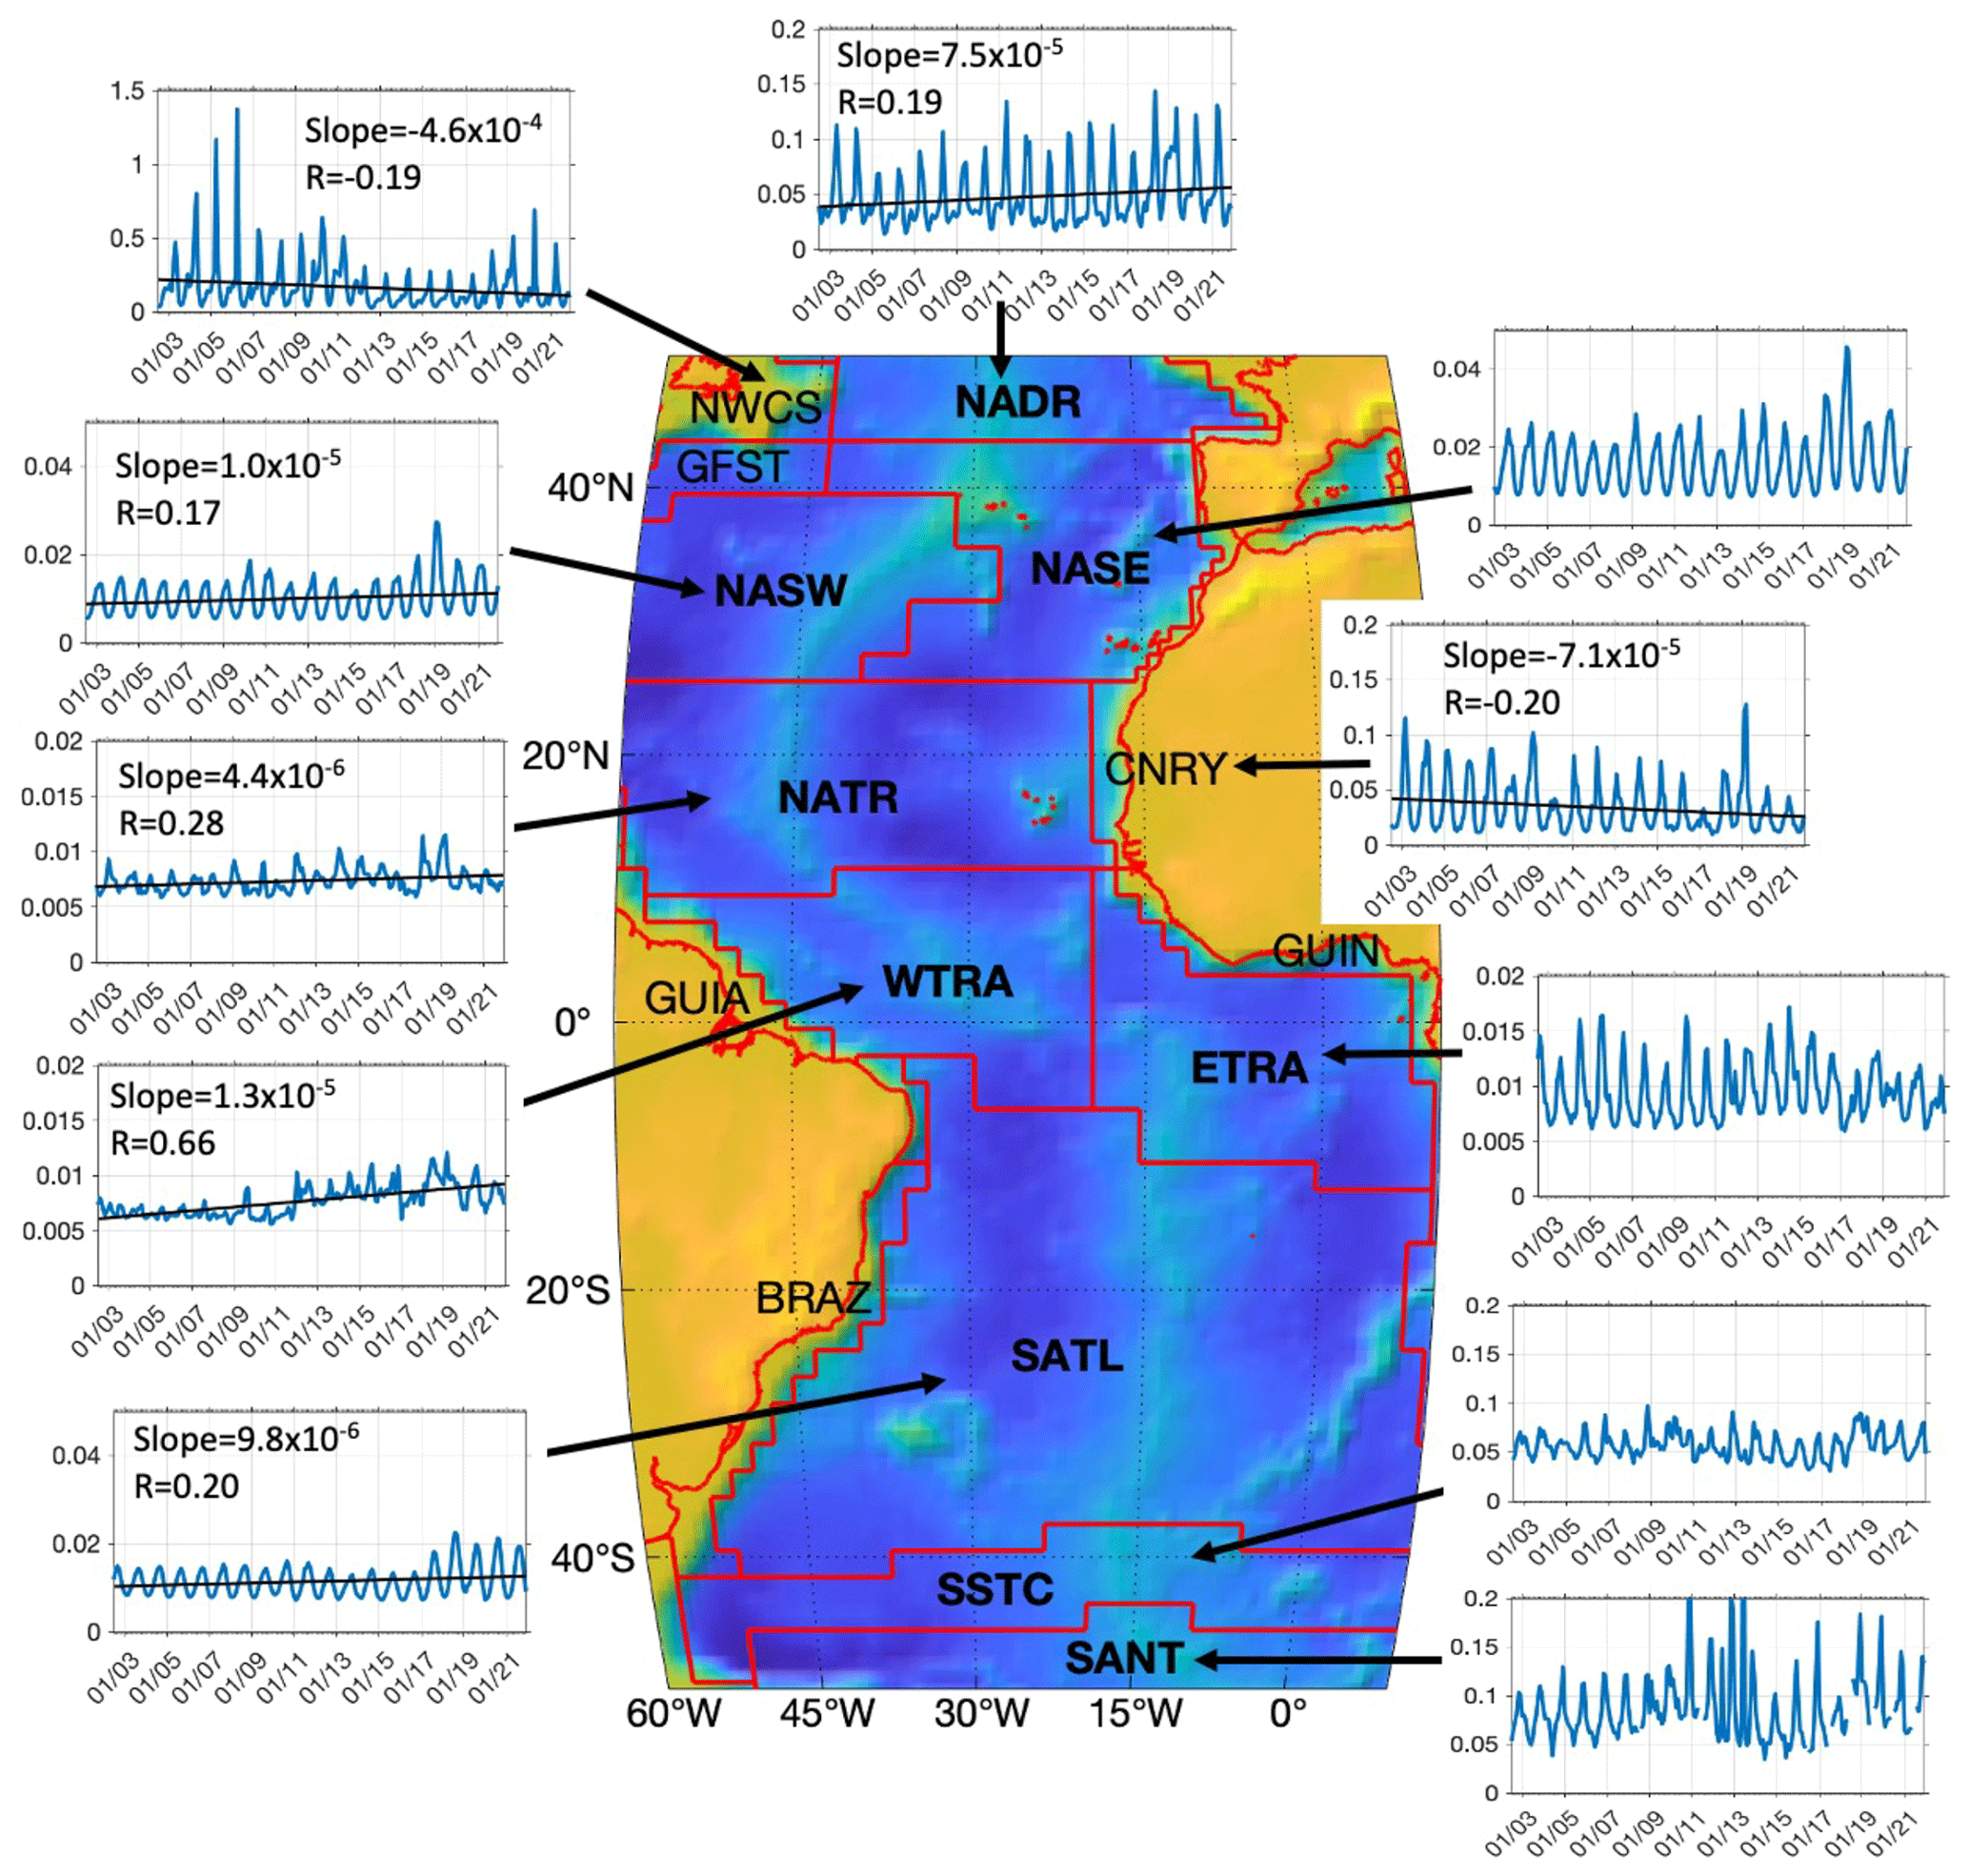
Figure 4Time series of diatom chl a (mg m−3) in 11 Longhurst provinces in the Atlantic Ocean with bathymetric information based on ETOPO1 bathymetry (Amante and Eakins, 2009). Provinces according to Longhurst (2007) are NADR for North Atlantic Drift Province, NWCS for Northwest Atlantic Shelves Province, NASW for North Atlantic Subtropical Gyral Province (West), NASE for North Atlantic Subtropical Gyral Province (East), NATR for North Atlantic Tropical Gyral Province, CNRY for Canary Current Coastal Province, GUIN for Guinea Current Coastal Province, WTRA for Western Tropical Atlantic Province, ETRA for Eastern Tropical Atlantic Province, SATL for South Atlantic Gyral Province, SSTC for South Subtropical Convergence Province and SANT for Subantarctic Water Ring Province, respectively. Trend lines with slopes (chl a mg m−3 per month) and correlation coefficients are shown for provinces with significant trends (p<0.05).
Time series of diatom chl a in different Longhurst provinces of the Atlantic are further extracted in order to investigate whether the abrupt increase in diatoms during 2018–2019 took place in the whole Atlantic or only in some regions. Figure 4 presents large variability in the diatoms in different regions in terms of both magnitudes of chl a and temporal trends. In general, high latitudes and coastal regions, where diatom chl a is higher, present high interannual variation compared to the open ocean at lower latitudes. For instance, diatoms on the west coast of Africa (CNRY) have in general decreased in the last 2 decades except for a dramatic increase in late 2018 and spring 2019, followed by a 2-year decrease in 2020–2021. Despite an obvious elevation in diatoms during 2018–2020, a significant decline in diatoms in the last 2 decades is still found in the NWCS, consistent with the trend map shown in Fig. 3c. A slight increase is found in provinces in the gyres and equatorial region (North Atlantic Subtropical Gyral Province (West), NASW; NATR; Western Tropical Atlantic Province, WTRA; and South Atlantic Gyral Province, SATL), with very low diatom chl a (mean chl a <0.02 mg m−3), and also in the Southern Ocean South Subtropical Convergence Province (SSTC). The prominent increase observed during 2018–2019 is mostly contributed by the North Atlantic Ocean CNRY, North Atlantic Subtropical Gyral Province (East) (NASE) and NASW. Other provinces such as in the gyres, with elevated diatom chl a since 2018, also contribute, but only slightly, to this increase due to much lower diatom chl a there compared to the other regions.
3.4 PFT phenology and anomaly of 2021
The status of the PFTs in the Atlantic Ocean is investigated specifically in 2021 to reflect the Atlantic ecological state and changes for this year as compared to the previous years. To better understand the yearly transition and shifting between different PFTs in the Atlantic Ocean, one of the phenology indicators, abundance maxima time, is mapped per-pixel for the four PFTs (Fig. 5). Diatoms in the North Atlantic (>35∘ N) reach the abundance maxima during late spring (April–May) but earlier (January–February) in the North Atlantic gyre. In the equatorial region the maxima months vary between May and August, with the Equator reaching the maxima the earliest (around May). In the Southern Hemisphere, diatoms reach maxima on average 6 months later than in the Northern Hemisphere, i.e., in the South Atlantic gyre in July–August (austral winter) and in October–December (late spring) in most of the Southern Ocean, which corresponds well with the maxima seasons in the Northern Hemisphere. Haptophytes and dinoflagellates show similar patterns to diatoms but on average bloom 1 month later than diatoms, indicating PFT dominance succession between diatoms and haptophytes in late spring and early summer. Prokaryotes over the whole Atlantic show a more complex and distinct seasonal cycle compared to the other three PFTs. The per-pixel phenology map shows that prokaryotes reach an abundance maximum from autumn to winter at latitudes >20∘ N, and their maxima time is delayed with decreasing latitude. In other regions the per-pixel maxima month normally spans a wider time window of 3 to 5 months, such as in the equatorial region from January to May, the South Atlantic gyre from April to August, the western sector of the Southern Ocean from January to April and the eastern sector from November to January. Though geographically prokaryotes show more variation in the phenology, an overall inverse seasonal cycle is presented compared to diatoms, haptophytes and dinoflagellates, as depicted in Fig. 3a.
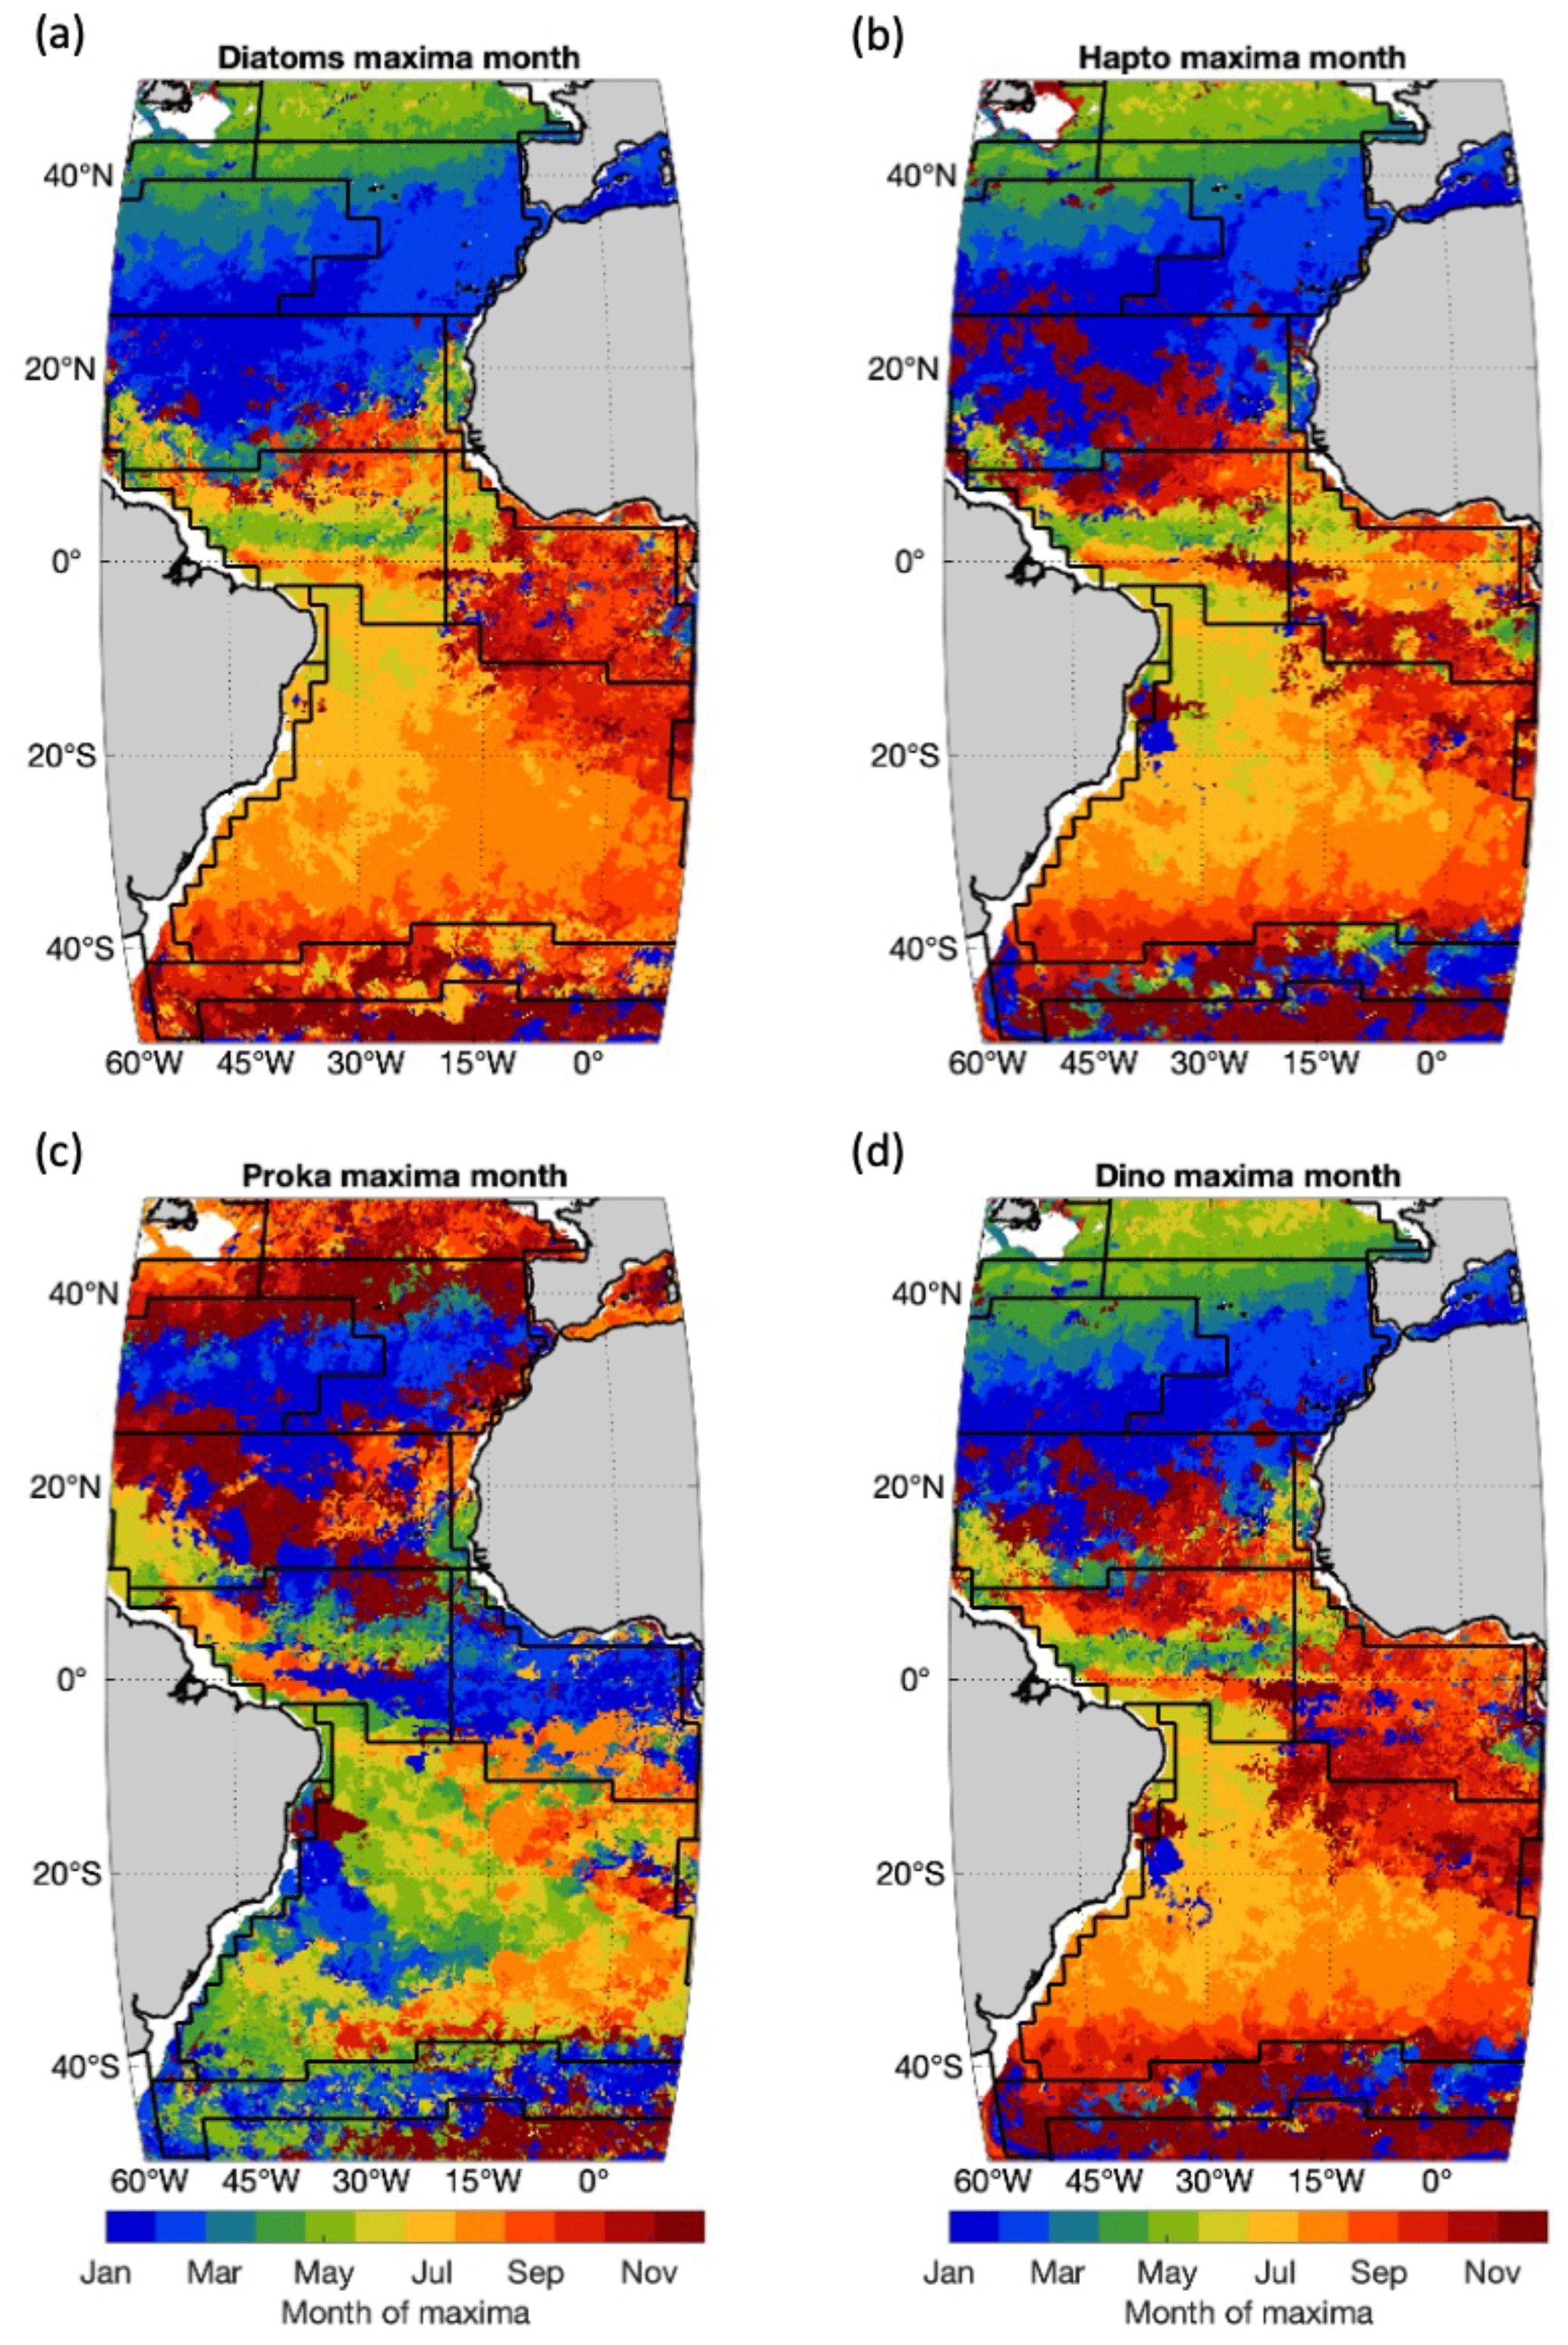
Figure 5Occurrence month of PFT chl a maxima of 2021 in different provinces for (a) diatoms, (b) haptophytes, (c) prokaryotes and (d) dinoflagellates. Black lines indicate boundaries of Longhurst provinces as in Fig. 4.
Anomalies in percent of the four PFTs in 2021 compared to the average state of the last 2 decades are shown in Fig. 6. The diatom anomaly presents changes mainly at high latitudes and in gyres and some coastal regions (such as CNRY). The anomaly shows mostly lower diatom chl a at high latitudes, except for NWCS and the southeastern part of NADR, where diatom chl a is increased. In contrast to that, diatom chl a of 2021 in the gyres is generally higher (∼30 %) compared to the 20-year average state. Note that changes are shown in percent instead of the absolute values to enhance the visibility of small absolute changes, which in the gyres can be very sensitive, as diatom chl a is extremely low there (<0.01 mg m−3). The haptophyte anomaly presents changes in similar regions to diatoms but reversely at high latitudes, especially in the Southern Ocean, where a more prominent increase and also larger coverage are observed. An increase in haptophytes in the area north of the Equator in WTRA is more significant than diatoms. Different from diatoms and haptophytes, prokaryotes reveal a very slight decrease in 2021, mostly at low latitudes within 20∘ N–20∘ S, with higher prokaryote chl a on the west coast of Africa, especially CNRY, whereas only a mild increase (<20 %) is found at high latitudes. Dinoflagellates show the most stable state in 2021 among the four PFTs, with only a slight increase in chl a in the North Atlantic Ocean above 40∘ N and a small decrease in CNRY.
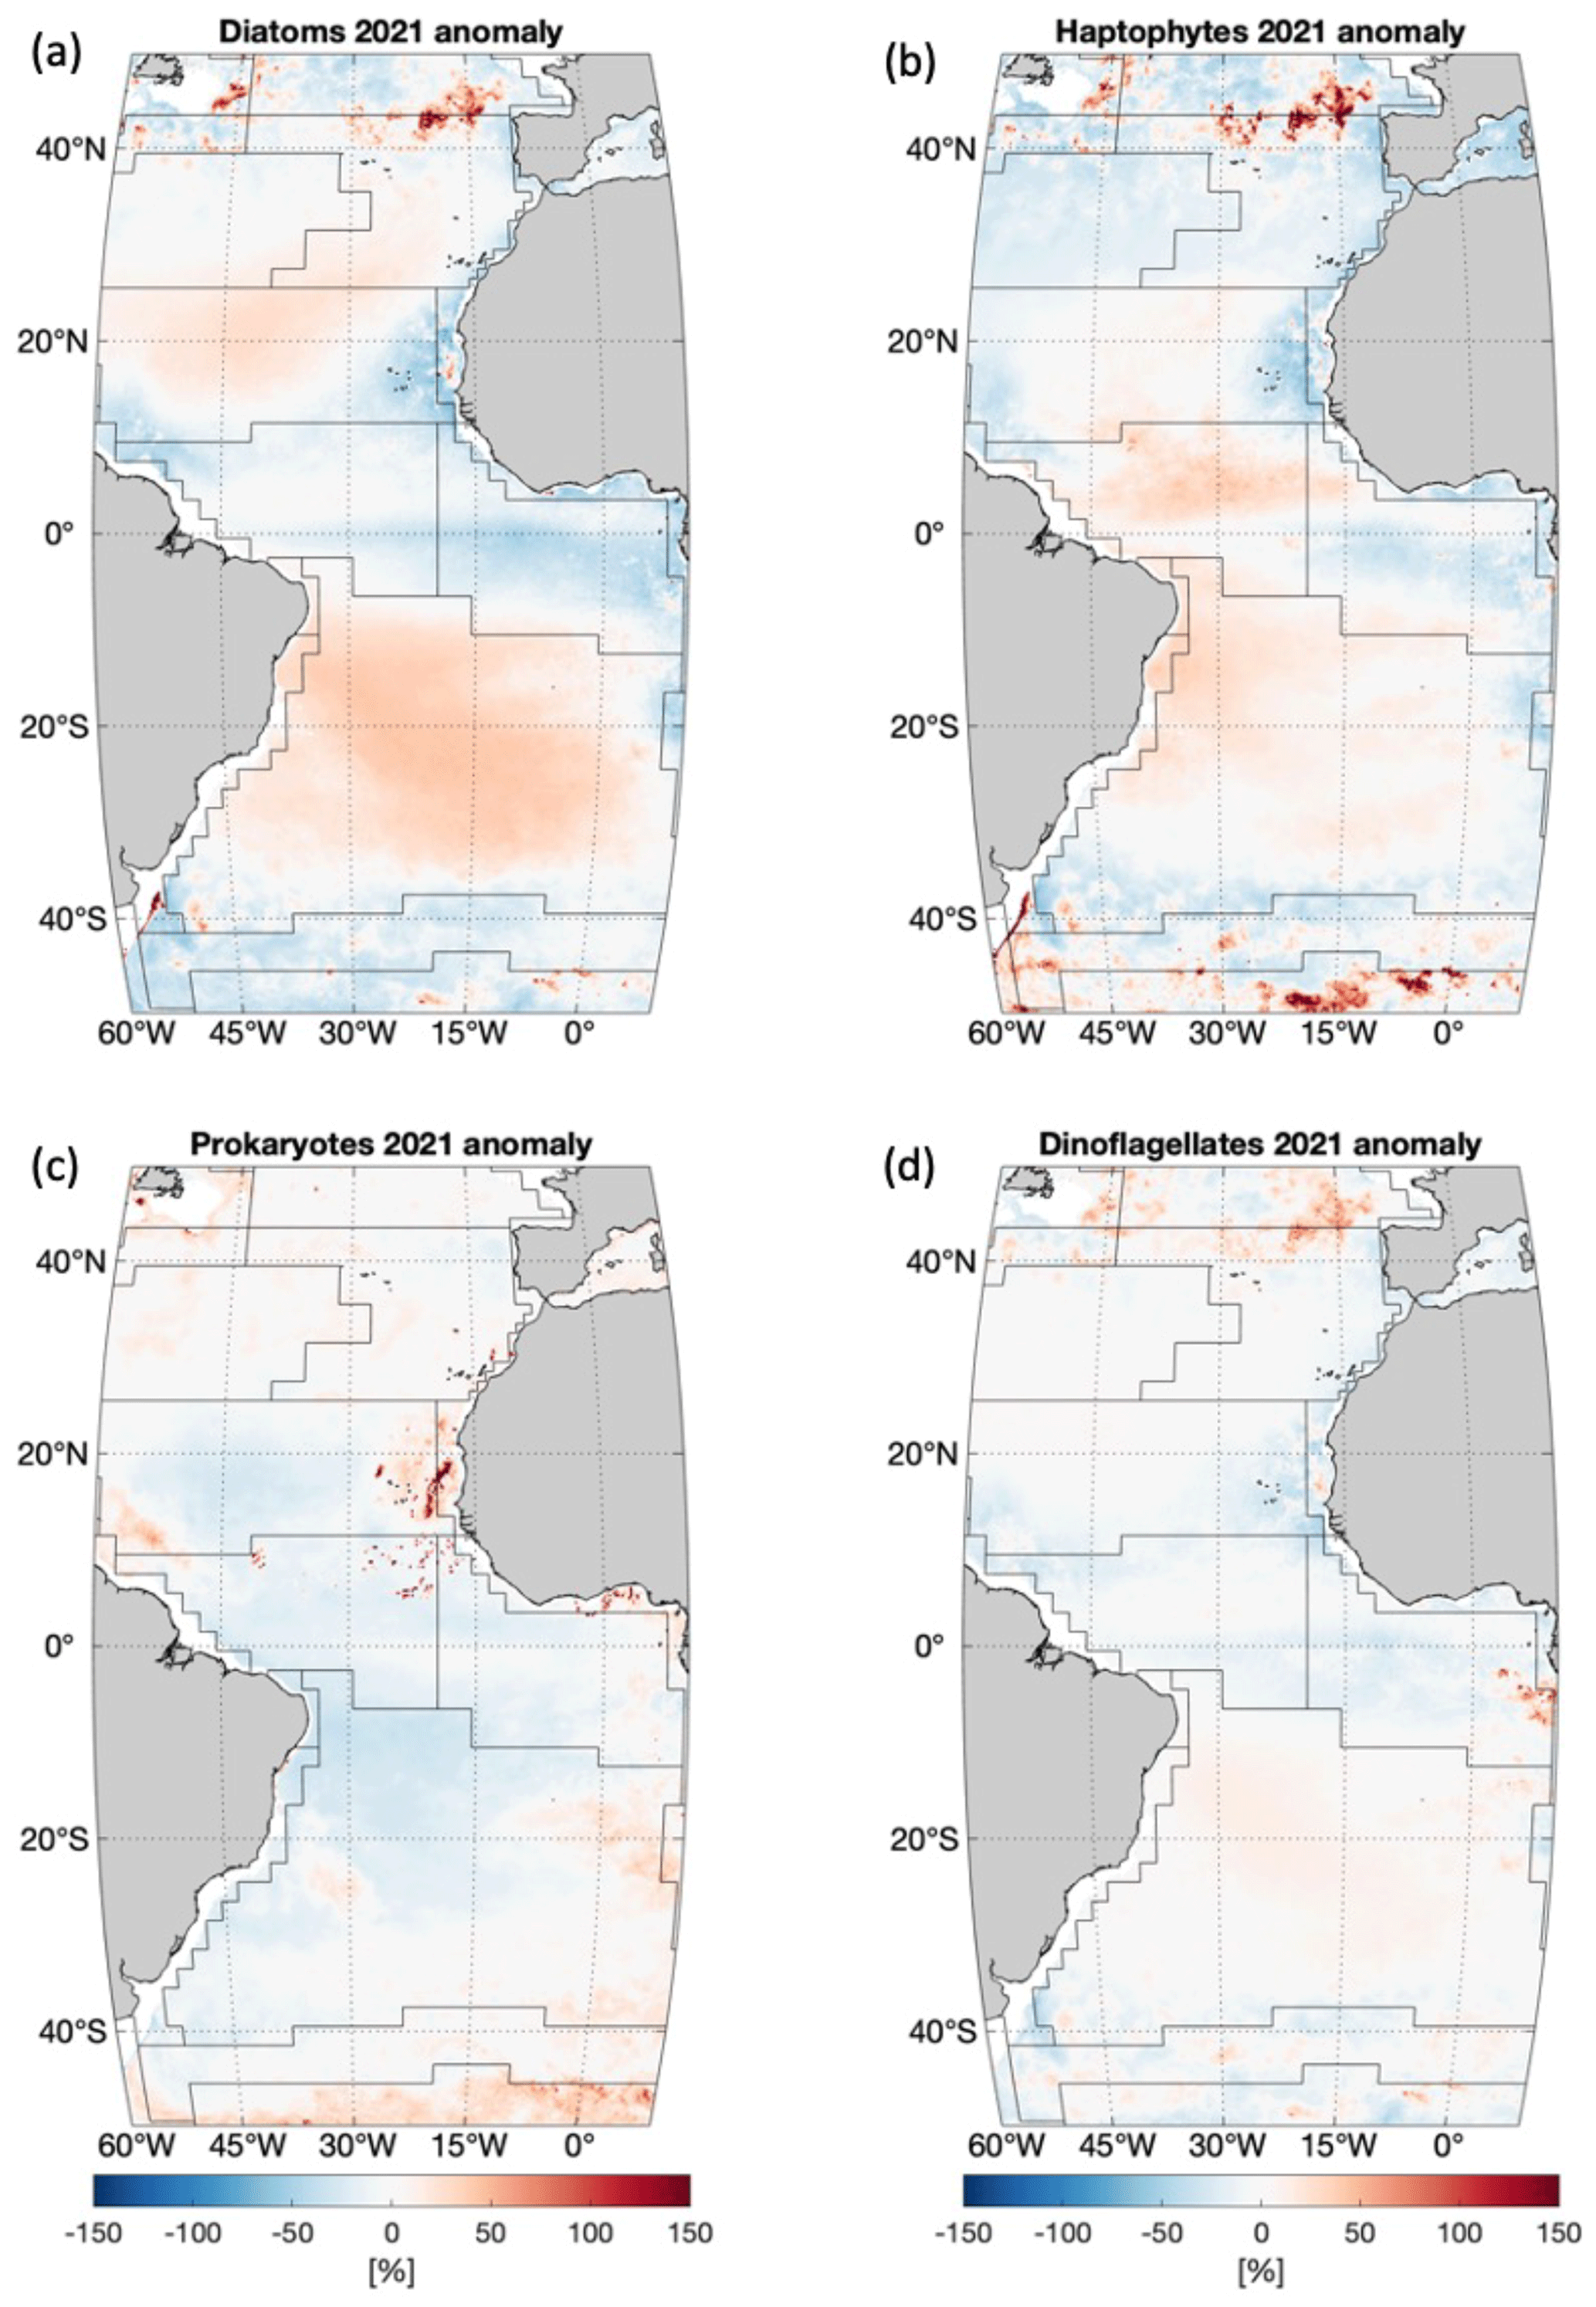
Figure 6PFT anomaly in percent (%) of 2021 compared to the 20-year mean for (a) diatoms, (b) haptophytes, (c) prokaryotes and (d) dinoflagellates. Anomaly in percent is defined as (. Black lines indicate boundaries of Longhurst provinces as in Fig. 4.
A systematic time series analysis of PFTs in the Atlantic Ocean is carried out showing high potential of the Copernicus Marine Service satellite PFTs in monitoring the ecological state of the ocean at different scales. Due to different life spans and radiometric characteristics of satellite sensors, there are often inconsistencies and gaps between the same quantities retrieved from different sensors. Data continuity and quality assurance are therefore necessary to provide sound and continuous satellite observations enabling time series studies (Mélin and Franz, 2014; Sathyendranath et al., 2019). As preparatory work for such a study aiming at long-term monitoring of PFTs in the vast Atlantic Ocean, we applied a straightforward inter-mission bias correction as a preliminary trial using overlapped PFT products between the three sets of satellite data. Validation using in situ data shows no significant biases of PFTs derived from different sensors, indicating that the inter-mission offset was effectively corrected. Retrievals of chl a of different PFTs are more upscaled products compared to bulk satellite OC products such as total chl a, colored dissolved organic matter (CDOM) and absorption properties. It is especially still challenging to accurately retrieve prokaryotic phytoplankton because in the open ocean these dominate in the low-chl a areas, where the satellite signals are weaker. Therefore, higher uncertainties exist in these products (e.g., Brewin et al., 2017; Losa et al., 2017; Xi et al., 2021) as compared to uncertainties for other PFTs (see Table 2). In summary, our statistical results of PFT validation are comparable to the evaluations of satellite PFT products derived from different approaches, according to the Quality Information Documents (QUID) that have been published by the Copernicus Marine Service (Pardo et al., 2020; Garnesson et al., 2022). It is noteworthy that the bias correction only targeted the Atlantic Ocean and might not be applicable to other ocean regions, which leads us to further explore a more generic method in the future for the global ocean. However, with these first investigations this study paves the way to promote satellite PFT products into long-term time series studies.
Satellite PFT products provide robust spatial distributions which are comparable to in situ data. The 20-year mean of the four PFTs has presented a trustworthy overview of how different PFTs vary and are distributed spatially in the surface layer of the Atlantic Ocean. Diatoms, haptophytes and dinoflagellates share similar geographic patterns, showing higher abundance at high latitudes and in coastal and equatorial upwelling regions, where the nutrient level is generally high, and minimum abundance in the gyres, especially for diatoms and dinoflagellates. Prokaryotes are more dominant in the gyres and at low latitudes but contribute much less to the total biomass at high latitudes. The findings are consistent with previous studies of phytoplankton group and size classes (e.g., Hirata et al., 2011; Brewin et al., 2015; Losa et al., 2017) and are justified in detail in Xi et al. (2020). More recent studies by Bracher et al. (2020) and Brotas et al. (2022) based on in situ observations have also revealed similar PFT latitudinal distribution to our satellite observations. Furthermore, Brotas et al. (2022) point out that dinoflagellates can be underestimated in the pigment approach, due to their pigment variability; some species do not have the diagnostic pigment peridinin, and there are several heterotrophic species where the pigments are absent or strongly reduced.
PFT time series of the last 2 decades are for the first time generated from multi-satellite observations. For the whole Atlantic Ocean, no significant trend was found for diatoms, haptophytes and dinoflagellates over the last 20 years, but a decline in prokaryotes was observed. However, the per-pixel trend maps revealed that regional trends are different from province to province, such as for diatoms; a significant decrease was found at latitudes above 40∘ and on the west coast of Africa (CNRY). This was similarly found for haptophytes as well. There is a clear shift for prokaryotes in 2012: from 2003 to 2012, the average value is higher (0.064 mg m−3), and the seasonality is clearly defined, whereas from 2013 to 2020, seasonal variations are softened, and the mean value is lower (0.053 mg m−3). The retreat of MERIS in 2012 should not influence the prokaryote data set very much for the following reasoning: firstly, such a decline was not found in other PFTs; secondly, MERIS observed more pixels on the coast and at high latitudes, whereas we focus on the open ocean and have excluded the coastal regions with bathymetry <200 m, and this study covers the Atlantic Ocean between 50∘ N to 50∘ S. The main reason might be the relatively lower retrieval accuracy of prokaryotes compared to other PFTs as discussed above in the validation. Our previous work showed that all of the retrieval models for the three sets of sensors have poorer performance for prokaryotic phytoplankton than for other PFT retrievals. This may cause weaker consistency of prokaryotes for the 2-decade period even after inter-mission correction. Nevertheless, coverage variability among different satellite missions should be taken into consideration in analyzing long-time-series studies as the ability of the sensors to observe certain waters may differ (van Oostende et al., 2022). These findings in terms of 20-year trends still need to be evaluated further with both in situ measurements and numerical models, though available matchup data between in situ and satellite data are very sparse, and disagreements between models and satellite observations also exist (Gregg and Rousseaux, 2014). Indeed, a period of 20 years is not considered to be long enough for a robust trend analysis as the decadal variability might be too dominant, and for the Atlantic Ocean on average at least 35 years is needed to detect a climate-driven trend in chlorophyll concentration as indicated in Henson et al. (2010, 2016). Nonetheless, the 20-year-long time series provides the opportunity to observe interesting patterns, such as the diatom increase during 2018–2019. Therefore, further investigation of biophysical interactions and linkage to climate is necessary to find evidence and interpret the findings extracted from PFT time series.
Phenology maps of the four PFTs correspond well with their mean annual cycles. Prokaryotes have distinct phenology compared to the other three PFTs, which present similar annual cycles and close bloom maxima time on a general scale despite haptophytes and dinoflagellates reaching biomass maxima a bit later than diatoms in some regions. This section has chooses only one coarse phenological index, the time of the maxima, using monthly satellite products, which has shown the capability of the Copernicus Marine Service satellite PFTs in revealing PFT shifting and growth state at a larger scale than traditional means that rely on extensive ship-based measurements and long-term monitoring stations (e.g., Bracher et al., 2020; Nöthig et al., 2020; Yang et al., 2020). More phenological indices, including the PFT growth duration, biomass amplitude and start and ending dates, could be considered using higher-temporal-resolution products to fully understand the patterns of and interannual variability in the PFT phenology (Soppa et al., 2016).
The PFT anomaly of 2021 compared to the 20-year mean reveals mostly a slight decrease in diatoms above 40∘ N/S (except for the southeastern part of NADR) and a significant increase in haptophytes in most areas of the high latitudes, which corresponds well with the hypothesis of “Atlantification” proposing that smaller phytoplankton are expanding to high latitudes (e.g., Nöthig et al., 2015; Neukermans et al., 2018; Oziel et al., 2020). A decline in silicate and nitrate concentrations might contribute to the decrease in diatoms in the North Atlantic as indicated in the Copernicus Ocean State Report 5 by von Schuckmann et al. (2021). In contrast to this, most changes in the Southern Ocean were found at latitudes higher than 40∘ S, which is the region of the Great Calcite Belt. Deppeler and Davidson (2017) pointed out that climate-induced changes such as higher temperature and shallow mixed-layer depth are expected to alter the structure and function of phytoplankton communities in the Southern Ocean. Diatoms and haptophytes as two major groups there may be severely subject to these changes. Interestingly, an increase in haptophytes and decrease in diatoms indicated that the phytoplankton community structure has been altered in recent years, which cannot be easily captured with observations other than satellite PFT time series.
In summary, this study illustrates the past and current PFT state in the Atlantic Ocean and acts as the first step to promote long-term PFT observations serving as ocean monitoring indicators (OMIs) implemented in the Copernicus Marine Service that enable time series analyses of PFT trends and interannual variability to reveal potential climate-induced changes in phytoplankton composition on multiple temporal and spatial scales.
Data and products used in this study, as well as their availabilities and documentations, are summarized in Table 1. In situ HPLC pigment and PFT data used for the validation of Copernicus Marine Service PFT products are available on PANGAEA (https://doi.org/10.1594/PANGAEA.954738; Xi et al., 2023).
HX, AB and AM conceptualized the study. HX designed and carried out the experiments. MB provided support in satellite products and matchup data extraction. VB, MG and IP contributed to in situ data compilation for validation. SNL and LMAA helped with data analysis. HX drafted and revised the manuscript with contributions from all co-authors.
The contact author has declared that none of the authors has any competing interests.
Publisher’s note: Copernicus Publications remains neutral with regard to jurisdictional claims in published maps and institutional affiliations.
We thank the European Union’s Horizon 2020 Research and Innovation Programme under grant agreement 810139 for the project Portugal Twinning for Innovation and Excellence in Marine Science and Earth Observation – PORTWIMS and the Copernicus Marine Service Evolution project GLOPHYTS (grant no. 21036L05B-COP-INNO SCI-9000) for funding. Copernicus Marine Service is implemented by Mercator Ocean International in the framework of a delegation agreement with the European Union. Astrid Bracher and Svetlana N. Losa were supported by the DFG (German Research Foundation) Transregional Collaborative Research Center ArctiC Amplication: Climate Relevant Atmospheric and SurfaCe Processes, and Feedback Mechanisms (AC)3 (Project C03, grant no. 268020496 – TRR 172) and by the ESA S5P+Innovation Theme 7 Ocean Colour (S5POC) project (grant no. 4000127533/19/I-NS). Svetlana N. Losa’s work was also partly made in the framework of the state assignment of the Federal Agency for Scientific Organizations (FASO) Russia (theme FMWE-2021-0014). The contribution by Leonardo M. A. Alvarado was supported by the Federal Ministry of Economics and Technology (BMWi) and German Aerospace Center (DLR) (grant no. 50EE1915) within the project TypSynSat. We also thank Gavin Tilstone (PML), Giorgio Dall’Olmo (OGS) and Robert Brewin (University of Exeter) for AMT28 and AMT29 pigment data. Thanks to NASA, ESA and EUMETSAT for the SeaWiFS, MODIS, VIIRS, MERIS and OLCI data and especially the ACRI-ST GlobColour team for providing OLCI and merged ocean colour L3 products. The captain, crew and expedition scientists are also acknowledged for their support during the expeditions. We finally thank Sorin Constantin and the other two anonymous reviewers who helped to improve this work by providing constructive comments.
This research has been supported by the H2020 European Research Council (grant no. 810139), European Commission (EC) (grant no. 21036L05B-COP-INNO SCI-9000), the Deutsche Forschungsgemeinschaft (grant no. 268020496), European Space Agency (grant no. 4000127533/19/I-NS-S5P+I-OC), Federal Agency for Scientific Organizations (FASO) Russia (grant no. FMWE-2021-0014), and Federal Ministry of Economics and Technology (BMWi) and German Aerospace Center (DLR) (grant no. 50EE1915).
This paper was edited by Marilaure Grégoire and reviewed by Sorin Constantin and two anonymous referees.
Aiken, J., Pradhan, Y., Barlow, R., Lavender, S., Poulton, A., Holligan, P., and Hardman-Mountford, N.: Phytoplankton pigments and functional types in the Atlantic Ocean: A decadal assessment, 1995–2005, Deep-Sea Res. Pt. II, 56, 899–917, https://doi.org/10.1016/j.dsr2.2008.09.017, 2009.
Alvarado, L. M. A., Soppa, M. A., Gege, P., Losa, S. N., Dröscher, I., Xi, H., and Bracher, A.: Retrievals of the main phytoplankton groups at Lake Constance using OLCI, DESIS, and evaluated with field observations, 12th EARSeL Workshop on Imaging Spectroscopy, Potsdam, Germany, 22–24 June 2022, https://elib.dlr.de/189789, 2022.
Amante, C. and Eakins, B. W.: ETOPO1 1 Arc-Minute Global Relief Model: Procedures, data sources and analysis, NOAA technical memorandum NESDIS NGDC-24, National Geophysical Data Center, NOAA [data set], https://doi.org/10.7289/V5C8276M, 2009.
Antoine, D., Morel, A., Gordon, H. R., Banzon, V. F., and Evans, R. H.: Bridging ocean color observations of the 1980s and 2000s in search of long-term trends, J. Geophys. Res.-Oceans, 110, C06009, https://doi.org/10.1029/2004JC002620, 2005.
Behrenfeld, M. J., O'Malley R. T., Boss, E. S., Westberry, T. K., Graff, J. R., Halsey, K. H., Milligan, A. J., Siegel, D. A., and Brown, M. B.: Revaluating ocean warming impacts on global phytoplankton, Nat. Clim. Change, 6, 3223–3330, https://doi.org/10.1038/nclimate2838, 2016.
Bindoff, N. L., Cheung, W. W. L., Kairo, J. G., Arístegui, J., Guinder, V. A., Hallberg, R., Hilmi, N., Jiao, N., Karim, M. S., Levin, L., O'Donoghue, S., Purca Cuicapusa, S. R., Rinkevich, B., Suga, T., Tagliabue, A., and Williamson, P.: Changing Ocean, Marine Ecosystems, and Dependent Communities, in: IPCC Special Report on the Ocean and Cryosphere in a Changing Climate, edited by: Pörtner, H.-O., Roberts, D. C., Masson-Delmotte, V., Zhai, P, Tignor, M., Poloczanska, E., Mintenbeck, K., Alegría, A., Nicolai, M., Okem, A., Petzold, J., Rama, B., and Weyer, N. M., Cambridge University Press, Cambridge, UK and New York, NY, USA, 447–587, https://doi.org/10.1017/9781009157964.007, 2019.
Bolaños, L. M., Karp-Boss, L., Choi, C. J., Worden, A. Z., Graff., J. R., Haëntjens, N., Chase, A. P., Della Penna, A., Gaube, P., Morison, F., Menden-Deuer, S., Westberry, T. K., O'Malley, R. T., Boss, E., Behrenfeld, M. J., and Glovannoni, S. J.: Small phytoplankton dominate western North Atlantic biomass, The ISME Journal, 14, 1663–1674, https://doi.org/10.1038/s41396-020-0636-0, 2020.
Bracher, A., Bouman, H. A., Brewin, R. J. W., Bricaud, A., Brotas, V., Ciotti, A. M., Clementson, L., Devred, E., Di Cicco, A., Dutkiewicz, S., Hardman-Mountford, N. J., Hickman, A. E., Hieronymi, M., Hirata, T., Losa, S. N., Mouw, C. B., Organelli, E., Raitsos, D. E., Uitz, J., Vogt, M., and Wolanin, A.: Obtaining phytoplankton diversity from ocean color: a scientific roadmap for future development, Front. Mar. Sci., 4, 1–15, https://doi.org/10.3389/fmars.2017.00055, 2017.
Bracher, A., Xi, H., Dinter, T., Mangin, A., Strass, V. H., von Appen, W.-J., and Wiegmann, S.: High resolution water column phytoplankton composition across the Atlantic Ocean from ship-towed vertical undulating radiometry, Front. Mar. Sci., 7, 235, https://doi.org/10.3389/fmars.2020.00235, 2020.
Bracher, A., Brewin, R. J. W., Ciotti, A. M., Clementson, L. A., Hirata, T., Kostadinov, T., Mouw, C. B., and Organelli, E.: Applications of satellite remote sensing technology to the analysis of phytoplankton community structure on large scales, in: Advances in Phytoplankton Ecology, edited by: Clementson, L. A., Eriksen, R. S., and Willis, A., Elsevier, 217–244, https://doi.org/10.1016/B978-0-12-822861-6.00015-7, 2022.
Brewin, R. J. W., Sathyendranath, S., Jackson, T., Barlow, R., Brotas, V., Airs, R., and Lamont, T.: Influence of light in the mixed-layer on the parameters of a three-component model of phytoplankton size class, Remote Sens. Environ., 168, 437–450, https://doi.org/10.1016/j.rse.2015.07.004, 2015.
Brewin, R. J. W., Tilstone, G. H., Jackson, T., Cain, T., Miller, P. I., Lange, P. K., Misra, A., and Airs, R. L.: Modelling size-fractionated primary production in the Atlantic Ocean from remote sensing, Prog. Oceanogr., 158, 130–149, https://doi.org/10.1016/j.pocean.2017.02.002, 2017.
Brotas, V., Brewin, R. J. W., Sa, C., Brito, A. C., Silva, A., Mendes, C. R., Diniz, T., Kaufmann, M., Tarran, G., Groom, S. B., Platt, T., and Sathyendranath, S.: Deriving phytoplankton size classes from satellite data: Validation along a trophic gradient in the eastern Atlantic Ocean, Remote Sens. Environ., 134, 66–77, https://doi.org/10.1016/j.rse.2013.02.013, 2013.
Brotas, V., Tarran, G. A., Veloso, V., Brewin, R. J. W., Woodward, E. M. S., Airs, R., Beltran, C., Ferreira, A., and Groom, S. B.: Complementary Approaches to Assess Phytoplankton Groups and Size Classes on a Long Transect in the Atlantic Ocean, Front. Mar. Sci., 8, 682621, https://doi.org/10.3389/fmars.2021.682621, 2022.
Colella, S., Böhm, E., Cesarini, C., Garnesson, P., Netting, J., and Calton, B.: EU Copernicus Marine Service Product User Manual for Ocean Colour Products, Issue 3.0, Mercator Ocean International, https://catalogue.marine.copernicus.eu/documents/PUM/CMEMS-OC-PUM.pdf (last access: 22 March 2023), 2022.
Deppeler, S. L. and Davidson, A. T.: Southern Ocean Phytoplankton in a Changing Climate, Front. Mar. Sci., 4, 40, https://doi.org/10.3389/fmars.2017.00040, 2017.
EU Copernicus Marine Service Product: Global Ocean Colour (Copernicus-GlobColour), Bio-Geo-Chemical, L4 (monthly and interpolated) from Satellite Observations (1997-ongoing), Mercator Ocean International [data set], https://doi.org/10.48670/moi-00281, 2022.
Flanders Marine Institute: Longhurst Provinces, Marine Regions, Flanders Marine Institute [data set], https://www.marineregions.org/sources.php#longhurst (last access: 5 May 2022), 2009.
Flombaum, P., Gallegos, J. L., Gordillo, R. A., Rincon, J., Zabala, L. L., Jiao, N., Karl, D. M., Li, W. K. W., Lomas, M. W., Veneziano, D., Vera, C. S., Vrugt, J. A., and Martiny, A. C.: Present and future global distributions of the marine Cyanobacteria Prochlorococcus and Synechococcus, P. Natl. Acad. Sci. USA, 110, 9824–9829, https://doi.org/10.1073/pnas.1307701110, 2013.
Garnesson, P., Mangin, A., Bretagnon, M., and Jutard, Q.: EU Copernicus Marine Service Quality Information Document (QUID) for OC TAC Products OCEANCOLOUR OBSERVATIONS GlobColour, Issue 3.0, Mercator Ocean International, https://catalogue.marine.copernicus.eu/documents/QUID/CMEMS-OC-QUID-009-101to104-111-113-116-118.pdf (last access: 22 March 2023), 2022.
Gregg, W. W. and Rousseaux, C. S.: Decadal trends in global pelagic ocean chlorophyll: A new assessment integrating multiple satellites, in situ data, and models, J. Geophys. Res.-Oceans, 119, 5921–5933, https://doi.org/10.1002/2014JC010158, 2014.
Gruber, N.: Warming up, turning sour, losing breath: Ocean biogeochemistry under global change, Philos. T. Roy. Soc. A, 369, 1980–1996, https://doi.org/10.1098/rsta.2011.0003, 2011.
Gruber, N., Boyd, P. W., Frölicher T. L., and Vogt, M.: Biogeochemical extremes and compound events in the ocean, Nature, 600, 395–407, https://doi.org/10.1038/s41586-021-03981-7, 2021.
Head, E. J. H. and Pepin, P.: Monitoring changes in phytoplankton abundance and composition in the Northwest Atlantic: a comparison of results obtained by continuous plankton recorder sampling and colour satellite imagery, J. Plankton Res., 32, 1649–1660, https://doi.org/10.1093/plankt/fbq120, 2010.
Henson, S. A., Sarmiento, J. L., Dunne, J. P., Bopp, L., Lima, I., Doney, S. C., John, J., and Beaulieu, C.: Detection of anthropogenic climate change in satellite records of ocean chlorophyll and productivity, Biogeosciences, 7, 621–640, https://doi.org/10.5194/bg-7-621-2010, 2010.
Henson, S. A., Beaulieu, C., and Lampitt, R.: Observing climate change trends in ocean biogeochemistry: when and where, Glob. Change Biol., 22, 1561–1571, https://doi.org/10.1111/gcb.13152, 2016.
Hirata, T., Hardman-Mountford, N. J., Brewin, R. J. W., Aiken, J., Barlow, R., Suzuki, K., Isada, T., Howell, E., Hashioka, T., Noguchi-Aita, M., and Yamanaka, Y.: Synoptic relationships between surface Chlorophyll-a and diagnostic pigments specific to phytoplankton functional types, Biogeosciences, 8, 311–327, https://doi.org/10.5194/bg-8-311-2011, 2011.
IOCCG: Phytoplankton Functional Types from Space, in: Reports of International Ocean Colour Coordinating Group (IOCCG), Report Number 15, edited by: Sathyendranath, S., IOCCG, Dartmouth, Nova Scotia, Canada, 154 pp., https://doi.org/10.25607/OBP-106, 2014.
Jackson, T.: ESA Ocean Colour Climate Change Initiative – Phase 3 Product, User Guide for v5.0 Dataset, Issue 1.0, ESA/ESRIN, https://docs.pml.space/share/s/okB2fOuPT7Cj2r4C5sppDg (last access: 30 March 2023), 2020.
Käse, L. and Geuer, J. K.: Phytoplankton Responses to Marine Climate Change – An Introduction, in: YOUMARES 8 – Oceans Across Boundaries: Learning from each other, edited by: Jungblut, S., Liebich, V., and Bode B., SpringerOpen, Cham, Switzerland, 55–71, https://doi.org/10.1007/978-3-319-93284-2, 2018.
Kulk, G., Platt, T., Dingle, J., Jackson, T., Jönsson, B. F., Bouman, H. A., Babin, M., Brewin, R. J. W., Doblin, M., Estrada, M., Figueiras, F. G., Furuya, K., González-Benítez, N., Gudfinnsson, H. G., Gudmundsson, K., Huang, B., Isada, T., Kovac, Z., Lutz, V. A., Maranon, E., Raman, M., Richardson, K., Rozema, P. D., van de Poll, W. H., Segura, V., Tilstone, G. H., Uitz, J., van Dongen-Vogels, V., Yoshikawa, T., and Sathyendranath, S.: Primary Production, an Index of Climate Change in the Ocean: Satellite-Based Estimates over Two Decades, Remote Sens.-Basel, 12, 826, https://doi.org/10.3390/rs12050826, 2020.
Lange, P. K., Werdell, P. J., Erickson, Z. K., Dall'Olmo, G., Brewin, R. J. W., Zubkov, M. V., Tarran, G. A., Bouman, H. A., Slade, W. H., Craig, S. E., Poulton, N. J., Bracher, A., Lomas, M. W., and Cetinić, I.: Radiometric approach for the detection of picophytoplankton assemblages across oceanic fronts, Opt. Express, 28, 25682–25705, https://doi.org/10.1364/OE.398127, 2020.
Longhurst, A. R.: Ecological Geography of the Sea, Academic Press, Cambridge, Massachusetts, U.S.A., 542 pp., https://doi.org/10.1016/B978-0-12-455521-1.X5000-1, 2007.
Losa, S. N., Soppa, M. A., Dinter, T., Wolanin, A., Brewin, R. J. W., Bricaud, A., Oelker, J., Peeken, I., Gentili, B., Rozanov, V., and Bracher, A.: Synergistic Exploitation of Hyper- and Multi-Spectral Precursor Sentinel Measurements to Determine Phytoplankton Functional Types (SynSenPFT), Front. Mar. Sci., 4, 1–22, https://doi.org/10.3389/fmars.2017.00203, 2017.
McClain, C. R.: A decade of satellite ocean color observations, Annu. Rev. Mar. Sci., 1, 19–42, https://doi.org/10.1146/annurev.marine.010908.163650, 2009.
Mélin, F. and Franz, B. A.: Chapter 6.1 – Assessment of satellite ocean colour radiometry and derived geophysical products, Experimental Methods in the Physical Sciences, 47, 609–638, https://doi.org/10.1016/B978-0-12-417011-7.00020-9, 2014.
Moisan, T. A., Rufty, K. M., Moisan, J. R., and Linkswiler, M. A.: Satellite Observations of Phytoplankton Functional Type Spatial Distributions, Phenology, Diversity, and Ecotones, Front. Mar. Sci., 4, 189, https://doi.org/10.3389/fmars.2017.00189, 2017.
Neukermans, G., Oziel, L., and Babin, M.: Increased intrusion of warming Atlantic water leads to rapid expansion of temperate phytoplankton in the Arctic, Glob. Change Biol., 24, 2545–2553, https://doi.org/10.1111/gcb.14075, 2018.
Nöthig, E. M., Bracher, A., Engel, A., Metfies, K., Niehoff, B., Peeken, I., Bauerfeind, E., Cherkasheva, A., Gäbler-Schwarz, S., Hardge, K., Kilias, E., Kraft, A., Kidane, Y. M., Lalande, C., Piontek, J., Thomisch, K., and Wurst, M.: Summertime plankton ecology in Fram Strait – a compilation of long- and short-term observations, Polar Res., 34, 23349, https://doi.org/10.3402/polar.v34.23349, 2015.
Nöthig, E. M., Ramondenc, S., Haas, A., Hehemann, L., Walter, A., Bracher, A., Lalande, C., Metfies, K., Peeken, I., Bauerfeind, E., and Boetius, A.: Summertime Chlorophyll a and Particulate Organic Carbon Standing Stocks in Surface Waters of the Fram Strait and the Arctic Ocean (1991–2015), Front. Mar. Sci., 7, 350, https://doi.org/10.3389/fmars.2020.00350, 2020.
Oziel, L., Baudena, A., Ardyna, M., Massicotte, P., Randelhoff, A., Sallée, J.-B., Ingvaldsen, R. B., Devred, E., and Babin, M.: Faster Atlantic currents drive poleward expansion of temperate phytoplankton in the Arctic Ocean, Nat. Commun., 11, 1705, https://doi.org/10.1038/s41467-020-15485-5, 2020.
Pardo, S., Jackson, T., Taylor, B., Netting, J., Calton, B., and Howey, B.: EU Copernicus Marine Service Quality Information Document (QUID) for OC TAC Products – Atlantic and Arctic Observation Products, Issue 2.2, Mercator Ocean International, https://catalogue.marine.copernicus.eu/documents/QUID/CMEMS-OC-QUID-009-066-067-068-069-088-091.pdf (last access: 22 March 2022), 2020.
Quéré, C. L., Harrison, S. P., Colin Prentice, I., Buitenhuis, E. T., Aumont, O., Bopp, L., Claustre, H., Cotrim Da Cunha, L., Geider, R., Giraud, X., Klaas, C., Kohfeld, K. E., Legendre, L., Manizza, M., Platt, T., Rivkin, R. B., Sathyendranath, S., Uitz, J., Watson, A. J., and Wolf-Gladrow, D.: Ecosystem dynamics based on plankton functional types for global ocean biogeochemistry models, Glob. Change Biol., 11, 2016–2040, https://doi.org/10.1111/j.1365-2486.2005.1004.x, 2005.
Reyes-Prieto, A., Yoon, H. S., and Bhattacharya, D.: Marine Algal Genomics and Evolution, in: Encyclopedia of Ocean Sciences, 2nd edn., edited by: Steele, J. H., Academic Press, 552–559, https://doi.org/10.1016/B978-012374473-9.00779-7, 2009.
Sathyendranath, S., Brewin, R. J. W., Brockmann, C., Brotas, V., Calton, B., Chuprin, A., Cipollini, P., Couto, A. B., Dingle, J., Doerffer, R., Donlon, C., Dowell, M., Farman, A., Grant, M., Groom, S., Horseman, A., Jackson, T., Krasemann, H., Lavender, S., Martinez-Vicente, V., Mazeran, C., Mélin, F., Moore, T. S., Müller, D., Regner, P., Roy, S., Steele, C., Steinmetz, F., Swinton, J., Taberner, M., Thompson, A., Valente, A., Zühlke, M., Brando, V. E., Feng, H., Feldman, G., Franz, B. A., Frouin, R., Gould, R. W., Hooker, S. B., Kahru, M., Kratzer, S., Mitchell, B. G., Muller-Karger, F. E., Sosik, H. M., Voss, K. J., Werdell, J., and Platt, T.: An ocean-colour time series for use in climate studies: The experience of the Ocean-Colour Climate Change Initiative (OC-CCI), Sensors, 19, 4285, https://doi.org/10.3390/s19194285, 2019.
Soppa, M. A., Völker, C., and Bracher, A.: Diatom Phenology in the Southern Ocean: Mean Patterns, Trends and the Role of Climate Oscillations, Remote Sens.-Basel, 8, 420, https://doi.org/10.3390/rs8050420, 2016.
Uitz, J., Claustre, H., Morel, A., and Hooker, S. B.: Vertical distribution of phytoplankton communities in open ocean: An assessment based on surface chlorophyll, J. Geophys. Res.-Oceans, 111, C08005, https://doi.org/10.1029/2005JC003207, 2006.
van Oostende, M., Hieronymi, M., Krasemann, H., Baschek, B., and Röttgers, R.: Correction of inter-mission inconsistencies in merged ocean colour satellite data, Front. Remote Sens., 3, 1–17, https://doi.org/10.3389/frsen.2022.882418, 2022.
Vidussi, F., Claustre, H., Manca, B. B., Luchetta, A., and Marty, J.-C.: Phytoplankton pigment distribution in relation to upper thermocline circulation in the eastern Mediterranean Sea during winter, J. Geophys. Res.-Oceans, 106, 19939–19956, https://doi.org/10.1029/1999JC000308, 2001.
von Schuckmann, K., Le Traon, P.., Smith, N., Pascual, N., Samuel Djavidnia, S., Gattuso, J., and Grégoire, M. (Eds.): Copernicus Marine Service Ocean State Report, Issue 5 Supplement, J. Oper. Oceanogr., 14, 1–185, https://doi.org/10.1080/1755876X.2021.1946240, 2021.
Xi, H., Losa, S. N., Mangin, A., Soppa, M. A., Garnesson, P., Demaria, J., Liu, Y., d'Andon, O. H. F., and Bracher, A.: A global retrieval algorithm of phytoplankton functional types: Towards the applications to CMEMS GlobColour merged products and OLCI data, Remote Sens. Environ., 240, 111704, https://doi.org/10.1016/j.rse.2020.111704?, 2020.
Xi, H., Losa, S. N., Mangin, A., Garnesson, P., Bretagnon, M., Demaria, J., Soppa, M. A., d'Andon, O. H. F., and Bracher, A.: Global chlorophyll a concentrations of phytoplankton functional types with detailed uncertainty assessment using multi-sensor ocean color and sea surface temperature satellite products, J. Geophys. Res.-Oceans, 126, e2020JC017127, https://doi.org/10.1029/2020JC017127, 2021.
Xi, H., Peeken, I., Gomes, M., Brotas, V., Tilstone, G., Brewin, R. J. W., Dall'Olmo, G., Tracana, A., Alvarado, L. M. A., Murawski, S., Wiegmann, S., and Bracher, A.: Phytoplankton pigment concentrations and phytoplankton groups measured on water samples collected from various expeditions in the Atlantic Ocean from 71∘ S to 84∘ N, PANGAEA [data set], https://doi.org/10.1594/PANGAEA.954738, 2023.
Yang, B., Boss, E. S., Haëntjens, N., Long, M. C., Behrenfeld, M. J., Eveleth, R., and Doney, S. C.: Phytoplankton phenology in the North Atlantic: Insights from profiling float measurements, Front. Mar. Sci., 7, 139, https://doi.org/10.3389/fmars.2020.00139, 2020.