the Creative Commons Attribution 4.0 License.
the Creative Commons Attribution 4.0 License.
 | 27 Sep 2023 | OSR7 | Chapter 1.2
Evaluation of operational ocean forecasting systems from the perspective of the users and the experts
Stefania A. Ciliberti
Enrique Alvarez Fanjul
Jay Pearlman
Kirsten Wilmer-Becker
Pierre Bahurel
Fabrice Ardhuin
Alain Arnaud
Mike Bell
Segolene Berthou
Laurent Bertino
Arthur Capet
Eric Chassignet
Stefano Ciavatta
Mauro Cirano
Emanuela Clementi
Gianpiero Cossarini
Gianpaolo Coro
Stuart Corney
Fraser Davidson
Marie Drevillon
Yann Drillet
Renaud Dussurget
Ghada El Serafy
Katja Fennel
Marcos Garcia Sotillo
Patrick Heimbach
Fabrice Hernandez
Patrick Hogan
Ibrahim Hoteit
Sudheer Joseph
Simon Josey
Pierre-Yves Le Traon
Simone Libralato
Marco Mancini
Pascal Matte
Angelique Melet
Yasumasa Miyazawa
Andrew M. Moore
Antonio Novellino
Andrew Porter
Heather Regan
Laia Romero
Andreas Schiller
John Siddorn
Joanna Staneva
Cecile Thomas-Courcoux
Marina Tonani
Jose Maria Garcia-Valdecasas
Jennifer Veitch
Karina von Schuckmann
Liying Wan
John Wilkin
Romane Zufic
- Article
(1446 KB) - Full-text XML
- BibTeX
- EndNote


The Intergovernmental Oceanographic Commission (IOC) has an Ocean Decade Implementation Plan (UNESCO-IOC, 2021) that states seven outcomes required for the ocean we want, with the fourth outcome being “A predicted ocean where society understands and can respond to changing ocean conditions.” To facilitate the achievement of this goal, the IOC has endorsed Mercator Ocean International to implement the Decade Collaborative Center (DCC) for OceanPrediction (https://www.mercator-ocean.eu/oceanprediction/, last access: 21 August 2023), which is a cross-cutting structure that will work to develop global-scale collaboration between Decade Actions related to ocean prediction.
To have a predicted ocean, the OceanPrediction DCC understands that is critical to co-design ocean forecasting architecture that will permit different services to deliver as one and that could take advantage of the concept of digital twinning (European Union, 2022). This architecture will be designed to overcome the present-day limitations of our systems in terms of interoperability and tools sharing. This will translate into a new scenario for ocean forecasting, where more robust systems will be easier to implement thanks to a common set of agreed tools, standards, and best practices. This new architecture will serve as inspiration for the development targets of the different decadal actions related to ocean forecasting, such as ForeSea (https://oceanpredict.org/un-decade-of-ocean-science/foresea/, last access: 21 August 2023), DITTO (https://ditto-oceandecade.org/, last access: 21 August 2023), CoastPredict (https://www.coastpredict.org/, last access: 21 August 2023), Global Environment Monitoring System for the Ocean and Coasts (GEMS Ocean (https://www.unep.org/explore-topics/oceans-seas/what-we-do/ocean-and-coastal-observations, last access: 21 August 2023)), Ocean Best Practices (https://www.oceanbestpractices.org/, last access: 21 August 2023), and others.
To develop this architecture, the OceanPrediction DCC has implemented the Ocean Forecasting Co-Design Team (OFCT), which is composed of 43 international experts on all of the different aspects of the ocean forecasting value chain. The first task of this group is to analyze the present status of ocean forecasting at a global level, in order to properly identify the existing gaps before moving into the design phase.
One of the first steps in this process has been to explore the degree of satisfaction of both users and experts with respect to the existing ocean forecasting systems. This has been done by launching a series of surveys among the members of the OFCT and another one among the users of the forecasting services. This paper describes the findings derived from the analysis of these surveys. Section 2 introduces the surveys, while Sect. 3 presents the results. Section 4 establishes a discussion and identifies some conclusions as part of the outlook for future exploitation.
This work is based on the analysis of a series of surveys. Polls have been designed to champion specific categories – namely, experts and end-users – in order to provide a score for each type of application (e.g., from ports, coastal engineering and disaster risk reduction to ecosystem health) and for each type of Essential Ocean Variable (EOV) used (The Expert Team on Operational Ocean Forecasting System, 2022; e.g., a reference list of the key EOVs per ocean universe in blue, green, and white has been provided), focusing on some specific Operational Ocean Forecasting Systems (OOFS) which have properties that are related to their availability and quality (including the timeliness, reliability, and accessibility).
A first set of two surveys (named diagnosis and applications) has been designed for the experts participating in the OFCT, with the main purpose being obtaining a highly skilled subjective view on the availability and quality of today's OOFS at different spatial scales, ranging from global to coastal.
The diagnosis poll focuses on addressing the evaluation of a nowcast and a short-/middle-term forecast (up to 10 d) to solve a proposed list of EOVs such as currents, sea level, or groups of EOVs that are generically related to ice, waves, biochemistry, and biological variables. The question to be answered was as follows: “Qualify, based on your knowledge and experience, from 1 (not satisfied) to 10 (extremely satisfied), our ability to provide a solution at each spatial scale (global, regional and coastal).” The evaluation is driven by four main OOFS properties, namely existence, quality, accessibility, and timeliness, that are defined as follows: existence refers to the availability of sufficient OOFS at the required scale; quality certifies that delivered product/service consistently functions well and provides useful results; accessibility, as defined by Information Technology Infrastructure Library (ITIL, 2023), is considered to be the process of granting the right to use a service; and timeliness refers to the expected time needed to access a product/service. Timeliness can be measured as the time between when information is expected and when it is readily available for use.
The applications poll complements the diagnosis one by gathering the experts' indications on which EOV is useful for serving a specific proposed list of applications that spans from coastal management, ports, energy, navigation, and marine and ecosystem health to disaster risk reduction and aquaculture.
A third poll has been designed for end-users of ocean forecasting services. The objective is to explore the satisfaction level perception with respect to what today's OOFS offer. The survey has been disseminated through several channels, including the OceanPrediction DCC community, Ocean Predict (https://oceanpredict.org/, last access: 25 August 2023), Global Ocean Observing System (GOOS), and others. As with the diagnosis poll, the end-users' survey focuses on a specific list of EOVs (e.g., currents, sea level, temperature, salinity, waves, ice variables, and biochemical and biological variables) analyzed according to specific OOFS properties (e.g., quality, reliability, timeliness, accessibility, and usability).
Note that the questions on the polls for users and experts are not the same. For example, we consider that the differentiation between OOFS spatial scales does not make sense to the users. The methodology employed, based on polls, does not pretend to be mathematically precise, but it is providing significant results on the perception on the status of OOFS, both from the perspective of users and developers, making it therefore a valuable reference for the identification of gaps that will be carried out by the OFCT during a second step.
3.1 Experts survey: analysis of the results
All of the 43 OFCT experts have been invited to complete the diagnosis poll. An analysis of the provided rating values per EOV is given in Fig. 1.
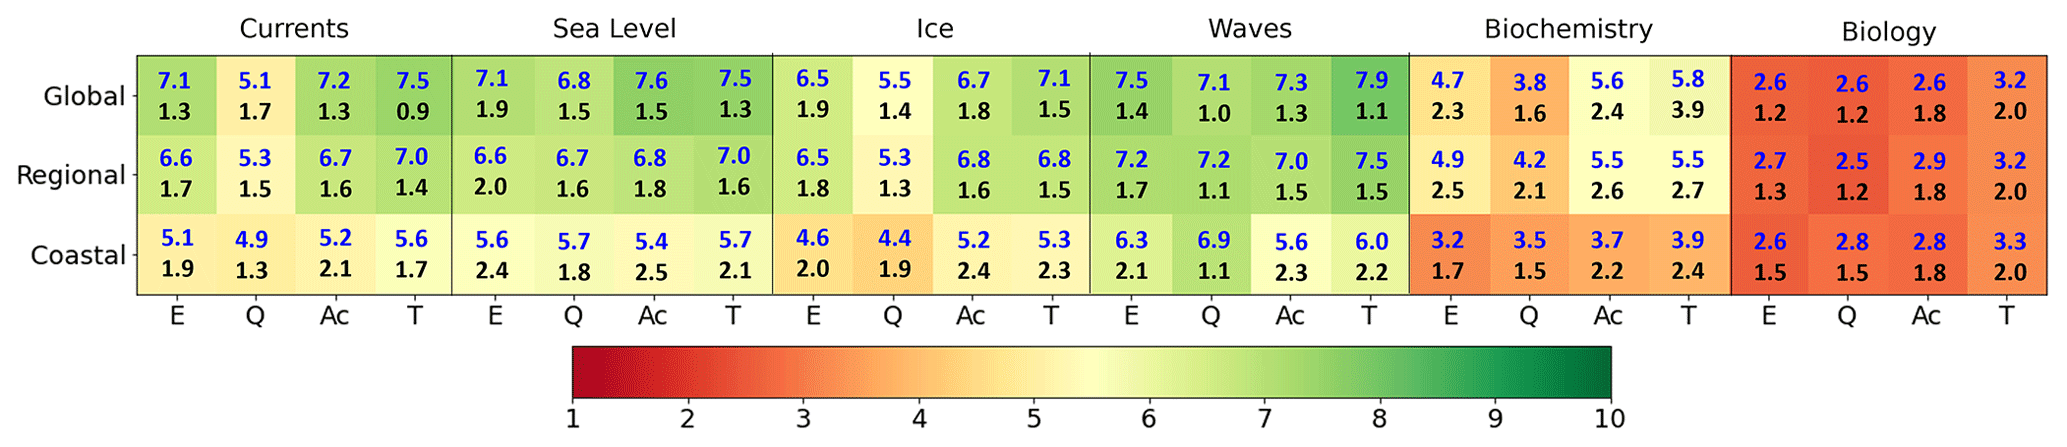
Figure 1The experts' average rates (in blue) and standard deviations (in black) per OOFS property (E is for existence, Q is for quality, Ac is for accessibility, and T is for timeliness), considering a proposed list of EOVs (e.g., currents, sea level, ice, waves, biochemistry, and biology) at a given scale (e.g., global, regional, and coastal). The color scale corresponds to mean values.
For analyses, based on the scale of 1–10, the ratings were grouped into very satisfied (8–10), satisfied (6 to 8), moderately satisfied (4 to 6), unsatisfied (2–4), and very unsatisfied (0–2). The analysis reveals that experts are satisfied about the performances of blue and white ocean variables at global and regional scales (rates from 6.5 to 8, except for quality, with respect to currents and ice, which has a mean rating of 5.3). For the same variable, at coastal scale the degree of satisfaction is only moderate, with mean rates spanning from about 4.5 to 5.7. Wave forecasting is particularly well located on the rating scale, as mean rates above 7.0 are given for all OOFS properties, with maximum value of 7.9 for timeliness at global scale. When considering the coastal scale, the rates are above 6.0.
Considering green ocean variables, the values in Fig. 1 are clearly lower (from slightly satisfied to not satisfied at all), indicating a poor level of appreciation for biogeochemical solutions and a very poor one for systems dealing with biological forecasts (quality values around 2.6).
The analyzed results reveal also that standard deviation from the mean is particularly higher if the EOVs are evaluated per each OOFS type at the coastal scale (values higher than 2.0), reflecting that the experts provided a wide range of ratings with respect to the OOFS capabilities. The only exception is given by waves, whose quality has been positively evaluated (mean rates about 7.0 with a standard deviation of 1.1).
The applications poll results are summarized in Fig. 2, which shows the aggregation of the answers given by experts from a global to coastal scale, mapping the need for specific EOVs to serve a target application. From a qualitative point of view, the panels show that a wide range of EOVs are requested and that the demand increases with the resolution and proximity to the coast. There is quite a consensus as green ocean variables are considered to be very important for applications like fisheries, aquaculture, and water quality (Fig. 2b–c). It is in fact quite striking that at a coastal scale almost all EOVs or families of EOVs are used for almost the vast majority of applications, demonstrating the relevance and the need for high-resolution ocean forecasting services.
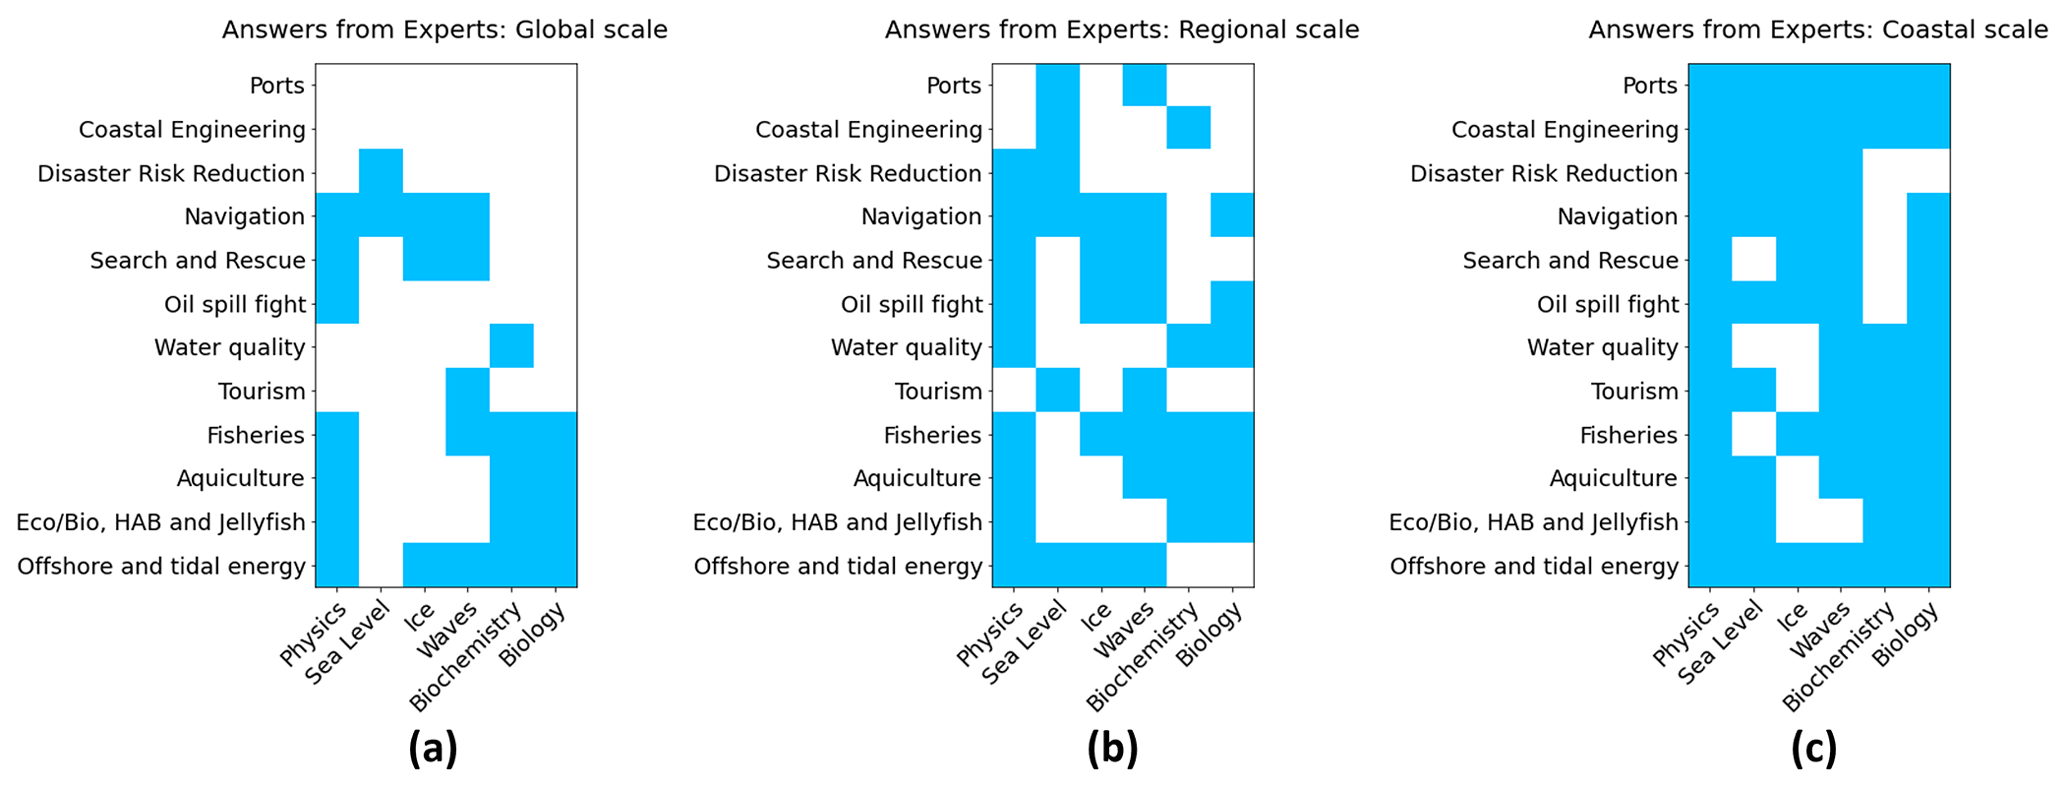
Figure 2Schematic overview of survey outcomes related to the needs of different EOVs (x axis) for each application area (y axis) at (a) global, (b) regional, and (c) coastal scales.
3.2 End-user survey: analysis of the results
A total of 164 responses were received from end-users working on all continents and have been evaluated; 70 % of them belong to public institutions, while 25.6 % are from private companies. These percentages are close to the ones corresponding to end-users downloading data from the Copernicus Marine Data Store (Le Traon et al., 2019). Figure 3 gives a comprehensive overview of end-user feedback by showing the absolute number of detected uses of EOVs in the different applications. Currents and sea level variables are the most demanded variables for applications related to coastal management and disaster risk reduction (entries higher than 10 for each considered application), and temperature has major impact on applications that refer to fisheries, aquaculture, ecological and biological uses (entries at around 10 for each application and up to 15 for the fisheries one), together with biochemical and biological variables (entries lower than 10). Almost all of the proposed applications gain direct benefits from the waves products. Lower entries are found for ice variables, mainly supporting navigation applications, and for salinity.
As done with the expert survey, a map providing an evaluation of OOFS properties with respect to a subset of EOV is shown in Fig. 4, which displays the mean values and the associated standard deviation. It shows a general and positive level of perception of the overall OOFS capacity for providing products – as demonstrated by mean rates that are generally above 7 for timeliness, accessibility, and usability. Figure 4 reveals that, in contrast with the experts' opinion, biogeochemical and biological variables are well appreciated, with score values ranging from 6 to 8. It is interesting to note that the temperature score is around 6.5, despite currents having an average score between 7.5 and 8. Waves variables are also well positioned, with an average score above 7.5. Looking at all quality values, mean scores span from 6.5 to 7, with standard deviations lower than 2.0. This analysis confirms that more than 90 % of the end-users are satisfied with today's OOFS products.
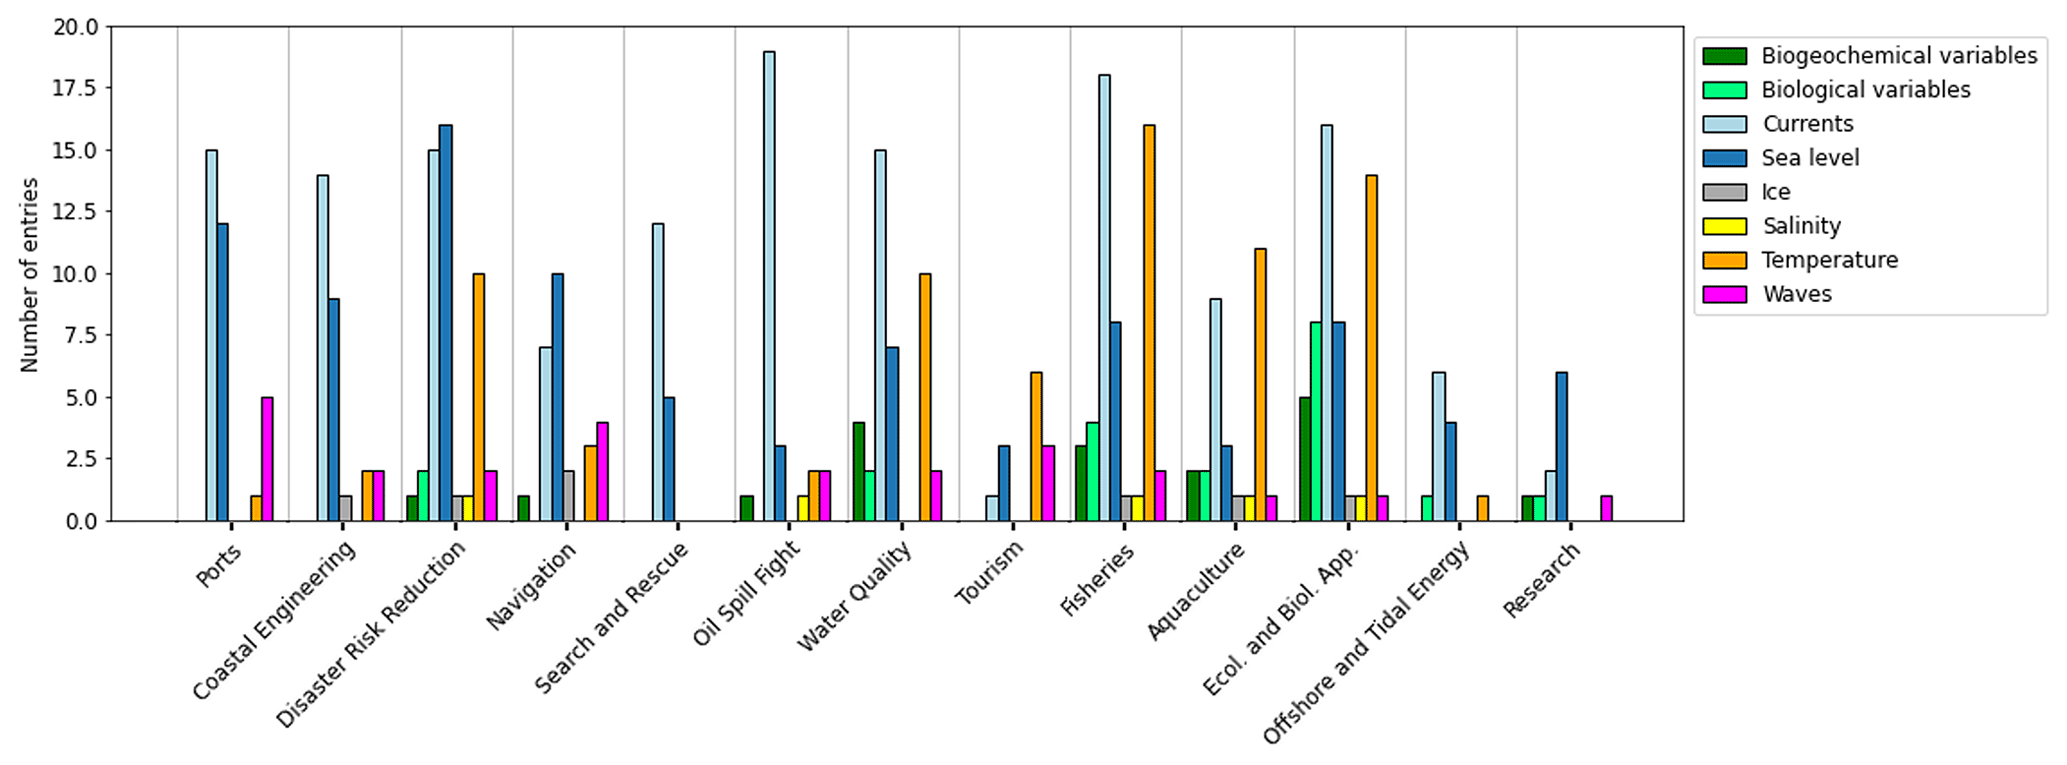
Figure 3Histogram of the survey outcomes related to end-users' answers, considering different EOVs (colors) being employed at each application area (x axis).
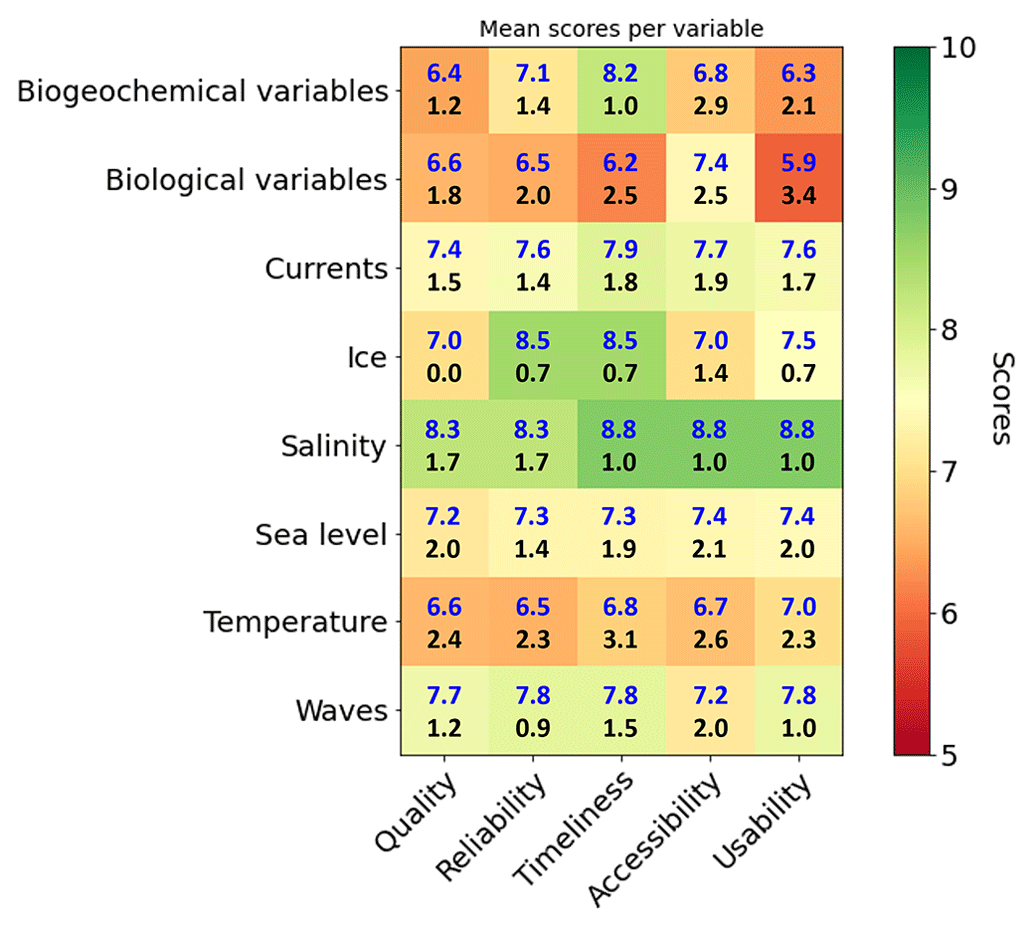
Figure 4Mean values (in blue) and standard deviations (in black) of the end-users' evaluation of the Operational Ocean Forecasting Services (OOFS; e.g., quality, reliability, timeliness, accessibility, and usability), when considering a proposed list of EOVs (e.g., biogeochemical and biological variables, currents, ice, salinity, sea level, temperature, and waves). The color scale corresponds to the mean values. See the text for more details on the scoring.
Maybe the most unexpected and surprising result of this exercise is the large difference existing in the perception between users and experts. While users are always quite satisfied with the systems, experts are generally more critical, especially regarding those services related to the green ocean. These different perceptions are probably due to several factors. Experts are considering the quality by validating with observations, a process that can be more severe than the users' perception, which is based on application experience. On top of that, and probably more importantly, an approximate indication of the value of an EOV could be more than sufficient to allow the satisfactory practical use of a system. For example, a port pilot could be satisfied by knowing if wave heights will or will not be over a given threshold, but they are not affected if the waves have one value or another over that threshold because operations will be canceled independent of how much the variable is exceeding the threshold. On top of that, the experts know where to look to find the problems in the systems, and they do so by scrutinizing all variables, oceanographic situations, and geographical regions of the domain of the system, while the end-users commonly have a perspective limited into one particular aspect of the service. When the range of processes and results under scrutiny is larger, it is to be expected that more mishaps can be found.
To the trained eye, the evaluation of the experts is not surprising. It clearly shows that wave and sea level forecasting systems are quite mature and that more effort must be made with respect to the green ocean, probably at all points of the value chain, from observations to downstream services. Also, the progressive degradation of the system's performance as we come closer to the coast is obvious. This is most likely due to several factors that can be present on some occasions, such as the lack of an appropriate resolution, poor atmospheric forcing at that scale, the lack of river data, and the complexity and importance of the nonlinear effect and interactions between EOVs near the coast. Take, for example, a sea level that has a striking low mean quality value of only 5.7 at the coast. The degradation could be due to lack of coupling with waves near the coast or to poor bathymetry. The importance of this skill's degradation is reinforced with the analysis of the results from the applications survey, which demonstrates that it is precisely near the coast where ocean forecasting EOVs are more widely used.
It is also not surprising that in most cases, the lowest value for the experts is associated with quality and not with existence, timeliness, or accessibility. This demonstrates the relative maturity of the operational chains and the need to improve in all the aspects related to the prediction engines, including the acquisition of new data to be assimilated.
Nevertheless, there are some aspects that would require further investigation. It is striking that, when not satisfied, the experts tend to evaluate all aspects of the system in a negative way at the same time. There is no evident reason why biogeochemical or biological models behave so poorly in technical aspects such as timeliness. Maybe the difficulty in obtaining good, accurate solutions is biasing the criteria of the experts when evaluating these on more purely technical aspects. This fact will be further investigated in the future. Another potentially biased result is the qualification on the existence of systems. Both users and experts are replying based on their experience and, obviously, the geographical areas where they are developing or using systems, including at least the system(s) that they deal with. This situation can be different in another regions, unbeknownst to the participants. OceanPrediction DCC is developing a global map of existing OOFS that will illuminate this question.
In summary, during the last 3 decades, the evolution and improvement of ocean forecasting services has been dramatic, and this exercise has proven that the existing systems are useful and accurate in the opinion of the users. Nevertheless, the experts have clearly stated that further improvements are required, mainly when approaching the coast and for the systems dealing with the green ocean. The Ocean Decade Implementation Plan is giving us a framework to further develop the systems, and this is the objective of OceanPrediction DCC and its associated decadal actions, such as ForeSea, Ocean Best Practices, DITTO, CoastPredict, GEMS Ocean, and others. To measure the success of these initiatives, it could be interesting to repeat this exercise by the end of the decade.
The authors will make the software code and data available upon request to the corresponding author.
SAC and EAF developed the methodology and led the investigation. EAF supervised the work, which was conceptualized with PB. SAC curated the data and worked on the visualization of the main results. The original draft of this work was prepared by EAF and SAC; then JP and KWB reviewed it. All co-authors kindly participated in the surveys.
At least one of the (co-)authors is a member of the editorial board of State of the Planet. The peer-review process was guided by an independent editor, and the authors also have no other competing interests to declare.
Please note that this article has undergone editorial review only.
Publisher's note: Copernicus Publications remains neutral with regard to jurisdictional claims in published maps and institutional affiliations.
European Union: European Commission, Directorate – General for Research and Innovation, The digital twin ocean: an interactive replica of the ocean for better decision-making, Publications Office of the European Union, 2022, https://data.europa.eu/doi/10.2777/343496 (last access: 21 August 2023), 2022.
ITIL (The Information Technology Infrastructure Library): The Information Technology Infrastructure Library (ITIL), https://www.itlibrary.org/, last access 7 July 2023.
Le Traon, P. Y., Reppucci, A., Alvarez-Fanjul, E., Aouf, L., Behrens, A., Belmonte, M., Bentamy, A., Bertino, L., Brando, V. E., Brandt Kreiner, M., Benkiran, M., Carval, T., Ciliberti, S. A., Claustre, H., Clementi, E., Coppini, G., Cossarini, G., De Alfonso Alonso-Muñoyerro, M., Delamarche, A., Dibarboure, G., Dinessen, F., Drevillon, M., Drillet, Y., Faugere, Y., Fernandez, V., Fleming, A., Garcia-Hermosa, M. I., Garcia Sotillo, M., Garric, G., Gasparin, F., Giordan, C., Gehlen, M. Gregoire, M. L., Guinehut, S., Hamon, M., Harris, C., Hernandez, F., Hinkler, J. B., Hoyer, J., Karvonens, J., Kay, S., King, R., Lavergne, T., Lemiuex-Dudon, B., Lima, L., Mao, C., Martin, M. J., Masina, S., Melet, A., Nardelli, B. B., Nolan, G., Pascual, A., Pistoia, J., Palazov, A., Piolle, J. F., Pujol, M. I., Pequignet, A. C., Peneva, E., Perez Gomez, B., Peiti de la Velleon, L., Pinardi, N., Pisano, A., Pouliquen, S., Reid, R., Remy, E., Santoleri, R., Siddorn, J., She, J., Staneva, J., Stoffelen, A., Tonani, M., Vandenbulcke, L., von Schuckmann, K., Volpe, G., Wettre, C., and Zacharioudaki, A.: From Observation to Information and Users: The Copernicus Marine Service Perspective, Front. Mar. Sci., 6, 234, https://doi.org/10.3389/fmars.2019.00234, 2019.
The Expert Team on Operational Ocean Forecasting Systems: Implementing Operational Ocean Monitoring and Forecasting Systems. Editors: Enrique Alvarez Fanjul, Stefania Ciliberti, Pierre Bahurel, IOC-UNESCO, GOOS-275, https://doi.org/10.48670/ETOOFS, 2022.
UNESCO-IOC: The United Nations Decade of Ocean Science for Sustainable Development (2021–2030) Implementation plan – Summary, Paris, UNESCO (IOC Ocean Decade Series, 19), https://unesdoc.unesco.org/ark:/48223/pf0000376780 (last access: 21 August 2023), 2021.