the Creative Commons Attribution 4.0 License.
the Creative Commons Attribution 4.0 License.
 | 27 Sep 2023 | OSR7 | Chapter 4.2
Recent variations in oceanic transports across the Greenland–Scotland Ridge
Michael Mayer
Takamasa Tsubouchi
Susanna Winkelbauer
Karin Margretha H. Larsen
Barbara Berx
Andreas Macrander
Doroteaciro Iovino
Steingrímur Jónsson
Richard Renshaw
Oceanic exchanges across the Greenland–Scotland Ridge (GSR) play a crucial role in shaping the Arctic climate and linking with the Atlantic meridional overturning circulation. Most considered ocean reanalyses underestimate the observed 1993–2020 mean net inflow of warm and saline Atlantic Water of 8.0 ± 0.5 Sv by up to 15 %, with reanalyses at 0.25∘ resolution additionally exhibiting larger biases in the single inflow branches compared to higher-resolution products. The underestimation of Atlantic Water inflow translates into a low bias in mean oceanic heat flux at the GSR of 5 %–22 % in reanalyses compared to the observed value of 280 ± 18 TW. Interannual variations in reanalysis transports correlate reasonably well with observed transports in most branches crossing the GSR. Observations and reanalyses with data assimilation show a marked reduction in oceanic heat flux across the GSR of 4 %–9 % (compared to 1993–2020 means) during a biennial (2-year-long) period centered on 2018, a record low for several products. The anomaly was associated with a temporary reduction in geostrophic Atlantic Water inflow through the Faroe–Shetland branch and was augmented by anomalously cool temperatures of Atlantic Water arriving at the GSR. The latter is linked to a recent strengthening of the North Atlantic subpolar gyre and illustrates the interplay of interannual and decadal changes in modulating transports at the GSR.
- Article
(3691 KB) - Full-text XML
- BibTeX
- EndNote


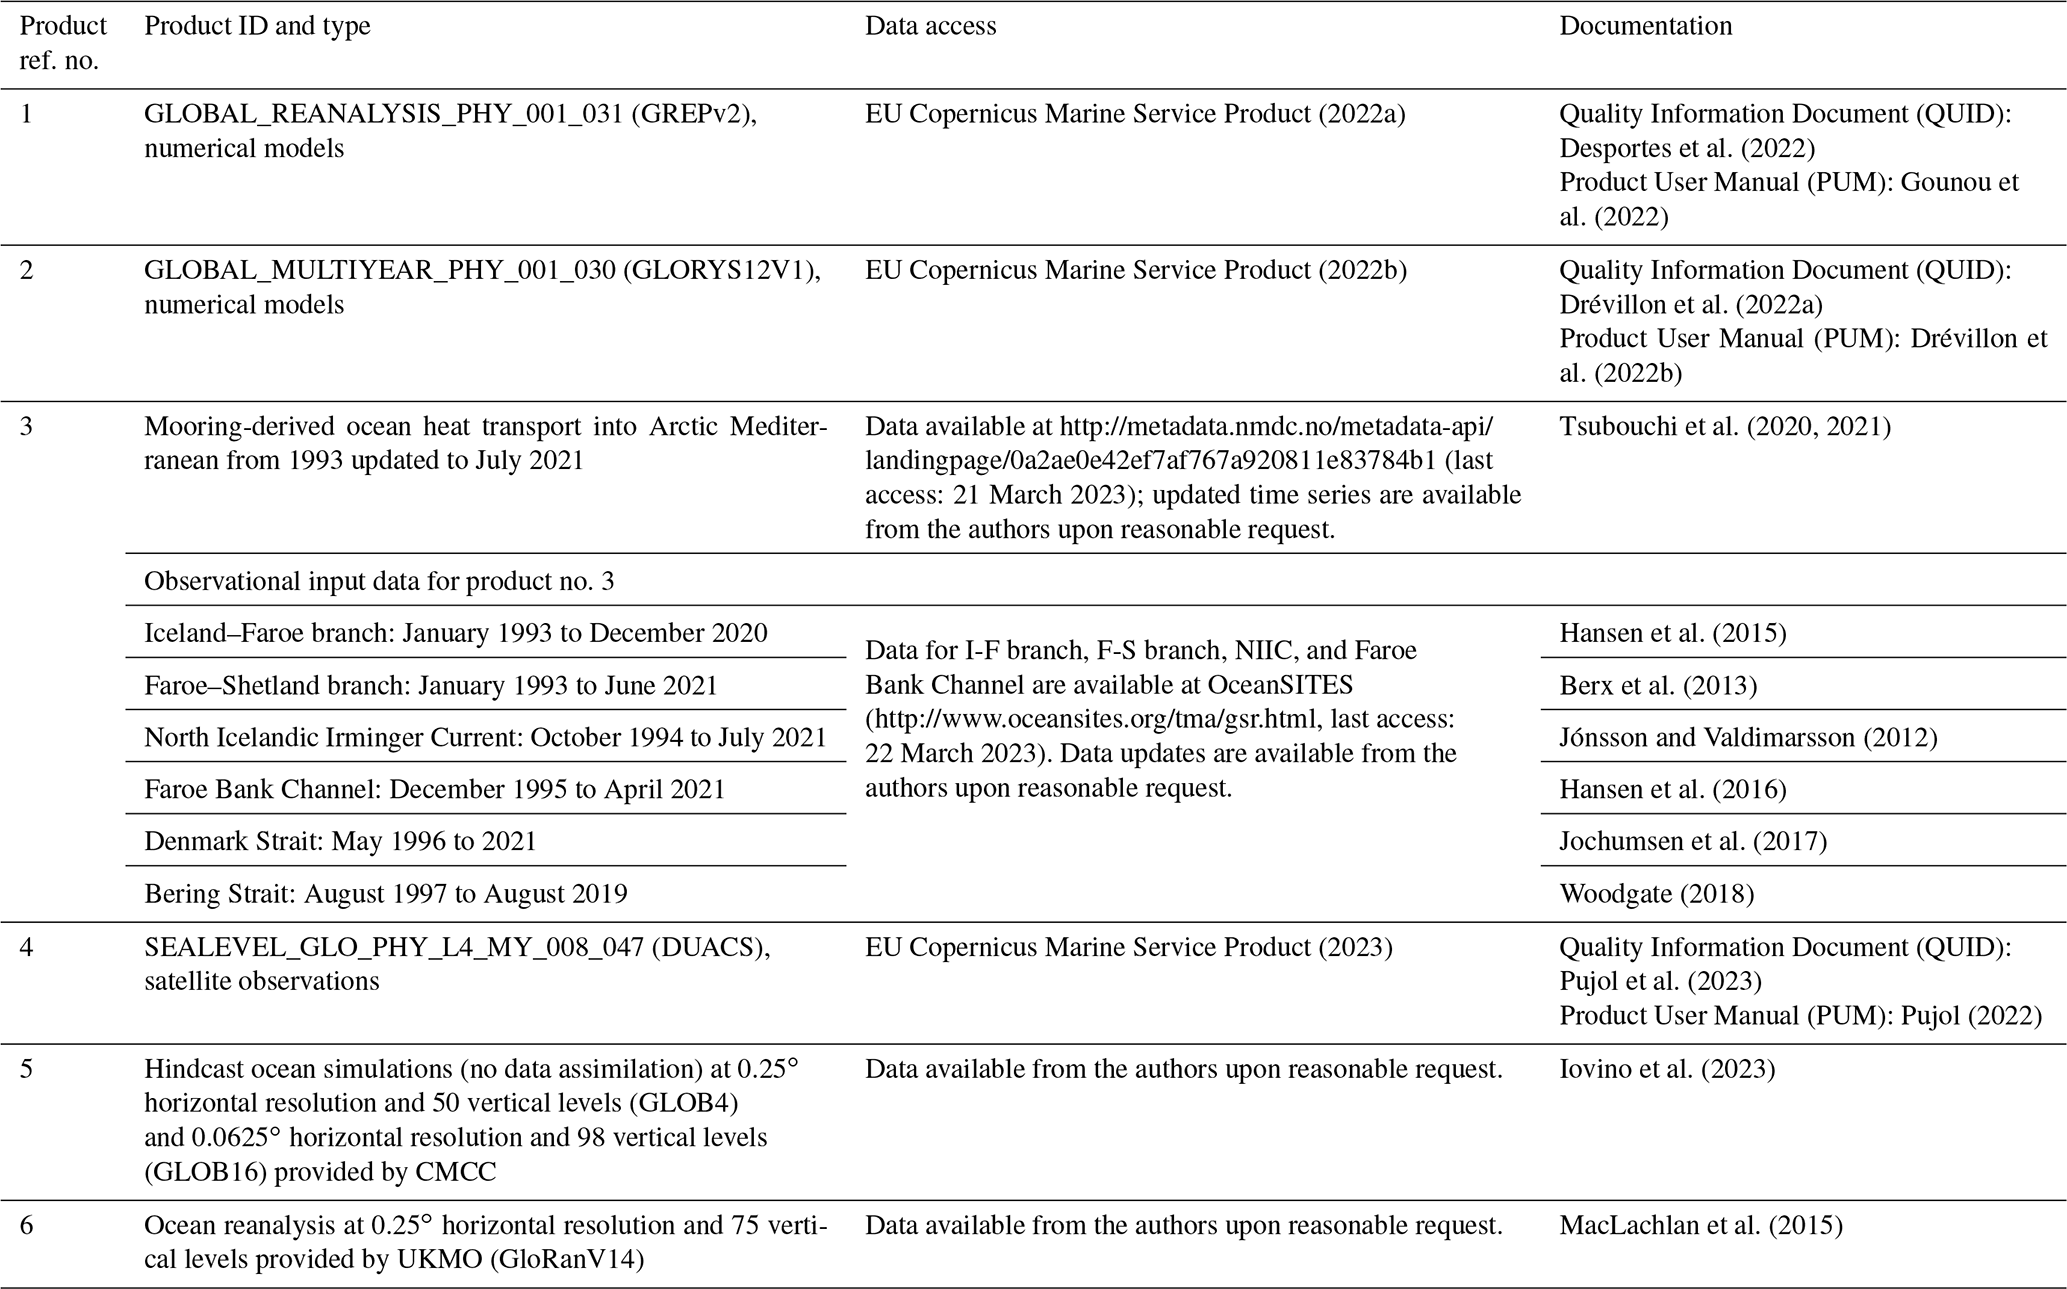
Table 1CMEMS and non-CMEMS products used in this study, including information on data documentation.
The Greenland–Scotland Ridge (GSR), encompassing the Denmark Strait, Iceland–Faroe (I-F) branch, Faroe–Shetland (F-S) branch, and European shelf, represents the main oceanic gateway to the so-called Arctic Mediterranean (the ocean bounded by the GSR, Davis Strait, and Bering Strait). Oceanic transports across the GSR play an important role in the Arctic and global climate systems. In the surface layer, the warm and saline Atlantic Water moves northward across the GSR and the light Polar Water flows southward mainly through the Denmark Strait. In the lower layer, the cold and dense water is transported southward at depth into the North Atlantic, contributing to the lower limb of the Atlantic meridional overturning circulation (Hansen and Østerhus, 2000; Buckley and Marshall, 2016).
Transports across the GSR exhibit pronounced interannual variability and thereby play an important role in modulating the heat budget of the Arctic Mediterranean (e.g., Muilwijk et al., 2018; Mayer et al., 2016; Asbjørnsen et al., 2019). Specifically, the inflow of warm and saline Atlantic Water (AW) exhibits a strong co-variability with ocean heat content, especially in the AW layer of the Arctic Mediterranean (M. Mayer et al., 2022). Tsubouchi et al. (2021), using observation-based oceanic transport data (1993–2016), revealed a step change towards stronger oceanic heat transports (OHTs) across the GSR around 2002, suggesting an enhanced contribution of OHT to the observed warming of the Arctic Ocean. M. Mayer et al. (2022) temporally extended the monitoring of OHT at the GSR using ocean reanalyses and found a pronounced reduction in OHT around 2018, which could not be verified with observational data at that time and the causes of which were not explored in detail.
Here, we use observational oceanic transport data at the boundaries of the Arctic Mediterranean updated to 2021 and an extended set of ocean reanalyses to explore the pronounced reduction in OHT in more detail, track it to the main contributing oceanic branch, and relate these changes to larger-scale climate variations on interannual and decadal timescales. An additional aspect of this study is a more detailed validation of reanalysis-based oceanic transports at the GSR at the scale of single branches to further build trust in the usefulness of these products for monitoring Arctic climate and its oceanic drivers.
We use monthly data from a comprehensive set of ocean reanalyses to compute oceanic transports across the GSR, Davis Strait, and Bering Strait. The latter two straits are calculated to close the volume budget and obtain unambiguous net heat transport into the Arctic Mediterranean (Schauer and Beszczynska-Möller, 2009). Inflow (positive) has been defined as positive towards the Arctic Mediterranean. The employed products are an updated ensemble based on the Copernicus Marine Environment Monitoring Service Global Reanalysis Ensemble Product (CMEMS GREPv2, product ref 1), consisting of ORAS5, CGLORS, GLORYS2V4, and GloRanV14 (an improvement of GloSea5, also known as the FOAM product, product ref 6; MacLachlan et al., 2015). These are all run at 0.25∘ horizontal resolution with 75 vertical levels and use atmospheric forcing from ERA-Interim (Dee et al., 2011). The ensemble is complemented with GLORYS12 version 1 (product ref 2), a reanalysis at 0.083∘ horizontal resolution with 50 vertical levels driven by ERA-Interim atmospheric forcing. Furthermore, two hindcast ocean simulations (i.e., with no data assimilation) at 0.25∘ horizonal resolution with 50 vertical levels (GLOB4) and 0.0625∘ horizontal resolution and 98 vertical levels (GLOB16; Iovino et al., 2023) driven by JRA55-do (Tsujino et al., 2018) are employed to investigate the impact of resolution on oceanic volume fluxes. Heat transports from GLOB4 and GLOB16 are not assessed as these are biased due to their setup as forced runs without data assimilation. Transports are computed on the native grid through line integrals similar to Pietschnig et al. (2018).
Observational mass-consistent estimates of oceanic transports (product ref 3) are updated to July 2021 following Tsubouchi et al. (2021; i.e., using the same strategy to infill data gaps, estimate uncertainty, and create a box inverse model to close the volume budget). Temporal coverage and references for the single observational estimates used as input are provided in the data table (Table 1). Surface freshwater inputs by river discharge and precipitation minus evaporation for 1993–2021 used as input to the box inverse model are based on Winkelbauer et al. (2022). The used reanalyses assimilate temperature and salinity profiles available from databases such as Hadley EN4 (Good et al., 2013), which according to our investigations include only a small subset of the mooring data used for our observational transport estimates. Currents are generally not assimilated in ocean reanalyses. Hence, the observation-based volume fluxes represent fully independent data, while temperature fluxes represent largely independent validation data.
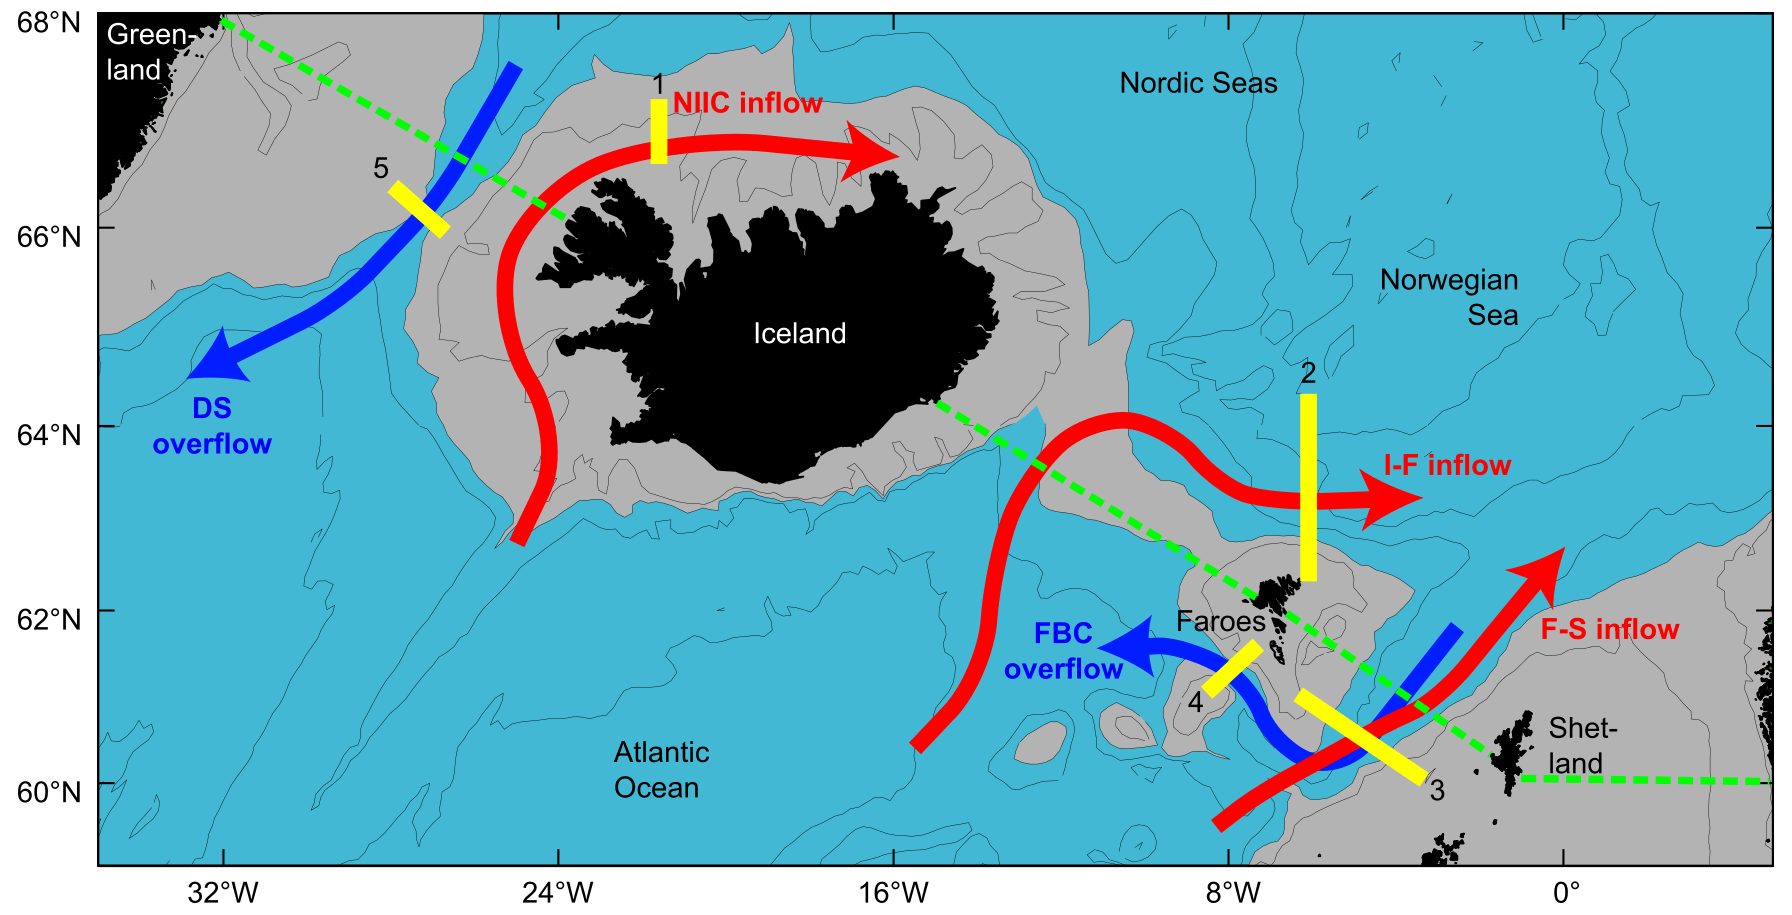
Figure 1Map of the Greenland–Scotland Ridge region, schematically depicting shallow shelf water and deep water, major AW inflow (red arrows) and OW outflow (blue arrows) branches (DS stands for Denmark Strait, and FBC stands for Faroe Bank Channel), the location of oceanic moorings used for deriving the observation-based transport estimates (yellow bars), and the section used for the computation of transports from ocean reanalyses (dashed green line). Adapted from OceanSITES (http://www.oceansites.org/tma/gsr.html, last access: 20 March 2023, Fig. 1).
We note that quantification methods of oceanic transports in reanalyses and observations are fundamentally different, which needs to be kept in mind when intercomparing. The reanalysis-based estimate is based on surface-to-bottom, coast-to-coast temperature and velocity sections across the Arctic Mediterranean. This ensures conservation of volume and avoids projection of potentially biased positioning of currents in the reanalyses onto the transport estimates. The observational estimate is based on the sum of 11 major ocean current transport estimates categorized into three major water masses – Atlantic Water (AW), Polar Water (PW), and Overflow Water (OW) (Tsubouchi et al., 2021). An assumption is that the 11 major ocean currents represent the major water mass exchanges well across the Arctic Mediterranean. This means it is important that no recirculation, e.g., of AW waters, remains unobserved, as this would introduce biases into the observational estimate. This assumption has been assessed and confirmed many times over the last 2 decades from establishment of sustained hydrographic sections in the GSR in the 1990s (e.g., Dickson et al., 2008) to recent oceanographic surveys to capture ocean circulation in the GSR for AW (e.g., Berx et al., 2013; Hansen et al., 2017; Rossby et al., 2018; Jónsson and Valdimarsson, 2012) and OW (Hansen et al., 2018). We also note that remaining uncertainties arising from potential undersampling are taken into account in the observational estimate obtained through the inverse model. For reference, Fig. 1 shows pathways of major flows across the GSR and the locations of considered oceanic moorings and the sections used for evaluation of reanalyses.
As in M. Mayer et al. (2022), we assume total uncertainties in monthly mean observations (provided in Tsubouchi et al., 2021) to consist of roughly half systematic and half random errors; i.e., the two contributions are the total uncertainty reduced by a factor of . Consequently, the contribution of random errors to uncertainties in long-term mean observational estimates is further reduced by a factor of , where N is the number of years, and deseasonalized anomalies only include the random errors.
Transported water masses at the GSR are decomposed into AW, PW, and OW, largely following Eldevik et al. (2009). PW is defined as T < 4 ∘C and σθ < 27.7 kg m−3. OW is defined as σθ > 27.8 kg m−3. The rest (i.e., waters with σθ < 27.8 kg m−3 with PW taken out) is considered AW. Note that these definitions have been revised from M. Mayer et al. (2022). Water mass decomposition is performed each month based on the monthly temperature and salinity fields in the reanalyses. These definitions are similar to those used for observational products (see references for more details, e.g., Eldevik et al 2009).
We additionally use sea level anomaly (SLA) data provided through CMEMS (product ref 4) for investigating drivers of observed OHT anomalies. The global mean SLA trend is removed before computation of the presented diagnostics.
Deseasonalized anomalies are based on the 1993–2019 climatologies, i.e., the period for which all data are available. Anomaly time series have a 12-monthly temporal smoother applied to emphasize interannual variations. Confidence levels (95 % is set as threshold for significance testing) for temporal correlations take auto-correlation of the involved time series into account (see Oort and Yienger, 1996).
3.1 General evaluation of transports of water masses across the GSR
Figure 2 presents mean annual cycles and anomaly time series of relevant oceanic transport quantities at the GSR. It is complemented with long-term averages shown in Table 2 (volume fluxes) and Table 3 (heat fluxes). Observations show seasonally varying AW inflow across the GSR (8.0 ± 0.5 Sv; mean ± standard deviation of the mean reported throughout, unless explicitly stated) with a maximum in December and minimum in June–July (Fig. 2a). The AW inflow is largely balanced by PW (Fig. 2c; −1.8 ± 0.7 Sv) and OW (Fig. 2b; −5.6 ± 0.3 Sv) outflow, yielding a relatively small net volume flux across the GSR of 0.7 Sv (balanced by flows through Bering and Davis straits). The PW outflow exhibits an annual cycle balancing the AW inflow (i.e., maximum outflow in boreal winter), while the OW exchange is more stable throughout the year (i.e., small annual cycle).
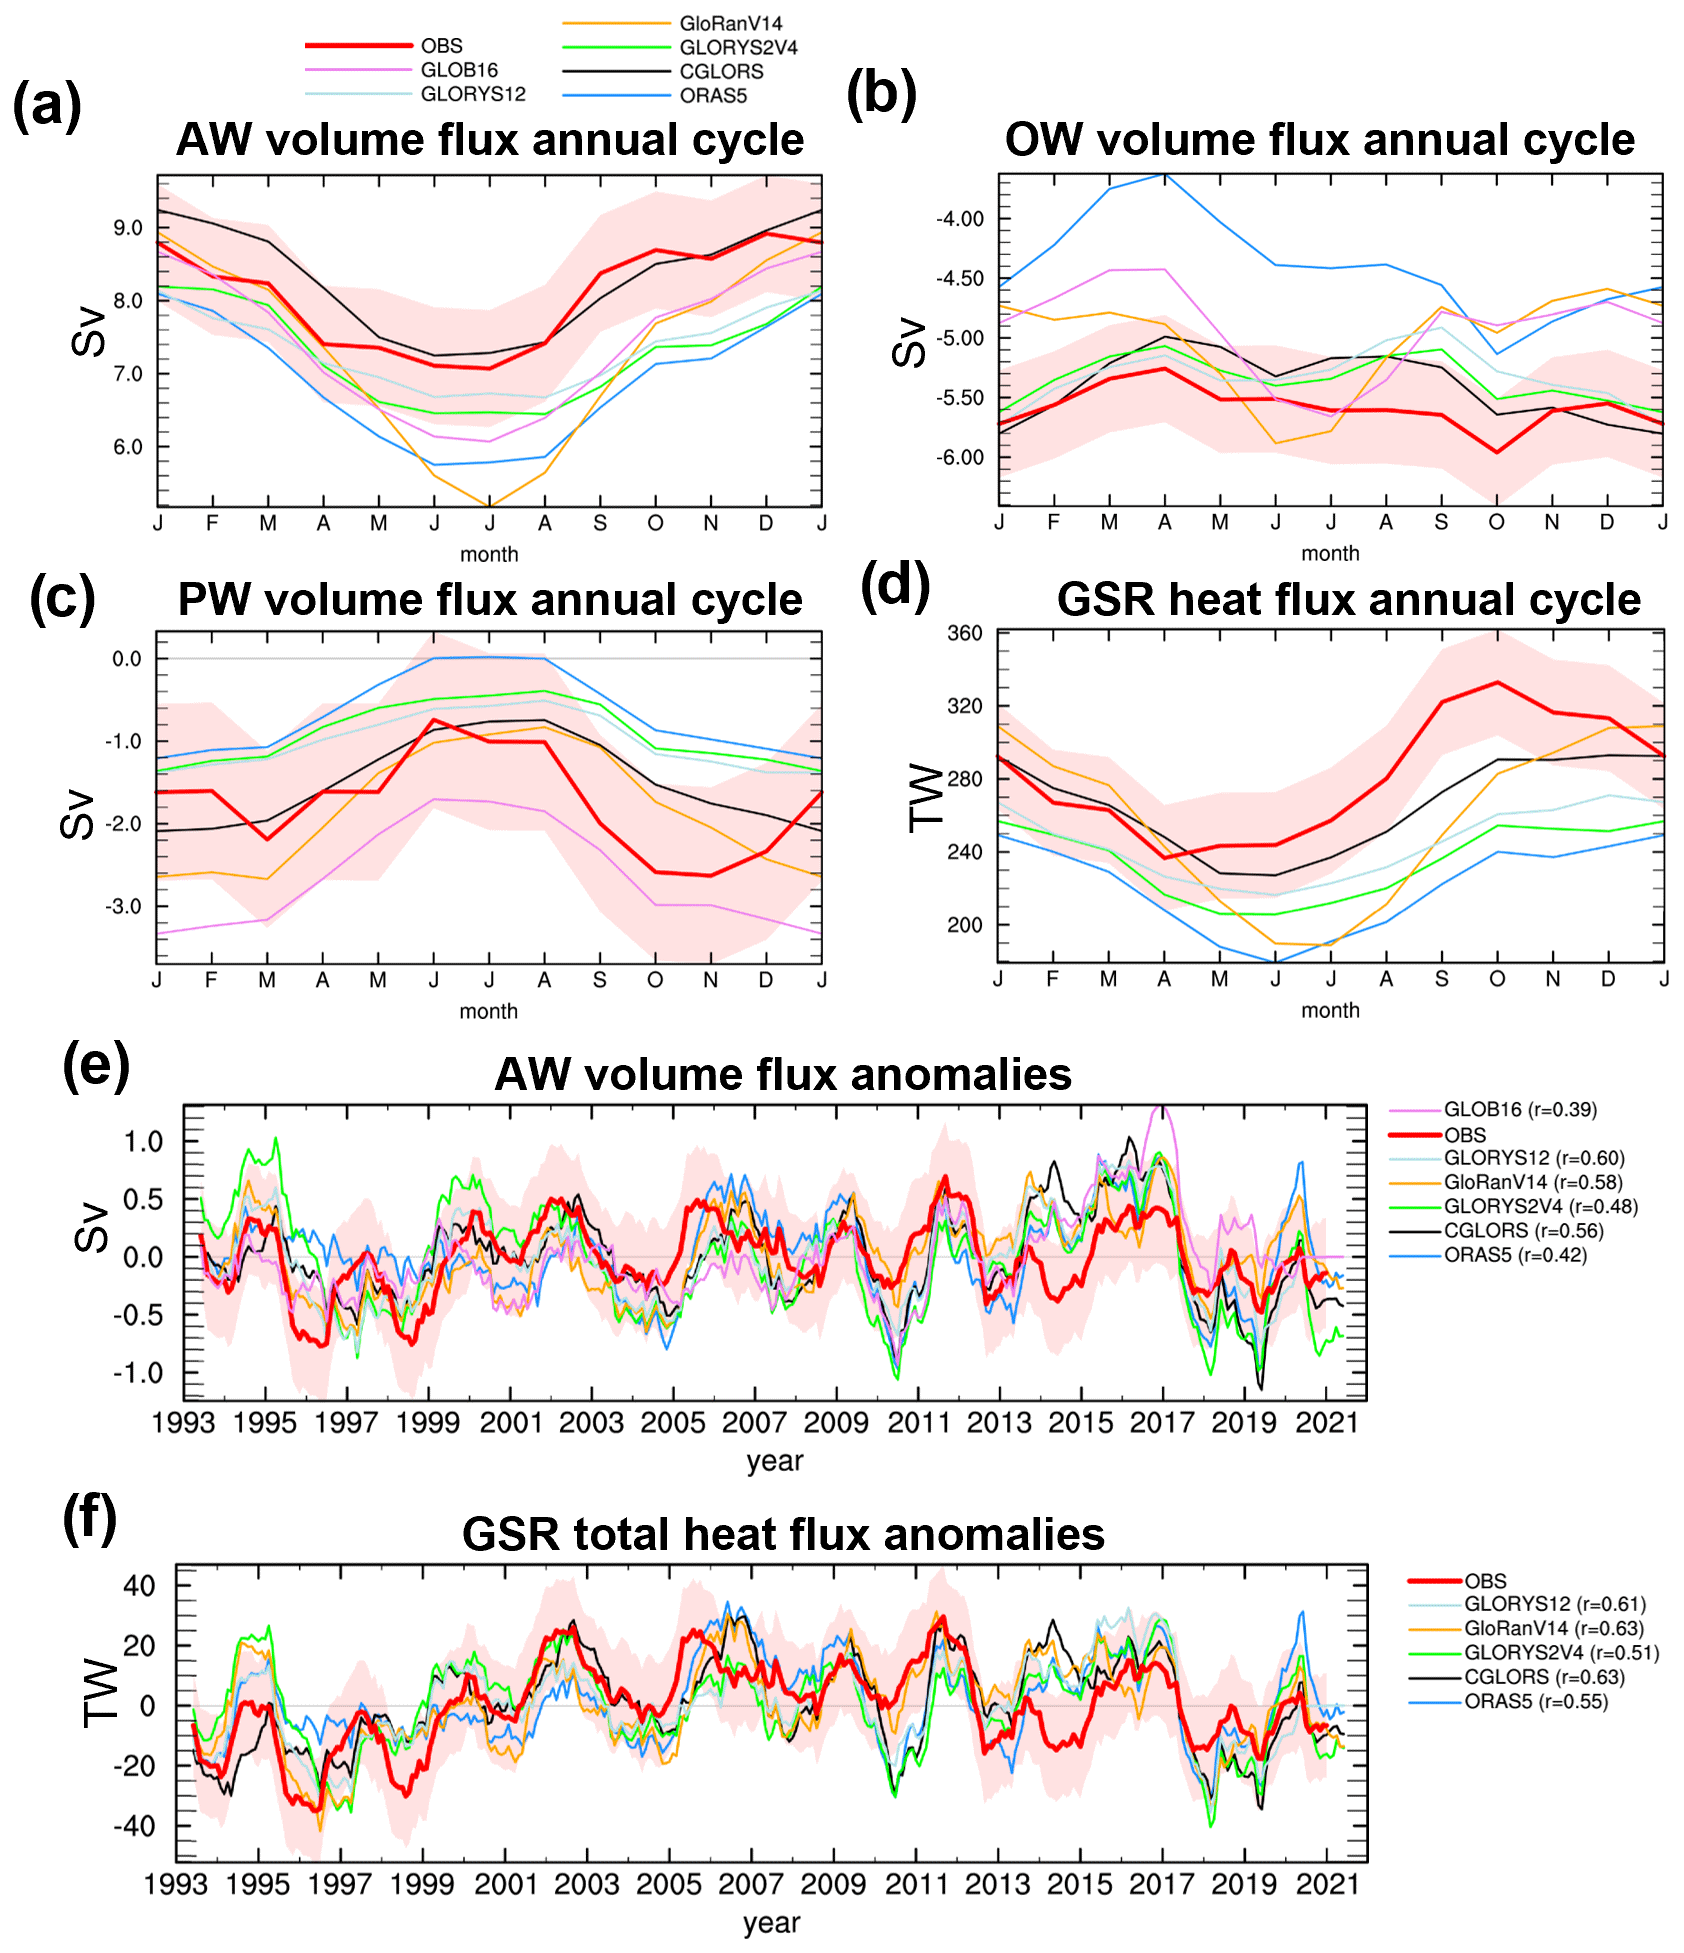
Figure 2Mean annual cycle of (a) AW volume flux, (b) OW volume flux, (c) PW volume flux, and (d) GSR total (AW + PW + OW) heat flux. Temporal anomalies of (e) AW volume flux and (f) GSR total heat flux. The red shading indicates ±1 standard error in the observational data. Temporal correlations of reanalyses with observations are provided in the legends.
Table 2Long-term mean of volume flux in different water masses and branches across the GSR. Observational European shelf volume fluxes are based on Østerhus et al. (2019). All values are based on 1993–2020 (since observational data do not completely cover 2021) data, except for GLOB16 and GLOB4 (based on 1993–2019 data). Values are given in Sv.
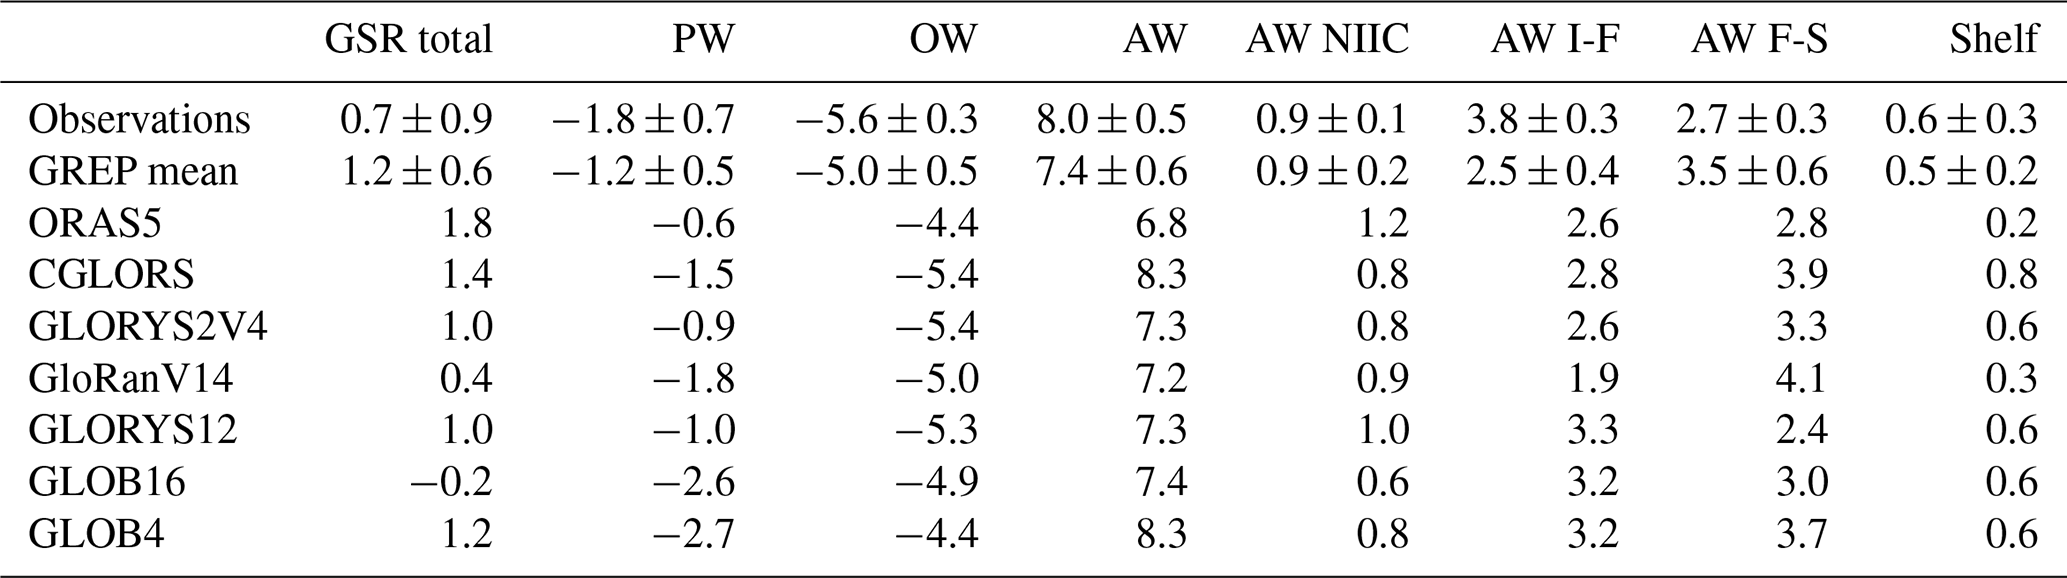
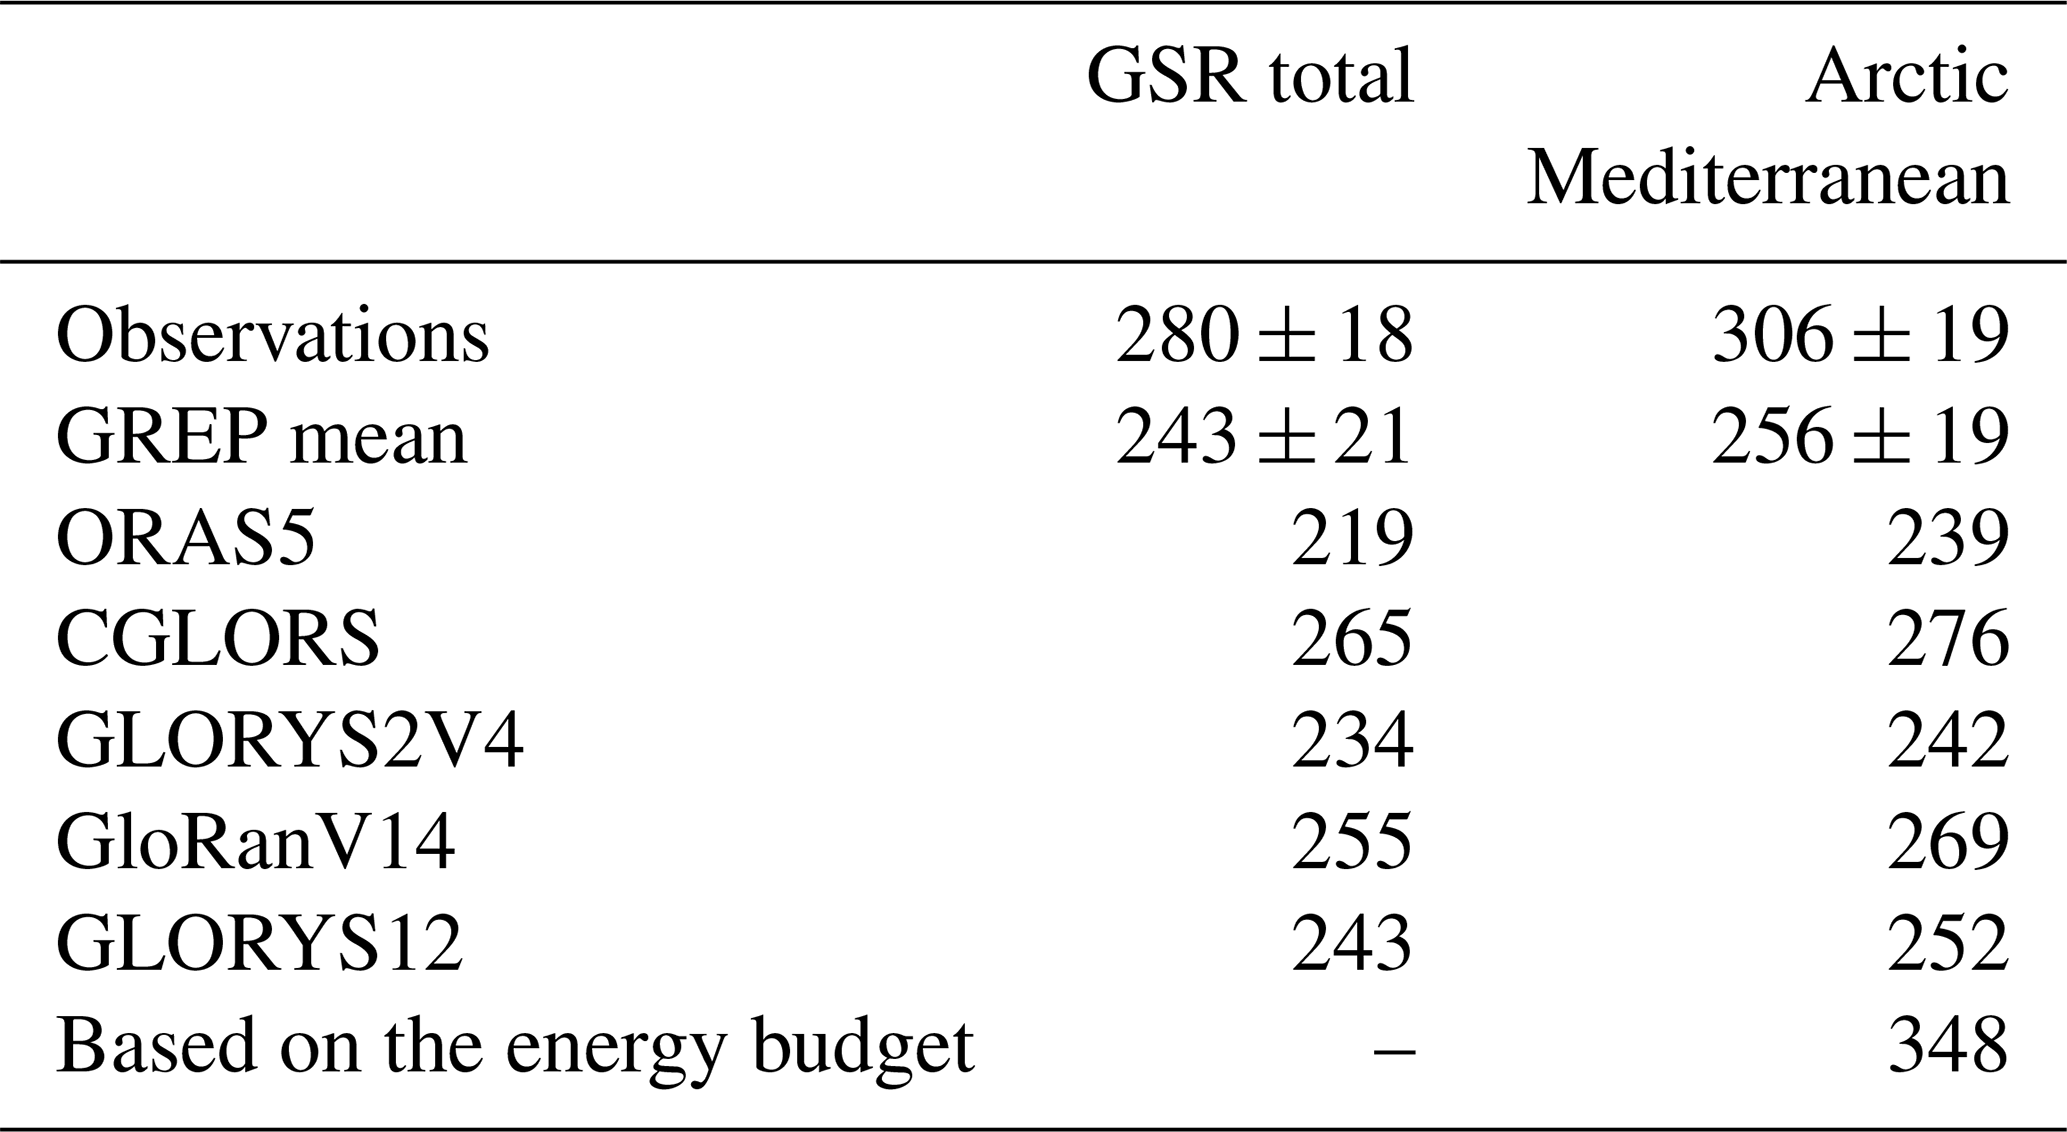
Table 3Long-term mean of total heat flux across the GSR and into the Arctic Mediterranean (total GSR transports plus Bering Strait and Davis Strait transports). The energy-budget-based transport estimate is taken from M. Mayer et al. (2022) and by definition can only be provided for a closed area like the Arctic Mediterranean. All values are based on 1993–2020 data. Values are given in TW.
All reanalyses but one (CGLORS) underestimate AW inflow across the GSR when compared to observations, but the shape of the annual cycle of all estimates is in good agreement with observations. The AW net flow from high-resolution products does not stand out compared to the 0.25∘ products and is close to the GREP mean. Agreement is also good for the PW outflow, where all products show the observed seasonal maximum flow in boreal winter. The range of reanalysis-based estimates is large in a relative sense, with the observations lying in the middle of the range. There is less coherence across products concerning the OW transports. GLORYS12, GLORYS2V4, and CGLORS are close to observations, with rather persistent overflow on the order of −5.4 Sv and seasonal variations that agree with the observations. Other products tend to have overflows that are too weak (most notably ORAS5), and some also exhibit biases in the representation of the annual cycle (e.g., GloRanV14).
Table 2 additionally includes long-term average volume fluxes in the main AW inflow branches (North Icelandic Irminger Current (NIIC), I-F branch, F-S branch, and European shelf). The reanalysis-based estimates generally agree well with observations. The main discrepancy is the underestimation of I-F inflow and overestimation of F-S inflow by all GREP reanalyses, while the high-resolution products GLORYS12 and GLOB16 are in much better agreement with observations. Direct comparison of GLOB16 to GLOB4 confirms that overestimation of F-S volume flux is reduced when going from 0.25 to 0.0625∘ resolution. This suggests that increased resolution, along with more realistic bathymetry, improves representation of inflow pathways in the reanalyses. We also note that temporal anomaly correlations with observed I-F volume fluxes are low (Pearson correlation coefficients r range from −0.03 to 0.26 and are statistically insignificant) for all reanalyses but are substantially higher for F-S volume fluxes (r ranges from 0.30 to 0.71 and is statistically significant for all products with data assimilation).
Figure 2d shows the mean annual cycle of heat flux across the GSR, i.e., the sum of sensible heat transported by all waters crossing the GSR. The mean annual cycle of GSR heat fluxes generally follows that of AW volume fluxes, with a minimum between boreal spring and early summer and a maximum in fall and early winter. Seasonal minima and maxima in GSR heat flux co-occur with those of AW volume flux; i.e., seasonal variations in heat flux are largely volume flux driven, and the seasonal cycle in volume-weighted temperatures is in phase.
Since net volume flux across the GSR is small, the ambiguity arising from the choice of reference temperature can be considered small as well. However, for the long-term averages we focus on net heat transport into the Arctic Mediterranean, i.e., the sum of heat fluxes across the GSR, plus those through Bering and Davis straits. Values in Table 3 show that all reanalyses exhibit lower net heat transport (by ∼ 16 % for the GREP mean of 256 ± 19 TW) than that observed (306 ± 19 TW; 311 ± 20 TW when including sea ice). GLORYS12 exhibits a mean net heat flux similar to the GREP mean, but we note that all GREP reanalyses have AW influx that is too strong in the F-S branch (Table 2), where the climatologically warmest waters cross the GSR, and thus enhance the heat flux in those products for the wrong reason.
The net heat transport is clearly related to the strength of AW inflow, but even CGLORS, which has a higher AW mean volume flux (8.3 Sv) than observations, has a negative net heat flux bias. The reason is that all reanalyses exhibit a warm bias in outflowing OW (not shown) and a cold bias in Davis Strait inflow (see Pietschnig et al., 2018). Based on M. Mayer et al. (2022) and taking oceanic storage into account, the energy-budget-based estimate of the net heat boundary transport suggests even higher values (∼ 348 TW) than observations. This inferred value appears high, but we note that this indirect approach has been applied successfully to infer observation-based oceanic transports in the North Atlantic (Trenberth and Fasullo, 2017; Liu et al., 2020; J. Mayer et al., 2022) and the central Arctic (Mayer et al., 2019), and hence it is deemed credible. This estimate at least adds confidence to the conclusion that the observational estimate of oceanic heat transport is not biased high. Table 3 also confirms that long-term averages for heat flux across the GSR are qualitatively very similar to the net heat transport; i.e., heat fluxes across the GSR are the dominant contributor to oceanic heat transport into the Arctic Mediterranean.
Figure 2e shows deseasonalized anomalies of AW volume flux, with a 12-monthly smoother applied to emphasize interannual variability. Typical variability is similar across observations (temporal standard deviation σ = 0.35 Sv) and reanalyses (σ ranges between 0.22 and 0.47 Sv). Temporal correlations between reanalyzed and observed AW inflow anomalies are moderately high (r ranges between 0.39 and 0.60 and is statistically significant for all products; see the legend of the plot for values).
Figure 2f shows anomalies of total oceanic heat flux across the GSR, which show similar variability to AW volume flux; i.e., the strength of AW inflow modulates not only the seasonal cycle of the total GSR heat flux but also its interannual variations (r ranges from 0.86 to 0.91). GSR total heat flux from reanalyses is in slightly better agreement with observations than AW volume fluxes (r ranges between 0.51 and 0.63 and is statistically significant for all products; see the legend of the plot for values). Figure 2f also shows a prominent negative heat flux anomaly centered around the year 2018, which has already been noted by M. Mayer et al. (2022) for net heat transport into the Arctic Mediterranean.
3.2 Spatial structure of the July 2017–June 2019 transport anomaly
To set the scene for further investigation, we present climatological temperatures and currents at the GSR based on GLORYS12 in Fig. 3a and b, respectively. Comparison with analogous figures based on the GREP (shown in M. Mayer et al., 2022) allows us to appreciate the benefits of increased resolution (0.08 vs. 0.25∘ resolution), including a more distinct representation of inflow and outflow branches and a more spatially variable bathymetry, especially in the I-F branch.
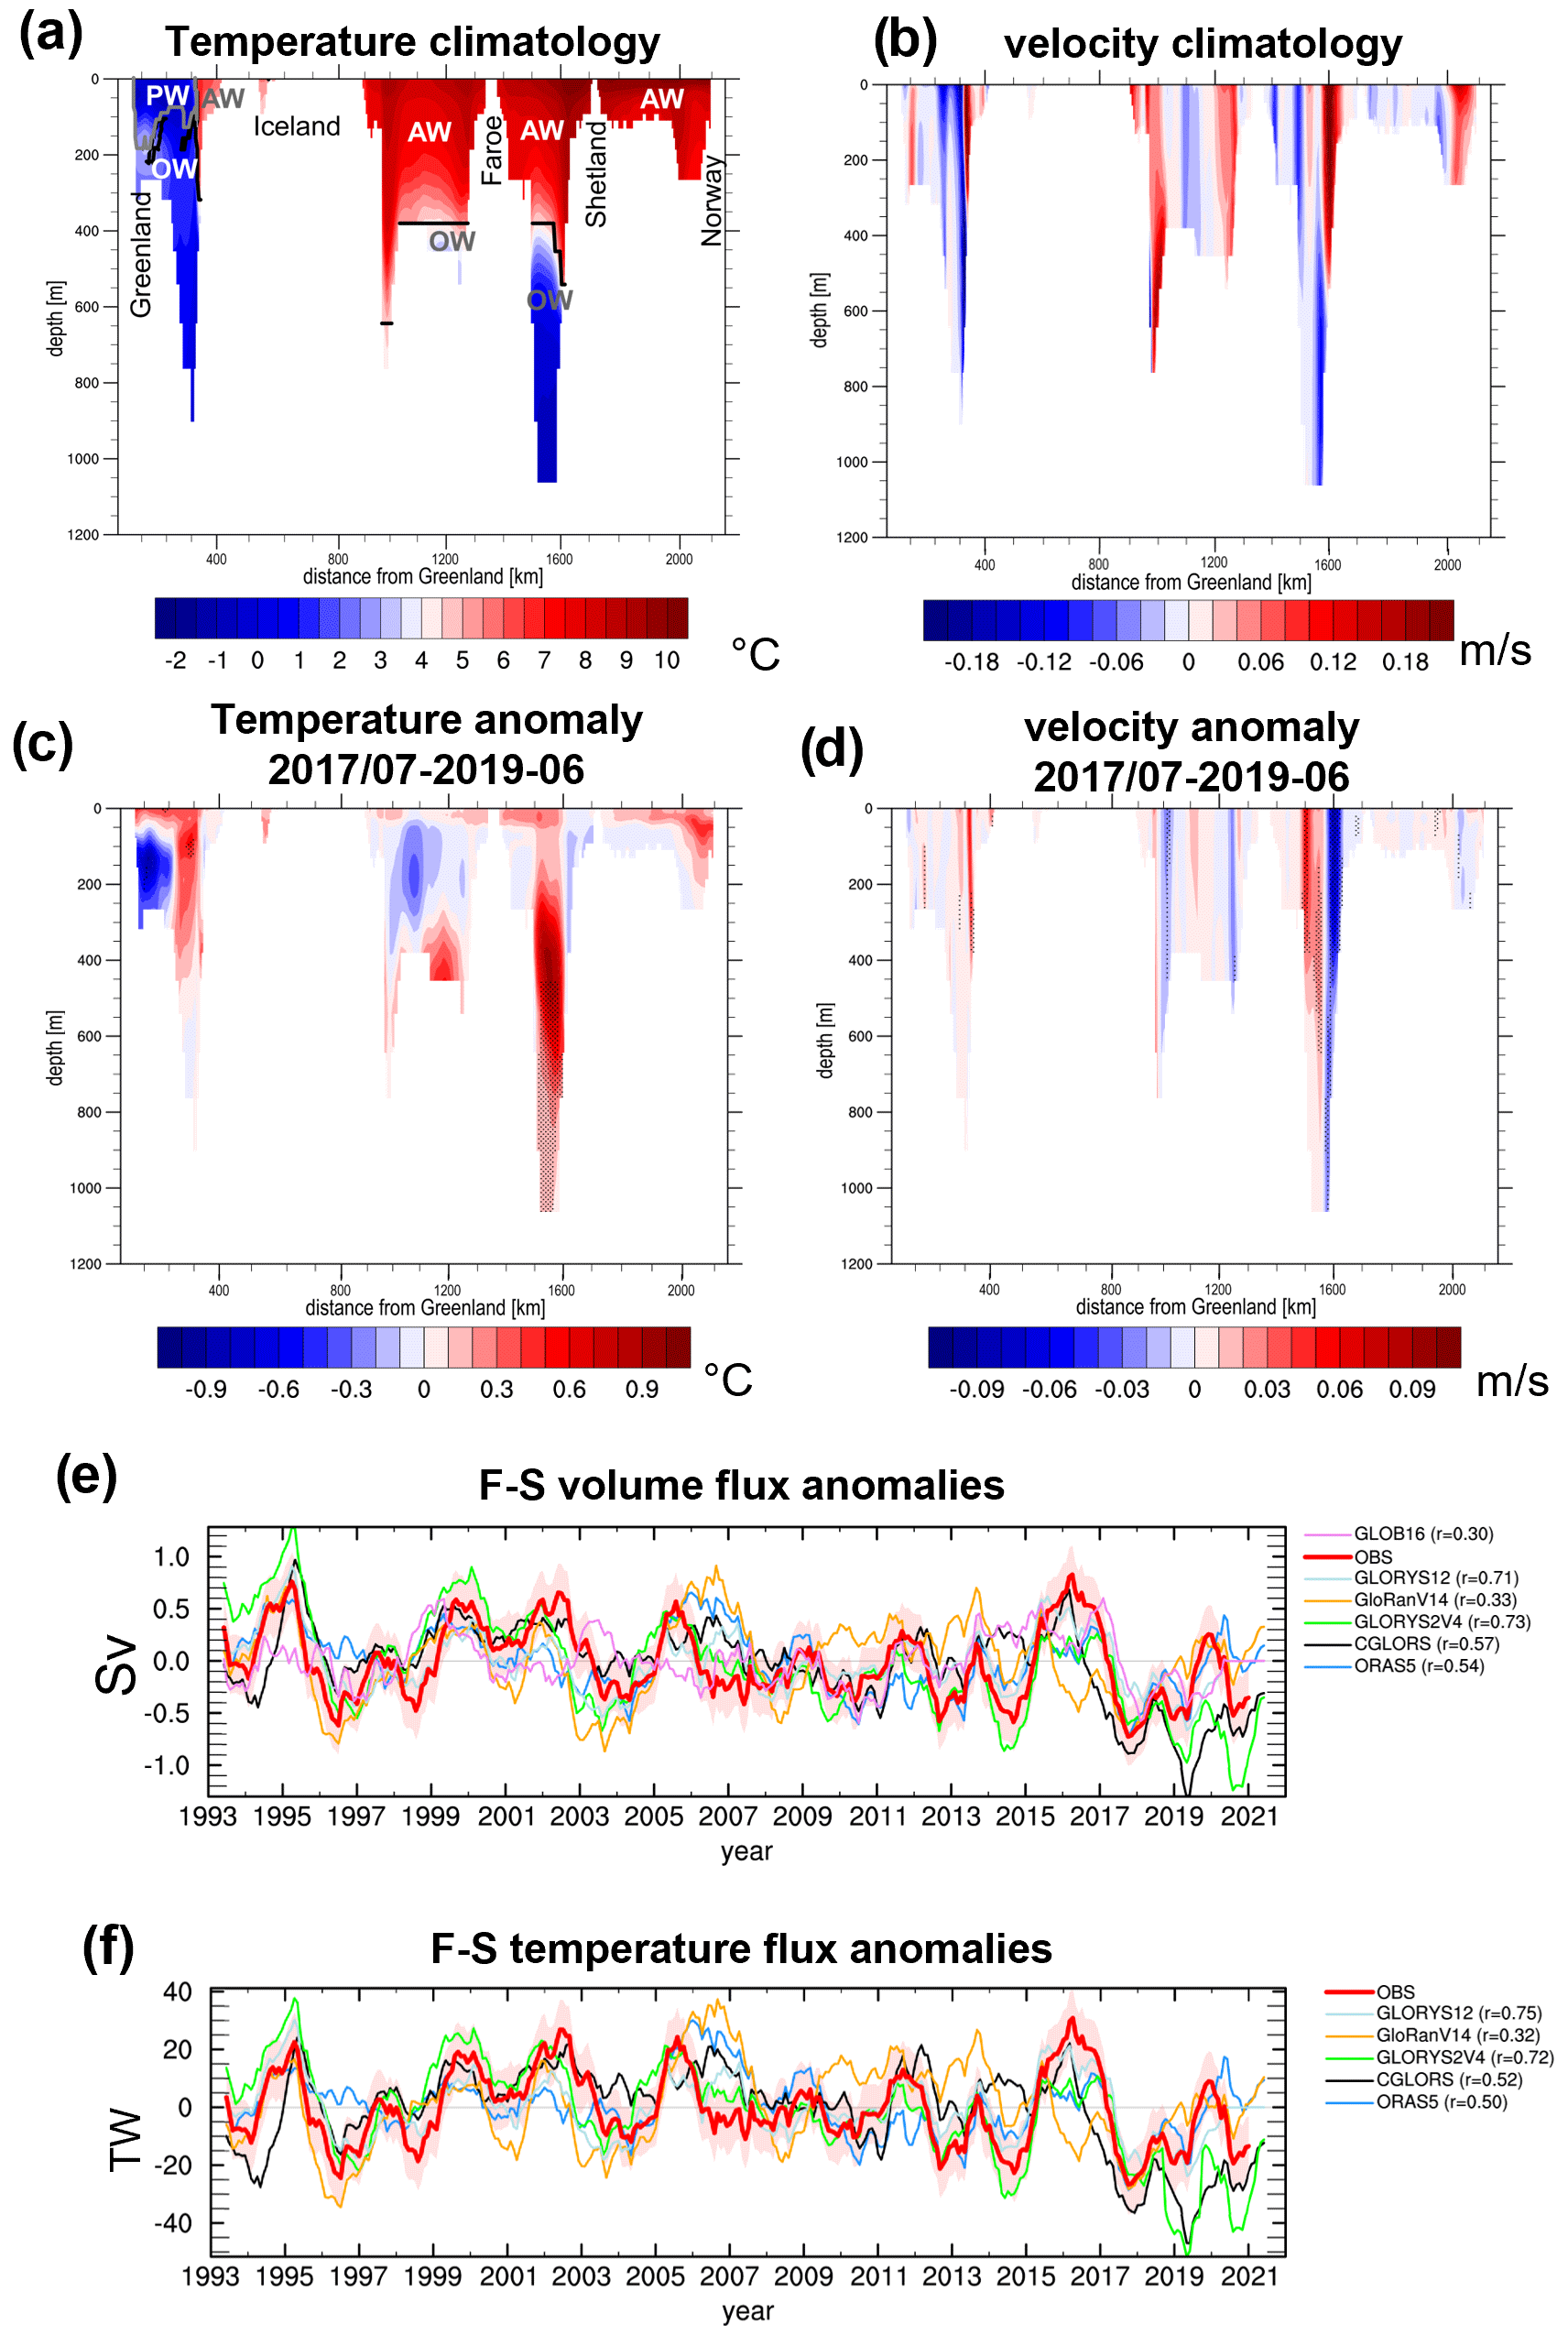
Figure 3Longitude–depth sections of (a) mean temperature (with water mass boundaries indicated), (b) mean velocity, (c) July 2017–June 2019 anomalous temperature, and (d) July 2017–June 2019 anomalous velocity across the GSR based on GLORYS12 (stippling denotes grid cells where anomalies are > 2σ of biennial anomalies). Note that the section does not go along the shallowest part of the Denmark Strait and I-F Ridge everywhere, leading to deeper trenches in some places (see also Fig. 1). Time series of (e) anomalous volume and (f) anomalous temperature flux through the Faroe–Shetland branch, where the red shading indicates ±1 standard error in the observational data. Temporal correlations of reanalyses with observations are provided in the legends.
Next, we investigate the recent reduction in AW volume and GSR heat fluxes in more detail. This is most prominent in the biennial (2-year-long) signal of average anomalies in July 2017–June 2019. Figure 3c shows that during this period strong warm anomalies were present over 0–400 m depth in the eastern Denmark Strait, and warm anomalies are also seen in the F-S branch. The latter suggests a temporary deepening of the AW layer. Velocity anomalies for the July 2017–June 2019 period (Fig. 3d) suggest that the positive temperature anomalies in the eastern Denmark Strait are driven by enhanced NIIC transports. The strongest and deepest velocity anomaly in July 2017–June 2019 is located in the eastern part of the F-S branch, where reduced inflow is present from the surface down to the interface at ∼ 600 m, and hence we focus on this branch next. Negative anomalies are also seen in the overflow from 600 to 1000 m depth. There is some compensation by positive velocity anomalies in the western F-S (meaning reduced southward flow there), but the effect of the eastern F-S anomaly dominates, and the net F-S volume flux anomaly was clearly reduced during this period (see below). We note that these main features are also similar in anomaly sections based on the GREP ensemble mean (not shown).
Observations and all reanalyses show large negative F-S volume inflow anomalies of −0.61, −0.56, −0.34, and −0.24 Sv in the observations, GREP_mean, GLORYS12, and GLOB16, respectively, during July 2017–June 2019 (Fig. 3e). In four out of seven datasets, this is the overall biennial minimum of the 1993–2021 record (not shown). The total AW volume flux anomaly for that period was −0.24, −0.53, −0.37, and +0.08 Sv in the observations, GREP_mean, GLORYS12, and GLOB16, respectively. Thus, F-S volume flux anomalies were partly compensated by other AW branches, with no very clear signal in any of them (not shown). Only GLOB16 exhibits a positive AW volume flux anomaly during that period, which appears to be related to a shift towards generally higher AW volume flux around 2016 (see Fig. 2e). This is not seen in any of the other products.
Temperature transport anomalies in the F-S branch are strongly correlated with volume flux anomalies (compare Fig. 3e and f), and there is a clear reduction in F-S branch temperature flux in July 2017–June 2019 of −21.9, −24.1, and −16.1 TW in the observations, GREP_mean, and GLORYS12, respectively. The contribution of temperature anomalies in the F-S branch during that time was small, with biennial anomalies of observed volume-weighted temperatures between −0.2 and −0.1 K (similar for all products). The total AW heat flux anomaly for July 2017–June 2019 was −11.0, −22.5, and −19.4 TW in observations, GREP_mean, and GLORYS12, respectively. Thus, the reduction in GSR heat transports during that period was mainly driven by a reduction in volume inflow through the F-S branch. It was only partly offset by compensating transport anomalies in other branches. Very similar biennial heat transport anomalies for the total GSR (−11.1, −20.9, and −19.3 TW for observations, GREP_mean, and GLORYS12, respectively) confirm AW as the main driver of heat flux variability across the GSR.
3.3 Relationships between sea level and AW inflow
For a better understanding of mechanisms contributing to the GSR transport anomaly around 2018, we first consider basic statistical relationships between SLA and oceanic quantities. We find a statistically significant temporal correlation of the zonal SLA gradient at GSR with observed AW volume flux anomalies (Fig. 4a), which is plausible in terms of geostrophic balance. The correlation pattern looks very similar when performed with the F-S branch volume flux alone (not shown). The pattern of temporal correlation between the SLA field and observed anomalies of volume-weighted temperature of AW transports (Fig. 4b) is distinct from the relationship with AW volume flux (compare Fig. 4a). It emphasizes SLA in the North Atlantic subpolar gyre (SPG), with higher SLA in the SPG (i.e., a weaker gyre) associated with higher volume-weighted temperature and vice versa. Although correlations are high (r up to 0.69) in the SPG region, they are not statistically significant. The cause may be the low number of degrees of freedom, as the SLA in the SPG exhibits high temporal auto-correlation (see Fig. 4d discussed below).
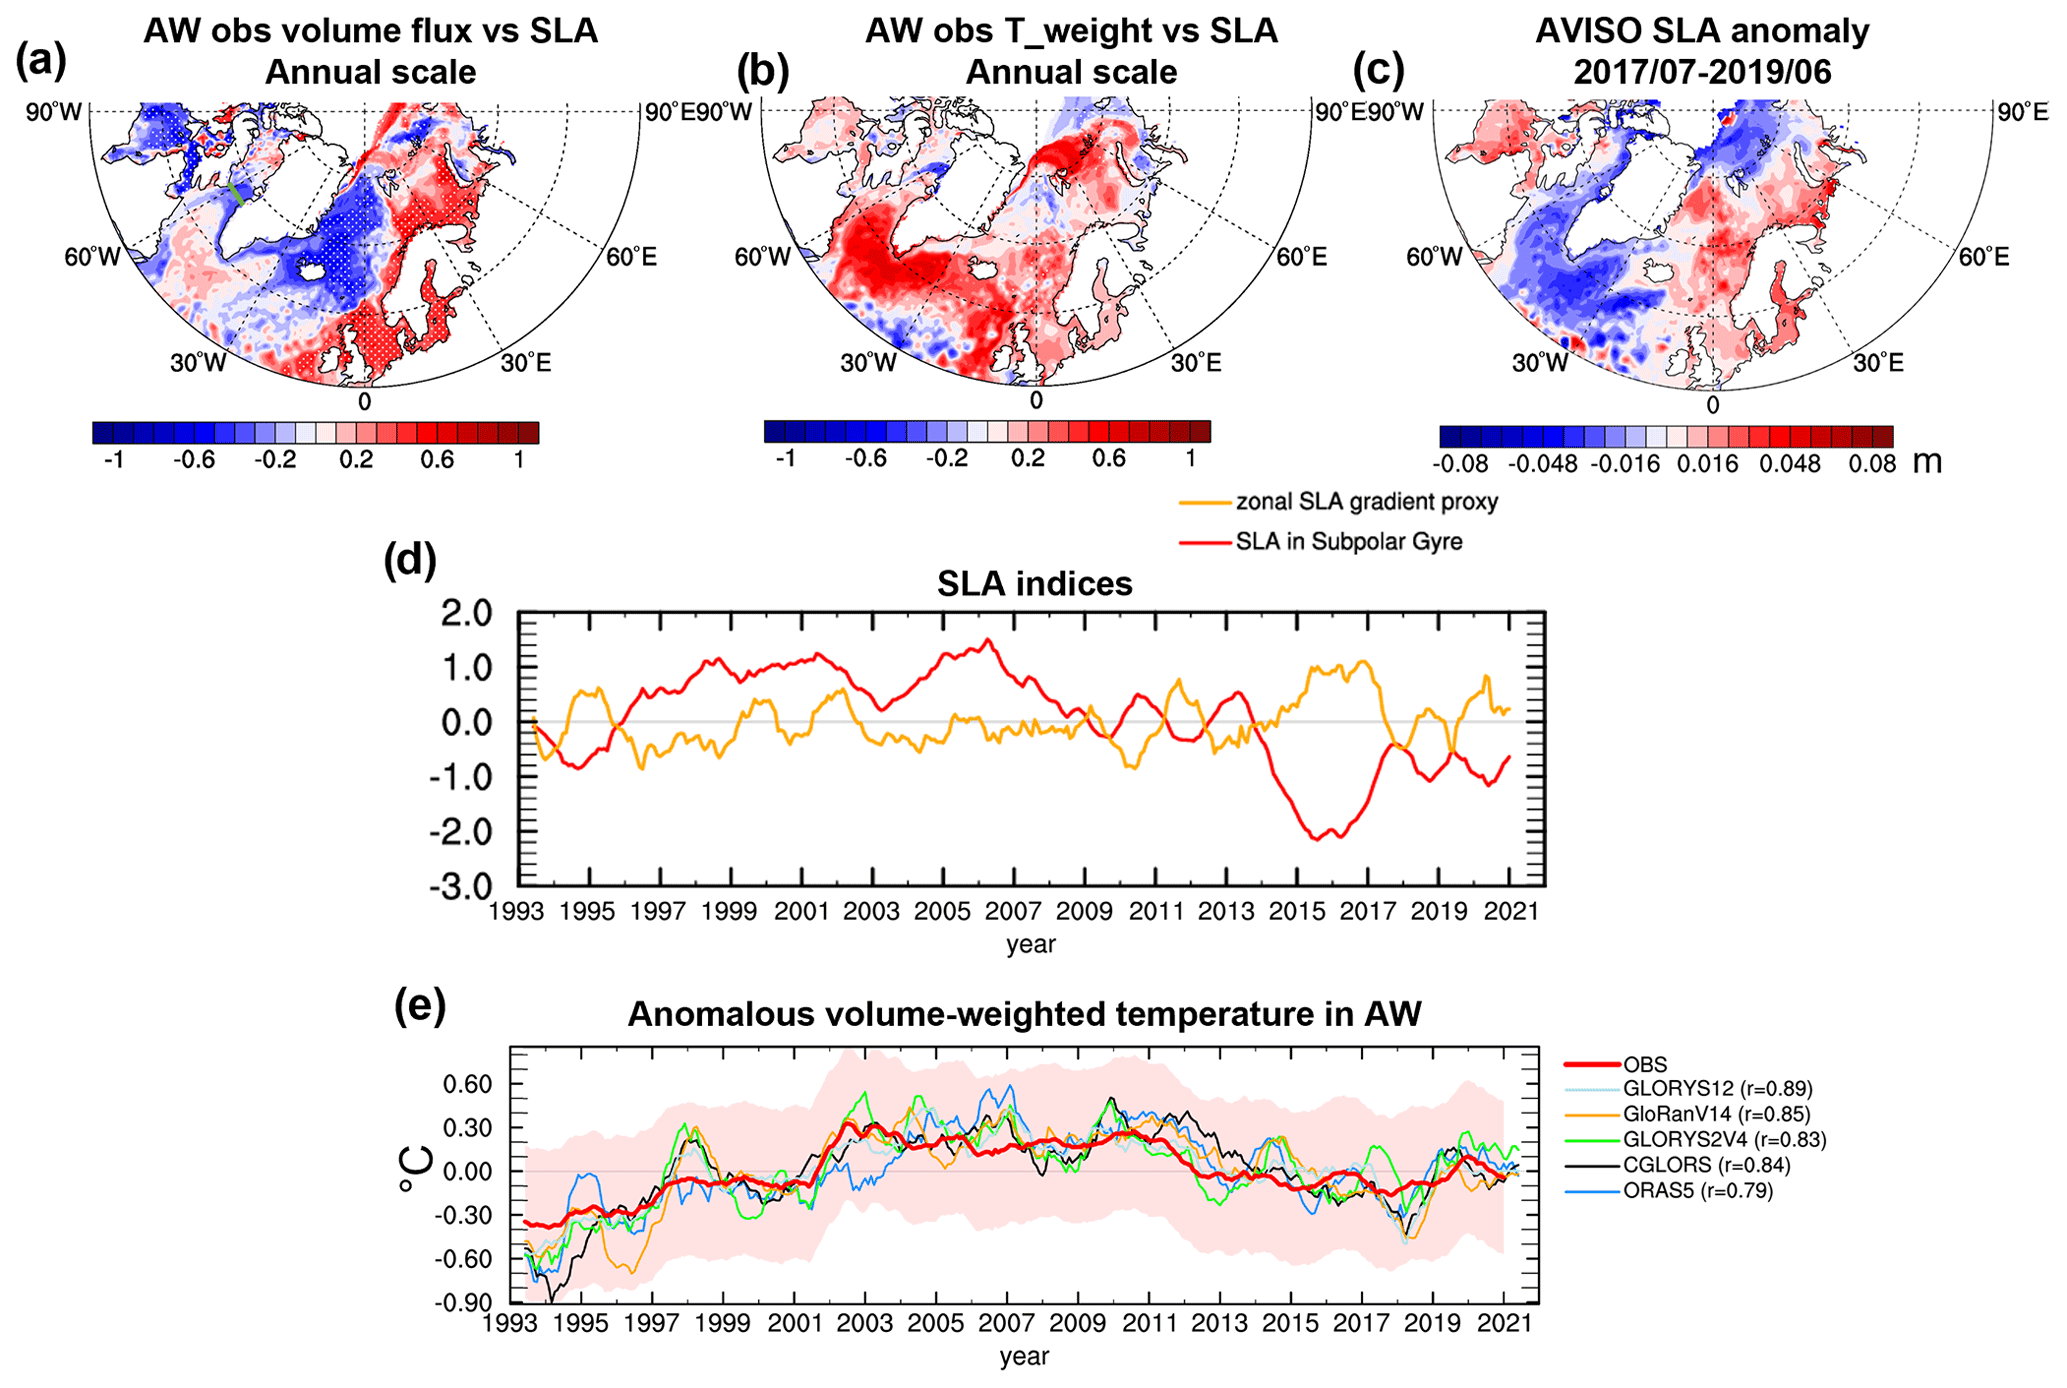
Figure 4Correlation of observation-based (a) AW volume flux and (b) AW flux-weighted temperature with SLA with a 12-monthly smoother applied. (c) SLA anomaly in July 2017–June 2019. (d) Temporal evolution (standardized) of two SLA-based indices based on the zonal SLA gradient at GSR and the SLA in the SPG region. (e) Temporal evolution of volume-weighted temperature (T_weight) anomalies of Atlantic waters at the GSR (red shading indicates ±1 standard error in the observational data, and temporal correlations of reanalyses with observations are provided in the legend). Stippling in (a) and (b) denotes statistically significant correlations on the 95 % confidence level.
Actual SLA anomalies averaged over July 2017–June 2019 (Fig. 4c) indicate a weakened zonal SLA gradient at the GSR, albeit not very strongly pronounced, and anomalously low SLA in the SPG region. According to the correlation patterns discussed above, these two features suggest reduced AW volume flux (as suggested by patterns in Fig. 4a) and anomalously low AW volume-weighted temperatures (as suggested by patterns in Fig. 4b). We also note the positive SLA anomalies north of the GSR with a maximum in the central Nordic Seas.
To put these results in context, we define two SLA-based indices (shown in Fig. 4d) from the correlation patterns found in Fig. 3a and b. The similarity of the correlations in Fig. 4a to the correlations between total OHT at the GSR and SLA shown in M. Mayer et al. (2022) reinforces use of their gradient-based index (i.e., standardized SLA difference between 58–60∘ N, 2–0∘ W and 63–67∘ N, 20–15∘ W). This index is correlated with AW volume flux anomalies (r = 0.62 for observed transports, ranging from 0.47 to 0.70 for reanalyses, which is statistically significant in all cases). The second index uses spatial SLA averages in the North Atlantic region (55–60∘ N and 40–15∘ W) as an inverse proxy for SPG strength. This index is correlated with anomalies of volume-weighted temperatures of AW transports. The two indices in Fig. 4d show different characteristics, with the SPG index varying on decadal timescales, while the gradient index shows stronger interannual variations. The SPG index has been negative since ∼ 2014, which suggests a strong SPG and lower inflow temperatures in recent years, in agreement with results by Hátún and Chafik (2018). This SPG index exhibits two minima during the July 2017–June 2019 period, although these are not extreme relative to the entire time series.
Figure 4e shows volume-weighted temperatures of AW waters from different products and confirms their overall decrease in recent years. Comparison with the SPG index in Fig. 4d suggests a generally delayed response of volume-weighted temperature in Atlantic inflow water at the GSR to SPG strength. Lagged correlation analysis indeed suggests positive correlations peaking (at values around 0.3 to 0.5, depending on the dataset) when temperatures are lagging the SPG index ∼ 2–3 years (not shown), but the correlations are not significant due to the high auto-correlation of time series.
Reanalysis-based oceanic transports show generally good agreement with observations on the scale of single branches of the GSR, in terms of both mean and variability in volume and heat fluxes. There is some indication that the higher-resolution products have a better representation of AW inflow in the I-F and F-S branches. All considered products underestimate net heat flux into the Arctic Mediterranean. The magnitude of the low bias is correlated with the strength of AW volume flux, but a warm bias in OW and cold bias in Davis Strait inflow further add to the found net heat flux bias. We reiterate that reanalysis-based and observational transport estimates are obtained in different ways (closed line integrations versus measurements from 11 branches with an inverse model applied), but, as elaborated in Sect. 2, we deem this a fair and robust approach for an intercomparison. The energy-budget-based estimate from M. Mayer et al. (2022) suggests even higher net heat flux than oceanic observations, which confirms the underestimation of heat transports by the ocean reanalyses. A much smaller discrepancy was found in an analogous comparison of observed oceanic transports into the central Arctic and an energy-budget-based estimate (Mayer et al., 2019), potentially reflecting the different observational strategies in Fram Strait and the Barents Sea Opening compared to the GSR (see, e.g., Dickson et al., 2008) or potential biases in the employed energy budget fields over the Nordic Seas.
All reanalyses with data assimilation and observations show a pronounced reduction in OHT during the 2-year period July 2017–June 2019, with some recovery after that. Comparison of observed SLA patterns during this period with statistical relationships between SLA and oceanic transports suggests that this reduction arose from a combination of interannual- (i.e., reduced zonal SLA gradient at the GSR) and decadal-scale changes (i.e., strong SPG in recent years). Another potential factor contributing to the OHT reduction during July 2017–June 2019 may have been the positive SLA anomalies centered in the Nordic Seas (Fig. 4c), which Chatterjee et al. (2018) have related to a weakened gyre circulation in the Nordic Seas and may have contributed to the weakened AW inflow as well.
Our results also reveal a delayed response of AW inflow temperatures to SPG strength. This is consistent with earlier studies finding anti-correlation between SPG strength and GSR heat transport (Häkkinen et al., 2011; Hátún et al., 2005). Specifically, the generally weaker SPG during ∼ 1997 and ∼ 2014 (with more pronounced minima in 1997–1998, 2010–2011, and 2003–2006; see Hátún and Chafik, 2018) was associated with warm inflow temperatures and stronger OHT after 2001 (Tsubouchi et al., 2021). After that point, the SPG strengthened and the inflow temperatures declined, which is also consistent with generally reduced oceanic heat transports in recent years.
The presented results indicate that decadal predictions of the SPG strength, which have been shown to exhibit skill (e.g., Robson et al., 2018; Borchert et al., 2021), may also allow us to infer near-term trends in OHT across the GSR. Another implication is that the strong interannual-to-decadal variability in OHT across the GSR hampers detection of longer-term (forced and unforced) trends in observed OHT, an aspect in which climate simulations show large spread (Burgard and Notz, 2017). Continued in situ monitoring of OHT, complemented with reanalysis efforts, is thus needed to provide observationally constrained time series of sufficient length for climate model validation.
The data products used in this article, as well as their names, availability, and documentation, are summarized in Table 1.
MM and TT conceptualized the study. All co-authors were involved with data preparation and analysis, as well as interpretation of results. MM prepared the manuscript with contributions from all co-authors.
The contact author has declared that none of the authors has any competing interests.
Publisher's note: Copernicus Publications remains neutral with regard to jurisdictional claims in published maps and institutional affiliations.
The Iceland–Faroe branch and Faroe Bank Channel overflow data collections received funding from the Danish Ministry of Climate, Energy and Utilities through its climate support program to the Arctic. The Denmark Strait overflow time series was generated by the Institute of Oceanography, Hamburg, and the Marine and Freshwater Research Institute (Iceland). Observational data collection was further supported through funding from Nordic WOCE, VEINS, MOEN, ASOF-W, NACLIM, RACE II, RACE-Synthese, THOR, AtlantOS, and Blue-Action (EU Horizon 2020 grant agreement no. 727852).
This research has been supported by the Austrian Science Fund (grant no. P33177) and Copernicus Marine Service (grant no. 21003-COP-GLORAN Lot 7).
This paper was edited by Gilles Garric and reviewed by two anonymous referees.
Asbjørnsen, H., Årthun, M., Skagseth, Ø., and Eldevik, T.: Mechanisms of ocean heat anomalies in the Norwegian Sea, J. Geophys. Res.-Oceans, 124, 2908–2923, 2019.
Berx, B., Hansen, B., Østerhus, S., Larsen, K. M., Sherwin, T., and Jochumsen, K.: Combining in situ measurements and altimetry to estimate volume, heat and salt transport variability through the Faroe–Shetland Channel, Ocean Sci., 9, 639–654, https://doi.org/10.5194/os-9-639-2013, 2013.
Borchert, L. F., Menary, M. B., Swingedouw, D., Sgubin, G., Hermanson, L., and Mignot, J.: Improved decadal predictions of North Atlantic subpolar gyre SST in CMIP6, Geophys. Res. Lett., 48, e2020GL091307, https://doi.org/10.1029/2020GL091307, 2021.
Buckley, M. W. and Marshall, J.: Observations, inferences, and mechanisms of the Atlantic Meridional Overturning Circulation: A review, Rev. Geophys., 54, 5–63, 2016.
Burgard, C. and Notz, D.: Drivers of Arctic Ocean warming in CMIP5 models, Geophys. Res. Lett., 44, 4263–4271, 2017.
Chatterjee, S., Raj, R. P., Bertino, L., Skagseth, Ø., Ravichandran, M., and Johannessen, O. M.: Role of Greenland Sea gyre circulation on Atlantic water temperature variability in the Fram Strait, Geophys. Res. Lett., 45, 8399–8406, 2018.
Dee, D. P., Uppala, S. M., Simmons, A. J., Berrisford, P., Poli, P., Kobayashi, S., Andrae, U., Balmaseda, M. A., Balsamo, G., Bauer, P., Bechtold, P., Beljaars, A. C. M., van de Berg, L., Bidlot, J., Bormann, N., Delsol, C., Dragani, R., Fuentes, M., Geer, A. J., Haimberger, L., Healy, S. B., Hersbach, H., Hólm, E. V., Isaksen, L., Kållberg, P., Köhler, M., Matricardi, M., McNally, A. P., Monge-Sanz, B. M., Morcrette, J.-J., Park, B.-K., Peubey, C., de Rosnay, P., Tavolato, C., Thépaut, J.-N., and Vitart, F.: The ERA-Interim reanalysis: Configuration and performance of the data assimilation system, Q. J. Roy. Meteor. Soc., 137, 553–597, 2011.
Desportes, C., Garric, G., Régnier, C., Drévillon, M., Parent, L., Drillet, Y., Masina, S., Storto, A., Mirouze, I., Cipollone, A., Zuo, H., Balmaseda, M., Peterson, D., Wood, R., Jackson, L., Mulet, S., Grenier, E., and Gounou, A.: EU Copernicus Marine Service Quality Information Document for the Global Ocean Ensemble Physics Reanalysis, GLOBAL_REANALYSIS_PHY_001_031, Issue 1.1, Mercator Ocean International, https://catalogue.marine.copernicus.eu/documents/QUID/CMEMS-GLO-QUID-001-031.pdf (last access: 31 March 2023), 2022.
Dickson, R., Meincke, J., and Rhines, P.: Arctic-Subarctic Ocean Fluxes: Defining the Role of the Northern Seas in Climate, Springer, Dordrecht, the Netherlands, ISBN 978-1-4020-6774-7, 2008.
Drévillon, M., Lellouche, J.-M., Régnier, C., Garric, G., Bricaud, C., Hernandez, O., and Bourdallé-Badie, R.: EU Copernicus Marine Service Quality Information Document for the Global Ocean Physics Reanalysis, GLOBAL_REANALYSIS_PHY_001_030, Issue 1.6, Mercator Ocean International, https://catalogue.marine.copernicus.eu/documents/QUID/CMEMS-GLO-QUID-001-030.pdf (last access: 31 March 2023), 2022a.
Drévillon, M., Fernandez, E., and Lellouche, J.-M.: EU Copernicus Marine Service Product User Manual for the Global Ocean Physics Reanalysis, GLOBAL_REANALYSIS_PHY_001_030, Issue 1.4, Mercator Ocean International, https://catalogue.marine.copernicus.eu/documents/PUM/CMEMS-GLO-PUM-001-030.pdf (last access: 31 March 2023), 2022b.
Eldevik, T., Nilsen, J. E. Ø., Iovino, D., Anders Olsson, K., Sandø, A. B., and Drange, H.: Observed sources and variability of Nordic seas overflow, Nat. Geosci., 2, 406–410, 2009.
EU Copernicus Marine Service Product: Global Ocean Ensemble Physics Reanalysis v2, Mercator Ocean International [data set], https://doi.org/10.48670/moi-00024, 2022a.
EU Copernicus Marine Service Product: Global Ocean Physics Reanalysis GLORYS12V1, Mercator Ocean International [data set], https://doi.org/10.48670/moi-00021, 2022b.
EU Copernicus Marine Service Product: Global Ocean Gridded L 4 Sea Surface Heights And Derived Variables Reprocessed 1993 Ongoing, Mercator Ocean International [data set], https://doi.org/10.48670/moi-00148, 2023.
Gounou, A., Drevillon, M., and Clavier, M.: EU Copernicus Marine Service Product User Manual for the Global Ocean Ensemble Physics Reanalysis, GLOBAL_REANALYSIS_PHY_001_031, Issue 1.1, Mercator Ocean International, https://catalogue.marine.copernicus.eu/documents/PUM/CMEMS-GLO-PUM-001-031.pdf (last access: 31 March 2023), 2022.
Good, S. A., Martin, M. J., and Rayner, N. A.: EN4: Quality controlled ocean temperature and salinity profiles and monthly objective analyses with uncertainty estimates, J. Geophys. Res.-Oceans, 118, 6704–6716, 2013.
Häkkinen, S., Rhines, P. B., and Worthen, D. L.: Warm and saline events embedded in the meridional circulation of the northern North Atlantic, J. Geophys. Res., 116, C03006, https://doi.org/10.1029/2010JC006275, 2011.
Hansen, B. and Østerhus, S.: North atlantic–nordic seas exchanges, Prog. Oceanogr., 45.2, 109–208, 2000.
Hansen, B., Larsen, K. M. H., Hátún, H., Kristiansen, R., Mortensen, E., and Østerhus, S.: Transport of volume, heat, and salt towards the Arctic in the Faroe Current 1993–2013, Ocean Sci., 11, 743–757, https://doi.org/10.5194/os-11-743-2015, 2015.
Hansen, B., Húsgarð Larsen, K. M., Hátún, H., and Østerhus, S.: A stable Faroe Bank Channel overflow 1995–2015, Ocean Sci., 12, 1205–1220, https://doi.org/10.5194/os-12-1205-2016, 2016.
Hansen, B., Poulsen, T., Húsgarð Larsen, K. M., Hátún, H., Østerhus, S., Darelius, E., Berx, B., Quadfasel, D., and Jochumsen, K.: Atlantic water flow through the Faroese Channels, Ocean Sci., 13, 873–888, https://doi.org/10.5194/os-13-873-2017, 2017.
Hansen, B., Larsen, K. M. H., Olsen, S. M., Quadfasel, D., Jochumsen, K., and Østerhus, S.: Overflow of cold water across the Iceland–Faroe Ridge through the Western Valley, Ocean Sci., 14, 871–885, https://doi.org/10.5194/os-14-871-2018, 2018.
Hátún, H. and Chafik, L.: On the recent ambiguity of the North Atlantic subpolar gyre index, J. Geophys. Res.-Oceans, 123, 5072–5076, 2018.
Hátún, H., Sandø, A. B., Drange, H., Hansen, B., and Valdimarsson, H.: Influence of the Atlantic subpolar gyre on the thermohaline circulation, Science, 309, 1841–1844, https://doi.org/10.1126/science.1114777, 2005.
Iovino, D., Fogli, P. G., and Masina, S.: Evaluation of the CMCC global eddying ocean model for the Ocean Model Intercomparison Project (OMIP2), EGUsphere [preprint], https://doi.org/10.5194/egusphere-2023-469, 2023.
Jochumsen, K., Moritz, M., Nunes, N., Quadfasel, D., Larsen, K. M. H., Hansen, B., Valdimarsson, H., and Jónsson, S.: Revised transport estimates of the Denmark Strait overflow, J. Geophys. Res.-Oceans, 122, 3434–3450, https://doi.org/10.1002/2017JC012803, 2017 (data available at: https://www.cen.uni-hamburg.de/en/icdc/data/ocean/denmark-strait-overflow.htm, last access: 22 March 2023).
Jónsson, S. and Valdimarsson, H.: Water mass transport variability to the North Icelandic shelf, 1994–2010, ICES J. Mar. Sci., 69, 809–815, https://doi.org/10.1093/icesjms/fss024, 2012.
Liu, C., Allan, R. P., Mayer, M., Hyder, P., Desbruyères, D., Cheng, L., Xu, J., Xu, F., and Zhang, Y.: Variability in the global energy budget and transports 1985–2017, Clim. Dynam., 55, 3381–3396, 2020.
MacLachlan, C., Arribas, A., Peterson, K. A., Maidens, A., Fereday, D., Scaife, A. A., Gordon, M., Vellinga, M., Williams, A., Comer, R. E., Camp, J., Xavier, P., and Madec, G.: Global Seasonal forecast system version 5 (GloSea5): a high-resolution seasonal forecast system, Q. J. Roy. Meteor. Soc., 141, 1072–1084, https://doi.org/10.1002/qj.2396, 2015.
Mayer, J., Mayer, M., Haimberger, L., and Liu, C.: Comparison of Surface Energy Fluxes from Global to Local Scale, J. Climate, 35, 4551–4569, 2022.
Mayer, M., Haimberger, L., Pietschnig, M., and Storto, A.: Facets of Arctic energy accumulation based on observations and reanalyses 2000–2015, Geophys. Res. Lett., 43, 10420–10429, https://doi.org/10.1002/2016GL070557, 2016.
Mayer, M., Tietsche, S., Haimberger, L., Tsubouchi, T., Mayer, J., and Zuo, H.: An improved estimate of the coupled Arctic energy budget, J. Climate, 32, 7915–7934, 2019.
Mayer, M., Tsubouchi, T., von Schuckmann, K., Seitner, V., Winkelbauer, S., Haimberger, L.: Atmospheric and oceanic contributions to observed Nordic Seas and Arctic Ocean Heat Content variations 1993–2020, in: Copernicus Ocean State Report, Issue 6, J. Oper. Oceanogr., 15, s119–s126, https://doi.org/10.1080/1755876X.2022.2095169, 2022.
Muilwijk, M., Smedsrud, L. H., Ilicak, M., and Drange, H.: Atlantic Water heat transport variability in the 20th century Arctic Ocean from a global ocean model and observations, J. Geophys. Res.-Oceans, 123, 8159–8179, 2018.
Oort, A. H. and Yienger, J. J.: Observed interannual variability in the Hadley circulation and its connection to ENSO, J. Climate, 9, 2751–2767, 1996.
Østerhus, S., Woodgate, R., Valdimarsson, H., Turrell, B., de Steur, L., Quadfasel, D., Olsen, S. M., Moritz, M., Lee, C. M., Larsen, K. M. H., Jónsson, S., Johnson, C., Jochumsen, K., Hansen, B., Curry, B., Cunningham, S., and Berx, B.: Arctic Mediterranean exchanges: a consistent volume budget and trends in transports from two decades of observations, Ocean Sci., 15, 379–399, https://doi.org/10.5194/os-15-379-2019, 2019.
Pietschnig, M., Mayer, M., Tsubouchi, T., Storto, A., Stichelberger, S., and Haimberger: Volume transports and temperature distributions in the main Arctic Gateways: A comparative study between an ocean reanalysis and mooring-derived data, EarthArXiv [preprint], https://doi.org/10.31223/osf.io/5hg3z, 2018.
Pujol, M.-I.: EU Copernicus Marine Service Product User Manual for the Global Ocean Gridded L4 Sea Surface Heights And Derived Variables Reprocessed 1993 Ongoing, SEALEVEL_GLO_PHY_L4_ MY_ 008_047, Issue 7.0, Mercator Ocean International, https://catalogue.marine.copernicus.eu/documents/PUM/CMEMS-SL-PUM-008-032-068.pdf, last access: 31 March 2023, 2022
Pujol, M.-I., Taburel, G., and SL-TAC Team: EU Copernicus Marine Service Quality Information Document for the Global Ocean Gridded L4 Sea Surface Heights And Derived Variables Reprocessed 1993 Ongoing, SEALEVEL_GLO_PHY_L4_MY_008_047, Issue 8.2, Mercator Ocean International, https://catalogue.marine.copernicus.eu/documents/QUID/CMEMS-SL-QUID-008-032-068.pdf, last access: 31 March 2023.
Robson, J., Polo, I., Hodson, D. L., Stevens, D. P., and Shaffrey, L. C.: Decadal prediction of the North Atlantic subpolar gyre in the HiGEM high-resolution climate model, Clim. Dynam., 50, 921–937, 2018.
Rossby, T., Flagg, C., Chafik, L., Harden, B., and Søiland, H.: A direct estimate of volume, heat, and freshwater exchange across the Greenland-Iceland-Faroe-Scotland Ridge, J. Geophys. Res.-Oceans, 123, 7139–7153, https://doi.org/10.1029/2018JC014250, 2018.
Schauer, U. and Beszczynska-Möller, A.: Problems with estimation and interpretation of oceanic heat transport – conceptual remarks for the case of Fram Strait in the Arctic Ocean, Ocean Sci., 5, 487–494, https://doi.org/10.5194/os-5-487-2009, 2009.
Trenberth, K. E. and Fasullo, J. T.: Atlantic meridional heat transports computed from balancing Earth's energy locally, Geophys. Res. Lett., 44, 1919–1927, 2017.
Tsubouchi, T., Våge, K., Hansen, B., Larsen, K. M. H, Østerhus, S., Johnson, C., Jónsson, S., and Valdimarsson, H.: Increased ocean heat transport into the Arctic Mediterranean over the period 1993–2016, NMDC [data set], http://metadata.nmdc.no/metadata-api/landingpage/0a2ae0e42ef7af767a920811e83784b1 (last access: 21 March 2023), 2020.
Tsubouchi, T., Våge, K., Hansen, B., Larsen, K. M. H., Østerhus, S., Johnson, C., Jónsson, S., and Valdimarsson, H.: Increased ocean heat transport into the Nordic Seas and Arctic Ocean over the period 1993–2016, Nat. Clim. Change, 11, 21–26, 2021.
Tsujino, H., Urakawa, S., Nakano, H., Small, R. J., Kim, W. M., Yeager, S. G., Danabasoglu, G., Suzuki, T., Bamber, J. L., Bentsen, M., Böning, C. W., Bozec, A., Chassignet, E. P., Curchitser, E., Boeira Dias, F., Durack, P. J., Griffies, S. M., Harada, Y., Ilicak, M., Josey, S. A., Kobayashi, C., Kobayashi, S., Komuro, Y., Large, W. G., Le Sommer, J., Marsland, S. J., Masina, S., Scheinert, M., Tomita, H., Valdivieso, M., and Yamazaki, D.: JRA-55 based surface dataset for driving ocean–sea-ice models (JRA55-do), Ocean Model., 130, 79–139, 2018.
Winkelbauer, S., Mayer, M., Seitner, V., Zsoter, E., Zuo, H., and Haimberger, L.: Diagnostic evaluation of river discharge into the Arctic Ocean and its impact on oceanic volume transports, Hydrol. Earth Syst. Sci., 26, 279–304, https://doi.org/10.5194/hess-26-279-2022, 2022.
Woodgate, R. A.: Increases in the Pacific inflow to the Arctic from 1990 to 2015, and insights into seasonal trends and driving mechanisms from year-round Bering Strait mooring data, Prog. Oceanogr., 160, 124–154, https://doi.org/10.1016/j.pocean.2017.12.007, 2018 (data available at: http://psc.apl.washington.edu/HLD/Bstrait/bstrait.html, last access: 22 March 2023).