the Creative Commons Attribution 4.0 License.
the Creative Commons Attribution 4.0 License.
 | 27 Sep 2023 | OSR7 | Chapter 3.2
Characterization of the organic vs. inorganic fraction of suspended particulate matter in coastal waters based on ocean color radiometry remote sensing
Hubert Loisel
Lucile Duforêt-Gaurier
Trung Kien Tran
Daniel Schaffer Ferreira Jorge
François Steinmetz
Antoine Mangin
Marine Bretagnon
Odile Hembise Fanton d'Andon
Knowledge of the organic and inorganic particulate fraction of suspended material in coastal waters is essential for the study of particle dynamics and biogeochemical cycles in these complex and highly variable environments. Thanks to the availability of appropriate spatial sensors and to the considerable improvements in algorithms dedicated to the satellite observation of coastal waters from ocean color radiometry (OCR) achieved in the last 2 decades, various optical and biogeochemical parameters can now be routinely monitored over coastal waters. Here we show that a proxy for particulate composition (PPC) can be estimated from OCR observations. The present algorithm, based on a neural network approach, has been validated using a broad range of biogeochemical data collected in various contrasted coastal waters and has been applied to MERIS observations over the global coastal ocean at a 1 km × 1 km spatial resolution from 2002 to 2012. The relevance of the temporal occurrence of PPC in a given water pixel has been illustrated over the global coastal ocean, and its pertinence has been discussed in depth for the English Channel and the southern North Sea, which are characterized by a well-documented variability in suspended particulate matter composition. The present algorithm can directly be applied to all OCR sensors.
- Article
(3748 KB) - Full-text XML
- BibTeX
- EndNote


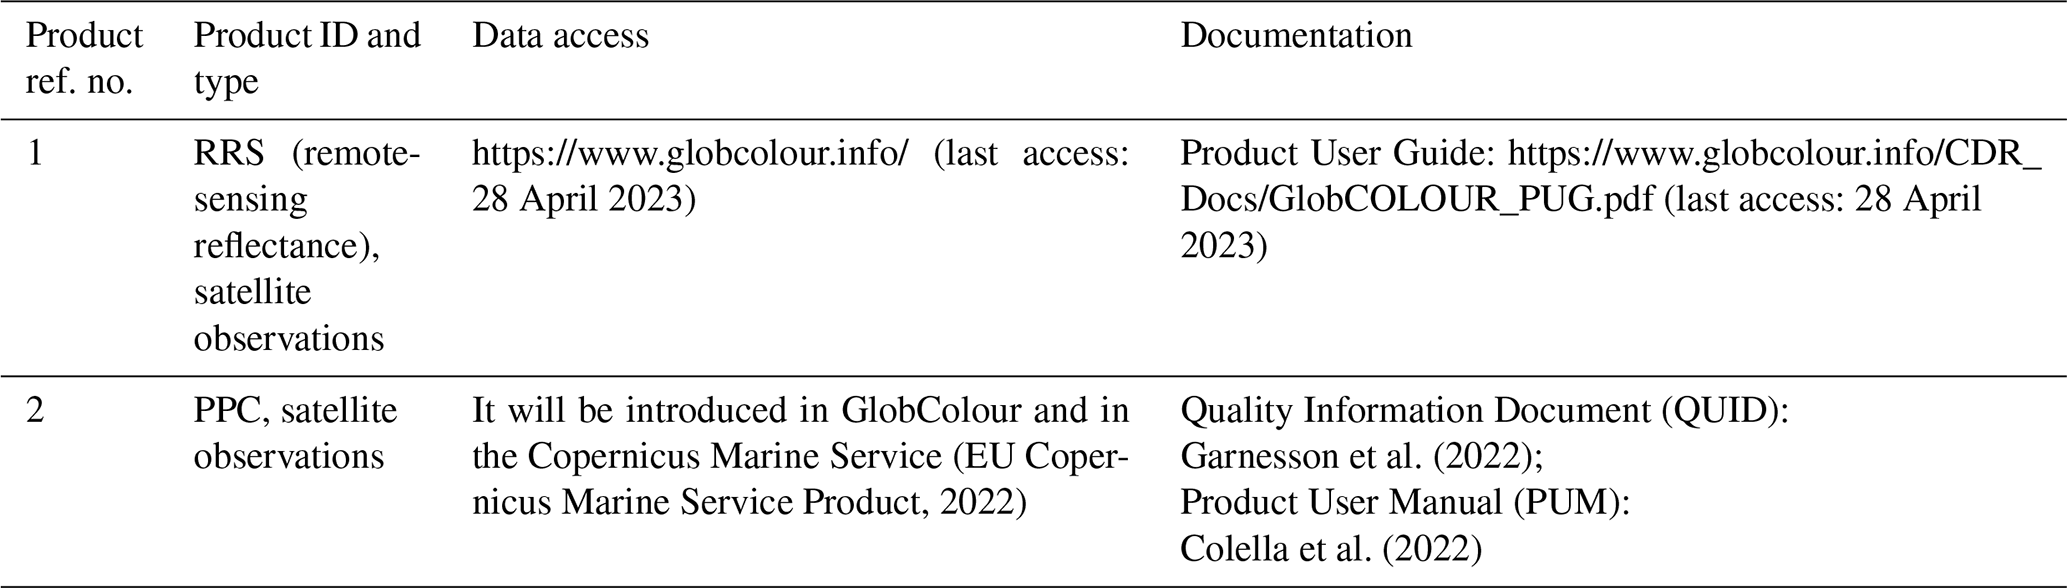
Table 1CMEMS and non-CMEMS products used in this study, including information on data documentation.
Water quality parameters display large spatiotemporal variability in coastal waters as these areas are the location of strong coupling between aquatic and terrestrial systems and are under pressure from great natural and anthropogenic forcing. The characterization of the spatiotemporal distribution of biological, biogeochemical, and physical parameters in coastal waters is of fundamental importance for a variety of applications dedicated to coastal management, which often involves economic interests, and for improving our understanding of the dynamics of the coastal ecosystems and their associated biogeochemical cycles.
Among the large set of water quality parameters sampled in coastal waters, the concentration of the suspended particulate matter (SPM) or equivalent parameters (e.g., the turbidity) has been intensively studied by the scientific community as a key parameter for understanding sediment transport, downstream sedimentation, and coastal geomorphological processes (Velegrakis et al., 1997; Lahet and Stramski, 2010; Vantrepotte et al., 2012; Loisel et al., 2014; Anthony et al., 2015; Marchesiello et al., 2019). For instance, combining SPM spatiotemporal products with wave data allows resuspension areas to be identified (Loisel et al., 2014). While the SPM spatiotemporal patterns provide relevant information on the suspended particulate dynamics, the variation in the composition (i.e., chemical nature) of SPM may disclose relevant information on the complex chemical, physical, and biological processes occurring in coastal waters. For instance, the portion of particulate organic matter (POM) in SPM is of particular interest when investigating the adsorption of trace elements on particles, abrupt changes in water quality due to pelagic or benthic blooms, or the fate of suspended matter between the water column and sediments. Modeling particulate transport requires specific modules coupled with hydrodynamical models. For example, in the SUBSTANCE module (Mengual et al., 2017), which can be coupled with CROCO, a French code built upon the well-known Regional Oceanic Modeling System (Shchepetkin and McWilliams, 2005), conservative and non-conservative (i.e., biological) particulate substances have to be defined by their own density and/or settling velocity, depending on the nature of the SPM (mineral vs. organic). The settling and flocculation processes, closely linked to the organic fraction of SPM and to the transport of particulate variables in the water column, are also considered in these modules.
Particulate organic carbon (POC) encompasses living (phytoplankton, heterotrophic bacteria, and viruses) and non-living (i.e., detritus) organic particles in suspension. Information on the SPM and POC variability represents crucial input for the initiation and validation of sediment transport models (Douillet et al., 2001; Ford and Fox, 2014; Wu et al., 2020) and biogeochemical models (Aumont et al., 2015). While the analysis of the variation in the absolute values of SPM and POC concentrations brings relevant information for our understanding of the carbon cycle and marine particulate dynamics in coastal waters, the dimensionless POC SPM ratio is used in many studies to describe the temporal variability in the particulate matter pool composition and origin (Coynel et al., 2005; Emmerton et al., 2008; Doxaran et al., 2012, 2015; Ehn et al., 2019), which is often related to variation in the regional environmental forcing (e.g., water discharge, phytoplankton bloom dynamics). This ratio is also used to better interpret the in situ optical measurements (Babin et al., 2003; Loisel et al., 2007; Woźniak et al., 2011; Doxaran et al., 2012; Neukermans et al., 2016; Reynolds et al., 2016; Reynolds and Stramski, 2019) and satellite ocean color radiometry (OCR) observations (Vantrepotte et al., 2011). From in situ data collected in the near-shore marine environment at Imperial Beach in California, Woźniak et al. (2010) set threshold values for the POC SPM ratio to identify changes in the particulate assemblage from the dominance of mineral particles (POC SPM <0.06) to the dominance of organic particles (POC SPM >0.25) and for mixed particulate assemblages (0.25< POC SPM <0.6). Neukermans et al. (2016) and Reynolds et al. (2016) followed the approach of Woźniak et al. (2010) to partition their Arctic seawater datasets into these three broad compositional classes.
Due to the high variability in the physical and biogeochemical processes occurring in coastal waters, traditional approaches such as oceanographic cruises and in situ time series, although essential, are very time-consuming and expensive, and it is sometimes uncertain whether they will yield meaningful results for the studied phenomena. Satellite observation of OCR is now well-recognized as a powerful tool to monitor the spatiotemporal distribution of biogeochemical and optical parameters in coastal waters (IOCCG, 2000; Loisel et al., 2013; IOCCG, 2018; Groom et al., 2019). Over the past decades, various OCR bio-optical algorithms have shown that SPM (Ahn et al., 2006; Nechad et al., 2010; Feng et al., 2014; Han et al., 2016; Balasubramanian et al., 2020; Pahlevan et al., 2022) and POC concentrations (Liu et al., 2015; Hu et al., 2016; Woźniak et al., 2016; Le et al., 2017; Tran et al., 2019) can be estimated over coastal waters.
The objective of this study is to provide a proxy for particulate composition (PPC) from remote sensing. For that purpose, the POC SPM ratio value is used as an intermediate product which allows the PPC, composed of three different classes (i.e., organically dominated, mineral-dominated, and mixed), to be estimated. We will re-examine the relevance of the POC SPM threshold values of Woźniak et al. (2010), developed to assess the organic vs. mineral fraction of the bulk particulate matter. This will be done through the examination of the relationship between the POC SPM ratio and the optical ratio, which is an indicator of the bulk particulate assemblage chemical composition (Twardowski et al., 2001; Loisel et al., 2007). An extensive in situ dataset collected in a biogeochemically contrasted environment has been gathered for that purpose. A neural network (NN) algorithm will be developed and validated against a large in situ dataset collected in various coastal environments to assess PPC from OCR. The new algorithm will then be applied to MERIS (MEdium Resolution Imaging Spectrometer) observations (2002–2012) over global coastal waters at a 1 km2 spatial resolution to discuss the significance of this new product. A specific focus will be on the English Channel and the southern North Sea, for which the temporal occurrence of the organic vs. inorganic fraction for a given pixel, built from 10-year temporal series, will be discussed.
2.1 Dataset description
2.1.1 In situ datasets
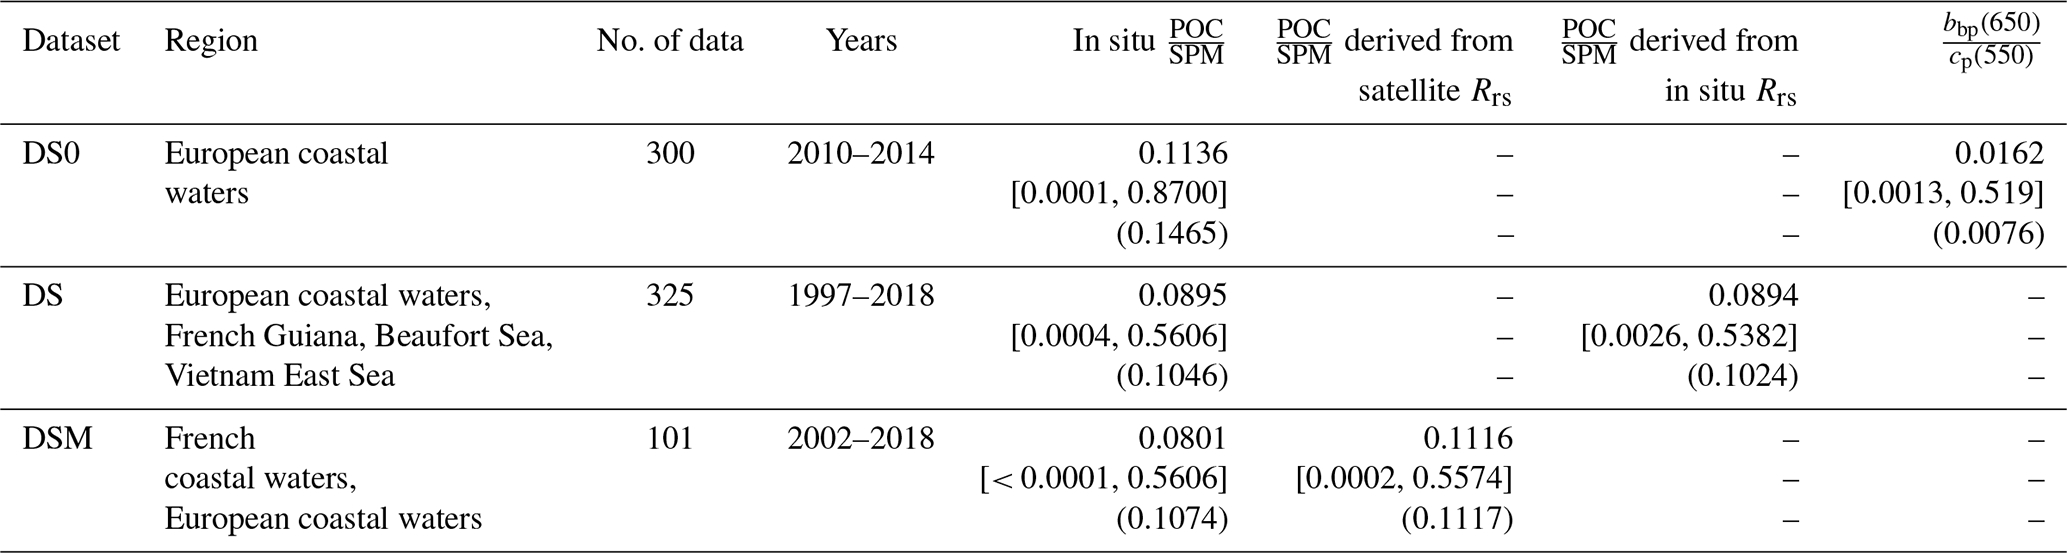
In situ measurements were collected between 1997 and 2014 in the southeastern Beaufort Sea (Bélanger et al., 2008), French Guiana (Vantrepotte et al., 2012, 2015), European coastal waters (the English Channel, North Sea, Bay of Biscay) (Lubac and Loisel, 2007; Lubac et al., 2008; Neukermans et al., 2012; Bonato et al., 2016; Novoa et al., 2017), and the South China Sea/Vietnam East Sea (Loisel et al., 2014, 2017). The sampling strategies, the field measurement protocols, and data processing are described in related papers. Measurements include concentrations of POC and SPM (µg L−1), remote-sensing reflectances (Rrs, sr−1), the particulate backscattering coefficient (bbp), and the particulate attenuation coefficient (cp) (m−1) at 650 nm. The samples cover a wide range of biogeochemical variability as POC and SPM concentrations span 4 and 3 orders of magnitude, respectively. The first in situ database, named DS0, includes 300 coincident POC, SPM, bbp, and cp measurements (Table 2). In Sect. 2.3, DS0 will be used to examine the empirical relationship between and POC SPM. The POC SPM ratio ranges between and . In comparison, Woźniak et al. (2010) collected 44 samples in the near-shore area off Imperial Beach (California) with POC SPM values between and . The second in situ database, referred to as DS, is made of 325 coincident POC, SPM, and Rrs measurements, with (Table 2). It will be used to test the performance of POC SPM estimates from the neural network algorithm (Sect. 3.1).
Table 2Information on the in situ data used in this study: mean [minimum, maximum] and standard deviation (SD).
2.1.2 The global coastal MERIS Rrs and match-up datasets
MERIS level 1 data were used to study the PPC spatial and temporal distribution (Sect. 3.2) and for the match-up exercise (Sect. 3.1). MERIS level 1 data (∼1 km pixel resolution) over the 2002–2012 period were processed using the polymer atmospheric correction algorithm (Steinmetz et al., 2011; Steinmetz and Ramon, 2018), which was adapted for coastal waters within the framework of the GlobCoast project. Following Mélin and Vantrepotte (2015), only pixels presenting a distance to the coast lower than 200 km and with a bottom depth not deeper than 4000 m are selected (Loisel et al., 2017). A third dataset, named DSM (for DataSet Match-up), was composed of collocated MERIS data with in situ data points of POC and SPM (Table 2), collected within the framework of the French Coastal Monitoring Network SOMLIT (Service d'Observation en Milieu Littoral, https://www.somlit.fr/en/, last access: 22 March 2023). The criteria considered for the match-up selection are described in Bailey and Werdell (2006). Due to the absence of organically dominated match-up data points using the MERIS sensor, complementary match-up data points were added to DSM by looking at SeaWiFS (Sea-Viewing Wide Field-of-View Sensor) match-up with DS. We only kept the match-up data points with a good Rrs retrieval (only possible using DS). For that purpose, only data points with Rrs(in situ) (satellite) values from 412 to 560 nm, below 0.5, or above 1.5 are selected. The DSM dataset is composed of 101 matched points after the application of these criteria. The POC SPM mean value is 0.0801 for DSM instead of 0.1136 and 0.0895 for DS0 and DS, respectively.
2.2 Algorithm development
Two different approaches were initially tested to estimate PPC from Rrs. For the first approach, SPM is estimated by the Han et al. (2016) algorithm (referred to as HA16) which consists of semi-analytical relationships between SPM and Rrs in the red or NIR bands, according to the level of turbidity. The typical band–ratio relationship using the red to blue–green bands is used to assess POC from the algorithm of Tran et al. (2019) (referred to as TR19). Once POC and SPM are derived, the POC SPM ratio is calculated, and PPC is estimated using the different threshold values (see Sect. 2.3). However, Tran et al. (2019) showed that POC concentration can be overestimated in the presence of mineral waters. The result is that the POC SPM ratio is also overestimated when mineral-dominated waters dominate (not shown). Moreover, the errors in both POC and SPM estimations are additive when the POC SPM ratio is finally calculated. To limit this error propagation, we focus on the development of a single algorithm to derive the POC SPM ratio from Rrs in one step.
For that purpose, a neural network approach has been selected as a second approach. We used a feed-forward network with log-sigmoid hidden neurons and linear output neurons coupled to a Levenberg–Marquardt algorithm allowing an efficient back propagation through the training procedure (Lv et al., 2018; Hagan et al., 1996). The DS dataset was randomly divided into three datasets to develop, train, and validate this NN. Overall, 60 % of the observations were used to construct and train the NN, 20 % were used for its validation, and 20 % were used to test its performance independently. The training and validation phases are performed jointly, allowing us to stop the training procedure when the generalization of the NN stops improving. We tested several combinations of Rrs bands (412, 443, 490, 510, 560, and 665 nm) to best predict the POC SPM ratio. The final NN architecture was best trained using Rrs at 412, 490, 510, and 560 nm as the input layer, two hidden layers (8 and 10 neurons), and one output layer (POC SPM ratio). The metrics used to evaluate the performance of the NN optimization are described in Portillo Juan and Negro Valdecantos (2022).
2.3 Determination of the organic, mineral, and mineral–organic mixed fraction
As previously explained, the POC SPM ratio is an indicator of the particle assemblage and can be used to partition in situ data into three water types as defined by Woźniak et al. (2010). In addition, some theoretical and field studies showed that the variability in the ratio can be related to the particle composition (Boss et al., 2004; Twardowski et al., 2001; Loisel et al., 2007; Duforêt-Gaurier et al., 2018). Low values are observed for a particle population dominated by low refractive-index material such as phytoplankton. In contrast, high values are generally observed in the presence of a relatively high concentration of inorganic particles. At 650 nm, cp is dominated by the scattering, and the optical ratio can be used instead of (Loisel et al., 2007).
The objective here is to re-examine the pertinence of the POC SPM threshold values of Woźniak et al. (2010) on a larger in situ coastal dataset (DS0) (covering a wider range of optical and biogeochemical variability) through the examination of the POC SPM to relationship. As expected, decreases when POC SPM increases, that is when we move from a mineral-dominated to an organically dominated environment, with values typically lower than 0.010–0.012 (Twardowski et al., 2001; Loisel et al., 2007) (Fig. 1). The regression line ( vs. POC SPM; black line) is plotted, and the estimated regression coefficients are indicated with their standard error (Fig. 1). The threshold values are first fixed according to the values (as a given range of values corresponds to a given range of the refractive index of the bulk particulate matter) and then adjusted, with a careful examination of each data point for which ancillary data (i.e., chlorophyll a, counted cells, phytoplankton to particulate absorption ratio, and Rrs spectra) are used to better characterize the bulk particulate matter. The first threshold value has been shifted to 0.08 (corresponding to a value of 0.012) to encompass data points collected in mineral-dominated environments (close to river mouths). An asymptote is reached at high POC SPM values (above 0.2) and concerns data points with low (below 0.075) values typical of phytoplankton-dominated environments. The new threshold value of POC SPM for organically dominated waters is set to 0.2 (i.e., ) to encompass in situ data points collected during bloom events. This value is, however, very similar to the value previously obtained by Woźniak et al. (2010) (0.25). Data points located along the asymptote are therefore associated with organically dominated waters.
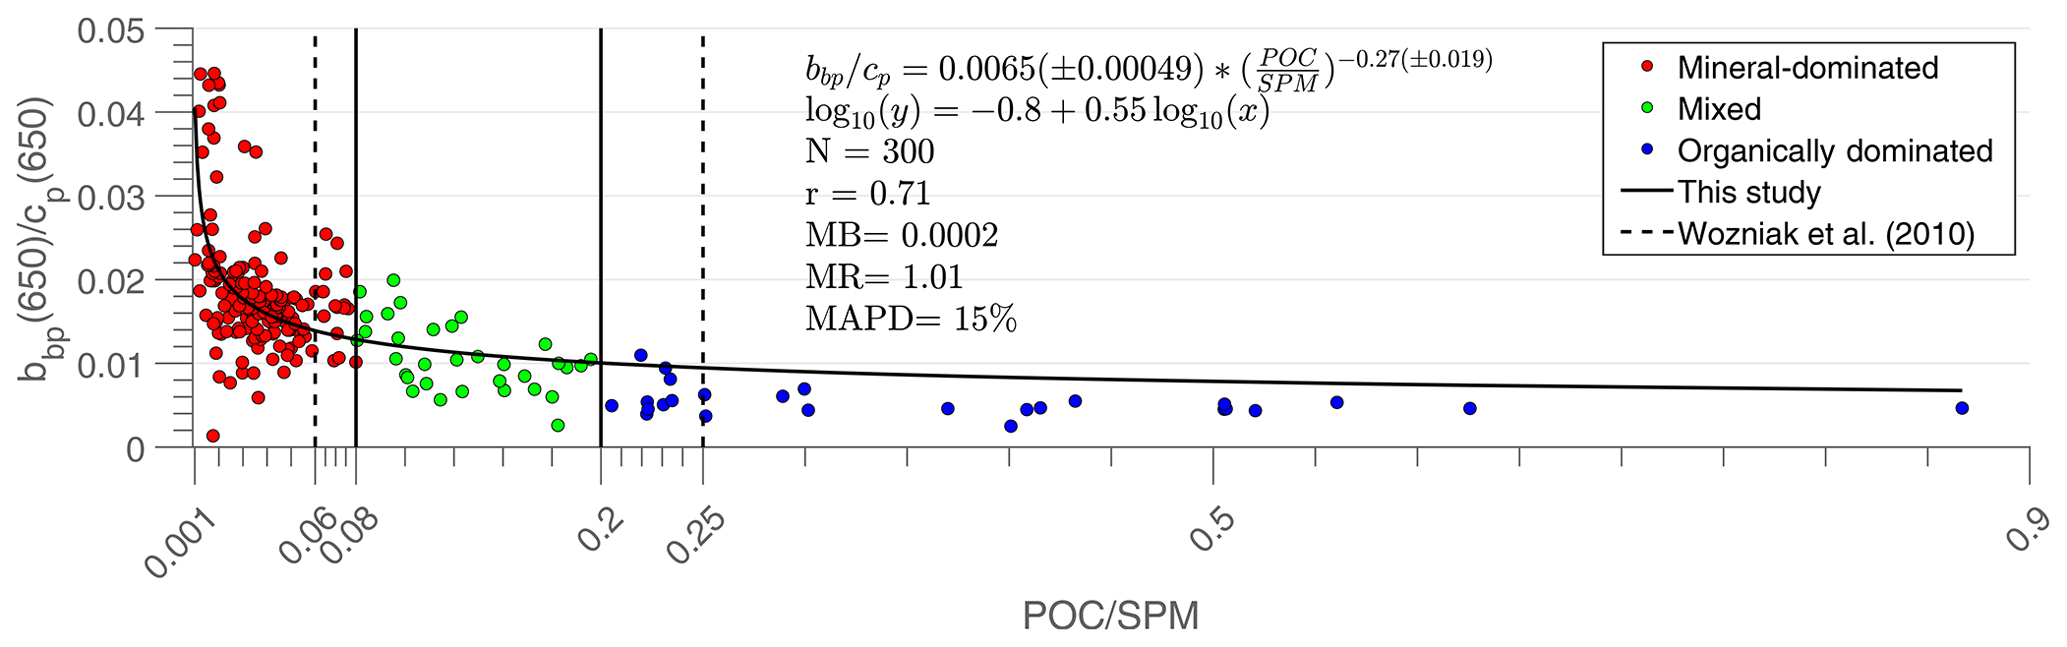
Figure 1Relationships between (650 nm) and POC SPM from DS0. The black curve is the power regression. The vertical dashed lines represent the thresholds delimiting the water types according to Woźniak et al. (2010). The vertical solid lines show the new thresholds defined in the present study. The linear regression (in log space) between derived (named y) and in situ (named x) is given, as are the regression coefficient (r), the median absolute percentage difference (MAPD), the median ratio (MR), and the mean bias (MB). These statistical indicators (MAPD, MR, and MB) are calculated in normal space as described in Jorge et al. (2021).
The thresholds are applied to monthly POC SPM values derived from MERIS data, and the frequency of dominance is computed for each pixel of the scene over the 10 years (2002–2012) as detailed below. A pixel geographically located at a given latitude and longitude is named the k pixel (k=1, Stot). Stot is the total number of pixels over the selected geographical area. For each k pixel, we computed the number of valid pixels () over the period that corresponds to 120 months (). The term “valid pixel” means a non-flag pixel for which the Rrs value is provided in order to derive POC SPM with the neural network. Then, for the k pixel, we calculate how many times the class i is identified over : is the class occurrence, and , or 3 with 1 for mineral-dominated, 2 for organically dominated, and 3 for mixed water classes. The frequency of dominance is defined as the ratio of the occurrence to the number of valid pixels:
Eq. (1) is repeated Stot times to compute the frequency of dominance over the whole scene and provide maps in Sect. 3.2.
3.1 Validation of the classification
In situ measurements of Rrs from DS are used as input for the neural network algorithm to test the performance of the estimation of algorithm-derived values, named NN POC SPM (Fig. 2a). The NN algorithm achieves a good performance over the whole range of POC SPM (Fig. 2a). The median absolute percentage difference (MAPD) is 24 %, the median ratio (MR) is 1.06, and the bias is 0.004. The slope of the type II (log-transformed) regression is 0.90. The same classification is obtained for 88.5 % of data points between the in situ and model-derived values. About 10.9 % of data points are misclassified in the adjacent group and only 0.62 % are misclassified in a non-adjacent group. SeaWiFS and MERIS match-ups on both the independent SOMLIT in situ dataset (for which no in situ Rrs values are available) and DS in situ data (for which in situ Rrs values are available) are shown in Fig. 2b. Compared to the results obtained using in situ measurements (Fig. 2a), the data points are much more scattered around the 1:1 line when POC SPM is derived from satellite Rrs (Fig. 2b). This strongly emphasizes the impact of atmospheric correction on PPC, which is a common feature of OCR products. In Fig. 2b, all mineral-dominated data are from the SOMLIT dataset. As the in situ Rrs values are not available for SOMLIT data, we cannot apply the criteria described in Sect. 2.1.2 to remove inaccurate satellite Rrs retrievals. Removing such Rrs values will certainly allow us to identify strongly misclassified patterns. In Fig. 2b, 68.4 % of mineral-dominated data, 44.4 % of mixed data, and 73.7 % of organically dominated data are well-classified. Due to atmospheric correction uncertainties, a proper estimation of POC SPM values from remote sensing is still very challenging, while the estimation of PPC can still be performed with a reasonable accuracy. Extra match-up data points, including both in situ Rrs and POC SPM measurements, are, however, needed to definitely support this conclusion.
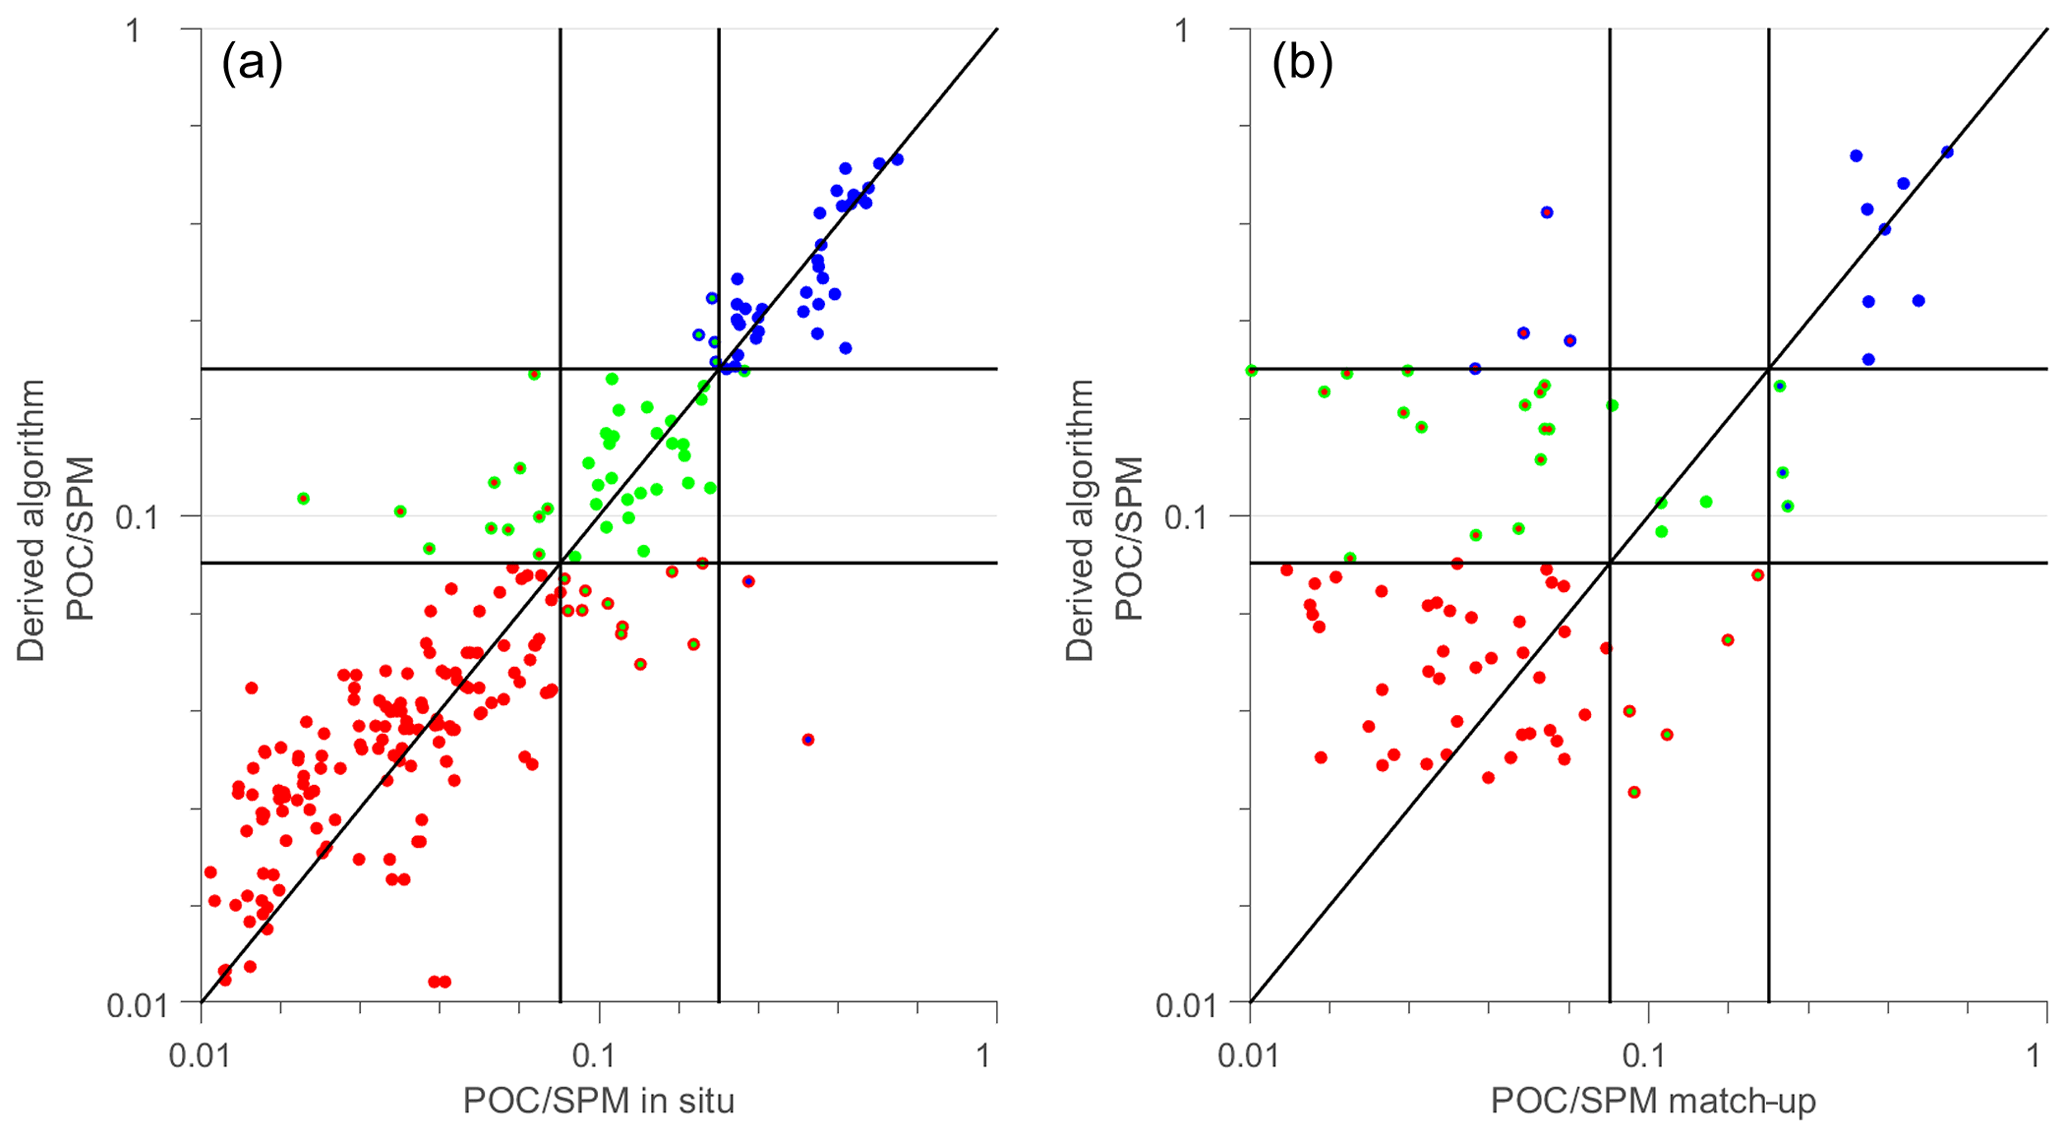
Figure 2Comparison of in situ and derived POC SPM from neural network algorithm (NN POC SPM) (a) for DS (i.e., in situ Rrs values are used by NN POC SPM) and (b) for DSM (i.e., satellite Rrs values are used by NN POC SPM). The dashed line is the 1:1 line. Red, blue, and green colors are for mineral-dominated, organically dominated, and mixed waters, respectively. For both panels, the vertical and horizontal solid lines indicate the thresholds (0.08 and 0.2) used to partition the water types. Dots are color-coded according to the values of the in situ POC SPM, whereas the circles are color-coded according to the values of POC SPM derived from NN. When circles and dots are of the same color, it means that the retrieved values belong to the same class as the in situ ones.
3.2 Global and regional PPC patterns
The PPC algorithm has been applied to MERIS monthly Rrs(λ) data over the 2002–2012 time period, and the maximum occurrence of PPC has been calculated over this 10-year time period as described in Sect. 2.3 (Fig. 3a). As expected, we observe a well-marked near-shore–off-shore gradient from mineral-dominated waters to organically dominated waters with a transition zone corresponding to mixed particulate assemblages. Large deltas and estuaries characterized by intense sediment discharge, such as the Amazon Estuary, Mekong Delta, Huanghe (Yellow River) Delta, Yangtze Estuary, or Ganges–Brahmaputra Delta, present a very high occurrence of mineral-dominated waters (70 %–90 %). These areas can extend much further from the river outlet, depending on the bathymetry and the surface currents, as for instance in the central part of the Yellow Sea at the Yangtze Estuary. Values of POC SPM of 0.12–0.15, depicting mix-dominated particulate assemblages, have been measured in the East China Sea region (124–126∘ E, 30–32∘ N) in great agreement with our present finding (Hung et al., 2007). The dominance of mineral-dominated waters is generally persistent throughout the considered time period as depicted by the relatively low (20 %–30 %) coefficient of variation observed at the outlet of these different estuaries and deltas (Fig. 3b). In contrast, at the Amazon and Yangtze estuaries and the Huanghe Delta, some off-shore areas with a high (70 %) coefficient of variation depict the impact of seasonal and interannual interactions between the continental (river and sediment discharges) and oceanic forcing (tide, wind, surface current, sub-mesoscale structures) and the bathymetry. For example, close interaction between the Amazon plume dominated by mineral particles and the retroflection of the North Brazil Current carrying oceanic particulate organic matter occurs in the region at the Amazon Estuary where the slope in the continental shelf drastically changes (Gensac et al., 2016; Varona et al., 2019), causing a significant temporal variation in the PPC. In contrast to the previously mentioned rivers and despite the Congo River being the world's second-largest river in terms of both drainage area and water discharge, only a small PPC signature (mainly organically dominated) can be seen at the outlet of its estuary (not visible in Fig. 3a), except in the coefficient of variation (Fig. 3b). This is coherent with the fact that the sediment discharge of the Congo River is very low, in contrast to the dissolved part of the discharge, and that most of the particulate assemble is organic (Coynel et al., 2005). A specific zoom on this area reveals the dominance of organic matter even at the outlet of the estuary, in good agreement with in situ data reported in Coynel et al. (2005).
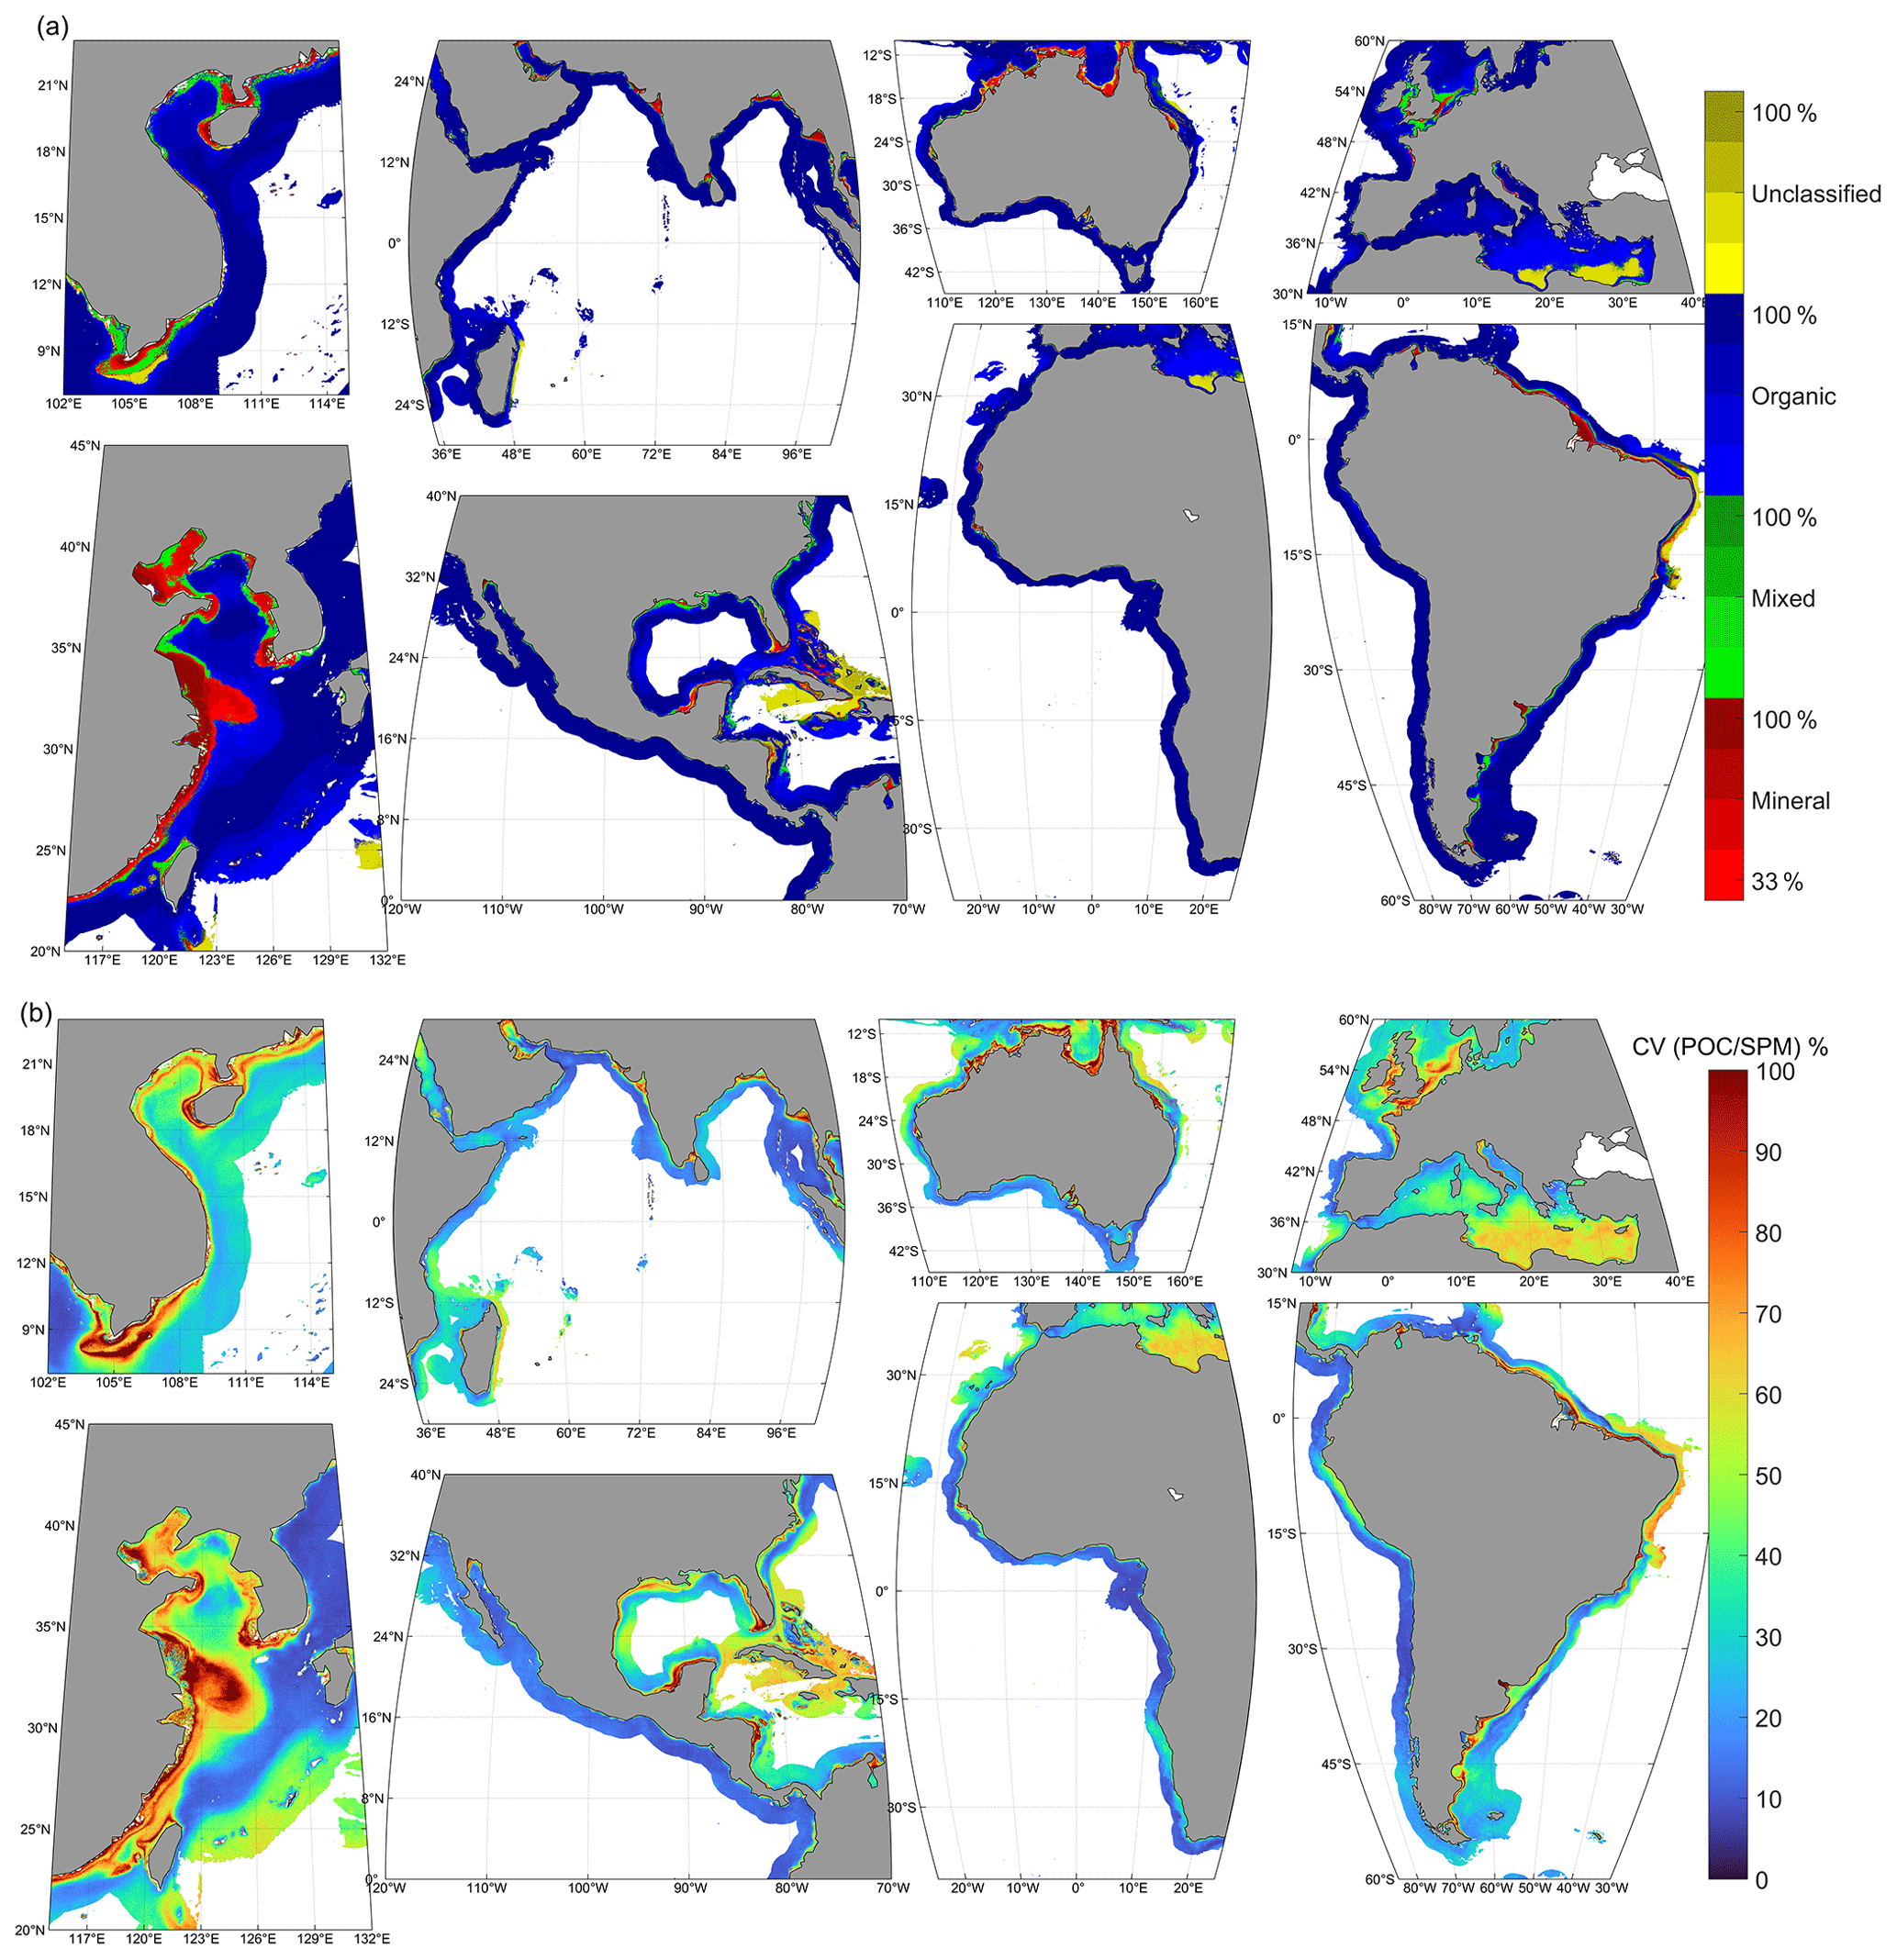
Figure 3(a) Frequency (%) of dominant water type (red for mineral-dominated, green for mixed, blue for organically dominated) over the MERIS time period of 2002–2012. The yellow color corresponds to unclassified pixels, which means pixels for which the retrieved value of POC SPM is non-valid (i.e., negative). (b) Coefficient of variation in POC SPM over the MERIS period of 2002–2012.
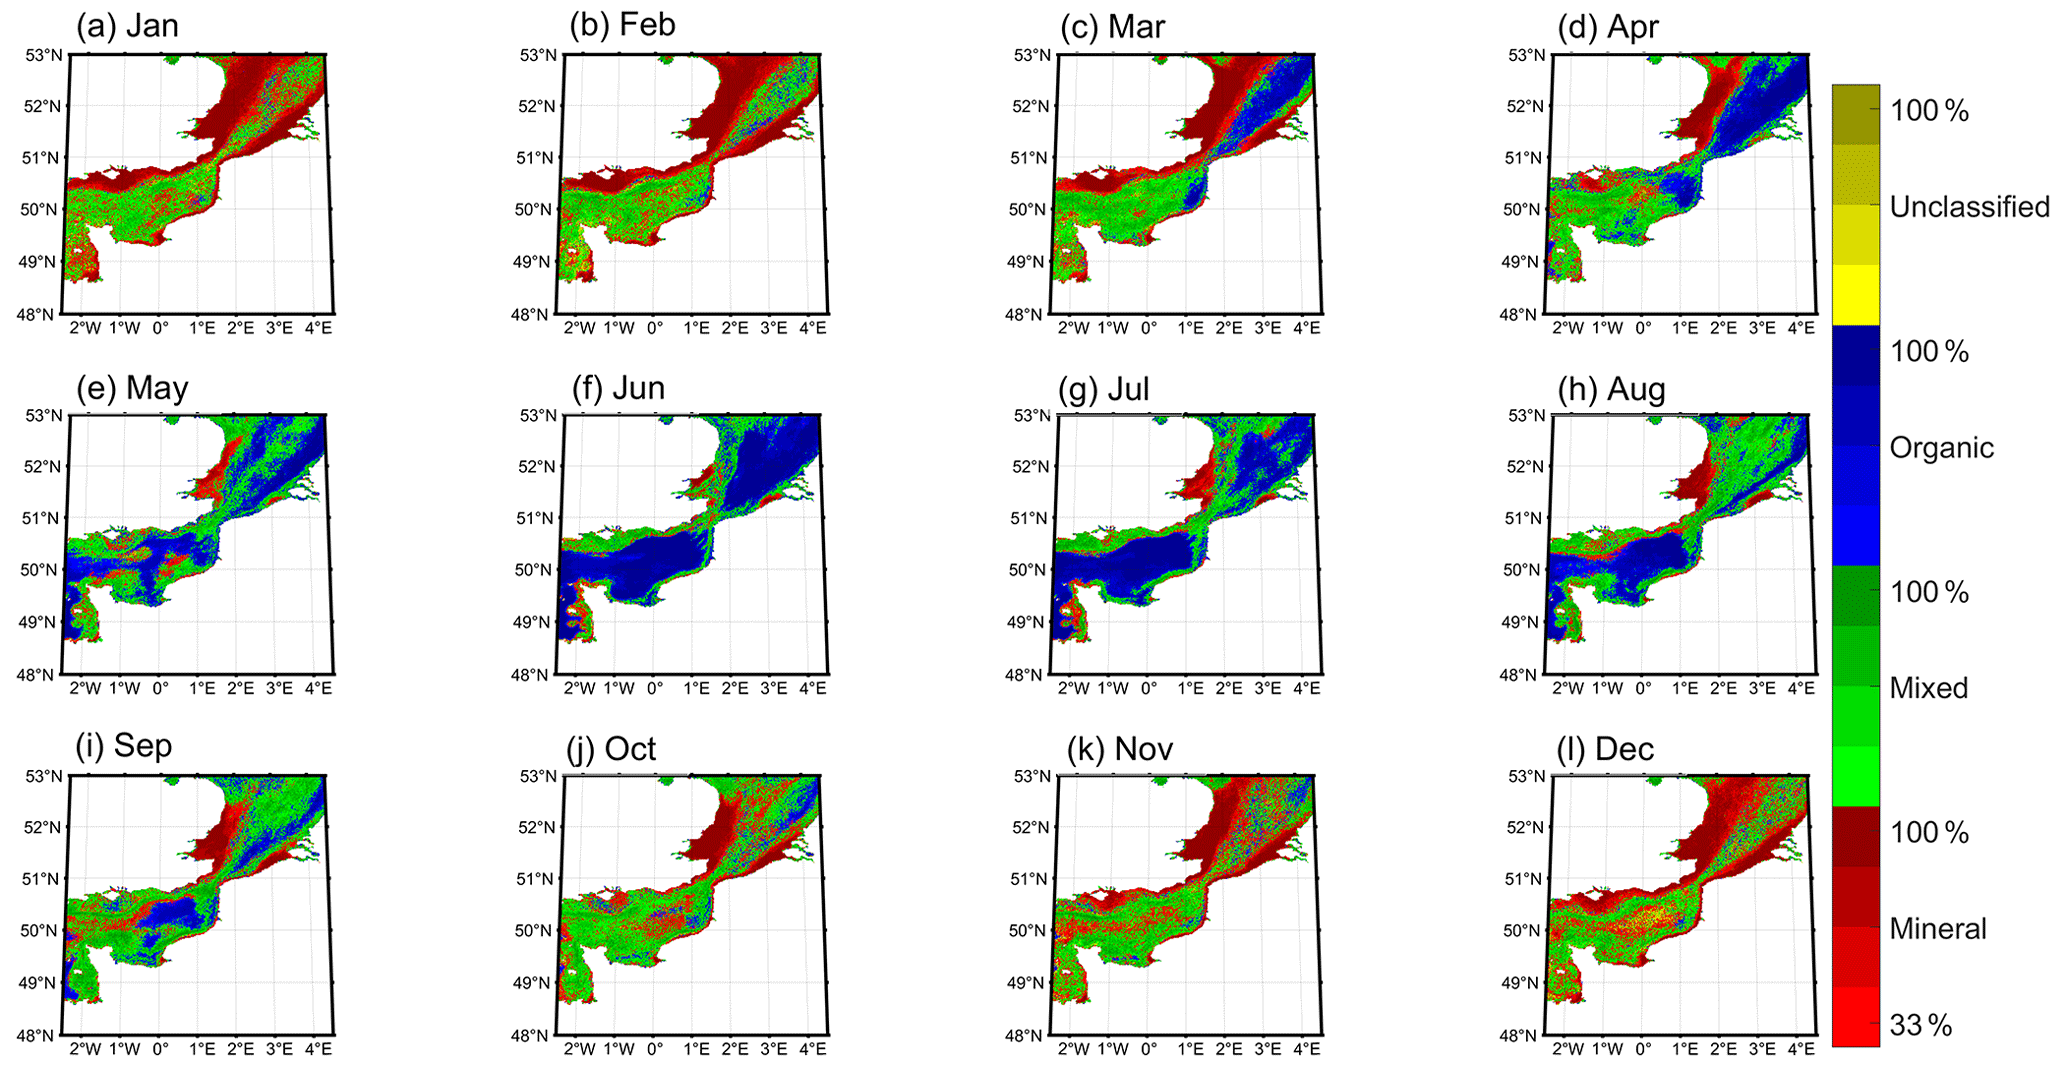
Figure 4Frequency of dominance (%) for mineral-dominated (red), mixed (green), organically dominated (blue), or unclassified (yellow) waters over the MERIS period of 2002–2012 in the eastern English Channel and the southern North Sea.
While an extensive investigation of the different spatiotemporal patterns presented in Fig. 3 are is beyond the scope of the present paper, a specific focus illustrating the pertinence of the PPC product is conducted over the eastern English Channel (EEC) and the southern North Sea (SNS), for which the biogeochemical and physical processes driving the suspended particulate matter composition are relatively well-documented. The eastern English Channel and southern North Sea coastal region is known for its strong hydrodynamics marked by intense tidal currents. This shallow-water region, therefore largely impacted by resuspension effects, is also largely influenced by freshwater discharges from different rivers, the most important ones being the Seine and the Somme along the French coast of the EEC and the Thames and the Scheldt along the SNS. Strong spring and early summer phytoplankton blooms of diatoms and Phaeocystis globosa occurred in this region at different times of the year, depending on the nutrient and light (i.e., season and turbidity level) availability (Breton et al., 2000; Antajan et al., 2004; Sazhin et al., 2007). For these different reasons, the composition of the suspended particulate matter in this area is strongly variable, as already stressed by different field studies based on optical and biogeochemical measurements (Loisel et al., 2007; Vantrepotte et al., 2007; Lubac et al., 2008). The monthly occurrence of each PPC class is in excellent agreement with our present knowledge of this area (Fig. 4). Between mid-fall and winter (from October to February), the particulate matter pool of the EEC and the SNS is characterized by mineral and mix-dominated assemblages, mainly due to sediment river inputs and resuspension effects from strong physical (i.e., waves) forcing (Lesourd et al., 2003; Lancelot et al., 2007; Gohin, 2011; Renosh et al., 2014). This is consistent with the results of Vantrepotte et al. (2012), who observed that the relative contribution of the particulate matter assemblage with a strong proportion of mineral particles increases significantly during the winter time. In March, organically dominated pixels appear in the SNS coastal region and at the Somme River area in the EEC. Then, while the organically dominated particle assemblage areas are developing in the SNS from March to July, similar particulate assemblages start developing from May to July in off-shore waters of the EEC and along the EEC coast from June. The timing of the development of organic matter areas in the EEC and the SNS is in perfect agreement with phytoplankton bloom dynamics in these regions, which first develop in the Bay of the Somme area and the SNS, followed by another bloom which develops south in the area of the Bay of the Seine (Brunet et al., 1996; Vantrepotte et al., 2007; Joint and Pomroy, 1993; Van der Zande et al., 2012; Gohin et al., 2019). Finally, areas covered by organically dominated pixels are at a maximum in June and July, and then mixed assemblages start developing in the northern part of the domain to fully cover the whole region in October. Mixed assemblages are more likely dominated by aggregates of mineral particles and detrital matter (non-living organic particles) which developed during the senescence of the bloom (Vantrepotte et al., 2007; Loisel et al., 2007; Gohin, 2011; Grattepanche et al., 2011).
The PPC can be used as an appropriate indicator for characterizing the nature of bulk suspended particulate matter from satellite OCR remote sensing. The MERIS spatiotemporal patterns of this new indicator are consistent with general features documented in the literature. Due to the visible bands used, common to all OCR sensors, the PPC algorithm can be applied to all OCR satellite sensors, allowing us to assess the long-term trend of suspended particulate matter over the global coastal ocean. The application of this algorithm to the satellite Copernicus Marine Environment Monitoring Service (CMEMS) data is underway to assess the different temporal patterns (seasonal, trend, and irregular) using the Census X-11 approach (Vantrepotte et al., 2011).
DS0, DS, and DSM can be obtained on request.
HL, as the recipient of most of the funding, proposed the idea of the work, gave permission to use data in LOG, was involved in the algorithm development and data analysis, and co-wrote the paper. LDG was involved in the algorithm development, supervised the analysis and visualization of the data, and was involved in paper organization and co-writing. TKT analyzed and visualized the in situ and satellite data, developed and tested the algorithms, and developed the codes to process images. DSFJ supported the development of the MATLAB-processed images, provided the final plots and statistics, and revised the paper. FS provided the Polymer algorithm to perform atmospheric corrections to process satellite images in coastal waters. AM, MB, and OHFd'A gave suggestions and comments.
The contact author has declared that none of the authors has any competing interests.
Publisher’s note: Copernicus Publications remains neutral with regard to jurisdictional claims in published maps and institutional affiliations.
This study was realized with support from the French Space Agency (CNES) through the COYOTE project (CNES/TOSCA program). MERIS data were processed within the framework of the GlobCoast project funded by the French Agence Nationale de la Recherche (grant no. ANR-11-BS56-0018). Some of the in situ measurements used in this study were collected from different cruises performed in Vietnam coastal waters, French Guiana, and the eastern English Channel through various projects funded by CNES. The authors are grateful to all the people that contributed to data provided by the Service d’Observation en Milieu Littoral (SOMLIT), INSU-CNRS. We also thank our many colleagues who participated in the collection of the various datasets cited in this study. We thank Arnaud Cauvin and Xavier Mériaux, who conducted field missions at LOG, processed field biogeophysical data, and were in charge of LOG database management. We express our gratitude to Roy Elhourany for his advice concerning the neural network algorithm. The authors thank the reviewers, who helped to improve the paper with their comments and suggestions.
This research has been supported by the Centre National d'Etudes Spatiales (TOSCA/COYOTE project) and the Agence Nationale de la Recherche (grant no. ANR-11-BS56-0018).
This paper was edited by Griet Neukermans and reviewed by two anonymous referees.
Ahn, Y. H., Shanmugam, P., and Moon, J. E.: Retrieval of ocean colour from high resolution multi‐spectral imagery for monitoring highly dynamic ocean features, Int. J. Remote Sens., 27, 367–392, https://doi.org/10.1080/01431160500300479, 2006. a
Antajan, E., Chrétiennot-Dinet, M.-J., Leblanc, C., Daro, M.-H., and Lancelot, C.: 19′-hexanoyloxyfucoxanthin may not be the appropriate pigment to trace occurrence and fate of Phaeocystis: the case of P. globosa in Belgian coastal waters, J. Sea Res., 52, 165–177, https://doi.org/10.1016/j.seares.2004.02.003, 2004. a
Anthony, E. J., Brunnier, G., Besset, M., Goichot, M., Dussouillez, P., and Nguyen, V. L.: Linking rapid erosion of the Mekong River delta to human activities, Sci. Rep.-UK, 5, 14745, https://doi.org/10.1038/srep14745, 2015. a
Aumont, O., Ethé, C., Tagliabue, A., Bopp, L., and Gehlen, M.: PISCES-v2: an ocean biogeochemical model for carbon and ecosystem studies, Geosci. Model Dev., 8, 2465–2513, https://doi.org/10.5194/gmd-8-2465-2015, 2015. a
Babin, M., Morel, A., Fournier-Sicre, V., Fell, F., and Stramski, D.: Light scattering properties of marine particles in coastal and open ocean waters as related to the particle mass concentration, Limnol. Oceanogr., 48, 843–859, https://doi.org/10.4319/lo.2003.48.2.0843, 2003. a
Bailey, S. W. and Werdell, P. J.: A multi-sensor approach for the on-orbit validation of ocean color satellite data products, Remote Sens. Environ., 102, 12–23, https://doi.org/10.1016/j.rse.2006.01.015, 2006. a
Balasubramanian, S. V., Pahlevan, N., Smith, B., Binding, C., Schalles, J., Loisel, H., Gurlin, D., Greb, S., Alikas, K., Randla, M., Bunkei, M., Moses, W., Nguy\^{e}̃n, H., Lehmann, M. K., O'Donnell, D., Ondrusek, M., Han, T.-H., Fichot, C. G., Moore, T., and Boss, E.: Robust algorithm for estimating total suspended solids (TSS) in inland and nearshore coastal waters, Remote Sens. Environ., 246, 111768, https://doi.org/10.1016/j.rse.2020.111768, 2020. a
Bonato, S., Breton, E., Didry, M., Lizon, F., Cornille, V., Lécuyer, E., Christaki, U., and Artigas, L. F.: Spatio-temporal patterns in phytoplankton assemblages in inshore–offshore gradients using flow cytometry: A case study in the eastern English Channel, J. Marine Syst., 156, 76–85, https://doi.org/10.1016/j.jmarsys.2015.11.009, 2016. a
Boss, E., Pegau, W. S., Lee, M., Twardowski, M., Shybanov, E., Korotaev, G., and Baratange, F.: Particulate backscattering ratio at LEO 15 and its use to study particle composition and distribution, J. Geophys. Res., 109, C01014, https://doi.org/10.1029/2002JC001514, 2004. a
Breton, E., Brunet, C., Sautour, B., and Brylinski, J.-M.: Annual variations of phytoplankton biomass in the Eastern English Channel: comparison by pigment signatures and microscopic counts, J. Plankton Res., 22, 1423–1440, https://doi.org/10.1093/plankt/22.8.1423, 2000. a
Brunet, C., Brylinski, J., Bodineau, L., Thoumelin, G., Bentley, D., and Hilde, D.: Phytoplankton Dynamics During the Spring Bloom in the South-eastern English Channel, Estuar. Coast. Shelf S., 43, 469–483, https://doi.org/10.1006/ecss.1996.0082, 1996. a
Bélanger, S., Babin, M., and Larouche, P.: An empirical ocean color algorithm for estimating the contribution of chromophoric dissolved organic matter to total light absorption in optically complex waters, J. Geophys. Res., 113, C04027, https://doi.org/10.1029/2007JC004436, 2008. a
Colella, S., Böhm, E., Cesarini, C., Garnesson, P., Netting, J., and Calton, B.: EU Copernicus Marine Service Product User Manual for the Copernicus-GlobColour Products, Issue 3.0, Mercator Ocean International, https://catalogue.marine.copernicus.eu/documents/PUM/CMEMS-OC-PUM.pdf (last access: 24 April 2023), 2022. a
Coynel, A., Etcheber, H., Abril, G., Maneux, E., Dumas, J., and Hurtrez, J.-E.: Contribution of small mountainous rivers to particulate organic carbon input in the Bay of Biscay, Biogeochemistry, 74, 151–171, https://doi.org/10.1007/s10533-004-3362-1, 2005. a, b, c
Douillet, P., Ouillon, S., and Cordier, E.: A numerical model for fine suspended sediment transport in the southwest lagoon of New Caledonia, Coral Reefs, 20, 361–372, https://doi.org/10.1007/s00338-001-0193-6, 2001. a
Doxaran, D., Ehn, J., Bélanger, S., Matsuoka, A., Hooker, S., and Babin, M.: Optical characterisation of suspended particles in the Mackenzie River plume (Canadian Arctic Ocean) and implications for ocean colour remote sensing, Biogeosciences, 9, 3213–3229, https://doi.org/10.5194/bg-9-3213-2012, 2012. a, b
Doxaran, D., Devred, E., and Babin, M.: A 50 % increase in the mass of terrestrial particles delivered by the Mackenzie River into the Beaufort Sea (Canadian Arctic Ocean) over the last 10 years, Biogeosciences, 12, 3551–3565, https://doi.org/10.5194/bg-12-3551-2015, 2015. a
Duforêt-Gaurier, L., Dessailly, D., Moutier, W., and Loisel, H.: Assessing the Impact of a Two-Layered Spherical Geometry of Phytoplankton Cells on the Bulk Backscattering Ratio of Marine Particulate Matter, Appl. Sci.-Basel, 8, 2689, https://doi.org/10.3390/app8122689, 2018. a
Ehn, J. K., Reynolds, R. A., Stramski, D., Doxaran, D., Lansard, B., and Babin, M.: Patterns of suspended particulate matter across the continental margin in the Canadian Beaufort Sea during summer, Biogeosciences, 16, 1583–1605, https://doi.org/10.5194/bg-16-1583-2019, 2019. a
Emmerton, C. A., Lesack, L. F., and Vincent, W. F.: Nutrient and organic matter patterns across the Mackenzie River, estuary and shelf during the seasonal recession of sea-ice, J. Marine Syst., 74, 741–755, https://doi.org/10.1016/j.jmarsys.2007.10.001, 2008. a
EU Copernicus Marine Service Product: Global Ocean Colour (Copernicus-GlobColour), Bio-Geo-Chemical, L3 (daily) from Satellite Observations (1997–ongoing), Mercator Ocean International [data set], https://doi.org/10.48670/moi-00280, 2022. a
Feng, L., Hu, C., Chen, X., and Song, Q.: Influence of the Three Gorges Dam on total suspended matters in the Yangtze Estuary and its adjacent coastal waters: Observations from MODIS, Remote Sens. Environ., 140, 779–788, https://doi.org/10.1016/j.rse.2013.10.002, 2014. a
Ford, W. I. and Fox, J. F.: Model of particulate organic carbon transport in an agriculturally impacted stream, Hydrol. Process., 28, 662–675, https://doi.org/10.1002/hyp.9569, 2014. a
Garnesson, P., Mangin, A., Bretagnon, M., and Jutard, Q.: EU Copernicus Marine Service Quality Information Document for the Copernicus-GlobColour Products, Issue 3.0, Mercator Ocean International, https://catalogue.marine.copernicus.eu/documents/QUID/CMEMS-OC-QUID-009-101to104-111-113-116-118.pdf (last access: 24 April 2023), 2022. a
Gensac, E., Martinez, J.-M., Vantrepotte, V., and Anthony, E. J.: Seasonal and inter-annual dynamics of suspended sediment at the mouth of the Amazon river: The role of continental and oceanic forcing, and implications for coastal geomorphology and mud bank formation, Cont. Shelf Res., 118, 49–62, https://doi.org/10.1016/j.csr.2016.02.009, 2016. a
Gohin, F.: Annual cycles of chlorophyll-a, non-algal suspended particulate matter, and turbidity observed from space and in-situ in coastal waters, Ocean Sci., 7, 705–732, https://doi.org/10.5194/os-7-705-2011, 2011. a, b
Gohin, F., Van der Zande, D., Tilstone, G., Eleveld, M. A., Lefebvre, A., Andrieux-Loyer, F., Blauw, A. N., Bryère, P., Devreker, D., Garnesson, P., Hernández Fariñas, T., Lamaury, Y., Lampert, L., Lavigne, H., Menet-Nedelec, F., Pardo, S., and Saulquin, B.: Twenty years of satellite and in situ observations of surface chlorophyll-a from the northern Bay of Biscay to the eastern English Channel. Is the water quality improving?, Remote Sens. Environ., 233, 111343, https://doi.org/10.1016/j.rse.2019.111343, 2019. a
Grattepanche, J.-D., Vincent, D., Breton, E., and Christaki, U.: Microzooplankton herbivory during the diatom–Phaeocystis spring succession in the eastern English Channel, J. Exp. Mar. Biol. Ecol., 404, 87–97, https://doi.org/10.1016/j.jembe.2011.04.004, 2011. a
Groom, S., Sathyendranath, S., Ban, Y., Bernard, S., Brewin, R., Brotas, V., Brockmann, C., Chauhan, P., Choi, J.-k., Chuprin, A., Ciavatta, S., Cipollini, P., Donlon, C., Franz, B., He, X., Hirata, T., Jackson, T., Kampel, M., Krasemann, H., Lavender, S., Pardo-Martinez, S., Mélin, F., Platt, T., Santoleri, R., Skakala, J., Schaeffer, B., Smith, M., Steinmetz, F., Valente, A., and Wang, M.: Satellite Ocean Colour: Current Status and Future Perspective, Frontiers in Marine Science, 6, 485, https://doi.org/10.3389/fmars.2019.00485, 2019. a
Hagan, M. T., Demuth, H. B., and Beale, M. H.: Neural network design, PWS Publishing, Boston, ISBN 10: 0534943322 – ISBN 13: 9780534943325, 1996. a
Han, B., Loisel, H., Vantrepotte, V., Mériaux, X., Bryère, P., Ouillon, S., Dessailly, D., Xing, Q., and Zhu, J.: Development of a Semi-Analytical Algorithm for the Retrieval of Suspended Particulate Matter from Remote Sensing over Clear to Very Turbid Waters, Remote Sens.-Basel, 8, 211, https://doi.org/10.3390/rs8030211, 2016. a, b
Hu, S., Cao, W., Wang, G., Xu, Z., Lin, J. F., Zhao, W., Yang, Y., Zhou, W., Sun, Z., and Yao, L.: Comparison of MERIS, MODIS, SeaWiFS-derived particulate organic carbon, and in situ measurements in the South China Sea, Int. J. Remote Sens.-Basel, 37, 1585–1600, https://doi.org/10.1080/01431161.2015.1088673, 2016. a
Hung, J.-J., Chan, C.-L., and Gong, G.-C.: Summer distribution and geochemical composition of suspended-particulate matter in the East China Sea, J. Oceanogr., 63, 189–202, https://doi.org/10.1007/s10872-007-0021-x, 2007. a
IOCCG: Remote Sensing of Ocean Colour in Coastal, and Other Optically-Complex, Waters, in: Reports of the International Ocean-Colour Coordinating Group, 3, edited by: Sathyendranath, S., International Ocean-Colour Coordinating Group (IOCCG), Dartmouth, NS, Canada, 140 pp., https://doi.org/10.25607/OBP-95, 2000. a
IOCCG: Earth Observations in Support of Global Water Quality Monitoring, in: Reports of the International Ocean-Colour Coordinating Group, No. 17, edited by: Greb, S., Dekker, A., and Binding, C., Ocean-Colour Coordinating Group (IOCCG), Dartmouth, NS, Canada, International, 125 pp., https://doi.org/10.25607/OBP-113, 2018. a
Joint, I. and Pomroy, A.: Phytoplankton biomass and production in the southern North Sea, Mar. Ecol. Prog. Ser., 99, 169–182, http://www.jstor.org/stable/24837760 (last access: 22 March 2023), 1993. a
Jorge, D. S., Loisel, H., Jamet, C., Dessailly, D., Demaria, J., Bricaud, A., Maritorena, S., Zhang, X., Antoine, D., Kutser, T., Bélanger, S., Brando, V. O., Werdell, J., Kwiatkowska, E., Mangin, A., and d'Andon, O. F.: A three-step semi analytical algorithm (3SAA) for estimating inherent optical properties over oceanic, coastal, and inland waters from remote sensing reflectance, Remote Sens. Environ., 263, 112537, https://doi.org/10.1016/j.rse.2021.112537, 2021. a
Lahet, F. and Stramski, D.: MODIS imagery of turbid plumes in San Diego coastal waters during rainstorm events, Remote Sens. Environ., 114, 332–344, https://doi.org/10.1016/j.rse.2009.09.017, 2010. a
Lancelot, C., Gypens, N., Billen, G., Garnier, J., and Roubeix, V.: Testing an integrated river–ocean mathematical tool for linking marine eutrophication to land use: The Phaeocystis-dominated Belgian coastal zone (Southern North Sea) over the past 50 years, J. Marine Syst., 216–228, https://doi.org/10.1016/j.jmarsys.2006.03.010, 2007. a
Le, C., Lehrter, J. C., Hu, C., MacIntyre, H., and Beck, M. W.: Satellite observation of particulate organic carbon dynamics on the Louisiana continental shelf, J. Geophys. Res.-Oceans, 122, 555–569, https://doi.org/10.1002/2016JC012275, 2017. a
Lesourd, S., Lesueur, P., Brun-Cottan, J., Garnaud, S., and Poupinet, N.: Seasonal variations in the characteristics of superficial sediments in a macrotidal estuary (the Seine inlet, France), Estuar. Coast. Shelf S., 58, 3–16, https://doi.org/10.1016/S0272-7714(02)00340-2, 2003. a
Liu, D., Pan, D., Bai, Y., He, X., Wang, D., Wei, J.-A., and Zhang, L.: Remote Sensing Observation of Particulate Organic Carbon in the Pearl River Estuary, Remote. Sens.-Basel, 7, 8683–8704, 2015. a
Loisel, H., Mériaux, X., Berton, J.-F., and Poteau, A.: Investigation of the optical backscattering to scattering ratio of marine particles in relation to their biogeochemical composition in the eastern English Channel and southern North Sea, Limnol. Oceanogr., 52, 739–752, https://doi.org/10.4319/lo.2007.52.2.0739, 2007. a, b, c, d, e, f, g
Loisel, H., Vantrepotte, V., Jamet, C., and Dat, D. N.: Challenges and New Advances in Ocean Color Remote Sensing of Coastal Waters, chap. 4, in: Topics in Oceanography, edited by: Zambianchi, E., IntechOpen, Rijeka, https://doi.org/10.5772/56414, 2013. a
Loisel, H., Mangin, A., Vantrepotte, V., Dessailly, D., Ngoc Dinh, D., Garnesson, P., Ouillon, S., Lefebvre, J.-P., Mériaux, X., and Minh Phan, T.: Variability of suspended particulate matter concentration in coastal waters under the Mekong's influence from ocean color (MERIS) remote sensing over the last decade, Remote Sens. Environ., 150, 218–230, https://doi.org/10.1016/j.rse.2014.05.006, 2014. a, b, c
Loisel, H., Vantrepotte, V., Ouillon, S., Ngoc, D. D., Meriaux, X., Dessailly, D., Jamet, C., Duhaut, T., Nguyen, H. H., and Van Nguyen, T.: Assessment and analysis of the chlorophyll-a concentration variability over the vietnamese coastal waters from the meris ocean color sensor (2002–2012), Remote Sens. Environ., 190, 217–232, https://doi.org/10.1016/j.rse.2016.12.016, 2017. a, b
Lubac, B. and Loisel, H.: Variability and classification of remote sensing reflectance spectra in the eastern English Channel and southern North Sea, Remote Sens. Environ., 110, 45–58, https://doi.org/10.1016/j.rse.2007.02.012, 2007. a
Lubac, B., Loisel, H., Guiselin, N., Astoreca, R., Artigas, L.-F., and Mériaux, X.: Hyperspectral and multispectral ocean color inversions to detect phaeocystis globosablooms in coastal waters, J. Geophys. Res., 113, C06026, https://doi.org/10.1029/2007JC004451, 2008. a, b
Lv, C., Xing, Y., Zhang, J., Na, X., Li, Y., Liu, T., Cao, D., and Wang, F.-Y.: Levenberg–Marquardt Backpropagation Training of Multilayer Neural Networks for State Estimation of a Safety-Critical Cyber-Physical System, IEEE T. Ind. Inform., 14, 3436–3446, https://doi.org/10.1109/TII.2017.2777460, 2018. a
Marchesiello, P., Nguyen, N. M., Gratiot, N., Loisel, H., Anthony, E. J., Dinh, C. S., Nguyen, T., Almar, R., and Kestenare, E.: Erosion of the coastal Mekong delta: Assessing natural against man induced processes, Cont. Shelf Res., 181, 72–89, https://doi.org/10.1016/j.csr.2019.05.004, 2019. a
Mengual, B., Hir, P. L., Cayocca, F., and Garlan, T.: Modelling Fine Sediment Dynamics: Towards a Common Erosion Law for Fine Sand, Mud and Mixtures, Water, 9, 564, https://doi.org/10.3390/w9080564, 2017. a
Mélin, F. and Vantrepotte, V.: How optically diverse is the coastal ocean?, Remote Sens. Environ., 160, 235–251, https://doi.org/10.1016/j.rse.2015.01.023, 2015. a
Nechad, B., Ruddick, K., and Park, Y.: Calibration and validation of a generic multisensor algorithm for mapping of total suspended matter in turbid waters, Remote Sens. Environ., 114, 854–866, https://doi.org/10.1016/j.rse.2009.11.022, 2010. a
Neukermans, G., Loisel, H., Mériaux, X., Astoreca, R., and McKee, D.: In situ variability of mass-specific beam attenuation and backscattering of marine particles with respect to particle size, density, and composition, Limnol. Oceanogr., 57, 124–144, https://doi.org/10.4319/lo.2012.57.1.0124, 2012. a
Neukermans, G., Reynolds, R., and Stramski, D.: Optical classification and characterization of marine particle assemblage within the western Artic Ocean, Limnol. Oceanogr., 61, 1472–1494, https://doi.org/10.1002/lno.10316, 2016. a, b
Novoa, S., Doxaran, D., Ody, A., Vanhellemont, Q., Lafon, V., Lubac, B., and Gernez, P.: Atmospheric Corrections and Multi-Conditional Algorithm for Multi-Sensor Remote Sensing of Suspended Particulate Matter in Low-to-High Turbidity Levels Coastal Waters, Remote Sens.-Basel, 9, 61, https://doi.org/10.3390/rs9010061, 2017. a
Pahlevan, N., Smith, B., Alikas, K., Anstee, J., Barbosa, C., Binding, C., Bresciani, M., Cremella, B., Giardino, C., Gurlin, D., Fernandez, V., Jamet, C., Kangro, K., Lehmann, M. K., Loisel, H., Matsushita, B., Hà, N., Olmanson, L., Potvin, G., Simis, S. G., VanderWoude, A., Vantrepotte, V., and Ruiz-Verdù, A.: Simultaneous retrieval of selected optical water quality indicators from Landsat-8, Sentinel-2, and Sentinel-3, Remote Sens. Environ., 270, 112860, https://doi.org/10.1016/j.rse.2021.112860, 2022. a
Portillo Juan, N. and Negro Valdecantos, V.: Review of the application of Artificial Neural Networks in ocean engineering, Ocean Eng., 259, 111947, https://doi.org/10.1016/j.oceaneng.2022.111947, 2022. a
Renosh, P., Schmitt, F. G., Loisel, H., Sentchev, A., and Mériaux, X.: High frequency variability of particle size distribution and its dependency on turbulence over the sea bottom during re-suspension processes, Cont. Shelf Res., 77, 51–60, https://doi.org/10.1016/j.csr.2014.01.024, 2014. a
Reynolds, R. A. and Stramski, D.: Optical characterization of marine phytoplankton assemblages within surface waters of the western Arctic Ocean, Limnol. Oceanogr., 64, 2478–2496, https://doi.org/10.1002/lno.11199, 2019. a
Reynolds, R. A., Stramski, D., and Neukermans, G.: Optical backscattering by particles in Arctic seawater and relationships to particle mass concentration, size distribution, and bulk composition, Limnol. Oceanogr., 61, 1869–1890, https://doi.org/10.1002/lno.10341, 2016. a, b
Sazhin, A., Artigas, L. F., Nejstgaard, J., and Frischer, M.: The colonization of two Phaeocystis species (Prymnesiophyceae) by pennate diatoms and other protists: A significant contribution to colony biomass, Biogeochemistry, 83, 137–145, https://doi.org/10.1007/s10533-007-9086-2, 2007. a
Shchepetkin, A. F. and McWilliams, J. C.: The regional oceanic modeling system (ROMS): a split-explicit, free-surface, topography-following-coordinate oceanic model, Ocean Model., 9, 347–404, https://doi.org/10.1016/j.ocemod.2004.08.002, 2005. a
Steinmetz, F. and Ramon, D.: Sentinel-2 MSI and Sentinel-3 OLCI consistent ocean colour products using POLYMER, in: Remote Sensing of the Open and Coastal Ocean and Inland Waters, edited by: Frouin, R. J. and Murakami, H., International Society for Optics and Photonics, SPIE, 10778, 46–55, https://doi.org/10.1117/12.2500232, 2018. a
Steinmetz, F., Deschamps, P.-Y., and Ramon, D.: Atmospheric correction in presence of sun glint: application to MERIS, Opt. Express, 19, 9783–9800, https://doi.org/10.1364/OE.19.009783, 2011. a
Tran, T. K., Duforêt-Gaurier, L., Vantrepotte, V., Jorge, D. S. F., Mériaux, X., Cauvin, A., Fanton d'Andon, O., and Loisel, H.: Deriving Particulate Organic Carbon in Coastal Waters from Remote Sensing: Inter-Comparison Exercise and Development of a Maximum Band-Ratio Approach, Remote Sens.-Basel, 11, 2849, https://doi.org/10.3390/rs11232849, 2019. a, b, c
Twardowski, M. S., Boss, E., Macdonald, J. B., Pegau, W. S., Barnard, A. H., and Zaneveld, J. R. V.: A model for estimating bulk refractive index from the optical backscattering ratio and the implications for understanding particle composition in case I and case II waters, J. Geophys. Res., 106, 14129–14142, https://doi.org/10.1029/2000JC000404, 2001. a, b, c
Van der Zande, D., Lacroix, G., and Ruddick, K.: Observing and explaining the timing of spring/summer algal blooms in the Southern North Sea using ocean colour remote sensing, in: Proceedings of the Ocean Optics XXI, Glasgow, Scotland, 8-12 October 2012. a
Vantrepotte, V., Brunet, C., Mériaux, X., Lécuyer, E., Vellucci, V., and Santer, R.: Bio-optical properties of coastal waters in the Eastern English Channel, Estuarine, Coast. Shelf Sci., 72, 201–212, https://doi.org/10.1016/j.ecss.2006.10.016, 2007. a, b, c
Vantrepotte, V., Loisel, H., Mélin, F., Desailly, D., and Duforêt-Gaurier, L.: Global particulate matter pool temporal variability over the SeaWiFS period (1997–2007), Geophys. Res. Lett., 38, L02605, https://doi.org/10.1029/2010GL046167, 2011. a, b
Vantrepotte, V., Loisel, H., Dessailly, D., and Mériaux, X.: Optical classification of contrasted coastal waters, Remote Sens. Environ., 123, 306–323, https://doi.org/10.1016/j.rse.2012.03.004, 2012. a, b, c
Vantrepotte, V., Danhiez, F.-P., Loisel, H., Ouillon, S., Mériaux, X., Cauvin, A., and Dessailly, D.: CDOM-DOC relationship in contrasted coastal waters: implication for DOC retrieval from ocean color remote sensing observation., Opt. Express, 23, 33–54, https://doi.org/10.1364/OE.23.000033, 2015. a
Varona, H., Veleda, D., Silva, M., Cintra, M., and Araujo, M.: Amazon River plume influence on Western Tropical Atlantic dynamic variability, Dynam. Atmos. Oceans, 85, 1–15, https://doi.org/10.1016/j.dynatmoce.2018.10.002, 2019. a
Velegrakis, A., Gao, S., Lafite, R., Dupont, J., Huault, M., Nash, L., and Collins, M.: Resuspension and advection processes affecting suspended particulate matter concentrations in the central English Channel, J. Sea Res., 38, 17–34, https://doi.org/10.1016/S1385-1101(97)00041-5, 1997. a
Woźniak, S. B., Stramski, D., Stramska, M., Reynolds, R. A., Wright, V. M., Miksic, E. Y., Cichocka, M., and Cieplak, A. M.: Optical variability of seawater in relation to particle concentration, composition, and size distribution in the nearshore marine environment at Imperial Beach, California, J. Geophys. Res., 115, C08027, https://doi.org/10.1029/2009JC005554, 2010. a, b, c, d, e, f, g, h
Woźniak, S. B., Meler, J., Lednicka, B., Zdun, A., and Stoń-Egiert, J.: Inherent optical properties of suspended particulate matter in the southern Baltic Sea, Oceanologia, 53, 691–729, https://doi.org/10.5697/oc.53-3.691, 2011. a
Woźniak, S. B., Darecki, M., Zabłocka, M., Burska, D., and Dera, J.: New simple statistical formulas for estimating surface concentrations of suspended particulate matter (SPM) and particulate organic carbon (POC) from remote-sensing reflectance in the southern Baltic Sea, Oceanologia, 58, 161–175, https://doi.org/10.1016/j.oceano.2016.03.002, 2016. a
Wu, Y., Fang, H., Huang, L., and Cui, Z.: Particulate organic carbon dynamics with sediment transport in the upper Yangtze River, Water Res., 184, 116193, https://doi.org/10.1016/j.watres.2020.116193, 2020. a