the Creative Commons Attribution 4.0 License.
the Creative Commons Attribution 4.0 License.
 | 30 Sep 2025 | OSR9 | Chapter 2.2
Variations in marine heatwaves and cold spells in the Northwest Atlantic during 1993–2023
Youyu Lu
Haiyan Wang
Gilles Garric
Simon Van Gennip
Characteristics of marine heatwaves (MHWs) and cold spells (MCSs) in the Northwest Atlantic during 1993–2023 are derived from a global ocean reanalysis product of the European Union Copernicus Marine Service. For surface parameters, the quantification using the reanalysis data is more advantageous than using the satellite remote sensing data in regions with the presence of seasonal sea ice and strong eddies. At the sea bottom, the reanalysis data reproduces well the observed rising trend and sharp increase in bottom temperature around 2012 on the Scotian Shelf and associated changes in MHW/MCS parameters. The 31 years of reanalysis data enable the quantification of spatial variations, interannual variations, and long-term trends in MHW/MCS parameters in the water column in our study region.
The corresponding parameters of surface MHWs and MCSs are overall similar due to the nearly symmetrical probability distribution of sea surface temperature (SST) anomalies around the mean. On the Scotian Shelf, the MHW parameters present layered structures in the water column, influenced by the heat flux in the upper layer and the different water mass compositions in the deeper layer. During 1993–2023, the surface MHW (MCS) total days show increasing (decreasing) trends corresponding to the gradually increasing SST, and the MHW total days reached a peak value of 215 d in 2012 corresponding to the highest annual SST. The bottom temperature shows a stronger increasing trend than the SST and a regime shift around 2012, resulting in the increasing (decreasing) trend and regime shift in bottom MHW (MCS) total days. In 2012, the bottom MHW total days experienced a sharp increase and the entire water column was warmer than the climatology. Opposite conditions presented in 1998, with the longest bottom MCS total days of ∼ 300 near the coast. The quantification of the extreme conditions in 2012 and 1998 supports the results of previous studies on the impacts of these conditions on several marine life species.
- Article
(8729 KB) - Full-text XML
- BibTeX
- EndNote


Marine heatwaves (MHWs) and marine cold spells (MCSs) are extreme warm and cold events of the ocean water, respectively. MHWs have been observed in all ocean basins (Collins et al., 2019) and have been extensively studied. Globally, MHWs, defined relative to a fixed climatological period, have become more frequent, long-lasting, and intense since the 1980s under global warming (Frölicher et al., 2018; Oliver et al., 2018; Fox-Kemper et al., 2021). Regionally, local processes, large-scale climate modes, and teleconnections also play important roles in MHW occurrences (Holbrook et al., 2019; Sen Gupta et al., 2020; Capotondi et al., 2024). For example, in the Northwest Pacific, interannual variations in surface MHWs are correlated with various large-scale atmosphere–ocean indices, including the El Niño index (Wang et al., 2024). On the shelf seas of the Northwest Atlantic, nearly half of the surface MHWs are initiated by the positive heat flux anomaly into the ocean, and advection and mixing are the primary drivers for the decay of most MHWs (Schlegel et al., 2021b). On the Newfoundland and Labrador Shelf, the summer and fall MHWs in 2023 were impacted by stratification, winds, and advection (Soontiens et al., 2025, this report). Identifying the physical drivers that trigger and maintain the MHWs (MCSs) is important for understanding and predicting the variations in these events and their impacts on marine ecosystems.
Previous studies have revealed the negative impacts of MHWs and MCSs on marine ecosystems. For example, MHWs can cause coral bleaching, destroy kelp forests, and alter the migration patterns of marine species (Santora et al., 2020; Beaudin and Bracco, 2022). MHWs have also affected commercial fisheries in Canadian waters. In the Northeast Pacific, intense and long-lasting heat events, such as “the Blob”, led to the collapse of fisheries (Free et al., 2023). In Atlantic Canada, extreme heat events affect the physiological behaviour of aquaculture Atlantic salmon, i.e., the increases in heart rate and decreases in motion (Korus et al., 2024). The declining North Atlantic right whale population was related to the significant warming in the Gulf of Maine and the western Scotian Shelf over the recent decades (Meyer-Gutbrod et al., 2021). The impacts of the extreme cold (warm) event in 1998 (2012) on fishery species have also been studied. In 1998, shortly after the cold Labrador Slope Water replaced the Warm Slope Water, the catches of porbeagle shark and silver hake in the Emerald Basin dramatically declined (Drinkwater et al., 2003). The widespread 2012 warm event in the Northwest Atlantic, with large anomalies throughout the water column and at the sea bottom, had opposite effects on different commercial fisheries. It adversely impacted the snow crab juvenile stages, resulting in a temporary decrease in snow crab abundance on the western Scotian Shelf (Zisserson and Cook, 2017). In the Gulf of Maine, this warm event caused earlier inshore movement of lobsters in the spring, leading to enhanced lobster growth, an extended fishing season, and record landings (Mills et al., 2013).
Compared with MHWs, there have been fewer studies on MCSs. Globally and regionally, the frequency and intensity of surface MCSs show decreasing trends during 1982–2020 associated with the sea surface temperature (SST) increase (Mohamed et al., 2023; Peal et al., 2023; Schlegel et al., 2021b; Wang et al., 2022). Changes in atmospheric forcing, ocean circulation, and coastal upwelling can drive local cold events at the sea surface (Schlegel et al., 2017) and throughout the water column in shallow coastal bays (Casey et al., 2024).
Studies on surface extreme temperature events commonly use sea surface temperatures (SSTs) based on satellite remote sensing (e.g., Wang et al., 2022; Peal et al., 2023). Such studies are limited to the upper ocean and ice-free areas, and the analysis results are impacted by the observational noise and by cloud correction and interpolation schemes used to generate various levels of satellite SST products. Subsurface extreme events have been less well studied due to the scarcity of temperature observations below the surface, leading to limited knowledge about whether and how extreme events at depth have changed over the past decades (Collins et al., 2019). Results from high-resolution numerical ocean models, particularly those reanalysis products achieved through data assimilation, have been alternatively used to study the extreme temperature events, both at surface and at bottom (e.g., Amaya et al., 2023a; Wang et al., 2024). The study of Amaya et al. (2023a) revealed stronger and longer MHWs at bottom than at surface in the shelf seas of North America, but it did not quantify the interannual and long-term variations in MHW characteristics.
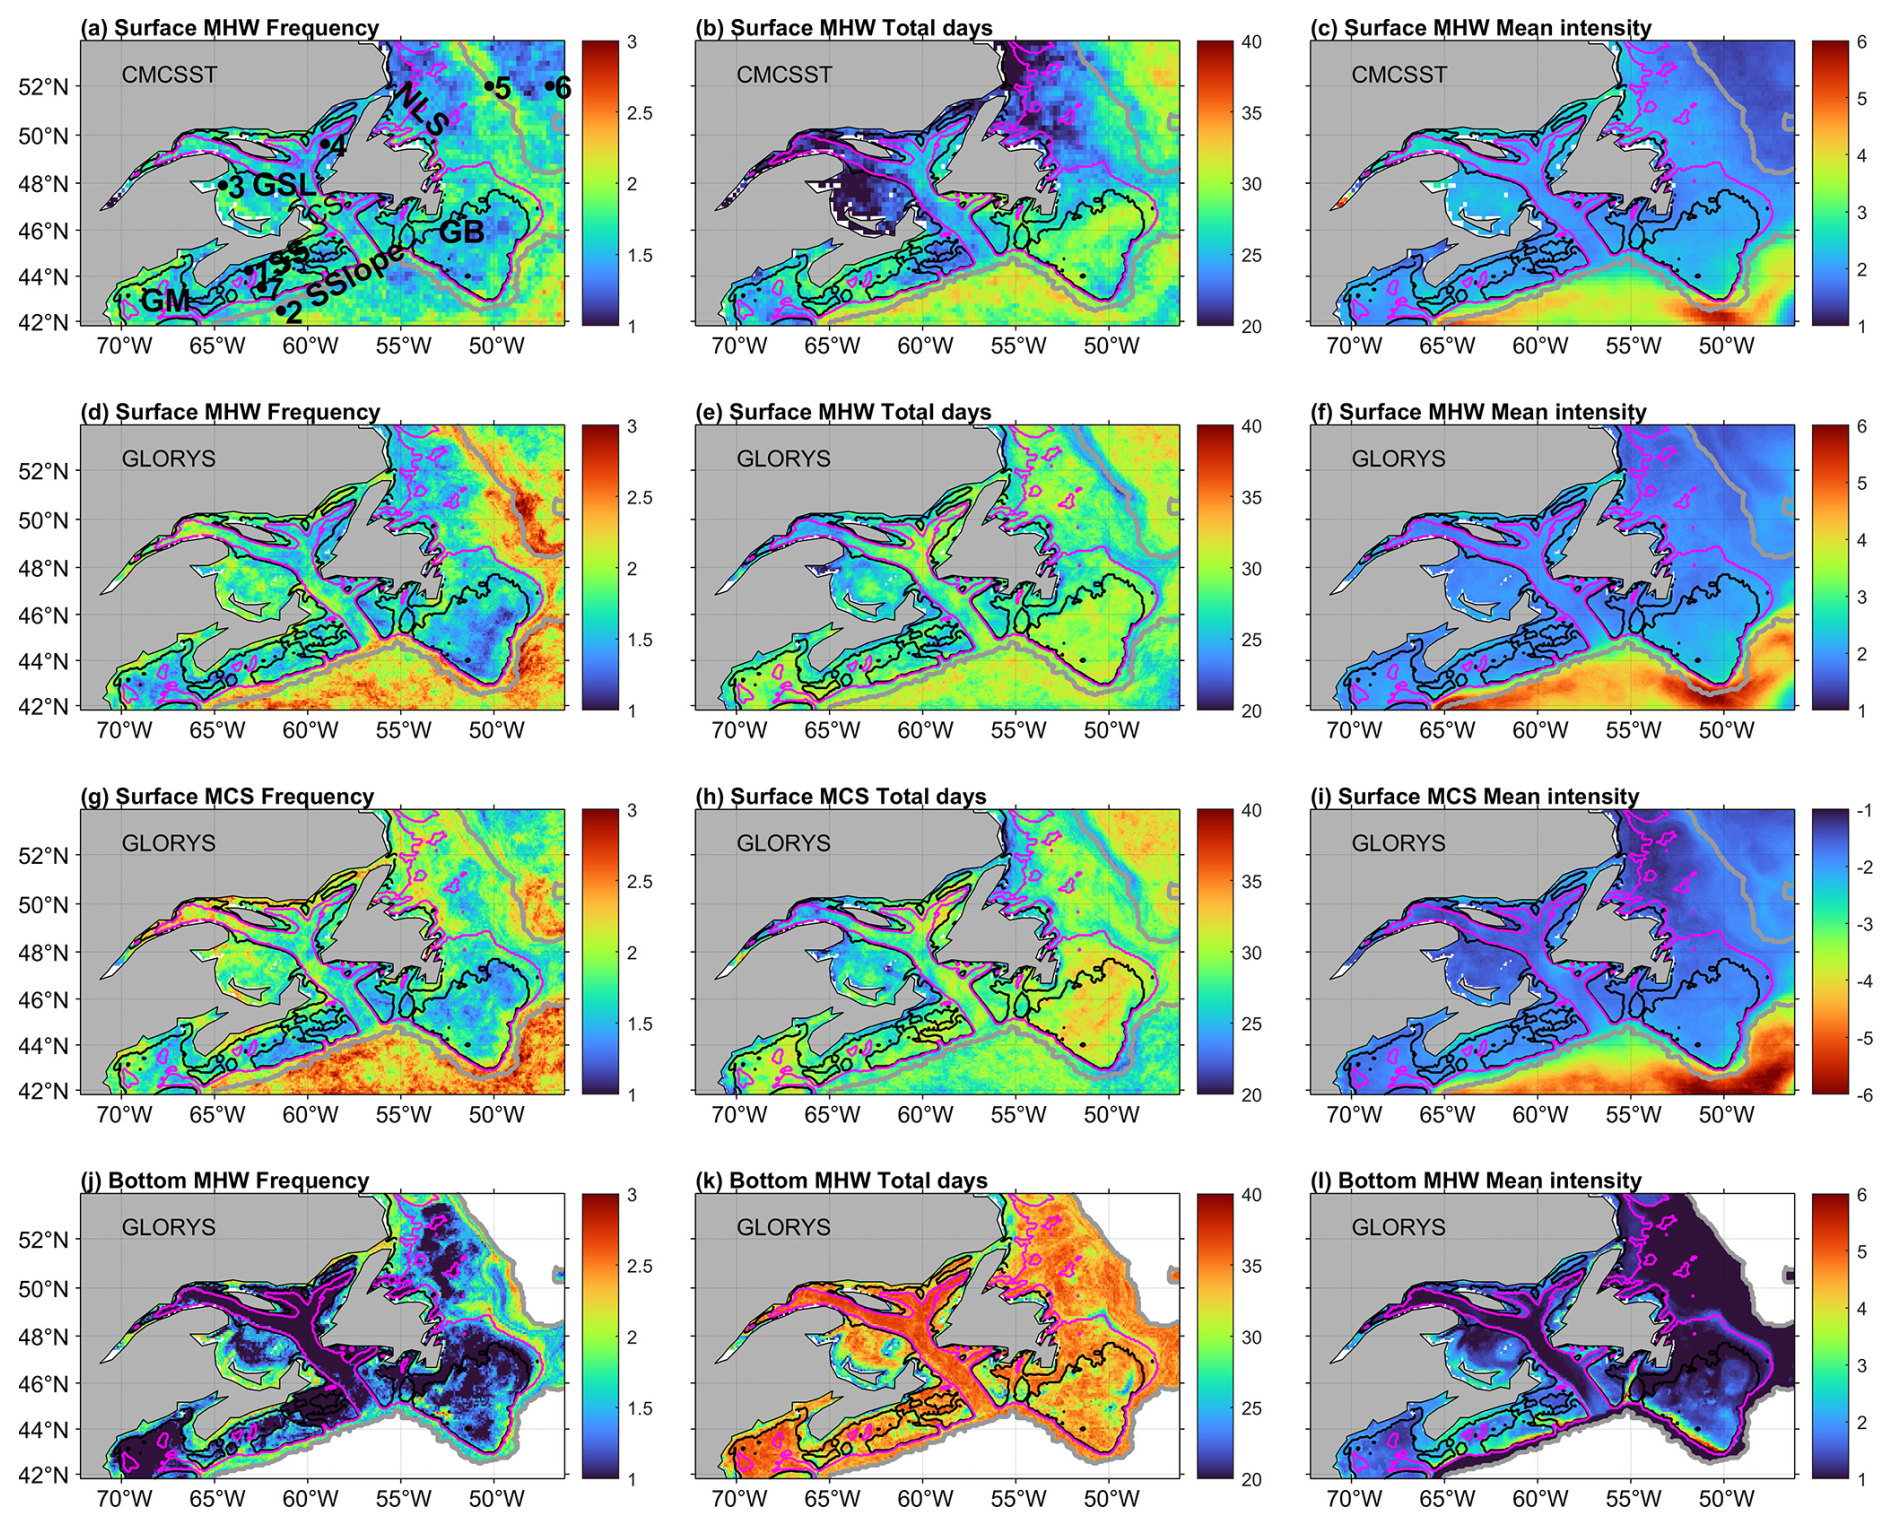
Figure 1Mean of surface MHW (a–f) and MCS (g–i) characteristics during 1993–2022 derived from (a–c) CMCSST and (d–i) GLORYS12V1. (j–l) Mean of bottom MHW characteristics during 1993–2022 derived from GLORYS12V1. From left to right: frequency (number of events per year), total days (days per year), and mean intensity (°C). The 100, 200, and 2000 m isobaths are represented by black, magenta, and grey lines, respectively. (a) Stations 1–7 indicated by the solid circles for examining the time series of MHW/MCS characteristics, located at latitudes/longitudes of 44.25° N/63.16° W, 42.48° N/61.43° W, 47.91 ° N/64.56° W, 49.64° N/59.06° W, 51.99° N/50.25° W, 52.00° N/47.00° W, and 43.48° N/62.45° W. The Halifax line is the line between stations 1 and 2. Abbreviations: GB, Grand Banks; GM, Gulf of Maine; GSL, Gulf of St. Lawrence; NLS, Newfoundland and Labrador Shelf; SS, Scotian Shelf; SSlope, Scotian Slope; CB, Cabot Strait.
Motivated by the results of previous studies, in this study we quantify the space–time variations in MHWs and MCSs in the Northwest Atlantic, from surface to water column to bottom, with the ultimate goal to better support fisheries in this region. Our study region (Fig. 1a) can be sub-divided into (1) the Newfoundland and Labrador Shelf (NLS) to the north of Grand Banks; (2) Grand Banks; (3) the Gulf of St. Lawrence (GSL), a semi-enclosed sea connecting to the NLS and Scotian Shelf (SS); (4) the Scotian Shelf, an open and rugged shelf, adjoining the Gulf of Maine in the southwest and the Scotian Slope off the shelf; (5) the Gulf of Maine and Bay of Fundy, a tidally energetic semi-enclosed sea; and (6) the Scotian Slope. The physical oceanography in the region is quite complex, due to the influences of the strong multi-scale variability in atmospheric forcing, river runoff, tides, and sea ice; the strong ocean circulation of the Gulf Stream, North Atlantic Current, and Labrador Current; and the meso-scale eddies (e.g., Loder et al., 1998; Brickman et al., 2018; Ma et al., 2022). The water masses of NLS and Grand Banks are strongly affected by the southward Labrador Current that transports cold and fresher water and sea ice. The Scotian Slope water is influenced by the mixture of warm eddies shed from the eastward Gulf Stream/North Atlantic Current and the occasional westward intrusion of the Labrador Current near the tail of Grand Banks. The GSL is influenced by the significant freshwater discharge of rivers, including the St. Lawrence River; sea ice formed locally and transported in from NLS; and inflows from NLS, Grand Banks, and the Scotian Slope. The SS is influenced by the outflow from the GSL and the intrusion of Scotian Slope water. The Gulf of Maine and Bay of Fundy are influenced by the SS and the Scotian Slope water. Our analysis results will mainly be based on the daily data from an ocean reanalysis product, in comparison with analyses of satellite SST and mooring observations. Main results include (1) characteristics of the spatial distributions of MHW and MCS parameters, (2) the linkages between surface and water column extreme events, and (3) interannual variations and long-term trends and their relationship with temperature variations and the forcing mechanisms.
2.1 Datasets
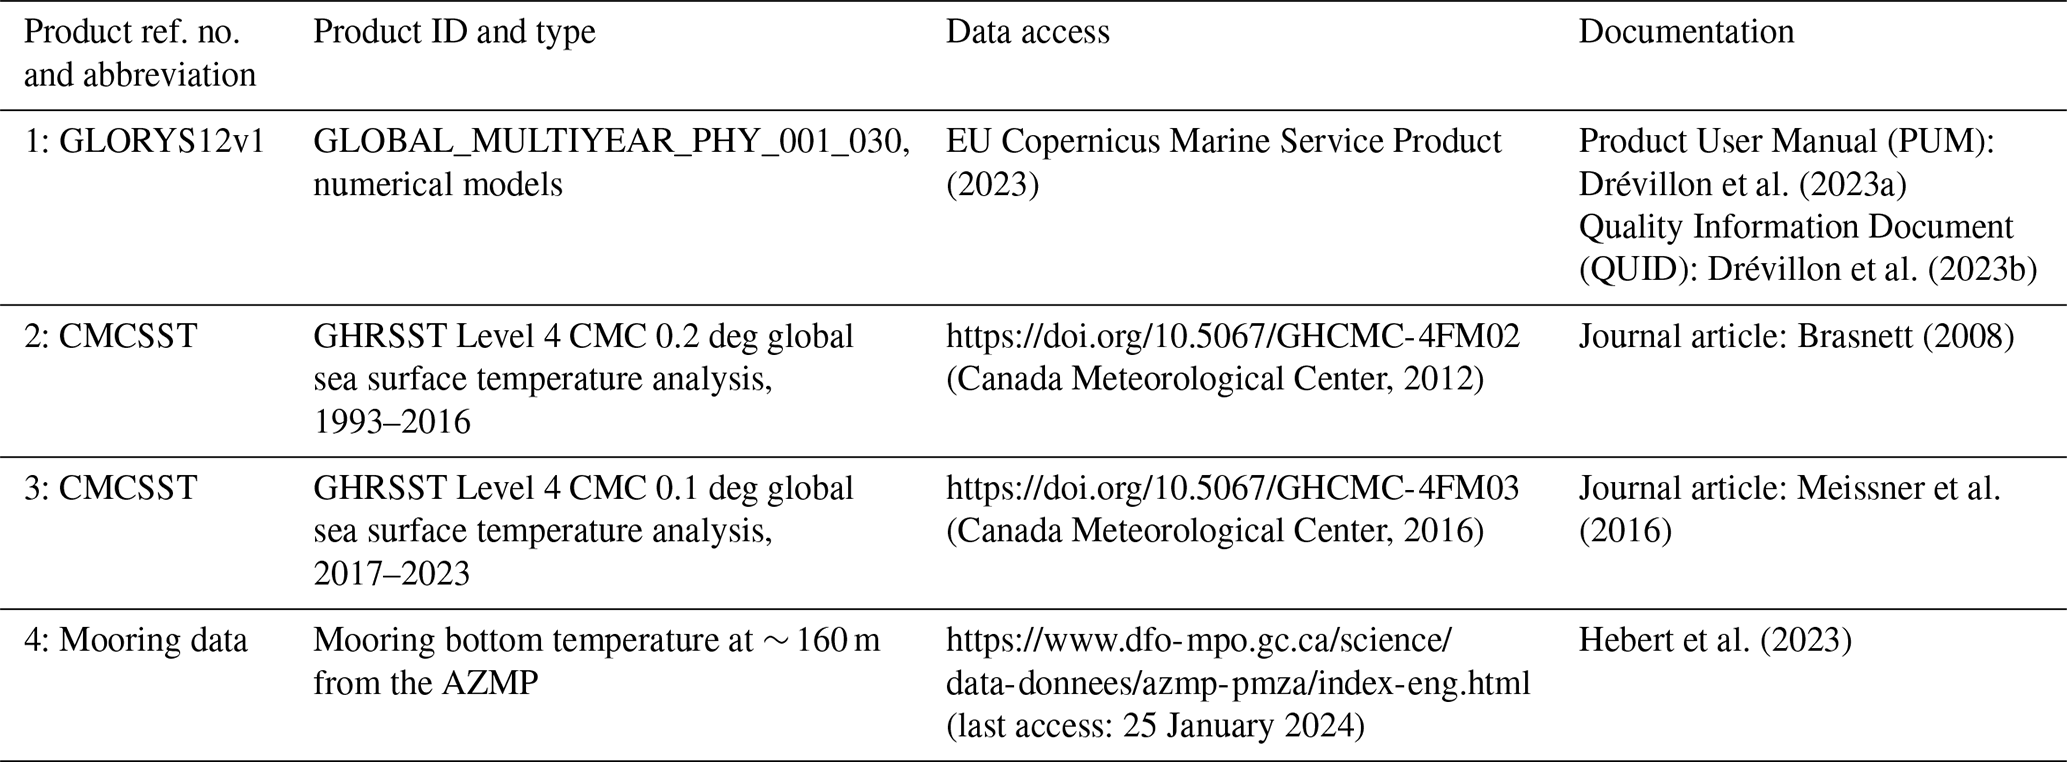
Table 1 lists the datasets analyzed in this study. Product ref. no. 1 is the daily temperature during 1993–2023 from the global ocean eddy-resolving reanalysis with a 1/12° horizontal resolution, referred to as GLORYS12V1 (Lellouche et al., 2021). The GLORYS12V1 temperature data remain continuous in ice-covered regions, which helps to compensate for the limitations of spatial and temporal coverage of satellite observations in those areas.
Product ref. no. 2 during 1993–2016 and no. 3 during 2017–2023 are global ocean SST analyses produced daily on an operational basis at the Canadian Meteorological Centre (CMC). The analysis incorporates in situ observations and retrievals from one microwave and three infrared sensors (Brasnett, 2008), referred to as CMCSST. According to the assessment by Fiedler et al. (2019), the CMCSST data show low standard deviations and mean differences to the independent Argo observations in comparison with other long-term SST analyses, including the European Space Agency Sea Surface Temperature Climate Change Initiative (ESA SST CCI) and MyOcean Operational Sea Surface Temperature and Ice Analysis (OSTIA) available from the Copernicus marine catalogues. Product ref. no. 3 at 0.1° resolution during 2017–2023 is linearly interpolated onto the 0.2° grids of product ref. no. 2, thus creating a dataset on unified grids covering 1993–2023. CMCSST has no values at locations and time when sea ice is present.
Product ref. no. 4 is the observed daily bottom temperature since 2008 from a bottom-mounted mooring at a location on the inner Scotian Shelf with a water depth of 160 m (Fig. 1, location 1), from the Atlantic Zone Monitoring Program (AZMP) of Fisheries and Oceans Canada. The mooring is situated on the path of the coastal Nova Scotia Current (Hebert et al., 2023). The mooring is redeployed annually in the fall AZMP survey, and the data are only available until September 2023 for this study.
2.2 Definition and quantification of marine heatwaves and cold spells
Following Hobday et al. (2016), the MHWs are defined as periods of extremely warm water that last continuously for 5 or more days. The MCS are defined similarly as anomalously cold water events following Schlegel et al. (2017). We use the SST data to compute the surface MHW and MCS parameters and the temperature at the ocean floor to compute the bottom MHW and MCS parameters. A seasonally varying climatological percentile threshold method is used to detect MHWs (MCSs). No detrending is applied to the temperature data prior to the MHW/MCS analysis because we want to maintain the consistency and be able to compare with the results of other studies in the Northwest Atlantic (Galbraith et al., 2024; Soontiens et al., 2025) and to emphasize the effects of ocean warming on the changing characteristics of MHWs/MCSs. The climatological mean and thresholds (90th and 10th percentiles of data values) are calculated for each day of the year with all data from multiple years within an 11 d window centred on that day. The climatology and thresholds are defined over 30 years from 1993 to 2022 for GLORYS12V1 and CMCSST and from 2010 to 2022 for the mooring data. A 30 d “moving window” is applied to smooth the daily climatology. The MHWs and MCSs are defined for temperatures above the 90th and below the 10th percentile values, respectively. Events that occur less than 2 d apart are regarded as one continuous event. The statistics for each MHW (MCS) event are calculated using a MATLAB-based tool (Zhao and Marin, 2019). This study will focus on the annual statistics of frequency, total days, and mean intensity. Frequency refers to the total count of MHW (or MCS) events in each year, while total days are the total number of MHW (or MCS) days in each year. The duration of each MHW (MCS) event is defined as the period over which the temperature is greater (lower) than the seasonally varying threshold value. The intensity of each event is the mean SST anomaly during that event. The mean intensity is the average of the intensities of events during that year.
3.1 Spatial distribution of annual surface MHW and MCS parameters
For surface MHWs, GLORYS12V1 and CMCSST data (Fig. 1c–f) obtain overall similar magnitudes and spatial patterns of mean intensity but different magnitudes of frequency in deep waters and total days in the seasonally ice-covered areas. For frequency (Fig. 1a and d), both data obtain values of 1–2 events yr−1 on the shelf, and, in deep regions (near and beyond the 2000 m isobath), GLORYS12V1 and CMCSST obtain higher and lower than 2.5 events yr−1, respectively. For the total days (Fig. 1b and e), GLORYS12V1 and CMCSST obtain similar values greater than 30 d yr−1 beyond the shelf break on the Scotian Slope and to the east of the Labrador Shelf and over the Grand Banks. Over the Newfoundland and Labrador Shelf and in the southern and western Gulf of St. Lawrence where the seasonal sea ice coverage exists, GLORYS12V1 obtains 25–30 d, higher than about 20 d from CMCSST. In the Gulf of Maine, eastern Scotian Shelf, and eastern Gulf of St. Lawrence, GLORYS12V1 obtains 25–30 d, while CMCSST obtains 20–25 d. For the mean intensity (Fig. 1c and f), both GLORYS12V1 and CMCSST obtain consistently higher values of 3–6 °C in the deep water of the Scotian Slope and to the east of the southern Grand Banks and lower values of less than 2.5 °C on the shelf and in the deep water to the east of the Labrador Shelf. The MHW parameters derived from GLORYS12V1 are consistent with those based on the thermograph network daily mean temperatures in the Gulf of St. Lawrence using the 1991–2020 reference period (Galbraith et al., 2024).
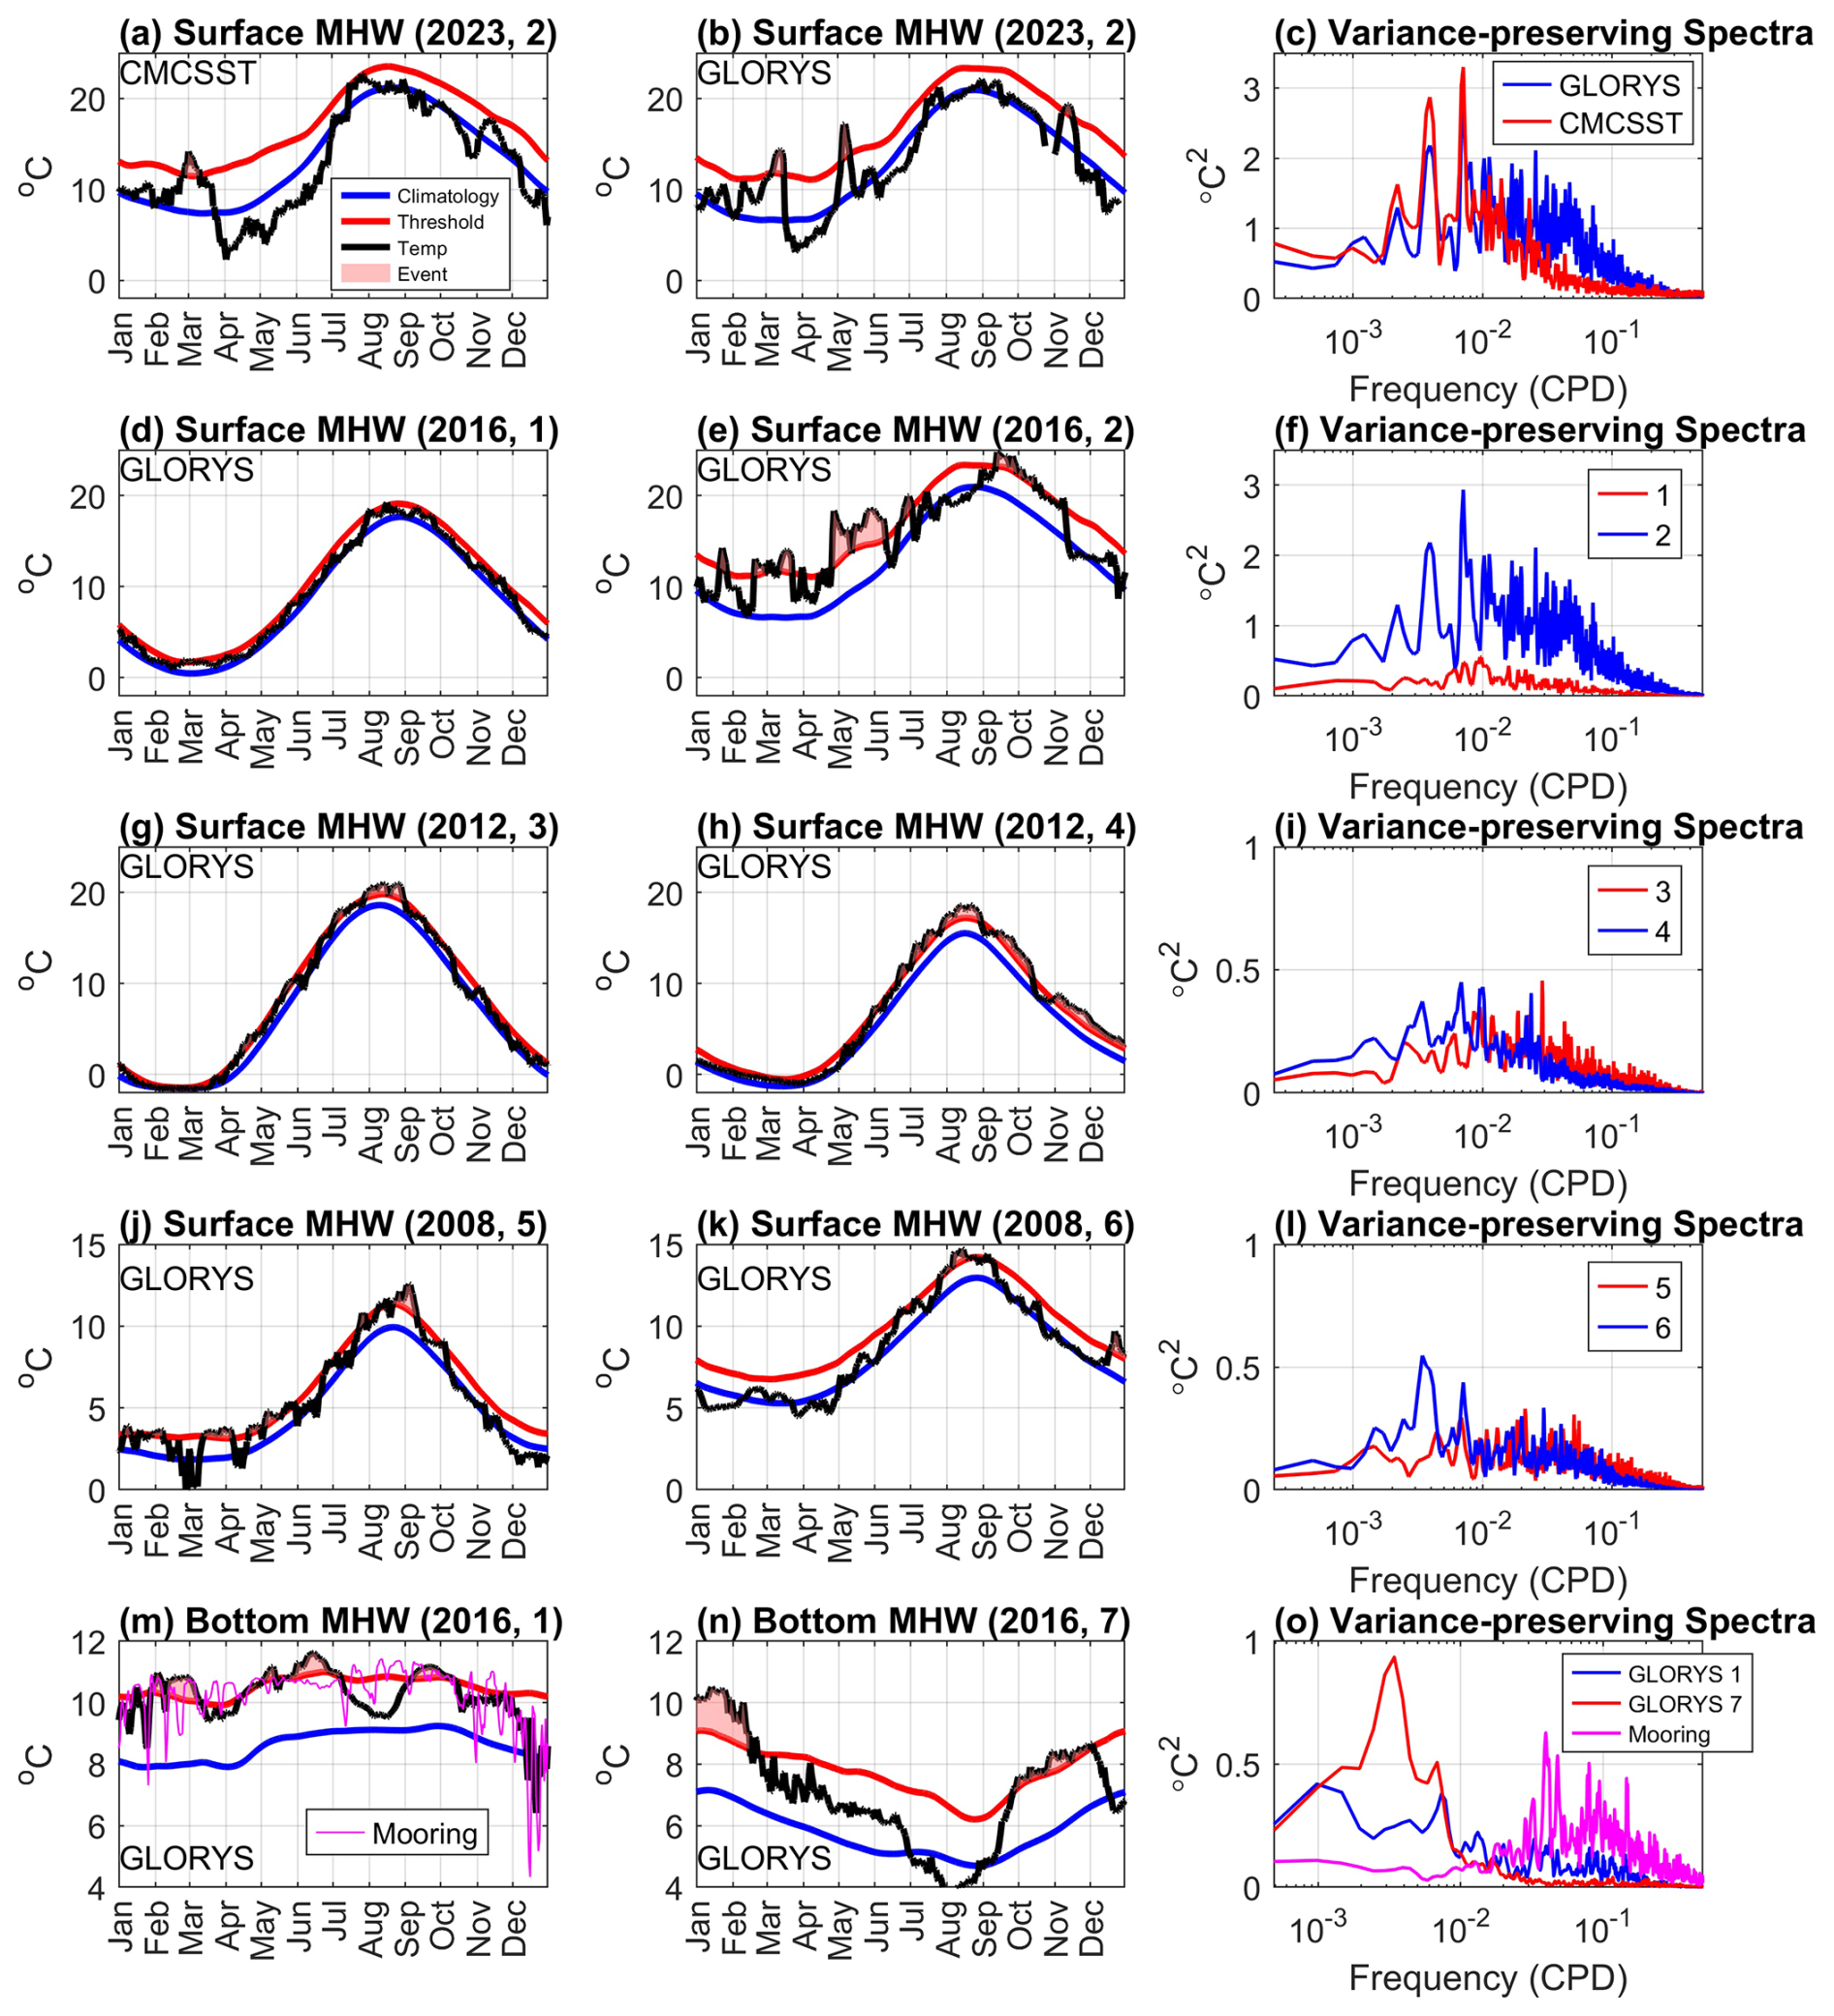
Figure 2Left and middle columns: time series of sea temperature and detection of MHW in selected years at the surface (a–b, d–e, g–h, j–k) and at the seabed (m–n) at seven locations marked in Fig. 1a. The numbers in parentheses indicate the year and location. Right column: variance-preserving spectra of (c, f, i, l) surface temperature during 1993–2022 and (o) bottom temperature during 2010–2022.
The causes of the differences in the MHW parameters derived from GLORYS12V1, CMCSST, and mooring data and the spatial distributions derived from GLORYS12V1 are explored through examining the time series of sea temperatures and the detection of MHWs at selected locations (denoted in Fig. 1a) in selected years and the variance-preserving spectra during 1993–2022 shown in Fig. 2. The selection of years is based on annual time series of the MHW parameters at these locations (not shown), ensuring that the differences in the MHW parameters between the left and middle columns are consistent with the 1993–2022-averaged statistics shown in Fig. 1. Firstly, on the Scotian Slope, the higher surface MHW frequency from GLORYS12V1 than from CMCSST can be explained by their differences in the variance-preserving spectra of the SST time series during 1993–2022 at location 2 (Fig. 2c). Compared with CMCSST, GLORYS12V1 achieves higher spectral power at timescales shorter than 50 d. In the selected year 2023, GLORYS12V1 shows the more frequent and stronger SST variations and detects three shorter MHW events, whereas CMCSST detected one longer MHW event. Note that the high-frequency SST variations in CMCSST are impacted by the cloud correction and interpolation schemes applied to the original satellite data in generating the CMCSST product.
In the southern and western Gulf of St. Lawrence, the St. Lawrence Estuary, and on the Labrador and Newfoundland Shelf, CMCSST has shorter total days than GLORYS12V1 (Fig. 1b and e). In the selected year 2011, Fig. A3 presents the SST time series at a location (52.8° N, 55.2° W) on the Labrador Shelf. The original CMCSST data have a significant number of missing values from January to April during the presence of seasonal sea ice (Fig. A3a), leading to the 90th threshold above that derived from GLORYS12V1 (Fig. A3a and b). If the missing values of the original CMCSST are filled with a freezing temperature of −1.8 °C, the resulting 90th threshold (Fig. A3c) and the total days of the detected MHWs are closer to those derived from GLORYS12V1 (Fig. A3b). Thus, the shorter MHW total days from CMCSST in regions with the presence of seasonal sea ice are due the biased 90th threshold caused by the missing SST data values.
The spatial patterns of surface MHW parameters from GLORYS12V1 (Fig. 1d–f) are explained next. The differences between the shelf and the Scotian Slope are demonstrated by comparing the SST time series in 2016 and spectra at locations 1 and 2 (Fig. 2d–f). At all the timescales, location 2 shows much stronger SST variability because it is located in the Scotian Slope where the water mass is affected by a succession of warm and cold oscillations and eddies. In the selected year 2016, GLORYS12V1 detects six strong MHW events at location 2 but only one weak event at location 1. In the Gulf of St. Lawrence, the average annual frequency (Fig. 1d) is lower in the northeastern regions (location 4) and higher in the southwestern (location 3) regions, while the total days (Fig. 1e) show the opposite pattern. This is consistent with the SST time series in the selected year 2012 (Fig. 2g–h) and the variance-preserving spectra (Fig. 2i). That is, the spectral energy at location 3 is higher at timescales shorter than 100 d, hence leading to higher MHW frequency, and is higher at location 4 at timescales longer than 100 d, hence leading to longer durations. The higher total days at station 4 in 2012 are due to the long durations of warming above climatology in fall and winter. Off the Labrador Shelf, over a narrow zone near the 2000 m isobath (location 5), the surface MHW frequency is higher, while the total days are shorter, compared to shelf water to the west and the deep water to the east (location 6). This can again be explained by the stronger SST variability at timescales shorter than 100 d at location 5 and longer than 100 d at location 6, respectively (Fig. 2j–l). Location 5 is along the path of the offshore Labrador Current, where the SST anomalies and seasonal cycle are both strong, which can be attributed to the variations in the temperature front in this area (e.g., Lu et al., 2006).
For the surface MCSs derived from GLORYS12V1, their frequency, total days, and mean intensity (Fig. 1g–i) show similar magnitudes and spatial distribution to those of surface MHWs (Fig. 1d–f). The MCS parameters derived from CMCSST (not shown) are also similar to the surface MHW parameters derived from GLORYS12V1 (Fig. 1a–c). Differences between the MCS and MHW parameters derived from GLORYS12V1 are evident in some areas; e.g., on the Scotian Slope (near location 2), the MHWs have higher mean intensity than the MCSs. These similarities and differences can be explained by the probability distribution of SST anomalies at representative sites shown in Fig. A1. The normalized histograms are nearly symmetrical around the mean, with equal median and mean values. At location 2, the median value is less than the mean, suggesting a positive skewness of SST anomalies on the Scotian Slope due to the dominance of warm-core eddies at the poleward side of the Gulf Stream (e.g., Thompson and Demirov, 2006). Such asymmetric distribution of SST anomalies corresponds to stronger MHWs than MCSs (Schlegel et al., 2021a; Wang et al., 2022).
3.2 Distribution of MHW parameters over the sea floor and in the water column
The frequency, total days, and mean intensity of bottom MHWs on the shelf derived from GLORYS12V1 (Fig. 1j–l) show different magnitudes and spatial distributions compared to surface MHWs. Our findings are consistent with those of Amaya et al. (2023a), who showed that bottom MHW intensity and duration vary strongly with bottom depth. The bottom MHW frequency (Fig. 1j) shows fewer events (< 1 yr−1) in deep basins and channels and more events (2–3 yr−1) along the coast and shelf break. The bottom MHW total days (Fig. 1k) exhibit weak spatial variations across the entire region, with values of 30–35 d yr−1, and larger values in deeper basins and channels than in shallow waters. This implies that the bottom MHW durations (roughly total days divided by frequency) are longer in deep basins and channels than in shallow water. The bottom MHW intensity (Fig. 1l) ranges from 1 °C in deeper parts of the continental shelves to 6 °C along the edges of the Scotian Shelf and southern Grand Banks, where water intrusions from the shelf break occur.
We selected two locations on the Scotian Shelf (locations 1 and 7) to illustrate the difference in MCS characteristics at the sea floor (Fig. 2m–o). Location 1 is the mooring site near the coast where the water depth is 160 m, and location 7 is on the Emerald Bank in the middle of the Scotian Shelf where the water depth is 66 m. At location 1, both GLORYS12V1 and mooring data (Fig. 2m) show that bottom temperatures in 2016 were generally above the mean climatology, and extreme heat events are detected throughout the year. However, mooring data show some intense cold spikes that are not captured by GLORYS12V1 (Fig. 2m). Correspondingly, compared with the mooring data, the spectral energy of GLORYS12V1 is lower at timescales shorter than 100 d and higher at timescales longer than 100 d (Fig. 2o). At location 7, GLORYS12V1 detects two MHW events with longer durations in 2016 (Fig. 2n). The power spectra (Fig. 2o) show that location 1 has more energy at timescales shorter than 100 d, corresponding to higher MHW frequency and mean intensity, while location 7 shows stronger variability at timescales longer than 100 d, corresponding to longer MHW duration and lower intensity. The strong variations in bottom temperature at shorter than 100 d at location 1 are likely related to the strong fluctuations in the coastal Nova Scotia Current driven by local winds at synoptic scales (Dever et al., 2016).
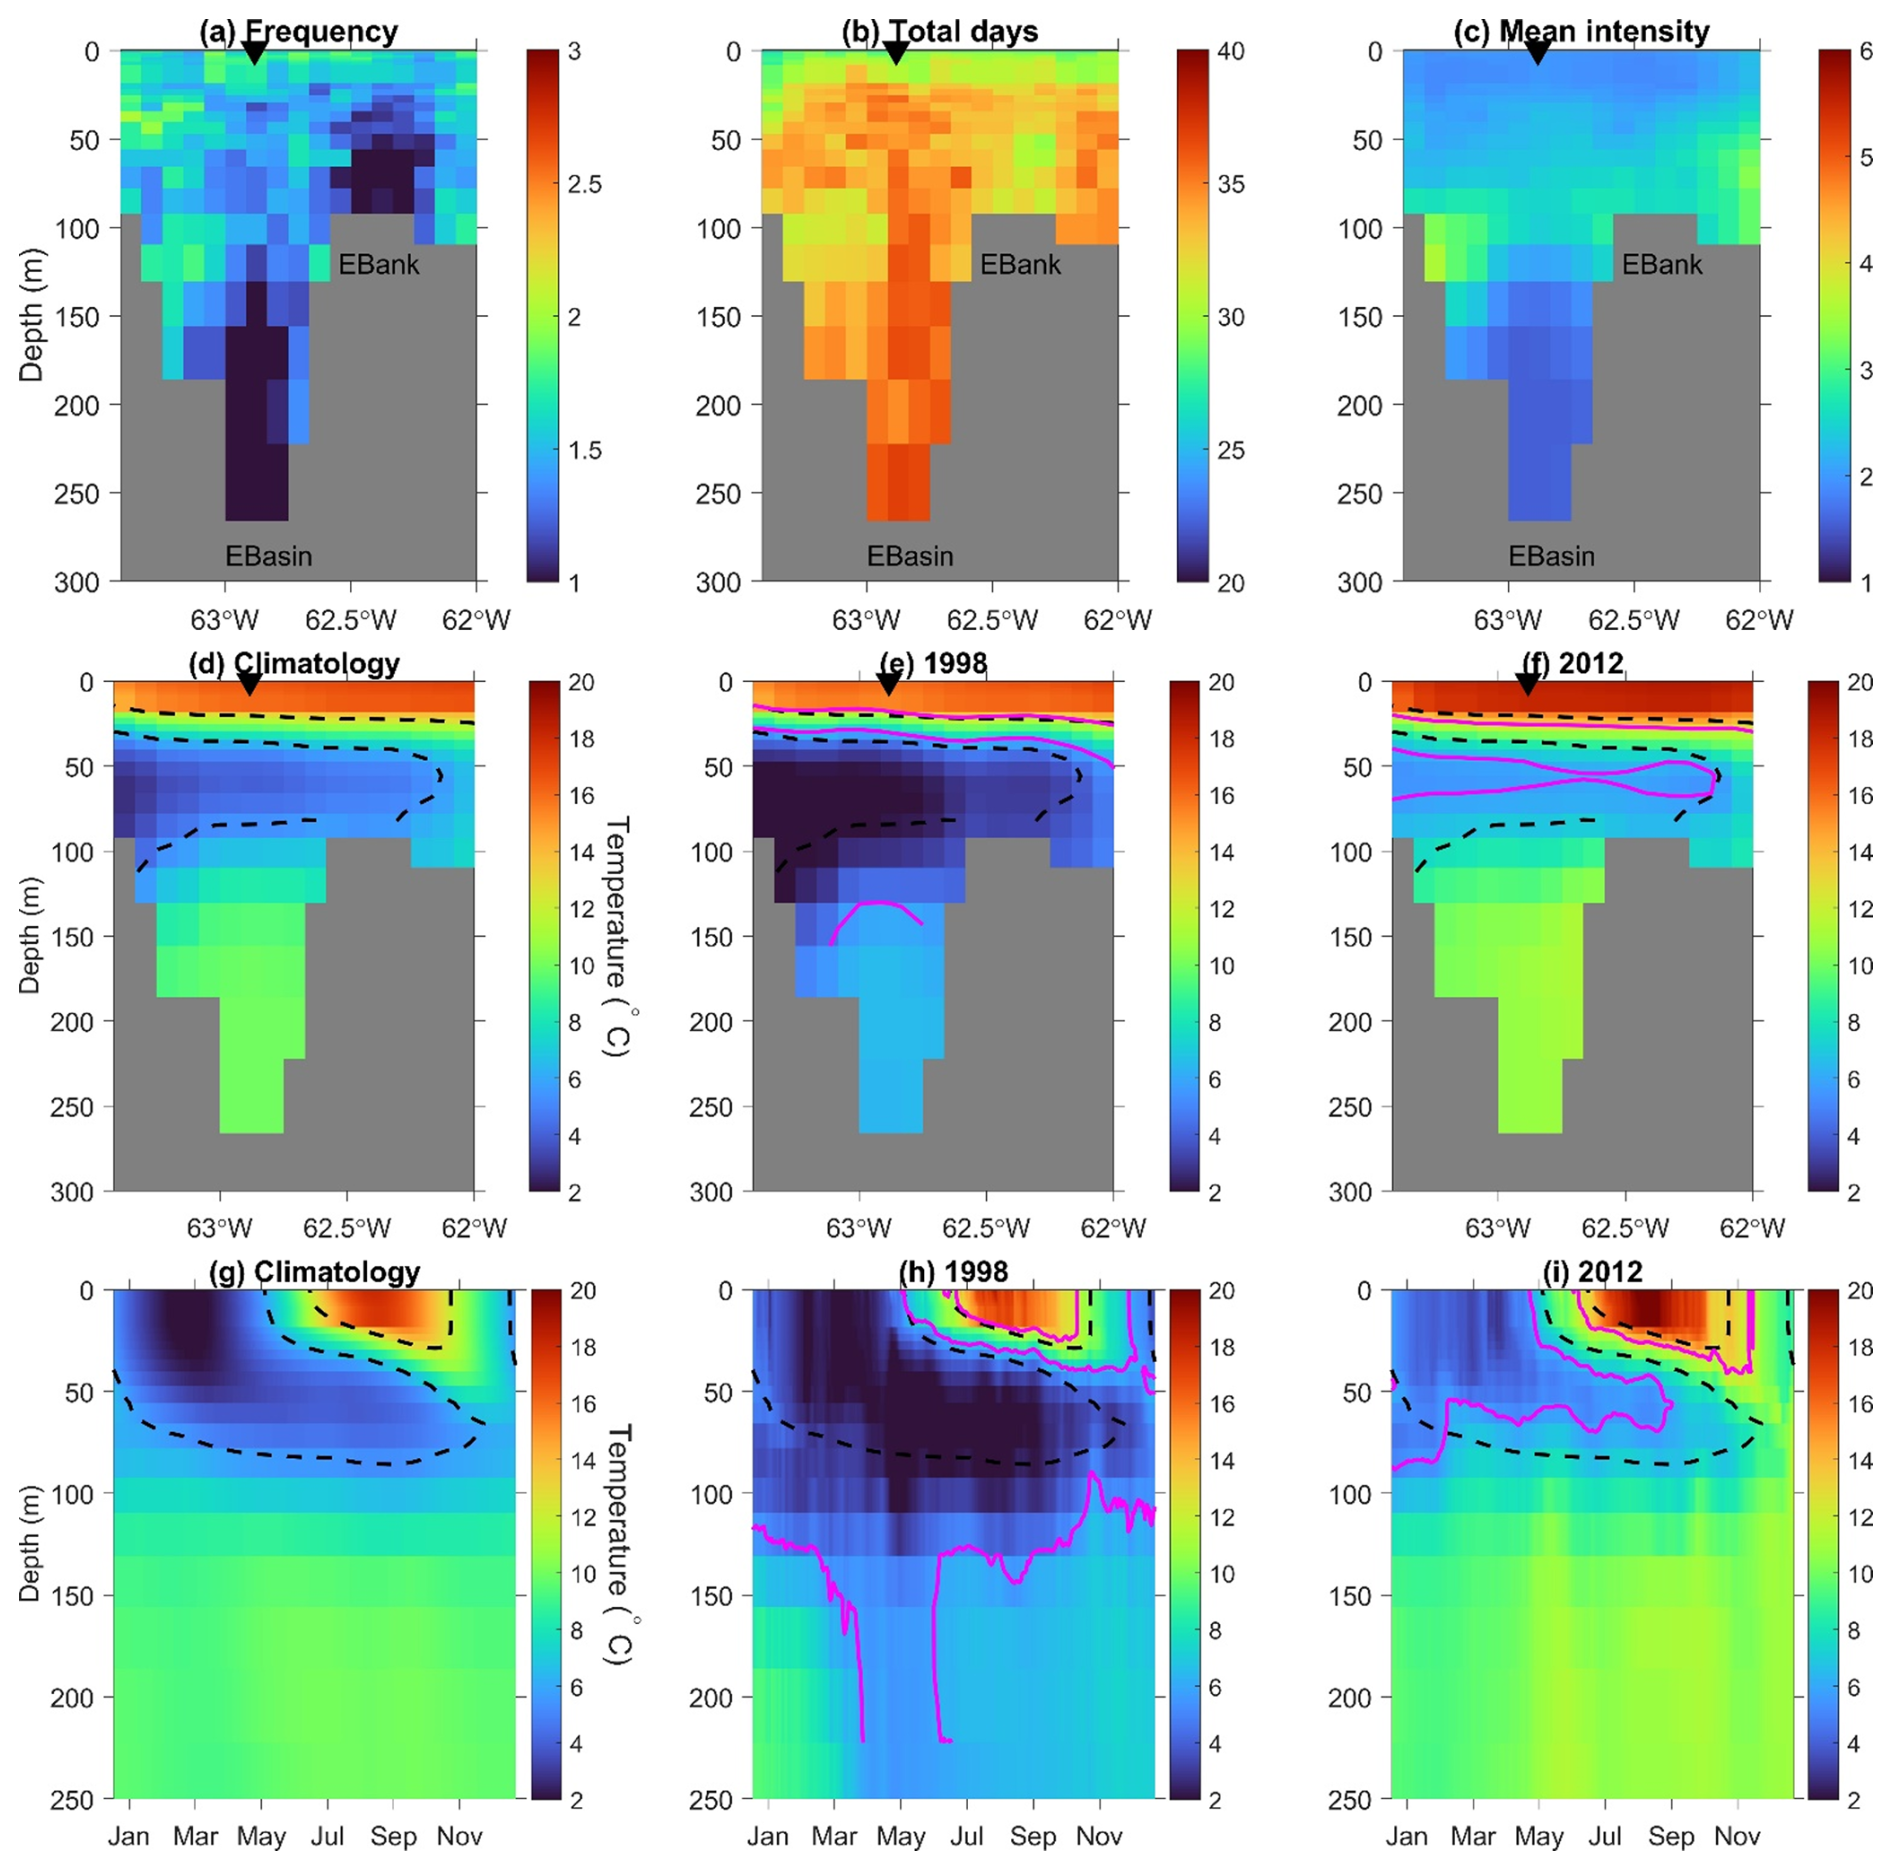
Figure 3Along the Halifax line (a line between stations 1 and 2 shown in Fig. 1a): MHW (a) mean annual frequency (number of events per year), (b) mean of annual total days (days per year), and (c) mean intensity (°C); summer (July–September) temperature climatology (d) over 1993–2022, (e) in 1998, and (f) in 2022. At a station along the Halifax line (marked as the solid black triangle in panels (a)–(f)): seasonal evolution of temperature climatology (g) over 1993–2022, (h) in 1998, and (i) in 2012. Contour lines denote the isotherms of 6 and 12 °C: (d–i) dashed black contours for averages over 1993–2022 and solid magenta contours in (e, h) 1998 and (f, i) 2012. Abbreviations: EBasin, Emerald Basin; EBank, Emerald Bank.
To examine the linkages between surface and water column extreme events, we show the distributions of MHW parameters in the water column along the section extending off the coast from Halifax between stations 1 and 2 (Fig. 3a–c). This cross-section, referred to as the Halifax line, has regularly been occupied by the AZMP over multiple decades, thus providing extensive observed hydrographic data to assess the quality of model-based data such as GLORYS12V1. The MHW mean intensity (Fig. 3c) shows a clear three-layer structure, with values of about 2 °C in the upper layer from the surface to a mid-depth interface (decreasing from about 70 m near the coast to about 30 m on the Emerald Bank), high values of 3–3.5 °C in the middle layer from the mid-depth interface to about 130 m, and low values of 1.5–2 °C below 130 m depth in the Emerald Basin. The annual MHW frequency (Fig. 3a) is relatively uniform in the water column with values of 1.5–2 yr−1, except low values (< 1 yr−1) below 130 m depth in the Emerald Basin and below 30 m depth over the Emerald Bank, where the annual MHW duration is high.
The distribution of MHW parameters in the water column can be explained by the layered structure of temperature along this section in summer (Fig. 3d–f) and the seasonal evolution of the vertical profiles of temperature at a location in the middle of Emerald Basin (Fig. 3g–i) for the mean climatology over 1993–2022 and in the cold and warm years of 1998 and 2012, respectively (Hebert et al., 2023). The upper layer (from the surface to 50 m) shows strong seasonal variations. This layer is well mixed in fall/winter and has strong stratification developed from spring to summer. Seasonal and interannual variations in this upper layer are mainly due to variations in the surface heat flux and are also influenced near the coast by the outflowing waters from the Gulf of St. Lawrence with strong seasonal and interannual variations in temperature and salinity (Umoh and Thompson, 1994; Dever et al., 2016). The overall major influence of surface heat flux results in a nearly uniform distribution of the MHW parameters in the upper layer. The middle layer (from 50 m to about 130 m depth) presents moderate seasonal variations which can be related to the downward penetration of the surface anomalies driven by surface winds and mixing. On the other hand, this layer is also influenced by the lateral advection of water masses carried by the horizontal currents, mainly from the Cabot Strait subsurface water (30–50 m) and the warm Scotian Slope water and with a smaller portion from the Cabot Strait cold-intermediate layer (50–120 m) and the inshore Labrador Current (Dever et al., 2016). The contributions of the lateral advection vary from the coast to offshore, resulting in the depth range of the mid-depth layer getting smaller from near the coast to the Emerald Bank. The influences of surface forcing and horizontal advection cause high MHW intensity across the whole mid-depth layer and low MHW frequency over the Emerald Bank. The deep layer below 130 m depth in the Emerald Basin (Fig. 3g) presents weak seasonal variations, with a near-constant temperature of 10 °C. However, this layer became colder in 1998 and warmer in 2012 than the climatology (Fig. 3h–i), suggesting strong interannual variations in temperatures in this layer. The temperature variations in this deep layer are mainly caused by the intrusion of the offshore water (Dever et al., 2016), leading to low MHW intensity and frequency and long durations.
3.3 Interannual variations in MHW/MCS parameters
Interannual variations in the MHW/MCS parameters at location 1 in the inner Scotian Shelf are presented in Fig. 4, and some of their statistical quantifications are summarized in Table 2. For the surface parameters (Fig. 4, left column), variations in their values derived from GLORYS12V1 have high correlations with those derived from CMCSST except for the MCS mean intensity. The surface MHW (MCS) total days (Fig. 4a and e) show strong interannual variations which have significantly positive (negative) correlations with the annual SST anomalies from GLORYS12V1 (Table 2). The MHW/MCS mean intensities show weaker interannual variations and have no significant correlations with the SST anomalies.
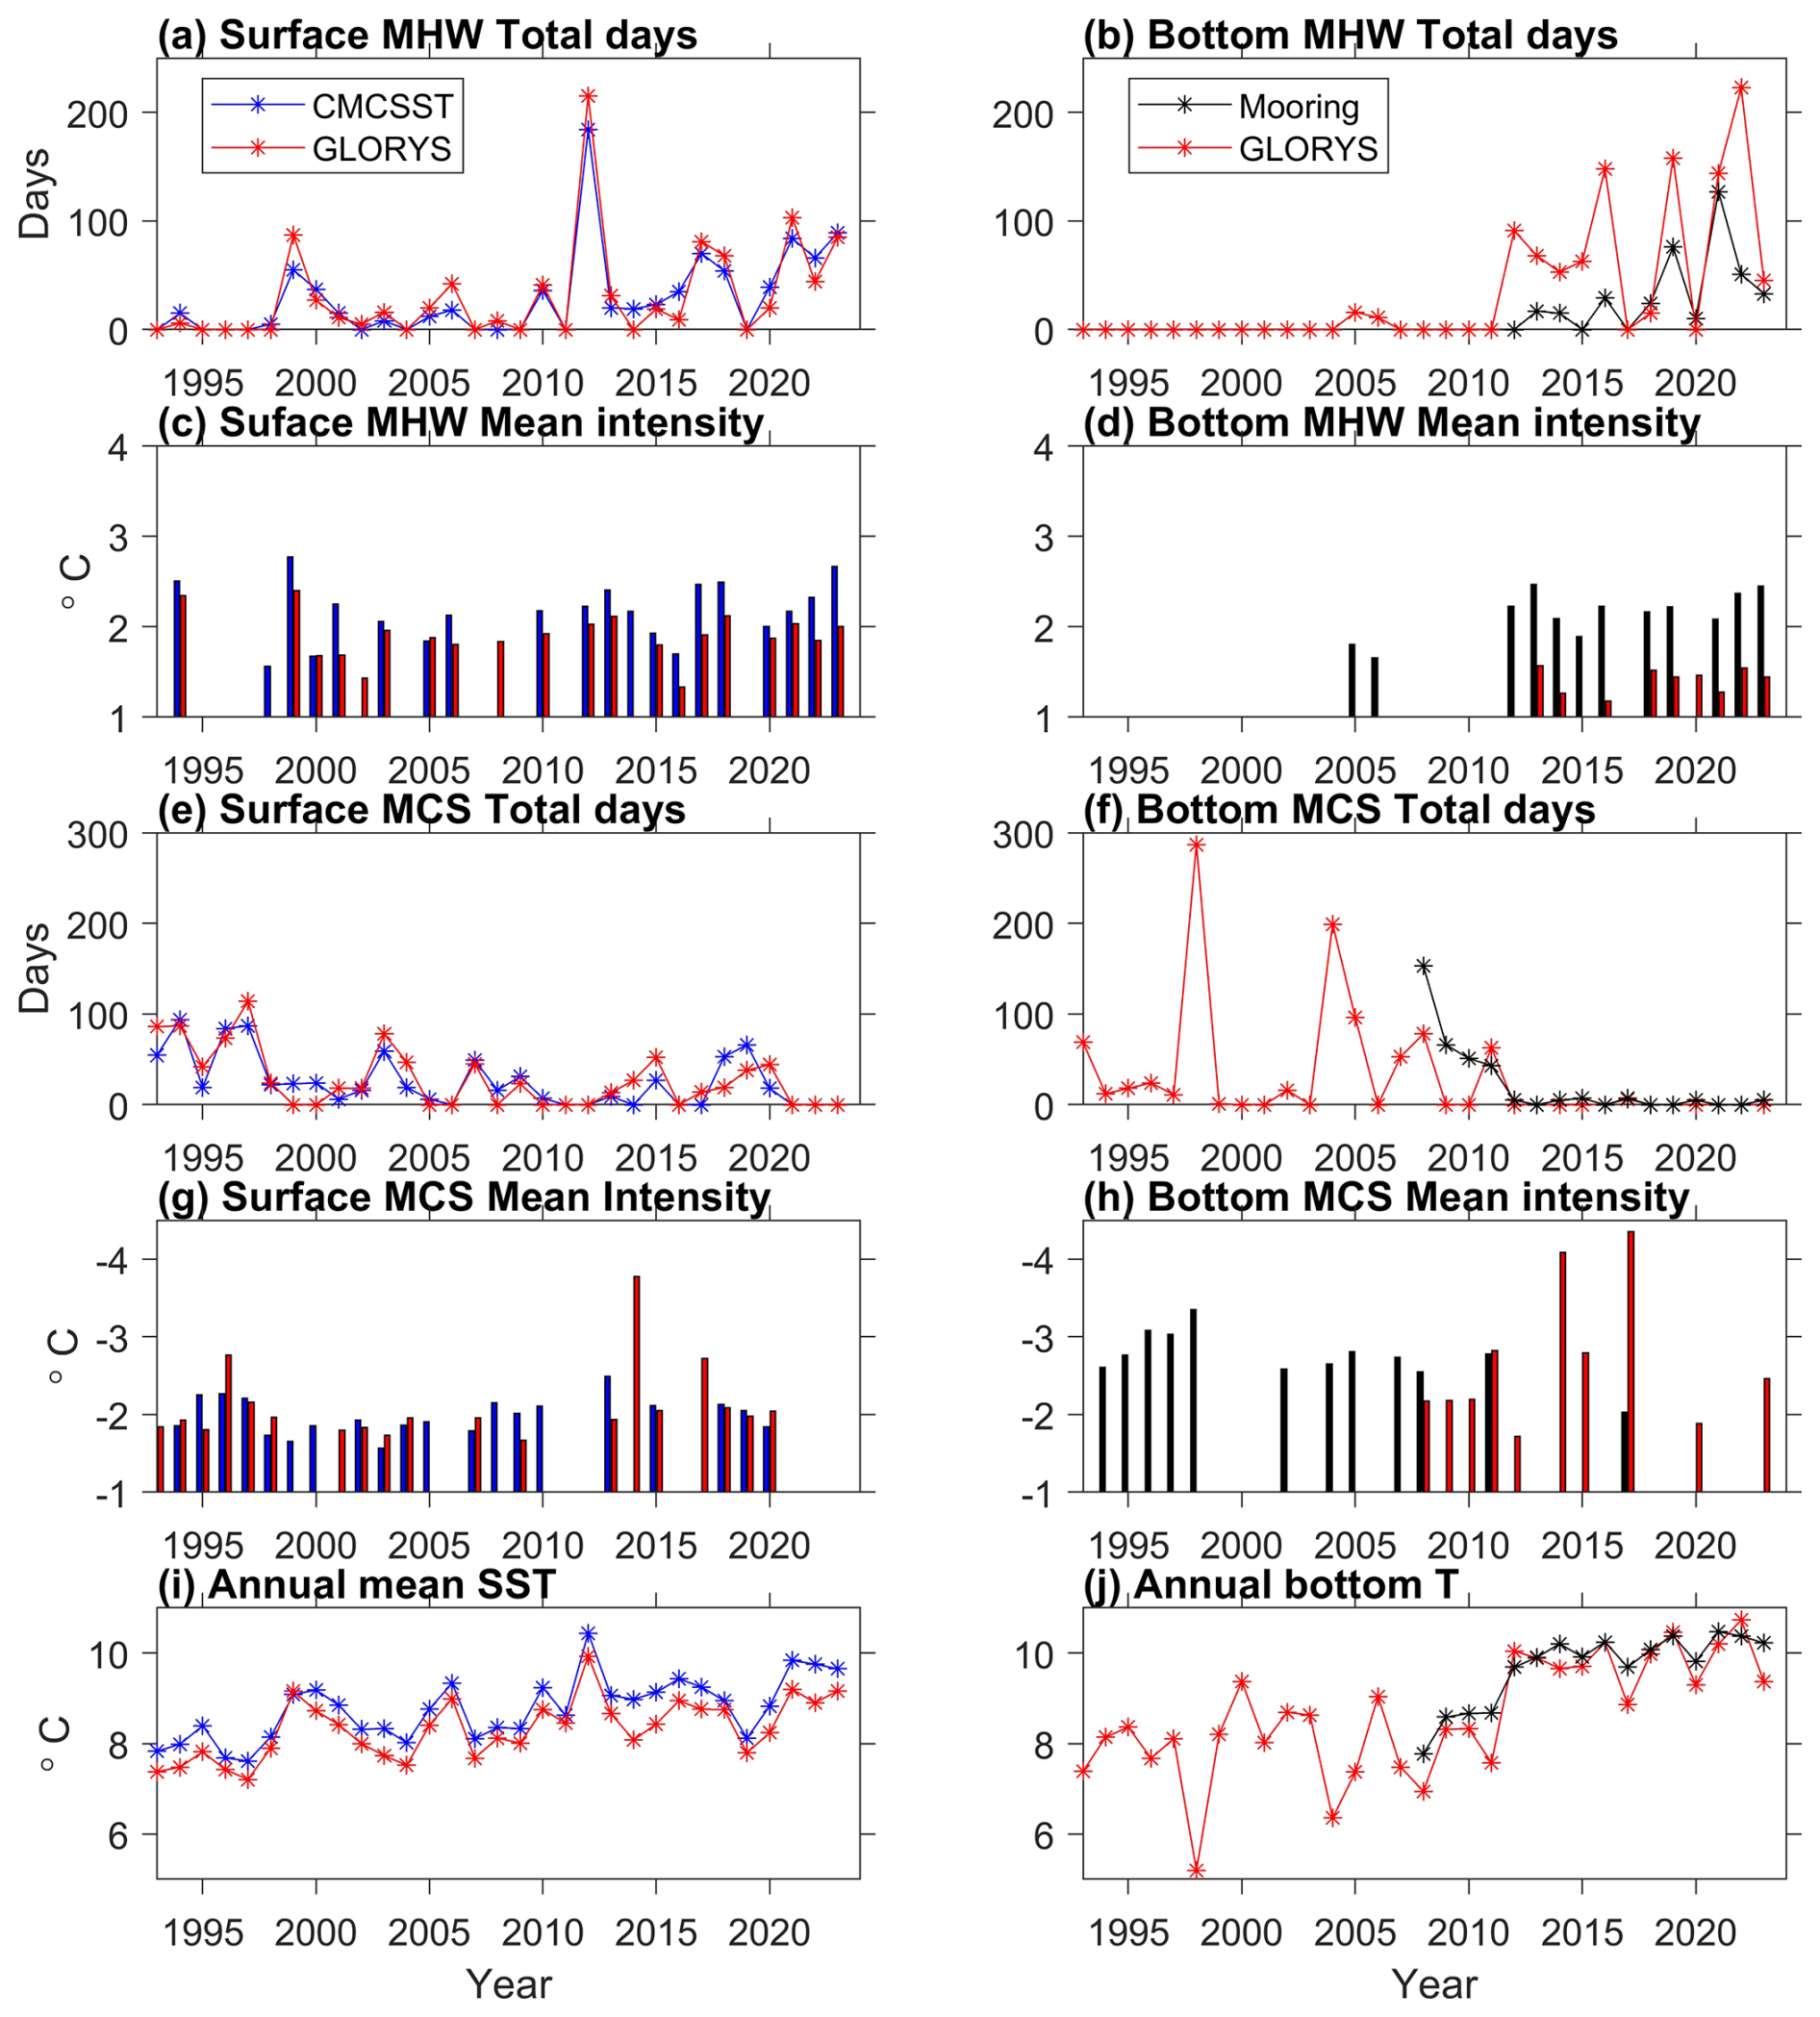
Figure 4Time series of MHW and MCS characteristics at location 1 (marked in Fig. 1) for surface (a, c, e, g, i) and for bottom (b, d, f, h, j). (a, b) MHW total days, (c, d) MHW mean intensity, (e, f) MCS total days, (g, h) MCS intensity, (i, j) comparison of annual mean time series of GLORYS12V1 with CMCSST and mooring data.
Table 2Statistics of annual values of MHW/MCS parameters during 1993–2023 at location 1 on the inner Scotian Shelf. Column 2: linear trends of MHW/MCS frequency in events per year, total days in days per year, and mean intensity in °C per year derived from GLORYS12V1. Column 3: correlation coefficient of MHW/MCS parameters derived from GLORYS12V1 and from CMCSST at the surface and mooring temperature at the sea floor. Column 4: correlation coefficient between MHW/MCS parameters and annual GLORYS12V1 temperature. Significant trends and correlations with p values less than 0.1 are shown.
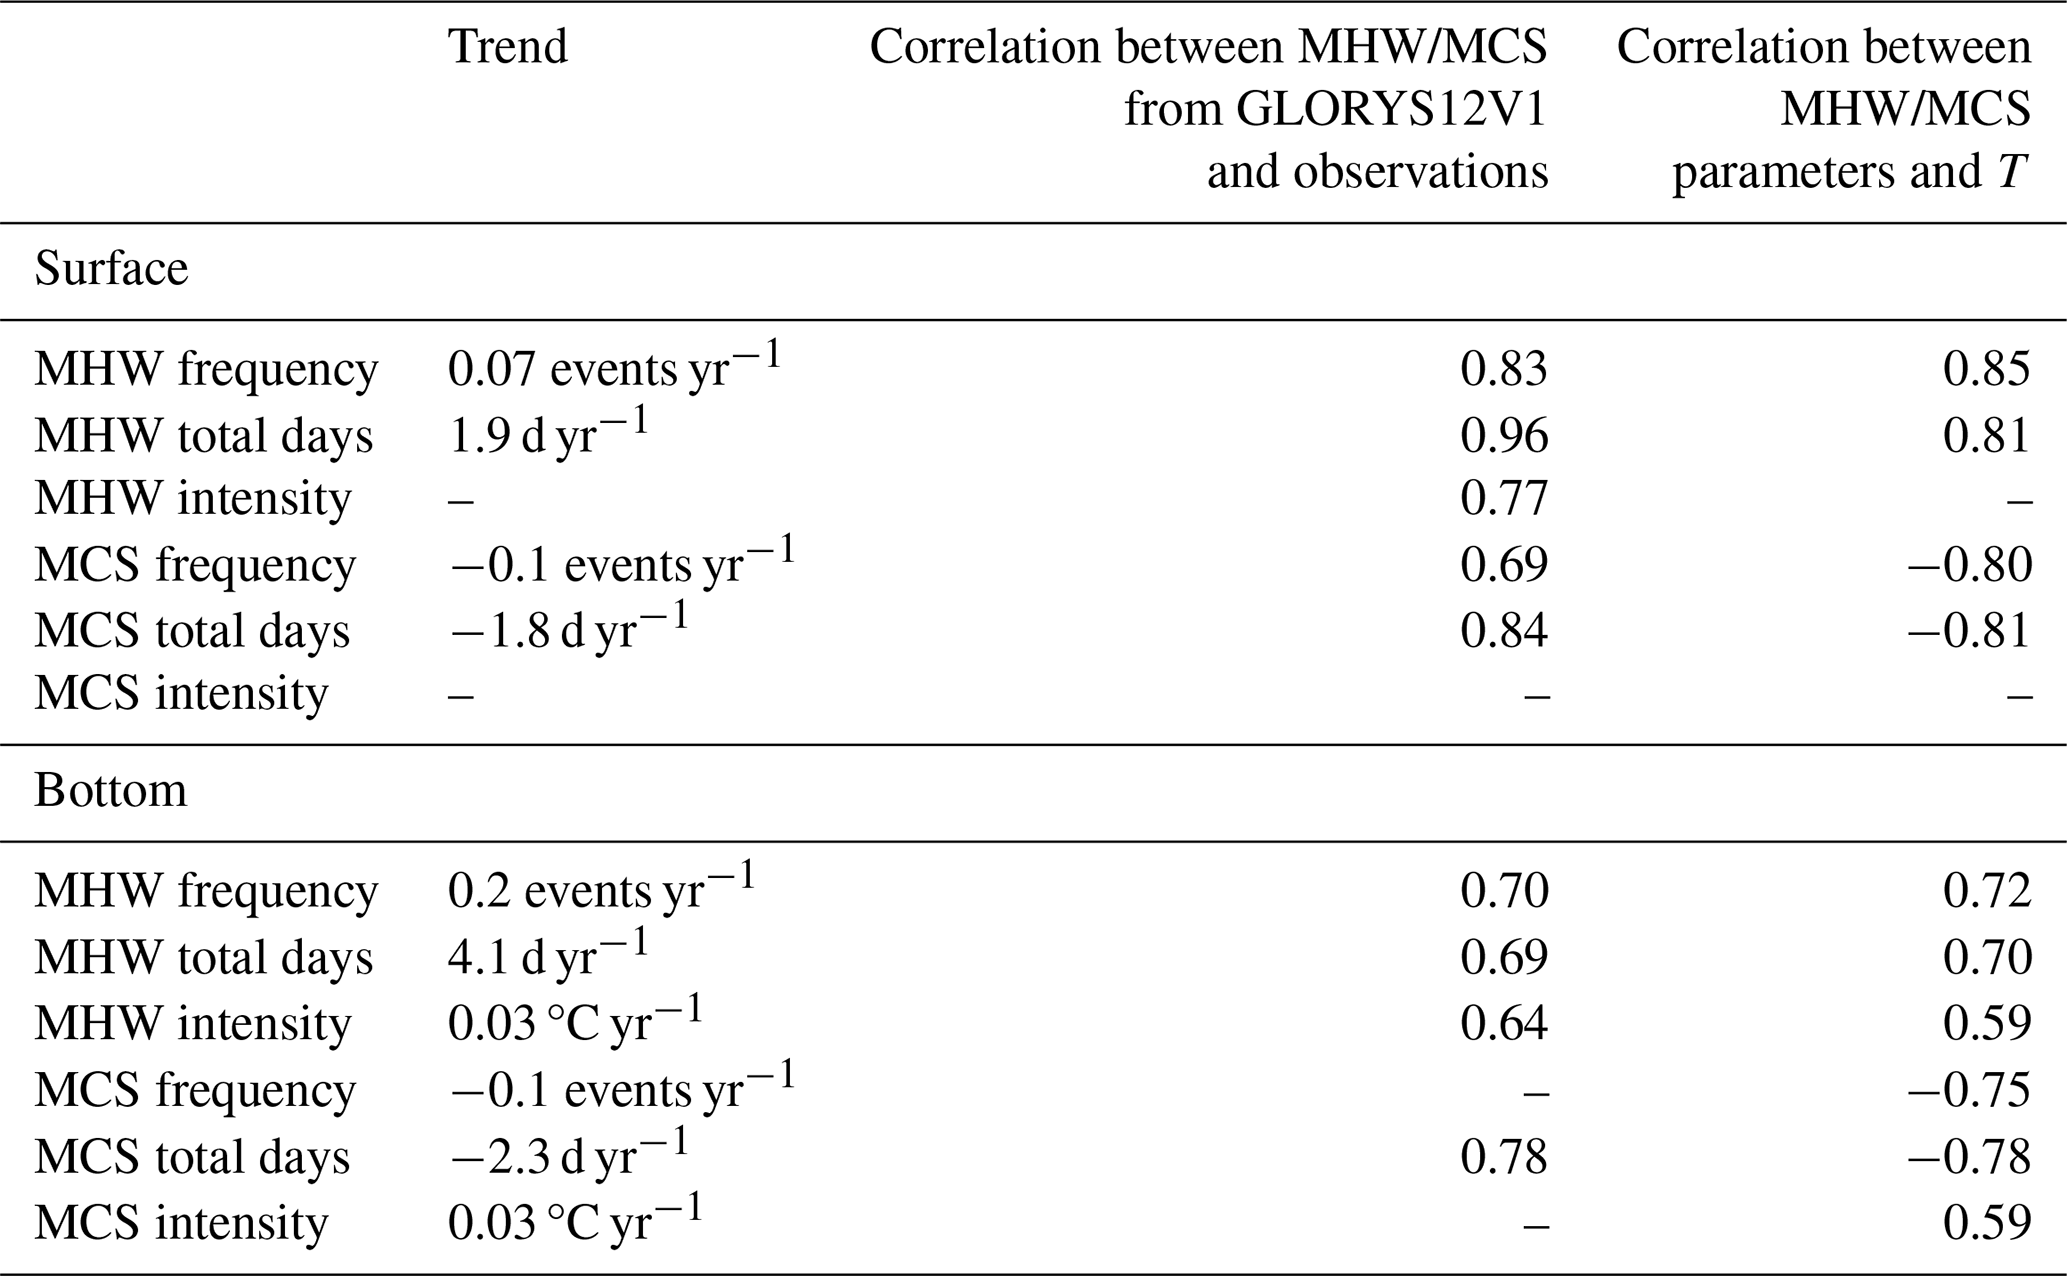
For the bottom parameters (Fig. 4, right column), significant correlation values derived from GLORYS12V1 and available mooring data are found for the MHW frequency, total days, and mean intensity but not for the MCS parameters (Table 2). This can be attributed to GLORYS12V1 not being able to reproduce the intense cold spikes in the mooring data (Fig. 2m). For both the bottom MHWs and MCSs, interannual variations in their frequency, total days, and mean intensity all have significant correlations with the annual bottom temperature anomalies from GLORYS12V1. The bottom MHW total days and mean intensity derived from the mooring data are significantly lower than those derived from GLORYS12V1. This is due to the differences in the bottom temperature climatology of the two datasets defined for the calculation of the MHW/MCS parameters. While the two datasets show similar values and increasing trends in the bottom temperatures, the climatology of mooring data during the 16 years of 2008–2023 has a higher averaged temperature than that of GLORYS12V1 during the 30 years of 1993–2022 (Fig. 4j). As a result, the mooring data obtain shorter and weaker bottom MHW events than GLORYS12V1. If the same reference period of 2008–2023 is used, the difference in MHW parameters between mooring data and GLORYS12V1 is largely reduced. This suggests that the calculation of MHW/MCS parameters is strongly impacted by the duration chosen for computing the climatology and whether detrending is applied, as discussed in Capotondi et al. (2024) and Smith et al. (2025).
At location 1 during 1993–2023, both at surface and bottom, interannual variations in the MHW and MCS total days are negatively correlated; the intensity and total days of MHWs show positive trends, while those for MCSs show negative trends (Table 2). These correspond to warming trends in both the SST and bottom temperature (Fig. 4i–j). The MHW and MCS mean intensities show no significant trends at surface but positive trends at bottom (Table 2). For the bottom MHW/MCS total days, the trends are mostly due to their sharp increases (or regime shift) around 2012 (Fig. 4b and f). Out of the 19 years before 2012, bottom MCS events are detected in 11 years, while MHW events are detected only in 2 years. By comparison, out of the 12 years since 2012, bottom MHW events are detected in 10 years, while MCS events are detected only in 1 year. These correspond to the sharp increase in bottom temperature that also occurred around 2012 (Fig. 4j). By comparison, the SST at location 1 shows a more gradual increasing trend (Fig. 4i). After 2012, the annual bottom temperature became higher than the annual SST. As a result, the bottom MHW total days frequently exceed 150, higher than 50–100 for large values of the surface MHW total days (Fig. 4a and b). The long-term trends and regime shifts of bottom MHW/MCS total days are widespread on the Scotian Shelf, as evidenced by the similar time series of location 1 at a location in the Emerald Basin and location 7 on the Emerald Shelf (Fig. A2). This raises the question of how to define MHWs/MCSs in the presence of long-term trends or regime changes in ocean temperature, a point to be discussed in Sect. 4.
The time series plots identify years when severe MHW or MCS events occurred. At location 1, the surface MHW total days show the highest values in 2012, reaching 215 d according to GLORYS (Fig. 4a). Both GLORYS12V1 and CMCSST detect seven MHW events with a duration ranging from 7 to 61 d. These prolonged surface MHW events correspond to the highest peak of annual SST (Fig. 4i) and the well-known warming conditions across the Scotian Shelf (Hebert et al., 2013), in the Gulf of Maine, and on the east coast of the USA in 2012 (Chen et al., 2015). In December 2011, the SST in the region was close to the 90th percentile and likely played a role in preconditioning the MHW in January 2012. Chen et al. (2015) further attributed the widespread MHW events to persistent atmospheric high-pressure systems featured by anomalously weak wind speeds, increased insulation, and reduced ocean heat losses. At location 1, the termination of a long-lasting and strong surface MHW event in the summer of 2012 (Fig. 3i) can be attributed to wind-induced coastal upwelling, resulting in a sudden drop in SST at the end of August (Shan and Sheng, 2022).
In 2012, at location 1, the bottom MHW total days experienced a sharp increase relative to previous years, reaching ∼ 100 d according to GLORYS12V1 (Fig.4b). In the summer of 2012, the entire water column along the Halifax line was warmer than the climatology (Fig. 3d and f). In the Emerald Basin (Fig. 3g and i), the abnormally warm conditions presented from the surface to about 100 m depth at the beginning of the year (winter), which can be attributed to the smaller heat loss to the atmosphere at the sea surface. Below the 100 m depth, warming started in spring. Below the upper layer directly influenced by surface forcing, the warming in 2012 can be attributed to advection over the Scotian Shelf between 30–50 m, the advection of anomalously warm slope water combined with the reduced contribution of the cold water from the Gulf of St. Lawrence or the inner Labrador Shelf between 50–100 m, and the anomalously warm slope water being advected onto the shelf between 100–200 m (Dever et al., 2016). The warm Scotian Slope water was influenced by the interaction between the Gulf Stream and the Labrador Current at the tail of the Grand Banks (Brickman et al., 2018; Gonçalves Neto et al., 2023).
The conditions in 1998 are opposite to those in 2012; i.e., (1) location 1 experienced the longest bottom MCS total days (nearly 300 d) associated with the lowest annual bottom temperature value (Fig. 4f and j), (2) in summer the entire water column along the Halifax line was colder than the climatology (Fig. 3d and e), and (3) in the Emerald Basin (Fig. 3g and h) the entire water column was anomalously cold throughout the year except for close-to-normal conditions in the upper layer in summer. Below 150 m depth in the Emerald Basin, the lowest temperature occurred during March–June. This can be related to the intrusion of the cold Labrador Slope water. According to Drinkwater et al. (2003), this cold water mass was advected along the shelf break in 1997–1998 and flooded the lower layers of the central and southwestern regions of the Scotian Shelf.
In 2023, at location 1, according to GLORYS12V1, the surface MHW total days amount to 85 (Fig. 4a), which is well above the average value of 31 d. The mean intensity is 2 °C (Fig. 4c), similar to the multi-year-averaged intensity. The longest surface MHW event of that year began on 19 December 2022 and continued until 8 February 2023, coinciding with the warmest January on record in Halifax. The termination of this MHW event is likely related to an extremely cold Arctic air outbreak that set many local meteorological records in early February in Atlantic Canada and caused rapid drops in water temperature in some shallow coastal bays (Casey et al., 2024).
Firstly, in this study, the annual mean MHW/MCS parameters derived from GLORYS12V1 and observational data are compared. At the surface, GLORYS12v1 and CMCSST obtain similar magnitudes and spatial distribution, along with interannual variations in MHW/MCS frequency, total days, and mean intensity. Differences in the values of the parameters can be attributed to issues in the CMCSST data: (1) shorter MHW total days in the Gulf of St. Lawrence and Labrador and Newfoundland Shelf due to the higher threshold values caused by the missing SST data in the presence of ice and (2) less frequent MHWs on the deep Scotian Slope associated with weaker SST variations caused by the interpolations and cloud correction applied to the satellite remote sensing data for generating the CMCSST. Thus, we suggest that high-resolution data assimilative ocean reanalysis products present more advantages in quantifying surface MHWs and MCSs than SST products based on satellite remote sensing. For the bottom MHWs and MCSs, the analysis results from GLORYS12V1 are compared with those from 16 years of bottom mooring observations at location 1 near the coast of Nova Scotia. GLORYS12V1 captures all parameters of observed bottom MHWs and the total days of bottom MCSs at this location. However, GLORYS12V1 does not reproduce the intense cold spikes of observed bottom temperature and hence detects fewer and less intense bottom MCSs at this location. This can be attributed to the spatial resolution of GLORYS12V1 being insufficient to resolve the sharp spatial gradients of the Nova Scotia Current. Therefore, near the coast of Nova Scotia, GLORYS12V1 underestimates the frequency and intensity of the bottom MCSs, although it provides estimates of the total days in agreement with the mooring data.
Secondly, the horizontal/depth distributions of the annual MHW/MCS parameters are explained by the characteristics of temperature variations and the related ocean dynamics. The corresponding parameters of surface MHWs and MCSs are overall similar due to the nearly symmetrical probability distribution of SST anomalies around the mean, except on the Scotian Slope, where the MHWs have lower frequency and higher mean intensity than the MCSs due to the dominance of warm-core eddies. The surface MHWs have the highest frequency (2–3 events yr−1) and mean intensity (3–6 °C) on the Scotian Slope and to the east of southern Grand Banks, due to the strong SST variability associated with the eddy activities and variations in the Gulf Stream and North Atlantic Current. The shelf waters show nearly uniform values of the surface MHW parameters: 1–2 events yr−1 for frequency, 20–30 d yr−1 for total days, and ∼ 2.0 °C for the mean intensity. The bottom MHW frequency, duration (approximately total days divided by frequency), and mean intensity vary strongly with bottom depth, which can be explained by the layered structure of MHW parameters and temperature along a cross-shelf section off Halifax (Fig. 3). In the upper layer from the surface to a mid-depth interface, the nearly uniform MHW mean intensity of ∼ 2 °C can mainly be attributed to variations in the surface heat flux. From the mid-depth interface to about 130 m depth, the MHW mean intensity has high values of 3–3.5 °C, which can be related to the combined effects of downward penetration of the upper layer (through wind forcing and mixing) and the lateral advection of water masses from the Cabot Strait subsurface and cold-intermediate layers, the Scotian Slope water, and the inshore Labrador Current. In the deep Emerald Basin below 130 m depth, the MHW intensity has the lowest values of 1.5–2 °C due to intrusions of offshore water. The MHW frequency has relatively uniform values of 1.5–2 events yr−1 in the water column, except low values of less than 1 event yr−1 (corresponding to longer MHW durations) below 130 m depth in the Emerald Basin and below 30 m depth over the Emerald Bank. This can be attributed to the different characteristics of temperature variations caused by different forcings: stronger variations at shorter (longer) timescales by surfacing forcing (lateral intrusion).
Thirdly, analysis of the GLORYS12V1 data reveals interannual variations, long-term trends, and regime shifts in MHW/MCS parameters during 1993–2023. For the surface MHW (MCS) total days, (1) their annual values have significantly positive (negative) correlations with the annual SST anomalies; (2) their increasing (decreasing) trends correspond to the gradual increasing SST; and (3) the peak value (215 d) of MHW total days in 2012 corresponds to the highest annual SST representing the well-known warming conditions across the Scotian Shelf, the Gulf of Maine, and the east coast of the USA. The bottom temperature shows a stronger increasing trend than the SST and a sharp increase (regime shift) around 2012. This causes the increasing (decreasing) trend and regime shift in MHW (MCS) total days. After 2012 at location 1, the annual bottom temperature became higher than the annual SST, and the bottom MHW total days frequently exceeded 200, higher than 50–70 for large values of the surface MHW total days. At location 1 near the coast of Nova Scotia, GLORYS12V1 reproduces well the rising trend and sharp increase in bottom temperature around 2012 in the mooring data. In 2012, the bottom MHW total days at location 1 experienced a sharp increase to ∼ 100 d. Consistent with the AZMP observations, GLORYS12V1 shows that, in 2012, the entire water column along the Halifax line was warmer than the climatology, which can be attributed to the smaller heat loss to the atmosphere at the sea surface, the advection of abnormally warm Scotian Slope water, and the reduced contribution of the cold water from the Gulf of St. Lawrence or the inner Labrador Shelf. Opposite conditions occurred in 1998 with the longest bottom MCS total days of ∼ 300 d at location 1, and the entire water column along the Halifax line was colder than the climatology. Further studies are needed to link variations in ocean temperature and MHW/MCS parameters in the Northwest Atlantic, at interannual and longer timescales, to large-scale ocean–atmosphere processes. For example, using long time series of synthetic data, Gregory et al. (2024) recently examined connections between the El Niño–Southern Oscillation and variations in MHWs globally and identified a linkage between La Niña events in the equatorial Pacific and warm conditions in the Northwest Atlantic. Further studies along this line are important for developing predictions of MHWs and MCSs in the future.
We note that the detection of MHWs and MCSs and the quantification of their parameters depend on the reference climatology of ocean temperature, particularly in our study region, with evident warming trends over the past several decades. Defining the climatology over 30 years (1993–2022) with the GLORYS data obtains longer total days and stronger intensity for bottom MHWs, compared with using the recent 16 years (2008–2023) of bottom temperature from mooring observations. There are ongoing debates in the literature about whether the long-term trends in ocean temperature should be included or excluded in MHW research (Oliver et al., 2021; Zhang et al., 2024). Recent studies (Amaya et al., 2023b; Capotondi et al., 2024; Smith et al., 2025) suggest that both approaches could be useful depending on the applications of interest. The long-term warming trends and short-duration extreme events likely cause different physiological and behavioural responses of marine species. In the present study, the long-term warming trend is retained in defining the water temperature climatology and the detection of MHWs and MCSs, while, in the future, we may explore other definitions when investigating the impacts of MHWs and MCSs on marine ecosystems and fisheries.
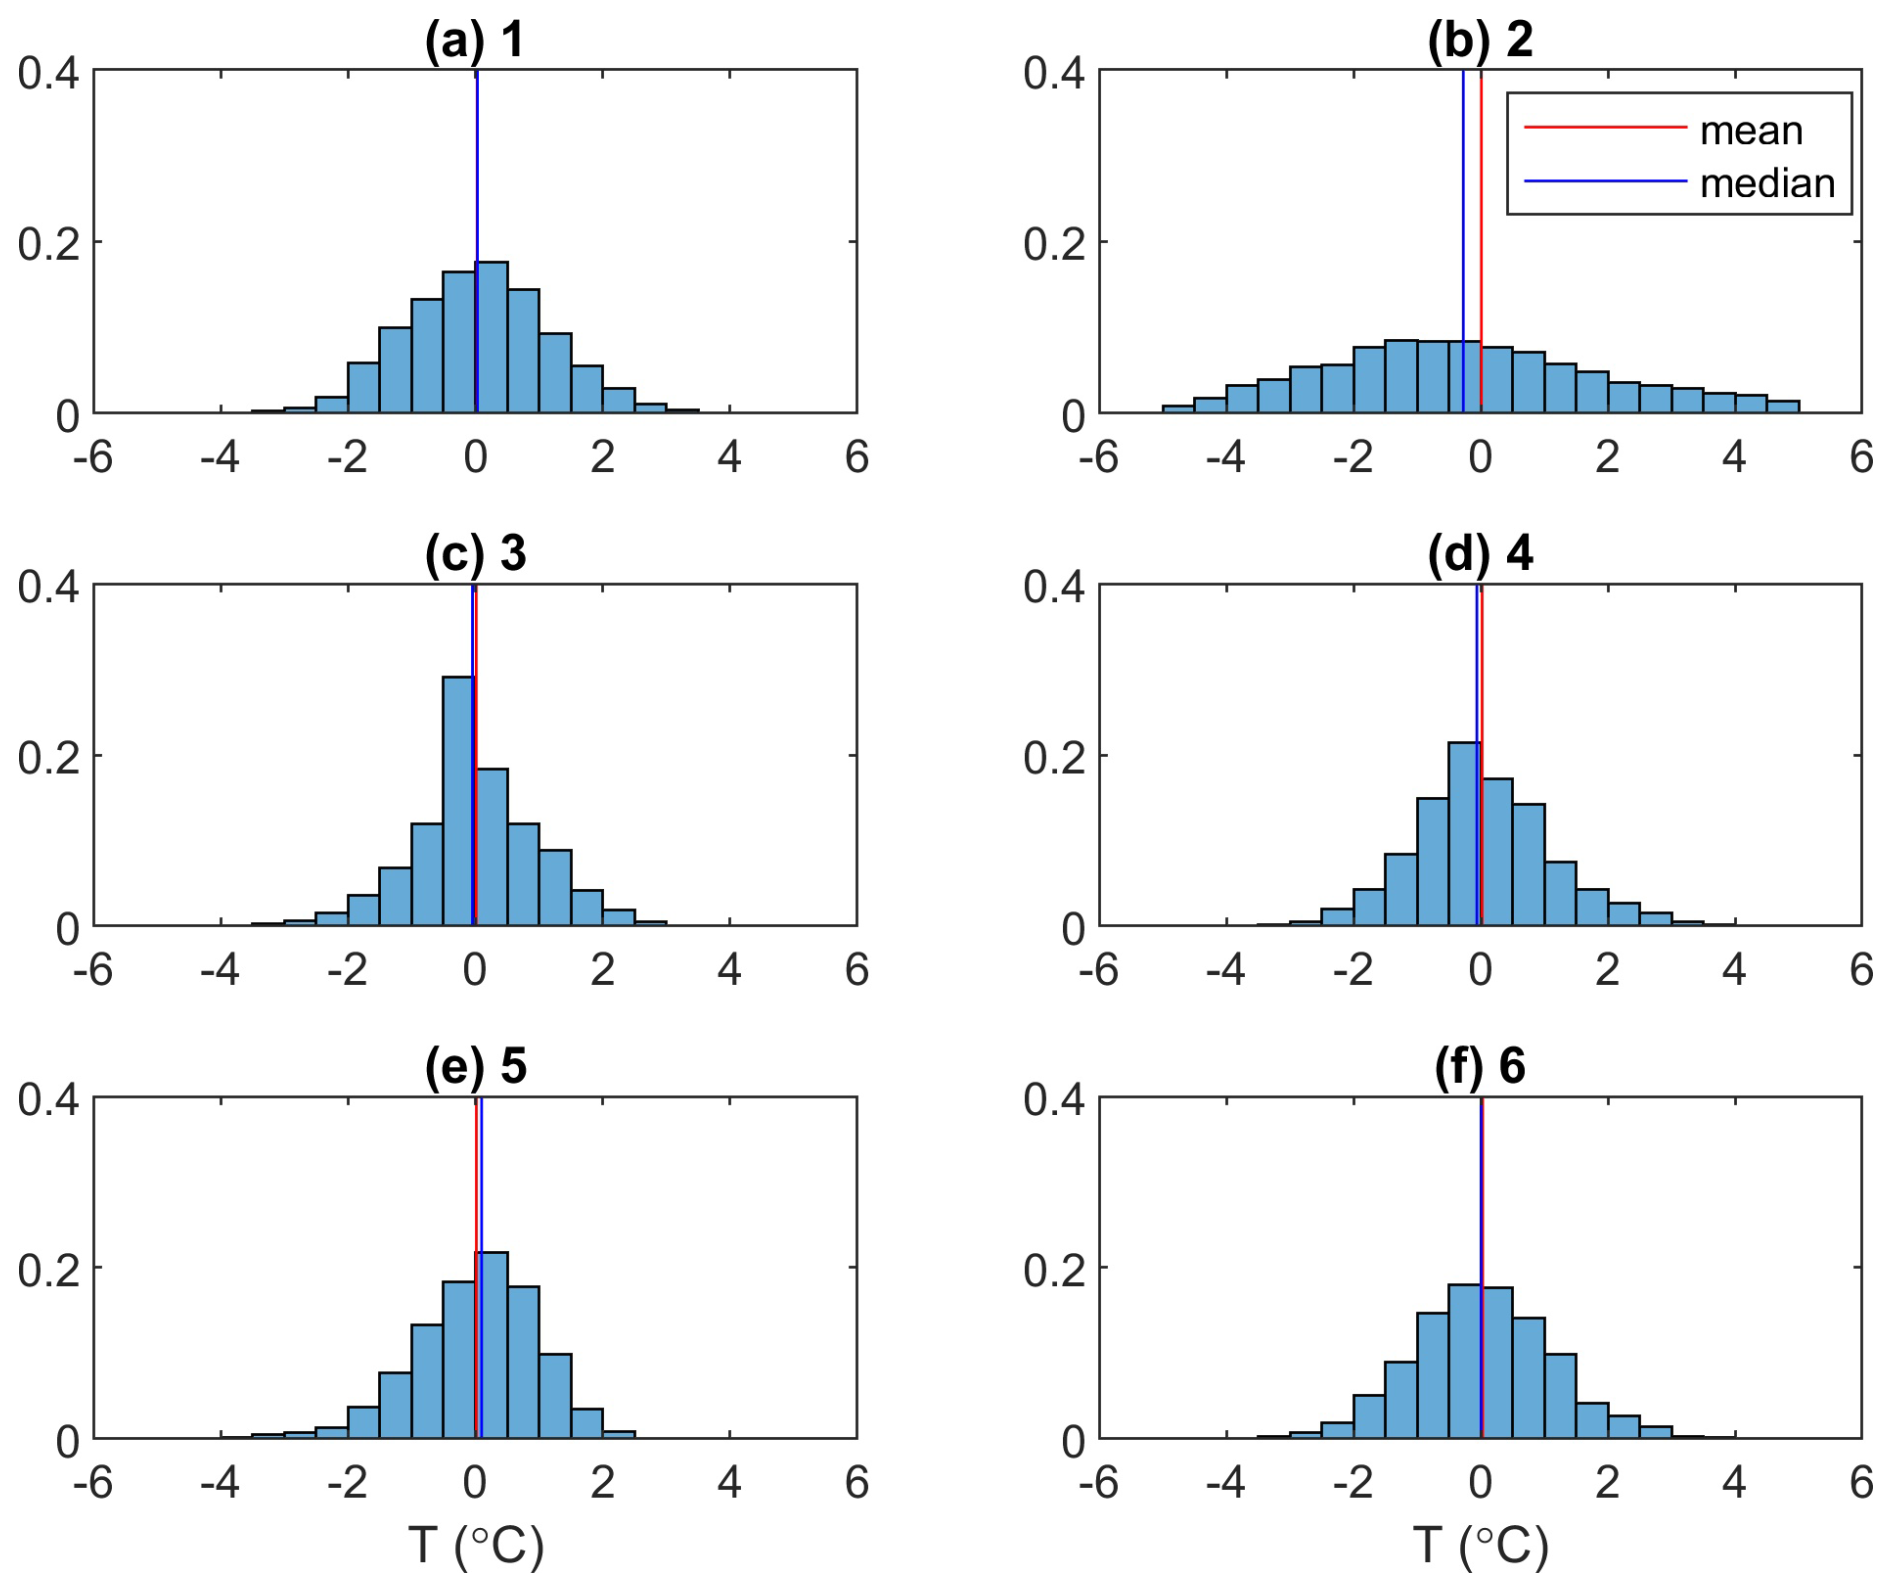
Figure A1Histogram of sea surface temperature anomalies from GLORYS12V1 at six locations marked in Fig. 1. The height of each bar is the number of data values in each bin divided by the total number of data values.
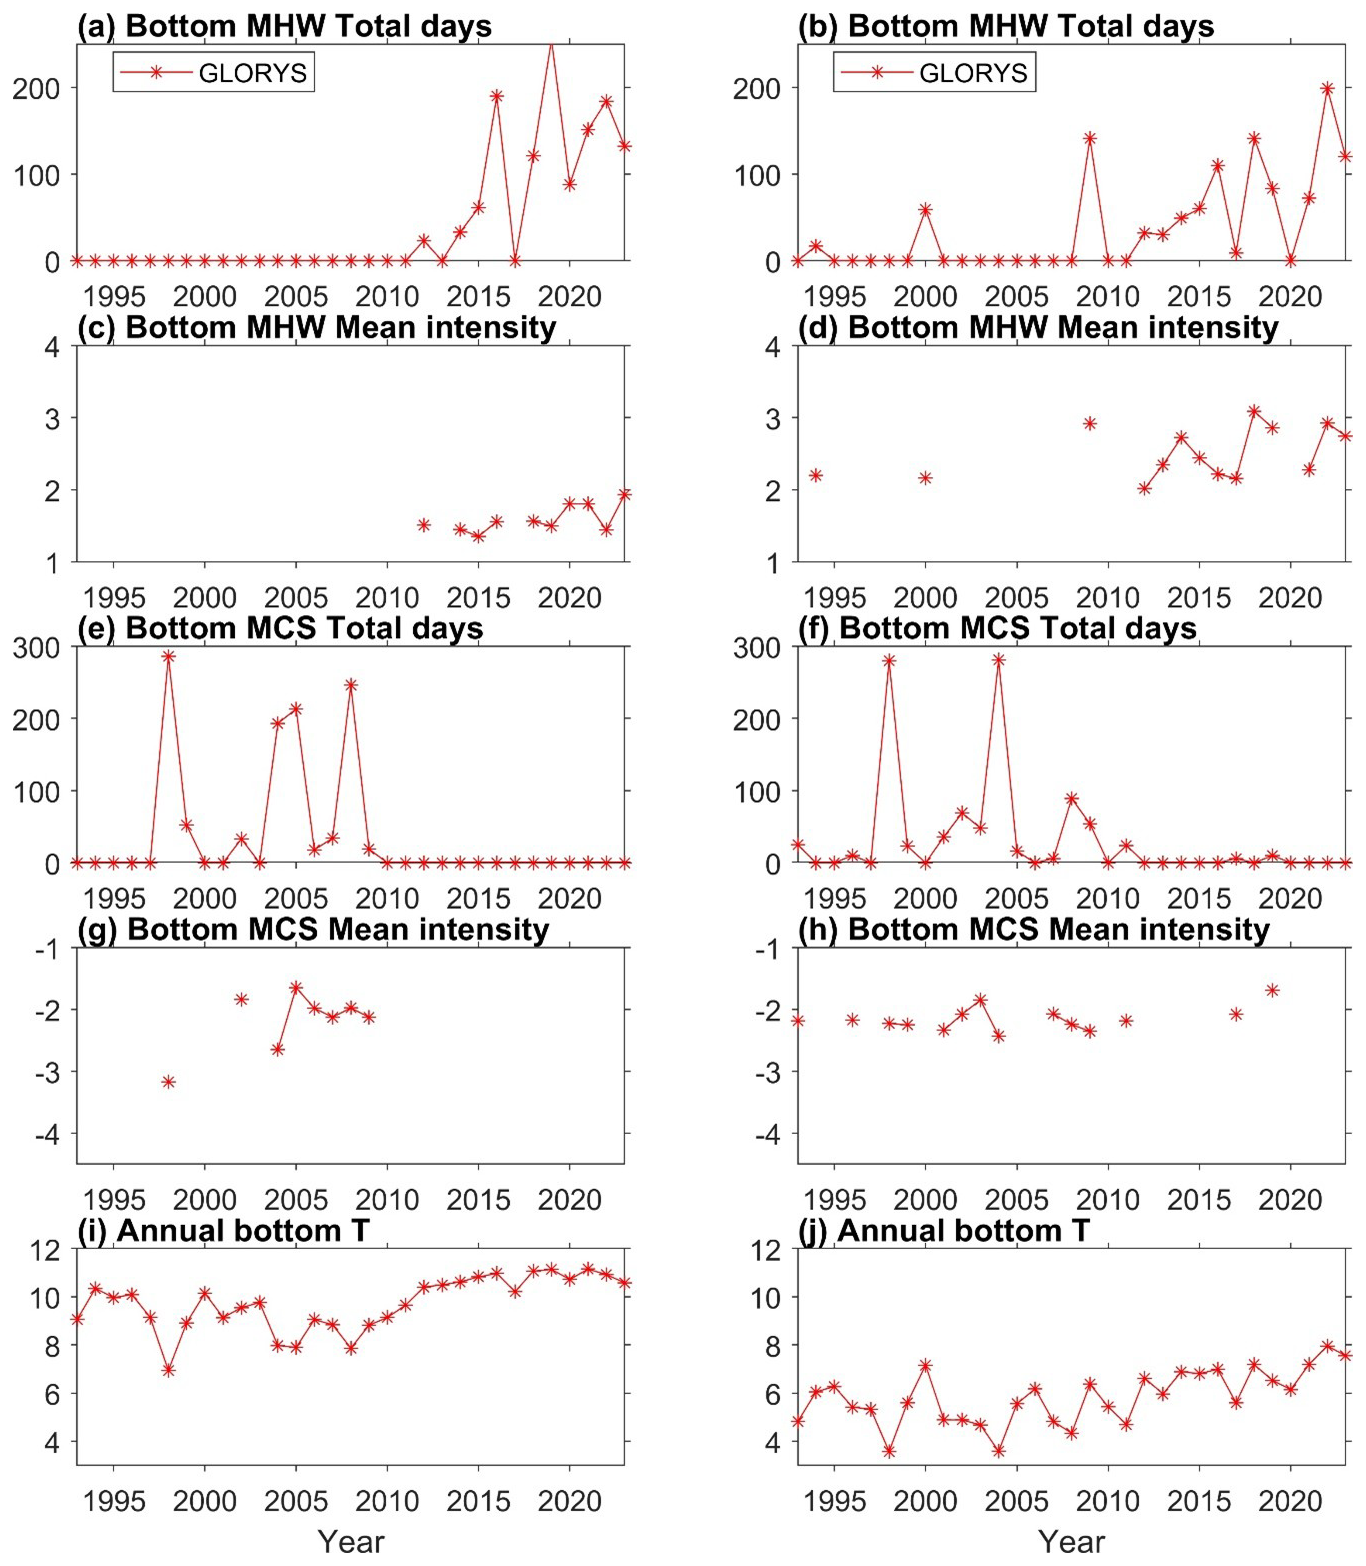
Figure A2Time series of bottom MHW/MCS parameters and bottom temperature derived from GLORYS12V1 at (left column) a location in the Emerald Basin (marked as a triangle in Fig. 3a) and (right column) location 7 on Emerald Bank (marked in Fig. 1a).
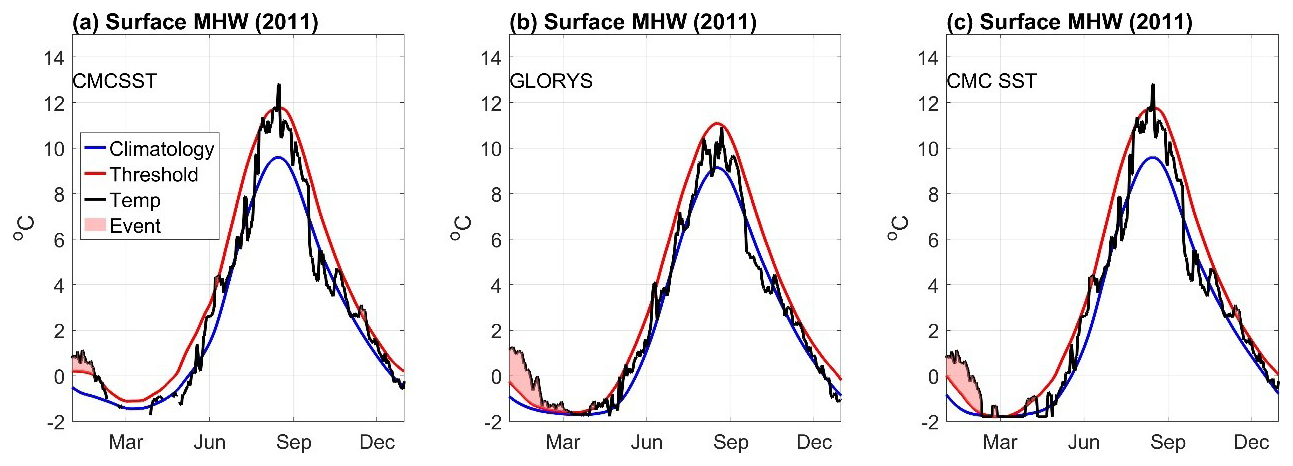
Figure A3Evolution of surface MHWs in 2011 at a location (52.8° N, 55.2° W) on the Labrador Shelf derived from (a, c) CMCSST and (b) GLORYS12V1. In panel (c), the missing values of CMCSST are filled with the freezing temperature of −1.8 °C.
The data used in this study are available as described in Table 1. The code used in this study can be accessed via a GitLab repository upon request via email to the corresponding author.
LZ and YL led the conceptualization of the study, the analysis, and the writing of the article. HW refined the scripts of data analysis. GG and SVG contributed to the conceptualization of the study and to editing and reviewing the article.
At least one of the (co-)authors is a member of the editorial board of State of the Planet. The peer-review process was guided by an independent editor, and the authors also have no other competing interests to declare.
The Copernicus Marine Service offering is regularly updated to ensure it remains at the forefront of user requirements. In this process, some products may undergo replacement or renaming, leading to the removal of certain product IDs from our catalogue. If you have any questions or require assistance regarding these modifications, please feel free to reach out to our user support team for further guidance. They will be able to provide you with the necessary information to address your concerns and find suitable alternatives, maintaining our commitment to delivering top-quality services.
Publisher's note: Copernicus Publications remains neutral with regard to jurisdictional claims made in the text, published maps, institutional affiliations, or any other geographical representation in this paper. While Copernicus Publications makes every effort to include appropriate place names, the final responsibility lies with the authors.
We appreciate DFO and Mercator Ocean International for supporting the scientific exchanges and collaboration between the staff of both organizations in recent years under a collaborative agreement; David Brickman for commenting on an early version of the article; Karina Von Schuckmann for insightful comments and advice in developing this article; Xianmin Hu, Justine Mcmillan, and Nancy Soontiens for internal reviews; and Peter Galbraith and two anonymous reviewers for detailed, insightful, and constructive comments that helped to improve the original article.
This paper was edited by Joanna Staneva and reviewed by Peter Galbraith and two anonymous referees.
Amaya, D. J., Jacox, M. G., Alexander, M. A., Scott, J. D., Deser, C., Capotondi, A., and Phillips, A. S.: Bottom marine heatwaves along the continental shelves of North America, Nat. Commun., 14, 1038, https://doi.org/10.1038/s41467-023-36567-0, 2023a.
Amaya, D. J., Jacox, M. G., Fewings, M. R., Saba, V. S., Stuecker, M. F., Rykaczewski, R. R., Ross, A. C., Stock, C. A., Capotondi, A., Petrik, C. M., Bograd, S. J., Alexander, M. A., Cheng, W., Hermann, A. J., Kearney, K. A., and Powell, B. S.: Marine heatwaves need clear definitions so coastal communities can adapt, Nature, 616, 29–32, https://doi.org/10.1038/d41586-023-00924-2, 2023b.
Beaudin, É. and Bracco, A.: How Marine Heatwaves Impact Life in the Ocean, Front. Young Minds, 10, 712528, https://doi.org/10.3389/frym.2022.712528, 2022.
Brasnett, B.: The impact of satellite retrievals in a global sea–surface–temperature analysis, Q. J. Roy. Meteor. Soc., 134, 1745–1760, https://doi.org/10.1002/qj.319, 2008.
Brickman, D., Hebert, D., and Wang, Z.: Mechanism for the recent ocean warming events on the Scotian Shelf of eastern Canada, Cont. Shelf Res., 156, 11–22, https://doi.org/10.1016/j.csr.2018.01.001, 2018.
Canada Meteorological Center: CMC 0.2 deg global sea surface temperature analysis, Ver. 2.0, PO.DAAC, CA, USA [data set], https://doi.org/10.5067/GHCMC-4FM02, 2012.
Canada Meteorological Center: GHRSST Level 4 CMC 0.1 deg global sea surface temperature analysis, Ver. 3.0, PO.DAAC, CA, USA [data set], https://doi.org/10.5067/GHCMC-4FM03, 2016.
Capotondi, A., Rodrigues, R. R., Sen Gupta, A., Benthuysen, J. A., Deser, C., Frölicher, T. L., Lovenduski, N. S., Amaya, D. J., Le Grix, N., Xu, T., Hermes, J., Holbrook, N. J., Martinez-Villalobos, C., Masina, S., Roxy, M. K., Schaeffer, A., Schlegel, R. W., Smith, K. E., and Wang, C.: A global overview of marine heatwaves in a changing climate, Commun. Earth Environ., 5, 1–17, https://doi.org/10.1038/s43247-024-01806-9, 2024.
Casey, M. P., Petrie, B., Lu, Y., MacDermid, S., and Paquin, J. P.: Rapid drops of ocean temperatures in several shallow bays in Nova Scotia during a recent cold air outbreak, Proceedings of the Nova Scotian Institute of Science, 53, 219–248, 2024.
Chen, K., Gawarkiewicz, G., Kwon, Y., and Zhang, W. G.: The role of atmospheric forcing versus ocean advection during the extreme warming of the Northeast U.S. continental shelf in 2012, J. Geophys Res.-Oceans, 120, 4324–4339, https://doi.org/10.1002/2014JC010547, 2015.
Collins, M., Sutherland, M., Bouwer, L., Cheong, S.-M., Frölicher, T., Jacot Des Combes, H., Koll Roxy, M., Losada, I. McInnes, K., Ratter, B., Rivera-Arriaga, E., Susanto, R. D., Swingedouw, D., and Tibig, L.: Extremes, Abrupt Changes and Managing Risk, in: IPCC Special Report on the Ocean and Cryosphere in a Changing Climate, edited by: Pörtner, H.-O., Roberts, D. C., Masson-Delmotte, V., Zhai, P., Tignor, M., Poloczanska, E., Mintenbeck, K., Alegría, A., Nicolai, M., Okem, A., Petzold, J., Rama, B., and Weyer, N. M., Cambridge University Press, Cambridge, UK and New York, NY, USA, 589–655, https://doi.org/10.1017/9781009157964.003, 2019.
Dever, M., Hebert, D., Greenan, B. J. W., Sheng, J., and Smith, P. C.: Hydrography and Coastal Circulation along the Halifax Line and the Connections with the Gulf of St. Lawrence, Atmos.-Ocean, 54, 199–217, https://doi.org/10.1080/07055900.2016.1189397, 2016.
Drévillon, M., Fernandez, E., and Lellouche, J. M.: EU Copernicus Marine Service Product User Manual for the Global Ocean Physics Reanalysis, GLOBAL_MULTIYEAR_PHY_001_030, Issue 1.5, Mercator Ocean International, https://catalogue.marine.copernicus.eu/documents/PUM/CMEMS-GLO-PUM-001-030.pdf (last access: 19 March 2024), 2023a.
Drévillon, M., Lellouche, J. M., Régnier, C., Garric, G., Bricaud, C., Hernandez, O., and Bourdallé-Badie, R.: EU Copernicus Marine Service Quality Information Document for the Global Ocean Physics Reanalysis, GLOBAL_MULTIYEAR_PHY_001_030, Issue 1.6, Mercator Ocean International, https://catalogue.marine.copernicus.eu/documents/QUID/CMEMS-GLO-QUID-001-030.pdf (last access: 19 March 2024), 2023b.
Drinkwater, K. F., Petrie, B., and Smith, P. C.: Climate variability on the Scotian Shelf during the 1990s, ICES MSS Vol. 219 – Hydrobiological variability in the ICES Area, 1990–1999, https://doi.org/10.17895/ices.pub.19271735.v1, 2003.
EU Copernicus Marine Service Product: Global Ocean Physics Reanalysis, Mercator Ocean International [data set], https://doi.org/10.48670/moi-00021, 2023.
Fiedler, E. K., McLaren, A., Banzon, V., Brasnett, B., Ishizaki, S., Kennedy, J., Rayner, N., Roberts-Jones, J., Corlett, G., Merchant, C. J., and Donlon, C.: Intercomparison of long-term sea surface temperature analyses using the GHRSST Multi-Product Ensemble (GMPE) system, Remote Sens. Environ., 222, 18–33, https://doi.org/10.1016/j.rse.2018.12.015, 2019.
Fox-Kemper, B., Hewitt, H. T., Xiao, C., Aðalgeirsdóttir, G., Drijfhout, S. S., Edwards, T. L., Golledge, N. R., Hemer, M., Kopp, R. E., Krinner, G., Mix, A., Notz, D., Nowicki, S., Nurhati, I. S., Ruiz, L., Sallée, J.-B., Slangen, A. B. A., and Yu, Y.: Ocean, Cryosphere and Sea Level Change, Climate Change 2021: The Physical Science Basis. Contribution of Working Group I to the Sixth Assessment Report of the Intergovernmental Panel on Climate Change, edited by: Masson-Delmotte, V., Zhai, P., Pirani, A., Connors, S. L., Péan, C., Berger, S., Caud, N., Chen, Y., Goldfarb, L., Gomis, M. I., Huang, M., Leitzell, K., Lonnoy, E., Matthews, J. B. R., Maycock, T. K., Waterfield, T., Yelekçi, O., Yu, R., and Zhou, B., Cambridge University Press, 1211–1362, https://doi.org/10.1017/9781009157896.011, 2021.
Free, C. M., Anderson, S. C., Hellmers, E. A., Muhling, B. A., Navarro, M. O., Richerson, K., Rogers, L. A., Satterthwaite, W. H., Thompson, A. R., Burt, J. M., Gaines, S. D., Marshall, K. N., White, J. W., and Bellquist, L. F.: Impact of the 2014–2016 marine heatwave on US and Canada West Coast fisheries: Surprises and lessons from key case studies, Fish Fish., 24, 652–674, https://doi.org/10.1111/faf.12753, 2023.
Frölicher, T. L., Fischer, E. M., and Gruber, N.: Marine heatwaves under global warming, Nature, 560, 360–364, https://doi.org/10.1038/s41586-018-0383-9, 2018.
Galbraith, P. S., Chassé, J., Shaw, J.-L., Dumas, J., and Bourassa, M.-N.: Physical Oceanographic Conditions in the Gulf of St. Lawrence during 2023, Can. Tech. Rep. Hydrogr. Ocean Sci., 378, v + 91 pp., https://waves-vagues.dfo-mpo.gc.ca/library-bibliotheque/41242816.pdf (last access: 28 August 2025), 2024.
Gonçalves Neto, A., Palter, J.B., Xu, X., and Fratantoni, P.: Temporal Variability of the Labrador Current Pathways Around the Tail of the Grand Banks at Intermediate Depths in a High-Resolution Ocean Circulation Model, J. Geophys. Res.-Oceans 128, e2022JC018756, https://doi.org/10.1029/2022JC018756, 2023.
Gregory, C. H., Artana, C., Lama, S., León-FonFay, D., Sala, J., Xiao, F., Xu, T., Capotondi, A., Martinez-Villalobos, C., and Holbrook, N. J.: Global Marine Heatwaves Under Different Flavors of ENSO, Geophys. Res. Lett., 51, e2024GL110399, https://doi.org/10.1029/2024GL110399, 2024.
Hebert, D., Pettipas, R., Brickman, D., and Dever, M.: Meteorological, Sea Ice and Physical Oceanographic Conditions on the Scotian Shelf and in the Gulf of Maine during 2012, DFO Can. Sci. Advis. Sec. Res. Doc. 2013/058, v + 46 pp., https://publications.gc.ca/collections/collection_2013/mpo-dfo/Fs70-5-2013-058-eng.pdf (last access: 28 August 2025), 2013.
Hebert, D., Layton, C., Brickman, D., and Galbraith, P. S.: Physical Oceanographic Conditions on the Scotian Shelf and in the Gulf of Maine during 2022, Can. Tech. Rep. Hydrogr. Ocean Sci. 359, vi + 81 pp., https://waves-vagues.dfo-mpo.gc.ca/library-bibliotheque/41191742.pdf (last access: 28 August 2025), 2023.
Hobday, A. J., Alexander, L. V., Perkins, S. E., Smale, D. A., Straub, S. C., Oliver, E. C. J., Benthuysen, J. A., Burrows, M. T., Donat, M. G., Feng, M., Holbrook, N. J., Moore, P. J., Scannell, H. A., Sen Gupta, A., and Wernberg, T.: A hierarchical approach to defining marine heatwaves, Prog. Oceanogr., 141, 227–238, https://doi.org/10.1016/j.pocean.2015.12.014, 2016.
Holbrook, N. J., Scannell, H. A., Sen Gupta, A., Benthuysen, J. A., Feng, M., Oliver, E. C. J., Alexander, L. V., Burrows, M. T., Donat, M. G., Hobday, A. J., Moore, P. J., Perkins-Kirkpatrick, S. E., Smale, D. A., Straub, S. C., and Wernberg, T.: A global assessment of marine heatwaves and their drivers, Nat. Commun., 10, 2624, https://doi.org/10.1038/s41467-019-10206-z, 2019.
Korus, J., Filgueira, R., and Grant, J.: Influence of temperature on the behaviour and physiology of Atlantic salmon (Salmo Salar) on a commercial farm, Aquaculture, 589, 740978, https://doi.org/10.1016/j.aquaculture.2024.740978, 2024.
Lellouche, J.-M., Greiner, E., Bourdallé-Badie, R., Garric, G., Melet, A., Drévillon, M., Bricaud, C., Hamon, M., Le Galloudec, O., Regnier, C., Candela, T., Testut, C.-E., Gasparin, F., Ruggiero, G., Benkiran, M., Drillet, Y., and Le Traon, P.-Y.: The Copernicus Global ° Oceanic and Sea Ice GLORYS12 Reanalysis, Front. Earth Sci., 9, 698876, https://doi.org/10.3389/feart.2021.698876, 2021.
Loder, J. W., Petrie, B., and Gawarkiewicz, G.: The coastal ocean off northeastern North America: a large-scale view, Chap. 5, in: The Global Coastal Ocean: Regional Studies and Synthesis, The Sea, edited by: Robinson, A. R. and Brink, K. H., John Wiley & Sons, Inc., vol. 11, 105–133, ISBN 10: 0674017412, 1998.
Lu, Y., Wright, D. G., and Clarke, R. A.: Modelling deep seasonal temperature changes in the Labrador Sea, Geophys. Res. Lett., 33, L23601, https://doi.org/10.1029/2006GL027692, 2006.
Ma, Y., Lu, Y., Hu, X., Gilbert, D., Socolofsky, S. A., and Boufadel, M.: Model simulated freshwater transport along the Labrador current east of the Grand Banks of Newfoundland, Front. Mar. Sci., 9, 908306, https://doi.org/10.3389/fmars.2022.908306, 2022.
Meissner, T., Wentz, F. J., Scott, J., and Vazquez-Cuervo, J.: Sensitivity of Ocean Surface Salinity Measurements From Spaceborne L-Band Radiometers to Ancillary Sea Surface Temperature, IEEE T. Geosci. Remote, 54, 7105–7111, https://doi.org/10.1109/TGRS.2016.2596100, 2016.
Meyer-Gutbrod, E. L., Greene, C. H., Davies, K. T. A., and Johns, D. G.: Ocean Regime Shift is Driving Collapse of the North Atlantic Right Whale Population, Oceanography, 34, 22–31, https://doi.org/10.5670/oceanog.2021.308, 2021.
Mills, K., Pershing, A., Brown, C., Chen, Y., Chiang, F.-S., Holland, D., Lehuta, S., Nye, J., Sun, J., Thomas, A., and Wahle, R.: Fisheries Management in a Changing Climate: Lessons From the 2012 Ocean Heat Wave in the Northwest Atlantic, Oceanog., 26, 191–195, https://doi.org/10.5670/oceanog.2013.27, 2013.
Mohamed, B., Barth, A., and Alvera-Azcárate, A.: Extreme marine heatwaves and cold-spells events in the Southern North Sea: classifications, patterns, and trends, Front. Mar. Sci., 10, 1258117, https://doi.org/10.3389/fmars.2023.1258117, 2023.
Oliver, E. C. J., Donat, M. G., Burrows, M. T., Moore, P. J., Smale, D. A., Alexander, L. V., Benthuysen, J. A., Feng, M., Sen Gupta, A., Hobday, A. J., Holbrook, N. J., Perkins-Kirkpatrick, S. E., Scannell, H. A., Straub, S. C., and Wernberg, T.: Longer and more frequent marine heatwaves over the past century, Nat. Commun., 9, 1324, https://doi.org/10.1038/s41467-018-03732-9, 2018.
Oliver, E. C. J., Benthuysen, J. A., Darmaraki, S., Donat, M. G., Hobday, A. J., Holbrook, N. J., Schlegel, R. W., and Sen Gupta, A.: Marine Heatwaves, Annu. Rev. Mar. Sci., 13, 313–342, https://doi.org/10.1146/annurev-marine-032720-095144, 2021.
Peal, R., Worsfold, M., and Good, S.: Comparing global trends in marine cold spells and marine heatwaves using reprocessed satellite data, in: 7th edition of the Copernicus Ocean State Report (OSR7), edited by: von Schuckmann, K., Moreira, L., Le Traon, P.-Y., Grégoire, M., Marcos, M., Staneva, J., Brasseur, P., Garric, G., Lionello, P., Karstensen, J., and Neukermans, G., Copernicus Publications, State Planet, 1-osr7, 3, https://doi.org/10.5194/sp-1-osr7-3-2023, 2023.
Santora, J. A., Mantua, N. J., Schroeder, I. D., Field, J. C., Hazen, E. L., Bograd, S. J., Sydeman, W. J., Wells, B. K., Calambokidis, J., Saez, L., Lawson, D., and Forney, K. A.: Habitat compression and ecosystem shifts as potential links between marine heatwave and record whale entanglements, Nat. Commun., 11, 536, https://doi.org/10.1038/s41467-019-14215-w, 2020.
Schlegel, R. W., Oliver, E. C. J., Wernberg, T., and Smit, A. J.: Nearshore and offshore co-occurrence of marine heatwaves and cold-spells, Prog. Oceanogr., 151, 189–205, https://doi.org/10.1016/j.pocean.2017.01.004, 2017.
Schlegel, R. W., Oliver, E. C. J., and Chen, K.: Drivers of Marine Heatwaves in the Northwest Atlantic: The Role of Air–Sea Interaction During Onset and Decline, Front. Mar. Sci., 8, 627970, https://doi.org/10.3389/fmars.2021.627970, 2021a.
Schlegel, R. W., Darmaraki, S., Benthuysen, J. A., Filbee-Dexter, K., and Oliver, E. C. J.: Marine cold-spells, Prog. Oceanogr., 198, 102684, https://doi.org/10.1016/j.pocean.2021.102684, 2021b.
Sen Gupta, A., Thomsen, M., Benthuysen, J. A., Hobday, A. J., Oliver, E., Alexander, L. V., Burrows, M. T., Donat, M. G., Feng, M., Holbrook, N. J., Perkins-Kirkpatrick, S., Moore, P. J., Rodrigues, R. R., Scannell, H. A., Taschetto, A. S., Ummenhofer, C. C., Wernberg, T., and Smale, D. A.: Drivers and impacts of the most extreme marine heatwave events, Sci. Rep., 10, 19359, https://doi.org/10.1038/s41598-020-75445-3, 2020.
Shan, S. and Sheng, J.: Numerical Study of Topographic Effects on Wind-Driven Coastal Upwelling on the Scotian Shelf, J. Mar. Sci. Eng., 10, 497, https://doi.org/10.3390/jmse10040497, 2022.
Smith, K. E., Sen Gupta, A., Amaya, D., Benthuysen, J. A., Burrows, M. T., Capotondi, A., Filbee-Dexter, K., Frölicher, T. L., Hobday, A. J., Holbrook, N. J., Malan, N., Moore, P. J., Oliver, E. C. J., Richaud, B., Salcedo-Castro, J., Smale, D. A., Thomsen, M., and Wernberg, T.: Baseline matters: Challenges and implications of different marine heatwave baselines, Prog. Oceanogr., 231, 103404, https://doi.org/10.1016/j.pocean.2024.103404, 2025.
Soontiens, N., Andres, H. J., Coyne, J., Cyr, F., Galbraith, P. S., and Penney, J.: An analysis of the 2023 summer and fall marine heat waves on the Newfoundland and Labrador Shelf, in: 9th edition of the Copernicus Ocean State Report (OSR9), edited by: Grégoire, M., Marcos, M., Staneva, J., Brasseur, P., Garric, G., Lionello, P., Karstensen, J., and Poulain, P.-M., Copernicus Publications, State Planet, 6-osr9, 12, https://doi.org/10.5194/sp-6-osr9-12-2025, 2025.
Thompson, K. R. and Demirov, E.: Skewness of sea level variability of the world's oceans, J. Geophys. Res.-Oceans, 111, C05005, https://doi.org/10.1029/2004JC002839, 2006.
Umoh, J. U. and Thompson, K. R.: Surface heat flux, horizontal advection, and the seasonal evolution of water temperature on the Scotian Shelf, J. Geophys. Res.-Oceans, 99, 20403–20416, https://doi.org/10.1029/94JC01620, 1994.
Wang, H., Lu, Y., Zhai, L., Chen, X., and Liu, S.: Variations of surface marine heatwaves in the Northwest Pacific during 1993–2019, Front. Mar. Sci., 11, 1323702, https://doi.org/10.3389/fmars.2024.1323702, 2024.
Wang, Y., Kajtar, J. B., Alexander, L. V., Pilo, G. S., and Holbrook, N. J.: Understanding the Changing Nature of Marine Cold-Spells, Geophys. Res. Lett., 49, e2021GL097002, https://doi.org/10.1029/2021GL097002, 2022.
Zhang, M., Cheng, Y., Wang, G., Shu, Q., Zhao, C., Zhang, Y., and Qiao, F.: Long-term ocean temperature trend and marine heatwaves, J. Ocean. Limnol., 42, 1037–1047, https://doi.org/10.1007/s00343-023-3160-z, 2024.
Zhao, Z. and Marin, M.: A MATLAB toolbox to detect and analyze marine heatwaves, Journal of Open Source Software, 4, 1124, https://doi.org/10.21105/joss.01124, 2019.
Zisserson, B. and Cook, A.: Impact of bottom water temperature change on the southernmost snow crab fishery in the Atlantic Ocean, Fish. Res., 195, 12–18, https://doi.org/10.1016/j.fishres.2017.06.009, 2017.