the Creative Commons Attribution 4.0 License.
the Creative Commons Attribution 4.0 License.
 | 30 Sep 2025 | OSR9 | Chapter 4.2
An analysis of the 2023 summer and fall marine heat waves on the Newfoundland and Labrador Shelf
Nancy Soontiens
Heather J. Andres
Jonathan Coyne
Frédéric Cyr
Peter S. Galbraith
Jared Penney
In this study, we investigated a series of moderate to severe surface marine heat waves (MHWs) impacting the Newfoundland and Labrador (NL) Shelf during the summer and fall of 2023. Using a combination of ocean model reanalysis data, in situ data collected under the Atlantic Zone Monitoring Program (AZMP), and atmospheric reanalysis data, we explored several factors that contributed to the intensity of these MHWs. We concluded that, firstly, due to an unusually cold spring and abnormally fresh conditions advected from upstream, the water column was highly stratified. Secondly, atmospheric conditions were calm and anomalously warm, and wind speeds were unusually low for prolonged periods in the summer. The combination of increased stratification and lower wind speeds caused a reduction in vertical mixing, limiting the exchange of warm surface waters with colder waters below and amplifying the retention of heat near the surface. However, by the late fall, the signature of the surface heat wave had vanished when the cooler subsurface waters were mixed vertically due to increased winds, storms, and surface cooling. During the most intense MHW in July 2023, we found that this event was confined to the surface as demonstrated by temperature anomalies along several standard transects which showed a thin layer of warm anomalies in the upper 10 m and cold anomalies below. Consequently, the vertical extent and distribution of MHWs are important considerations when exploring ecosystem impacts because not all elements of the ecosystem are equally sensitive to surface conditions. Finally, these results suggest that ocean model nowcast and reanalysis products can complement observational methods for studying MHWs in near real-time over large geographic areas and at multiple depths.
- Article
(3430 KB) - Full-text XML
-
Supplement
(2912 KB) - BibTeX
- EndNote


© His Majesty the King in Right of Canada, as represented by the Minister of Fisheries and Oceans Canada, 2025.
In the summer of 2023, the North Atlantic Ocean experienced a series of significant marine heat waves (MHWs), sparking media attention and public interest in the associated record-setting high ocean temperatures. These MHWs were first detected in the Northeast Atlantic in June and, later, in the Northwest Atlantic in July (Copernicus, 2023). Ocean warming and MHWs can have significant impacts on the marine ecosystem (e.g. Le Grix et al., 2021; Geoffroy et al., 2023, Smith et al., 2023), air–sea exchange (e.g. Edwing et al., 2024), and weather (e.g. Frölicher and Laufkötter, 2018). Globally, MHWs are occurring more frequently and with greater duration (Oliver et al, 2018; IPCC, 2019, 2023). As such, it is critical to develop a more complete understanding of their drivers (Oliver et al., 2021) which will lead to improved real-time monitoring efforts and forecasting capabilities (e.g. McAdam et al., 2023).
Table 1Overview of the data products used in this study.
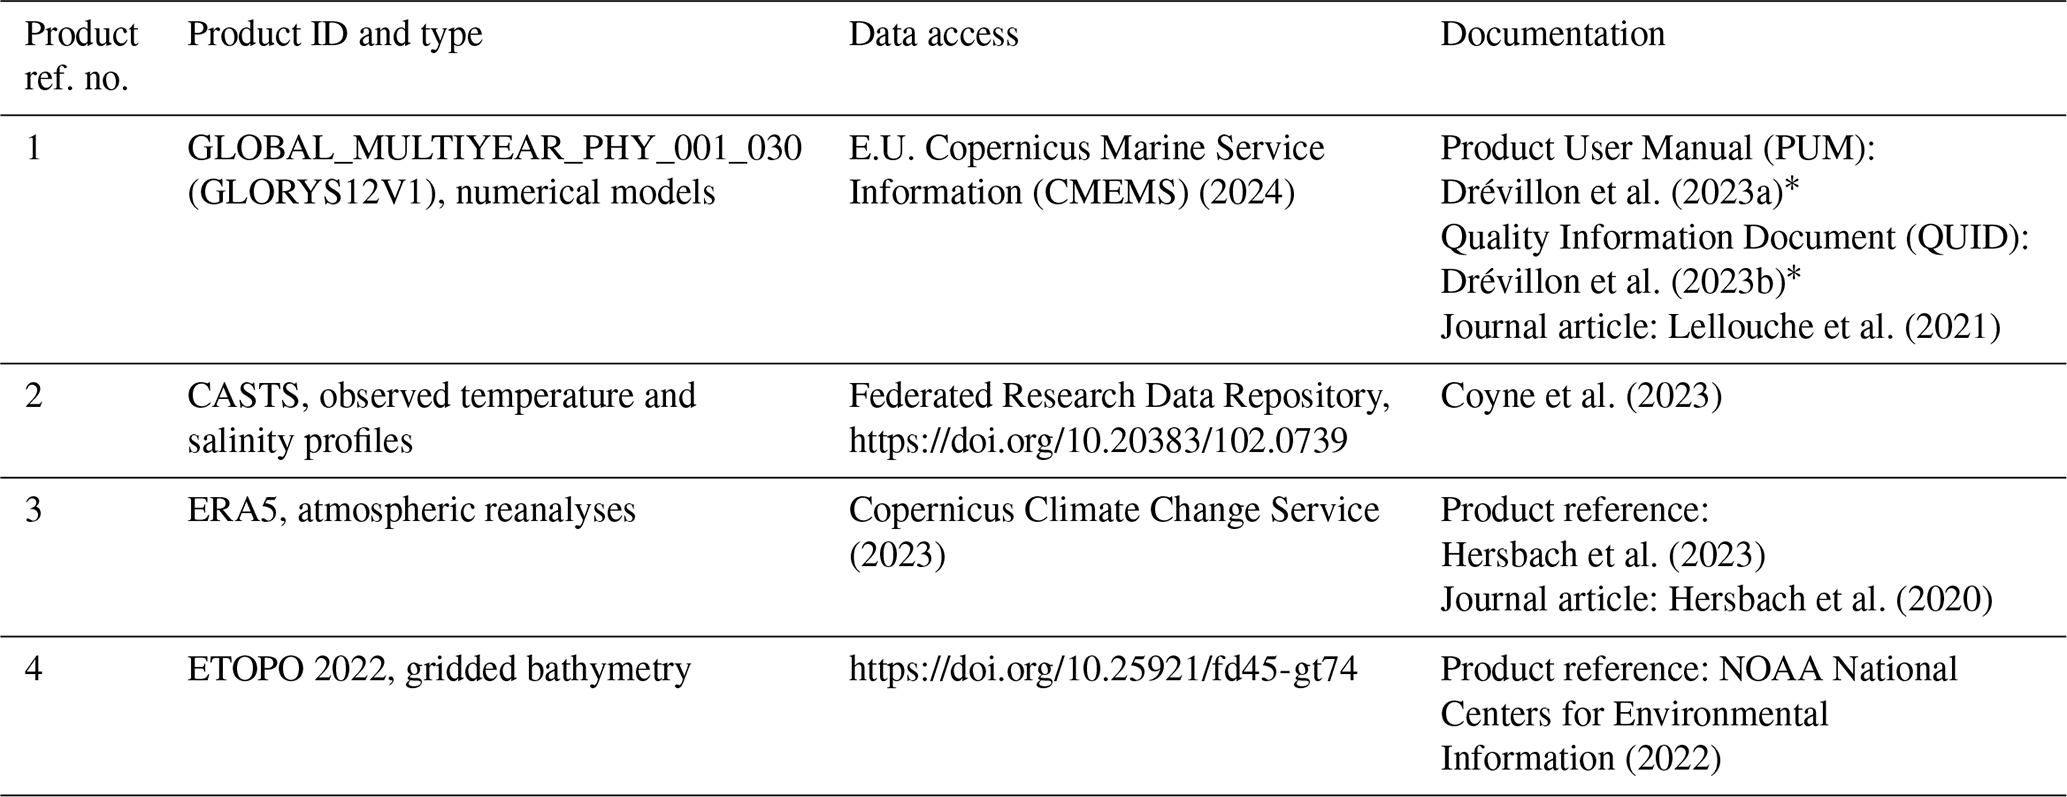
∗ PUM and QUID were updated during publication (please see Disclaimer section).
Studies of MHWs in the Northwest Atlantic have documented the role of air–sea fluxes and oceanic processes such as advection in the onset and decay of MHWs. Schlegel et al. (2021) applied statistical methods to a combination of remotely sensed sea surface temperature (SST) data and atmospheric and oceanic reanalyses to link latent heat flux and mixed-layer depth as drivers of MHWs over the Northwest Atlantic continental shelf. They show that the onset of many surface MHWs in this area is linked with a positive air–sea heat flux anomaly into the ocean, most often driven by latent heat flux and shortwave radiation, but that the decay is more often associated with oceanic processes such as advection and mixing. Other studies have correlated MHWs with large-scale atmospheric conditions and spatial variability in heat flux anomalies. For example, Perez et al. (2021) link the 2015/16 MHW in the Northwest Atlantic to the position of the jet stream modifying the spatial distribution of heat fluxes, a finding confirmed by Sims et al. (2022), who further correlate sea surface temperature (SST) and sea surface salinity anomalies near the shelf break in a subregion (40–48° N, 48–70° W,) with the North Atlantic Oscillation (NAO). These studies indicate that a combination of oceanic and atmospheric processes drove the 2015/16 MHW. Other studies link abrupt sea ice melt and strong stratification with intensified surface MHWs in the Arctic (see e.g. Barkhordarian et al., 2024; Richaud et al., 2024), and recent work by Sun et al. (2024) identifies a strong relationship between mixed-layer depth shoaling, restratification, and MHW occurrence globally.
In this study, we describe a series of MHWs that occurred on the Newfoundland and Labrador (NL) Shelf during the summer and fall of 2023. The NL Shelf is a region of economic, environmental, and cultural importance, as it supports numerous commercial, recreational, and Indigenous fisheries (Templeman, 2010). The oceanographic conditions are characteristic of Arctic and subarctic environments and are influenced by the Labrador Current, which transports relatively cold and fresh water equatorward along the continental shelf (e.g. Lazier and Wright, 1993; Fratantoni and Pickart, 2007). The region undergoes interannual variability cycling through warm and cold phases associated with changes in air temperature, sea ice conditions, and climate indices such as the NAO (Petrie, 2007; Urrego-Blanco and Sheng, 2012; Han et al., 2019; Cyr and Galbraith, 2021). These warm and cold phases are linked to marine ecosystem characteristics such as the timing of the spring phytoplankton bloom and primary and secondary productivity (Cyr et al., 2024a) and the productivity of higher trophic levels (Cyr et al., 2025). Variability in the offshore transport of the Labrador Current (e.g. Jutras et al., 2023) is also linked with ecosystem characteristics such as marine bivalve growth, as suggested by Poitevin et al. (2019). Seasonal ice cover in the region has important implications for stratification and, in turn, primary productivity (e.g. Wu et al., 2007).
We conduct our analysis over several geographic subregions of the NL Shelf with distinct ecosystem characteristics, as described in Sect. 2.2, and explore the influence of several meteorological and oceanographic phenomena such as winds, air–sea heat fluxes, stratification, and advection on this series of MHWs. Studying the factors driving MHWs on the NL Shelf will support understanding on how these events may impact the local marine ecosystem.
2.1 Datasets
A number of datasets were used in this study. MHWs were characterized using the sea surface temperature (SST) from product ref. no. 1 (Table 1), which is a ° global ocean reanalysis (herein GLORYS12V1) covering 31 December 1992 to 25 December 2023. Daily mean temperature and salinity fields were also used to describe oceanographic conditions such as stratification, depth-averaged temperature, and freshwater density. Sea ice concentration was also analyzed to characterize the monthly maximum sea ice extent, defined as regions where the concentration is greater than 0.15. Sea ice volume, defined as the product between the GLORYS12V1 sea ice concentration, sea ice thickness, and grid cell area, summed over the NL Shelf was also calculated and analyzed. Following recommendations by McDougall et al. (2021), we interpreted the GLORYS12V1 prognostic temperature and salinity variables to be conservative temperature and preformed salinity – a salinity variable not affected by biogeochemistry – scaled by a factor of g kg−1.
The GLORYS12V1 dataset was complemented by temperature and salinity profiles from product ref. no. 2 (CASTS; Table 1), which is composed of historical profiles in Atlantic Canada and the Eastern Arctic dating back to 1912 but is limited here to the period 1993–2023. Many of the CASTS profiles used in this study were collected under the Atlantic Zone Monitoring Program (AZMP; Therriault et al., 1998), which routinely monitors core stations and transects at annual and seasonal frequencies. Two AZMP transects (Seal Island and Flemish Cap) and one high-frequency sampling station (Station 27) were considered in this study (Fig. 1). To facilitate comparison with GLORYS12V1, the CASTS potential temperature and practical salinity variables were converted to conservative temperature and preformed salinity using the Python implementation of the Gibbs-SeaWater (GSW) Oceanographic Toolbox (McDougall and Barker, 2011).
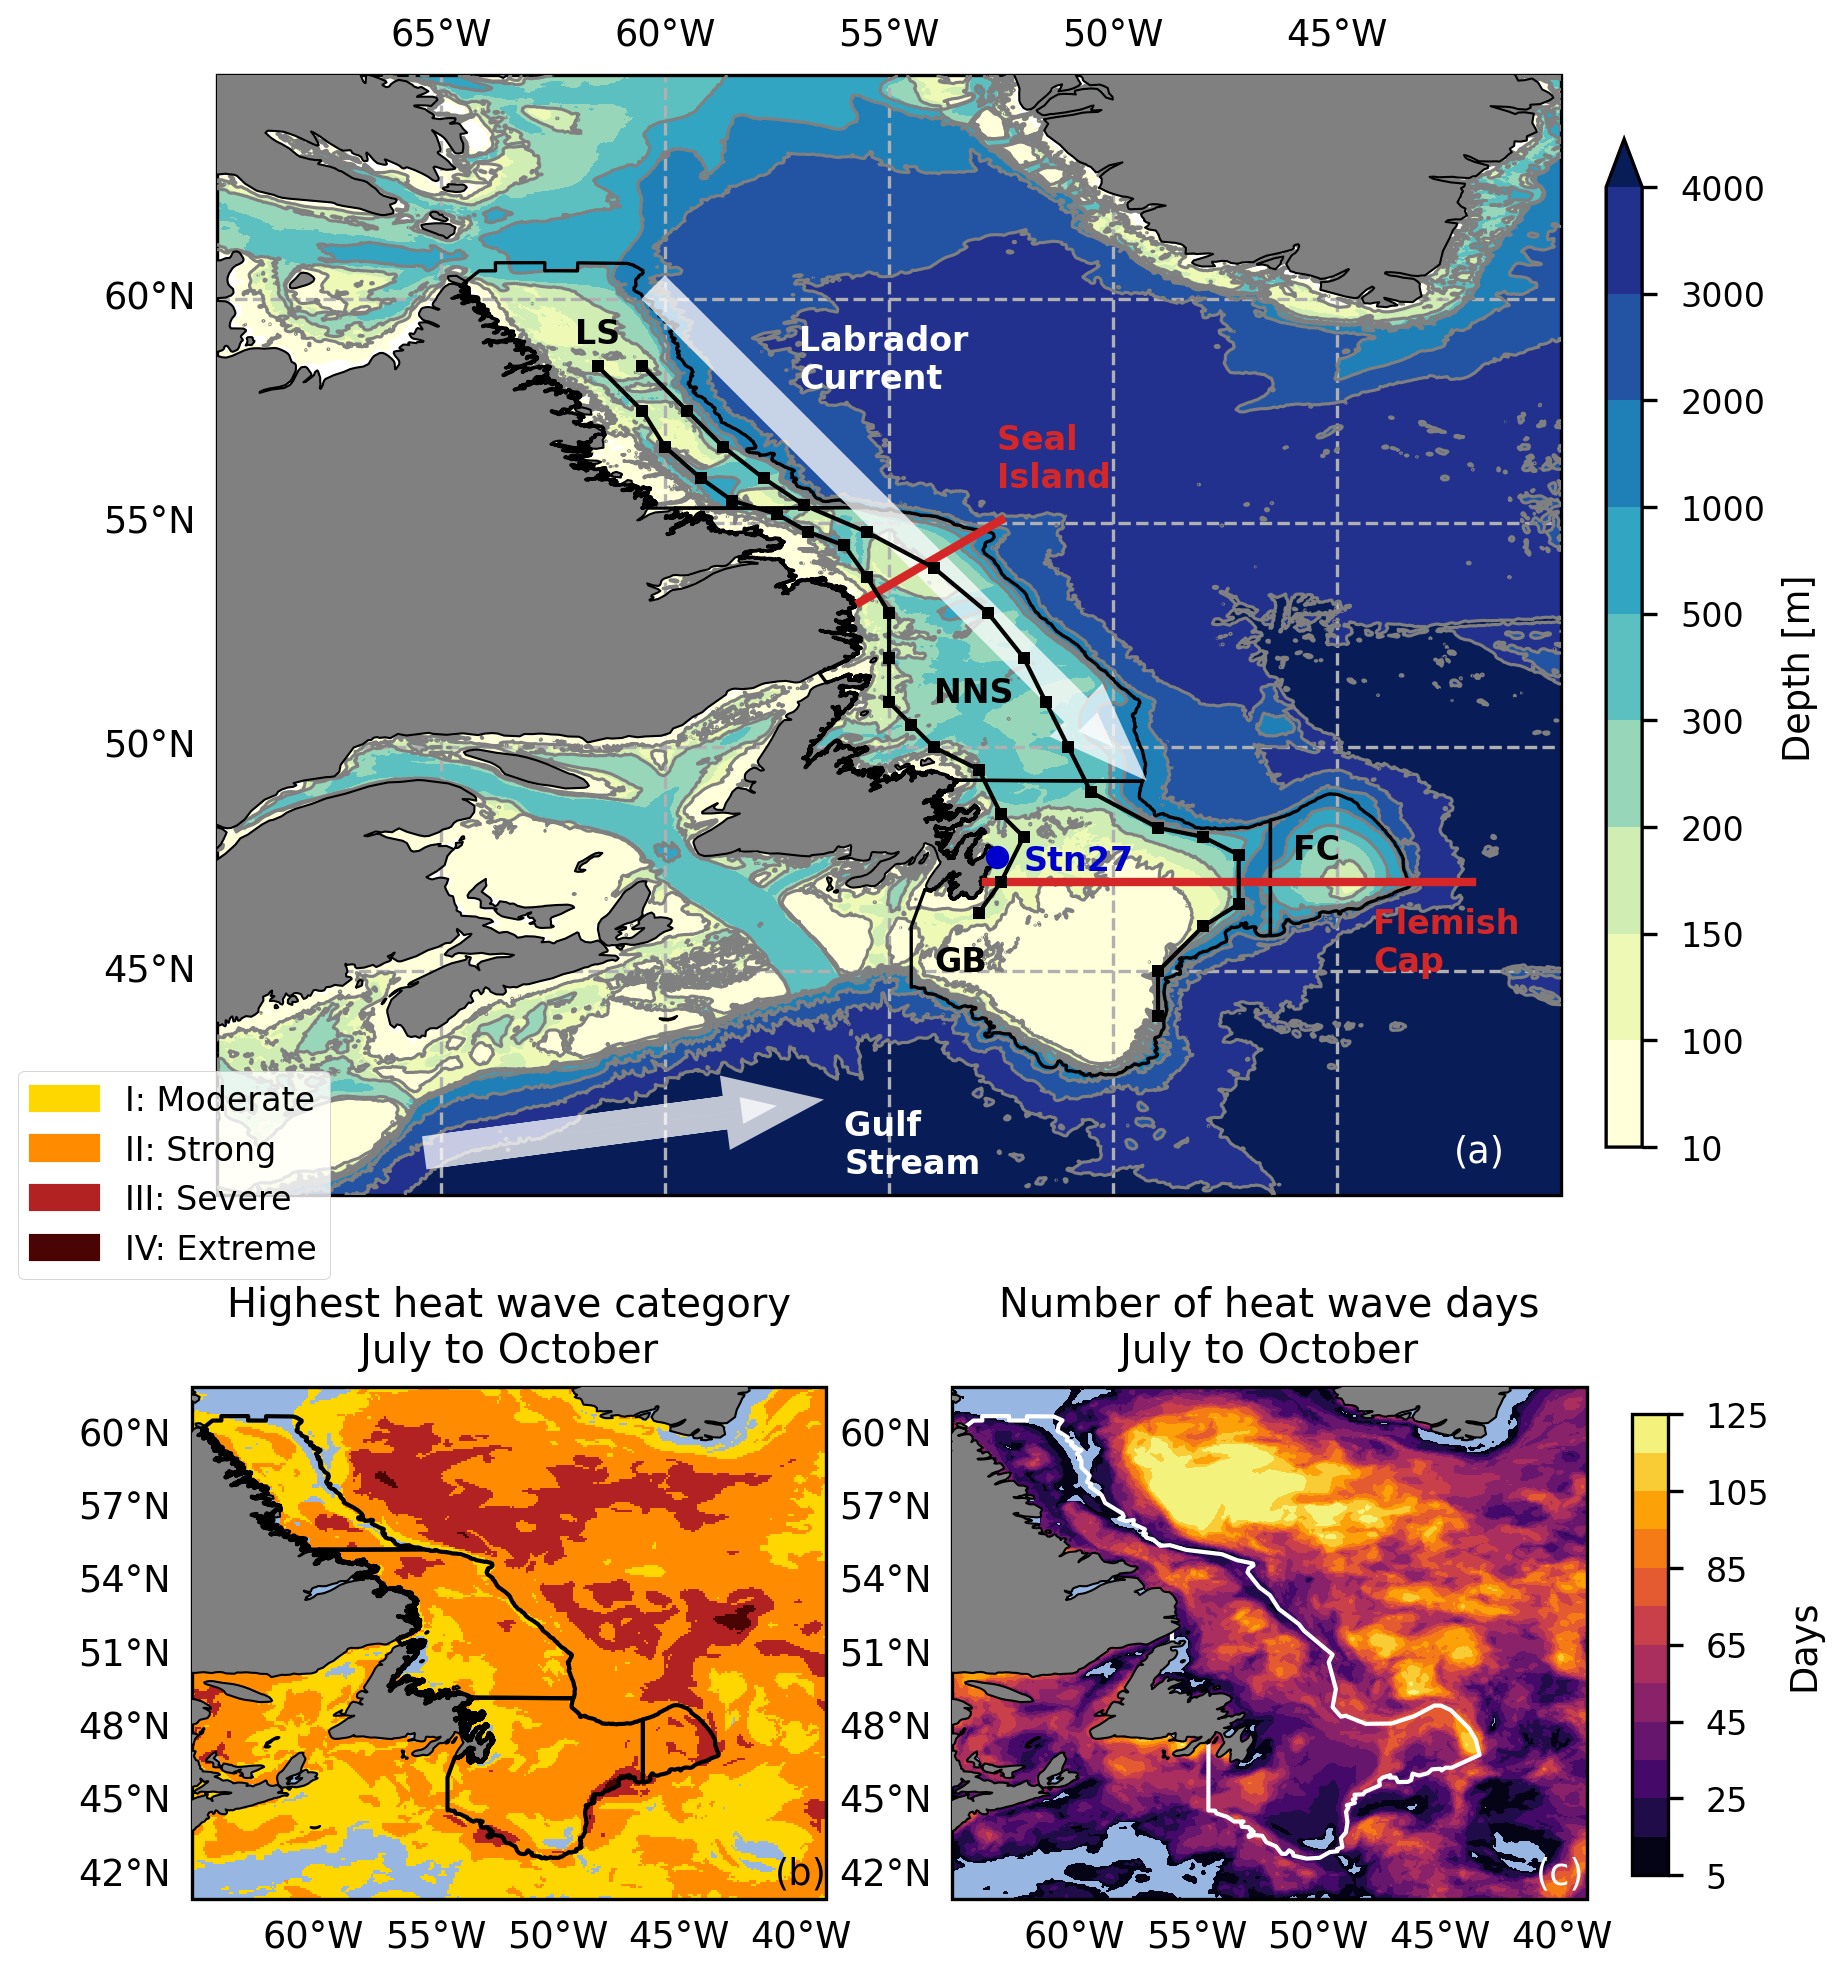
Figure 1(a) Bathymetry from ETOPO 2022 (product ref. no. 4) in the study region. The thin black lines represent the regions over which MHW statistics are calculated: Labrador Shelf (LS), Northeast Newfoundland Shelf (NNS), Grand Banks (GB), and Flemish Cap (FC). Standard AZMP transects Seal Island and Flemish Cap are represented by the red lines. The dark-blue dot is the location of Station 27 (Stn27). Light-coloured arrows represent schematics of the Labrador Current and Gulf Stream. Black line segments with dots represent the Outer and Inner Shelf transects. (b) Spatial map of highest heat wave categories in July through October 2023 calculated from GLORYS12V1 (product ref. no. 1). Subregion polygons are shown for reference in black. (c) Total number of heat wave days in July through October 2023 (maximum 122 d), also calculated from the GLORYS12V1 product. The white line represents the polygon used to define the entire NL Shelf. The region definitions are derived from Ecosystem Production Units (Pepin et al., 2014) and contain information licensed under the Open Government Canada Licence – Canada. Maps were created with the Cartopy software package (Met Office, 2010–2015) and data from Natural Earth.
Finally, 10 m wind speeds were taken from product ref. no. 3, which is a global atmospheric reanalysis (ERA5; Table 1). Daily mean wind speeds were smoothed using an 11 d rolling mean in order to isolate synoptic-scale events by removing high-frequency variability. Additionally, the role of air–sea interaction was examined using the following ERA5 variables: net surface shortwave radiation (Qswr), net surface longwave radiation (Qlwr), surface latent heat flux (Qlh), and surface sensible heat flux (Qsh). Following Denaxa et al. (2024), the sum of these four components was used to determine the net surface heat flux (Q), and Qswr was taken as the surface value. All heat flux and radiation variables are positive downwards and represent a daily average. The ERA5 daily averaged 2 m air temperature was also analyzed. Climatologies for all ERA5 variables were calculated in the same way as the MHW climatologies. Bathymetry data for plotting are taken from product ref. no. 4 (ETOPO 2022; Table 1).
2.2 Marine heat wave definitions
Following Hobday et al. (2016), we defined an MHW as a period of 5 d or longer during which the daily averaged SST exceeds the climatological 90th percentile (T90) for the given time of year. The World Meteorological Organization recommends, when possible, to use a 30-year time series (1991–2020) to calculate climatologies (World Meteorological Organization, 2017). In this study, because GLORYS12V1 starts in 1993, the climatology was calculated for each day of the year from 1993 to 2022. See the Supplement for the temperature and freshwater density trends over this period (Fig. S1) and a discussion on the sensitivity of the results to the climatological period. The climatological mean and 90th and 10th percentiles were determined using an 11 d window (see Hobday et al. (2016) for details), and the percentiles and climatological mean were smoothed using a 31 d rolling average.
Spatially, the analysis was performed over (1) every grid cell in GLORYS12V1 from 41 to 62° N and 65 to 39° W and (2) the spatially averaged SST in regions relevant to the NL Shelf ecosystem. Shown in Fig. 1a, these regions are the Labrador Shelf (LS), the Northeast Newfoundland Shelf (NNS), the Grand Banks (GB), and the Flemish Cap (FC). Each represents an area of distinct primary productivity and a well-defined food web system (Open Government, 2014; Pepin et al., 2014). A fifth region covering the entire NL Shelf (Fig. 1c) was also included.
Table 2MHW metrics and stratification for each region and the entire NL Shelf calculated from GLORYS12V1 (product ref. no. 1). For MHW metrics, ts and te are the start and end dates of each heat wave; D is the duration or number of MHW days; and imax, imean, and icum are the maximum, mean, and cumulative intensities derived from the spatially averaged sea surface temperature anomaly during each heat wave period. For stratification, , , and are the spatially averaged quantities from 2023, the 1993–2022 climatological mean, and the 1993–2022 90th percentile, respectively. The angled brackets, 〈 〉, denote a time average over the MHW period.
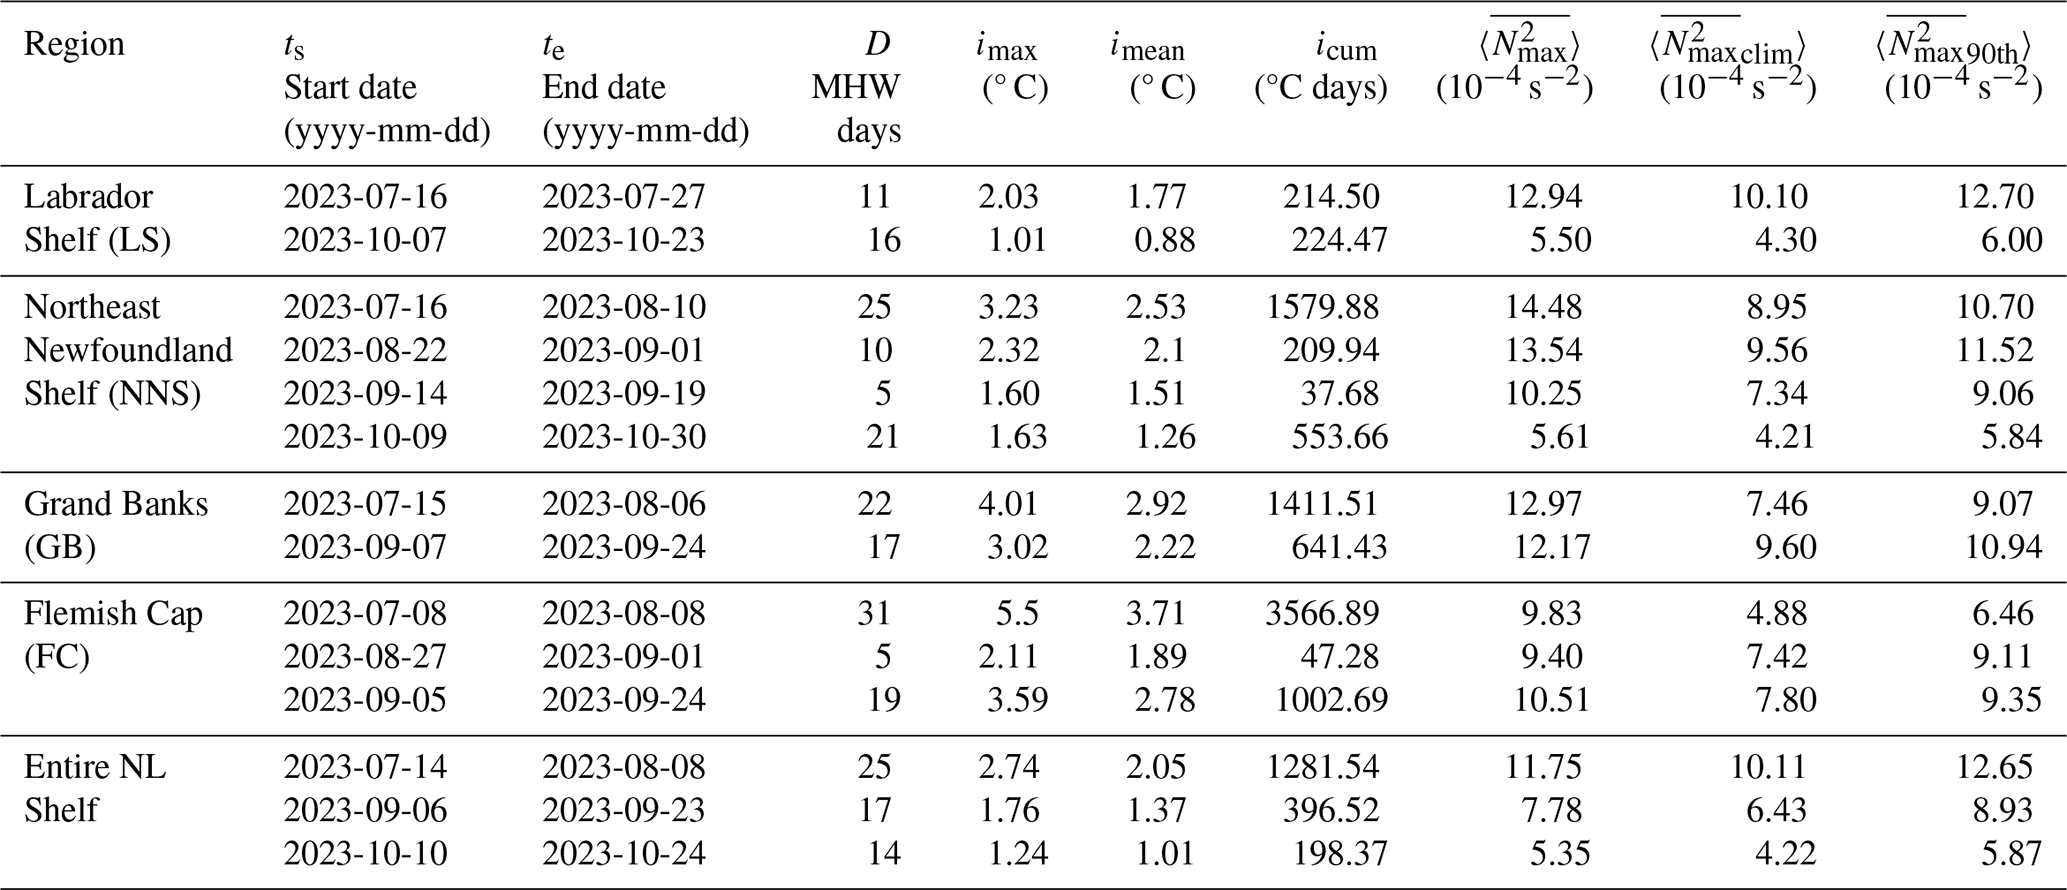
Finally, using Δ as the difference between T90 and the climatological mean, we followed Hobday et al. (2018) to define four heat wave categories when temperature T exceeds T90 as follows: moderate (), strong (), severe (), and extreme (). Some additional MHW metrics, suggested by Hobday et al. (2016), are reported in Table 2, including the start and end dates (ts and te); the duration or number of MHW days (D); and the mean, maximum, and cumulative intensities (imean, imax, and icum, respectively). The mean intensity is the mean of the temperature anomaly, the maximum intensity is the maximum of the temperature anomaly, and the cumulative intensity is the integrated daily temperature anomaly over the MHW period.
2.3 Stratification, depth-averaged temperature, and freshwater density
The 2023 daily time series and climatologies (1993–2022) of three additional metrics (stratification, depth-averaged temperature, and freshwater density) were calculated. The metric climatologies were determined using the same methodology as applied to the SST climatologies. Firstly, the stratification was assessed by calculating the squared-buoyancy frequency, N2(z), over the entire water column using the GSW Oceanographic Toolbox (McDougall and Barker, 2011); then, its vertical maximum, , was used as a measure of stratification. A large value indicates strong stratification, which can limit the vertical exchange of heat and salt content. This quantity was analyzed as a spatial average over each region and at the grid cell closest to Station 27 where comparisons with observed data were made. In order to compare modelled and observed profiles of N2(z) at Station 27, the observed temperature and salinity fields were first interpolated to GLORYS12V1 depth levels, then N2(z) was calculated, and then its vertical maximum was determined. Furthermore, we defined the mixed-layer depth as the depth of the vertical maximum of N2(z).
Secondly, the depth-averaged temperature and freshwater density were used to examine the daily time evolution of temperature and freshwater content in the uppermost 20 m spatially averaged over the NL Shelf region (see Fig. S5 in the Supplement for additional depth bins). The depth-averaged temperature is defined as
where T is the temperature and z1 and z2 are the depth levels over which the integral is calculated. The freshwater density is
where is the in situ density calculated with the GSW Oceanographic Toolbox, S is the salinity, p is the pressure, is the density of seawater with zero salinity, and Sref is a reference salinity of 35 g kg−1. Quantities that were spatially averaged over a region or across a transect are denoted by an overbar symbol. For example, the spatially averaged sea surface temperature over a region is defined by
From July through October, MHWs were detected over most of the Northwest Atlantic (Fig. 1). Over the NL Shelf, MHW categories mainly ranged from moderate to severe, with spatial variability in the intensity and duration. No MHWs were present continuously throughout the entire July to October period, but, rather, a series of MHWs transpired in each region (Table 2). Each MHW period was associated with higher-than-typical stratification, in many cases exceeding the 90th percentile. The most intense and longest duration MHW began in July in FC. Each of the other subregions experienced their strongest MHW (in terms of maximum and mean intensity) around the same time, also commencing in July. A large portion of the southern GB received relatively short-duration and low-intensity MHWs, while both LS and NNS contained localized areas of higher-intensity MHWs (e.g. up to severe) that were approximately collocated with areas of greater total MHW days in the July through October period (Fig. 1).
When the MHW metrics were determined by spatially averaging over the entire NL Shelf, the result was three MHW periods (Table 2). These three periods approximately coincide with the MHW periods identified in the regional analysis. However, the late-August MHW in FC and NNS is not captured in the larger spatial average. Nevertheless, we used MHW metrics over the entire NL Shelf region to identify local oceanographic and meteorological conditions that contributed to the evolution of this series of MHWs.
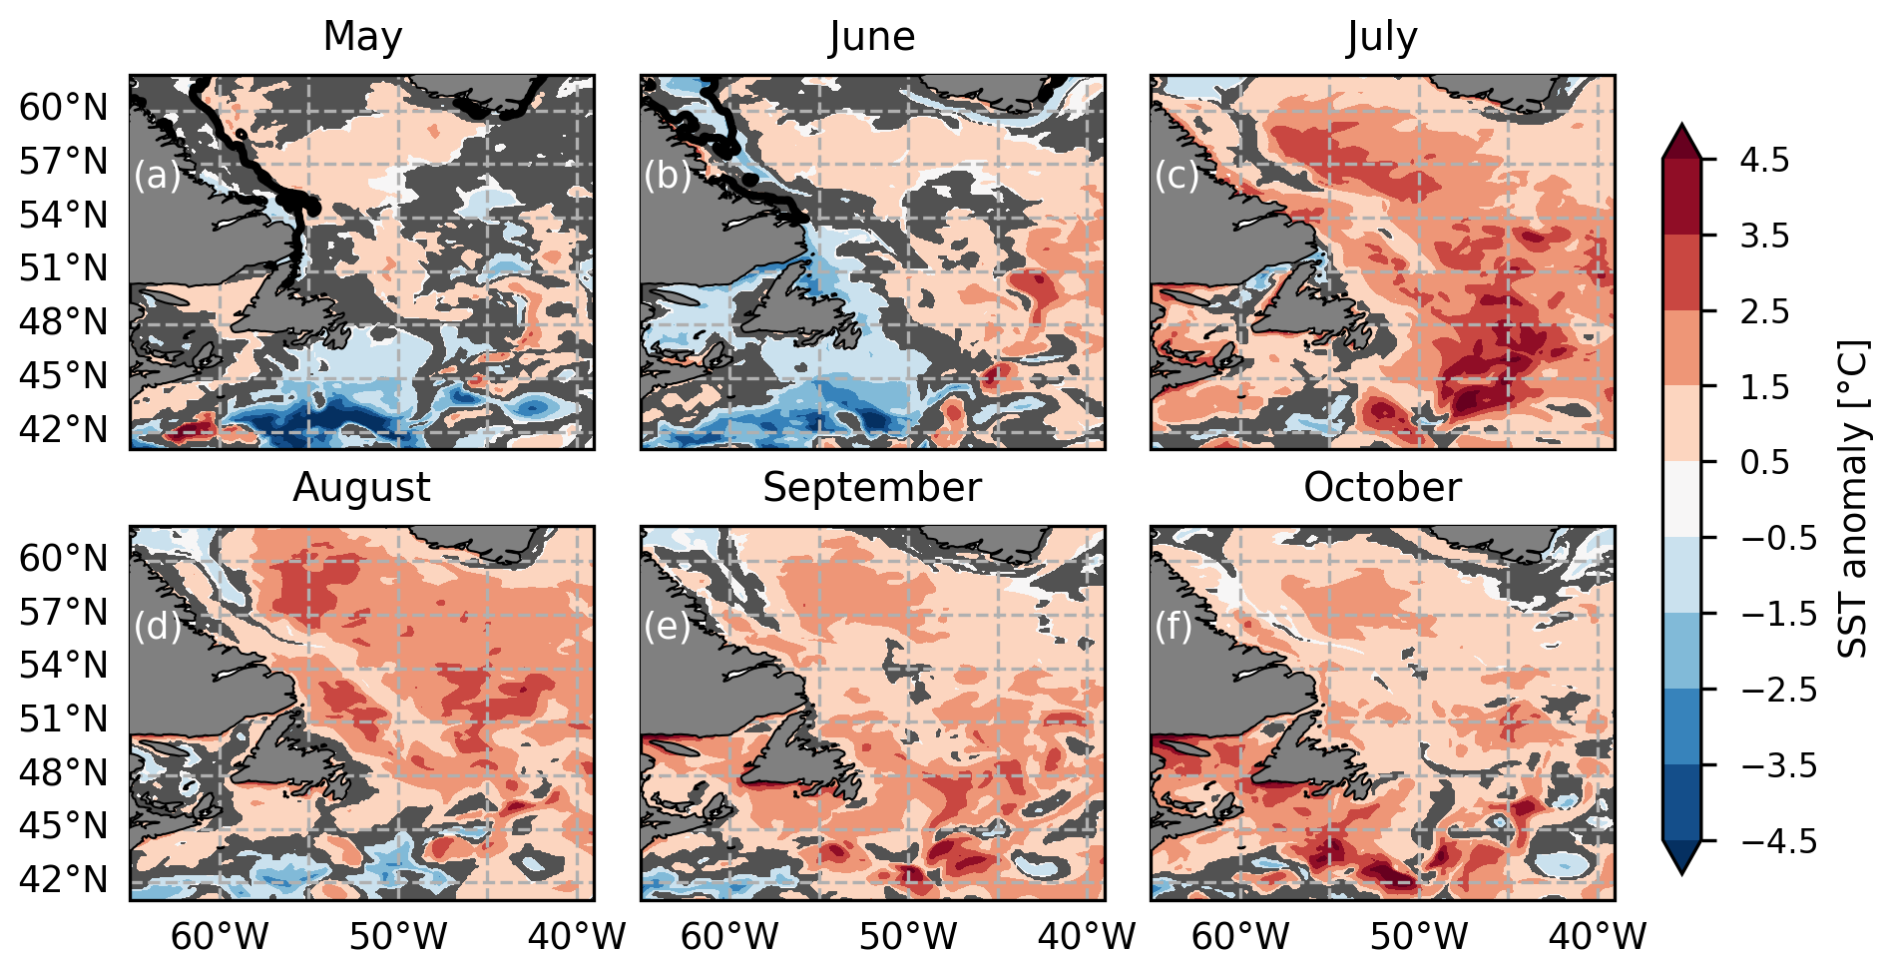
Figure 2Sea surface temperature anomaly from GLORYS12V1 (product ref. no. 1) averaged over (a) May, (b) June, (c) July, (d) August, (e) September, and (f) October 2023. A reference period of 1993–2022 is used to calculate climatology. The thick black contours in panels (a) and (b) indicate the monthly maximum sea ice extent from the GLORYS12V1 in 2023. GLORYS12V1 had no sea ice in this area from July through October. The grey shading represents regions where the absolute value of the anomaly is less than 0.5 times the interannual standard deviation of the monthly mean sea surface temperature. Maps were created with the Cartopy software package (Met Office, 2010–2015) and data from Natural Earth.
An intriguing feature of this series of MHWs is that it was preconditioned by an unusually cold spring (Fig. 2a–b). In mid-June, spatially averaged SST anomalies over the entire shelf were as low as −0.56 °C. In some areas, such as the southwestern extent of GB and coastal regions of southern NNS, monthly averaged SST anomalies in June were below −1.50 °C (Fig. 2b). In contrast, anomalies in July were positive over nearly the entire NL Shelf, and the highest anomalies occurred in the FC region. High positive anomalies continued over most of the NL Shelf in August, but the highest anomalies were found in the NNS region. In September, high anomalies returned to the FC area and were concentrated in areas with steep bathymetric gradients that are strongly influenced by the Labrador Current, suggesting a possible advective source of warm water from upstream. Finally, October saw a reduction in the strength of the anomalies, but SSTs were still warmer than usual across the entire NL Shelf.
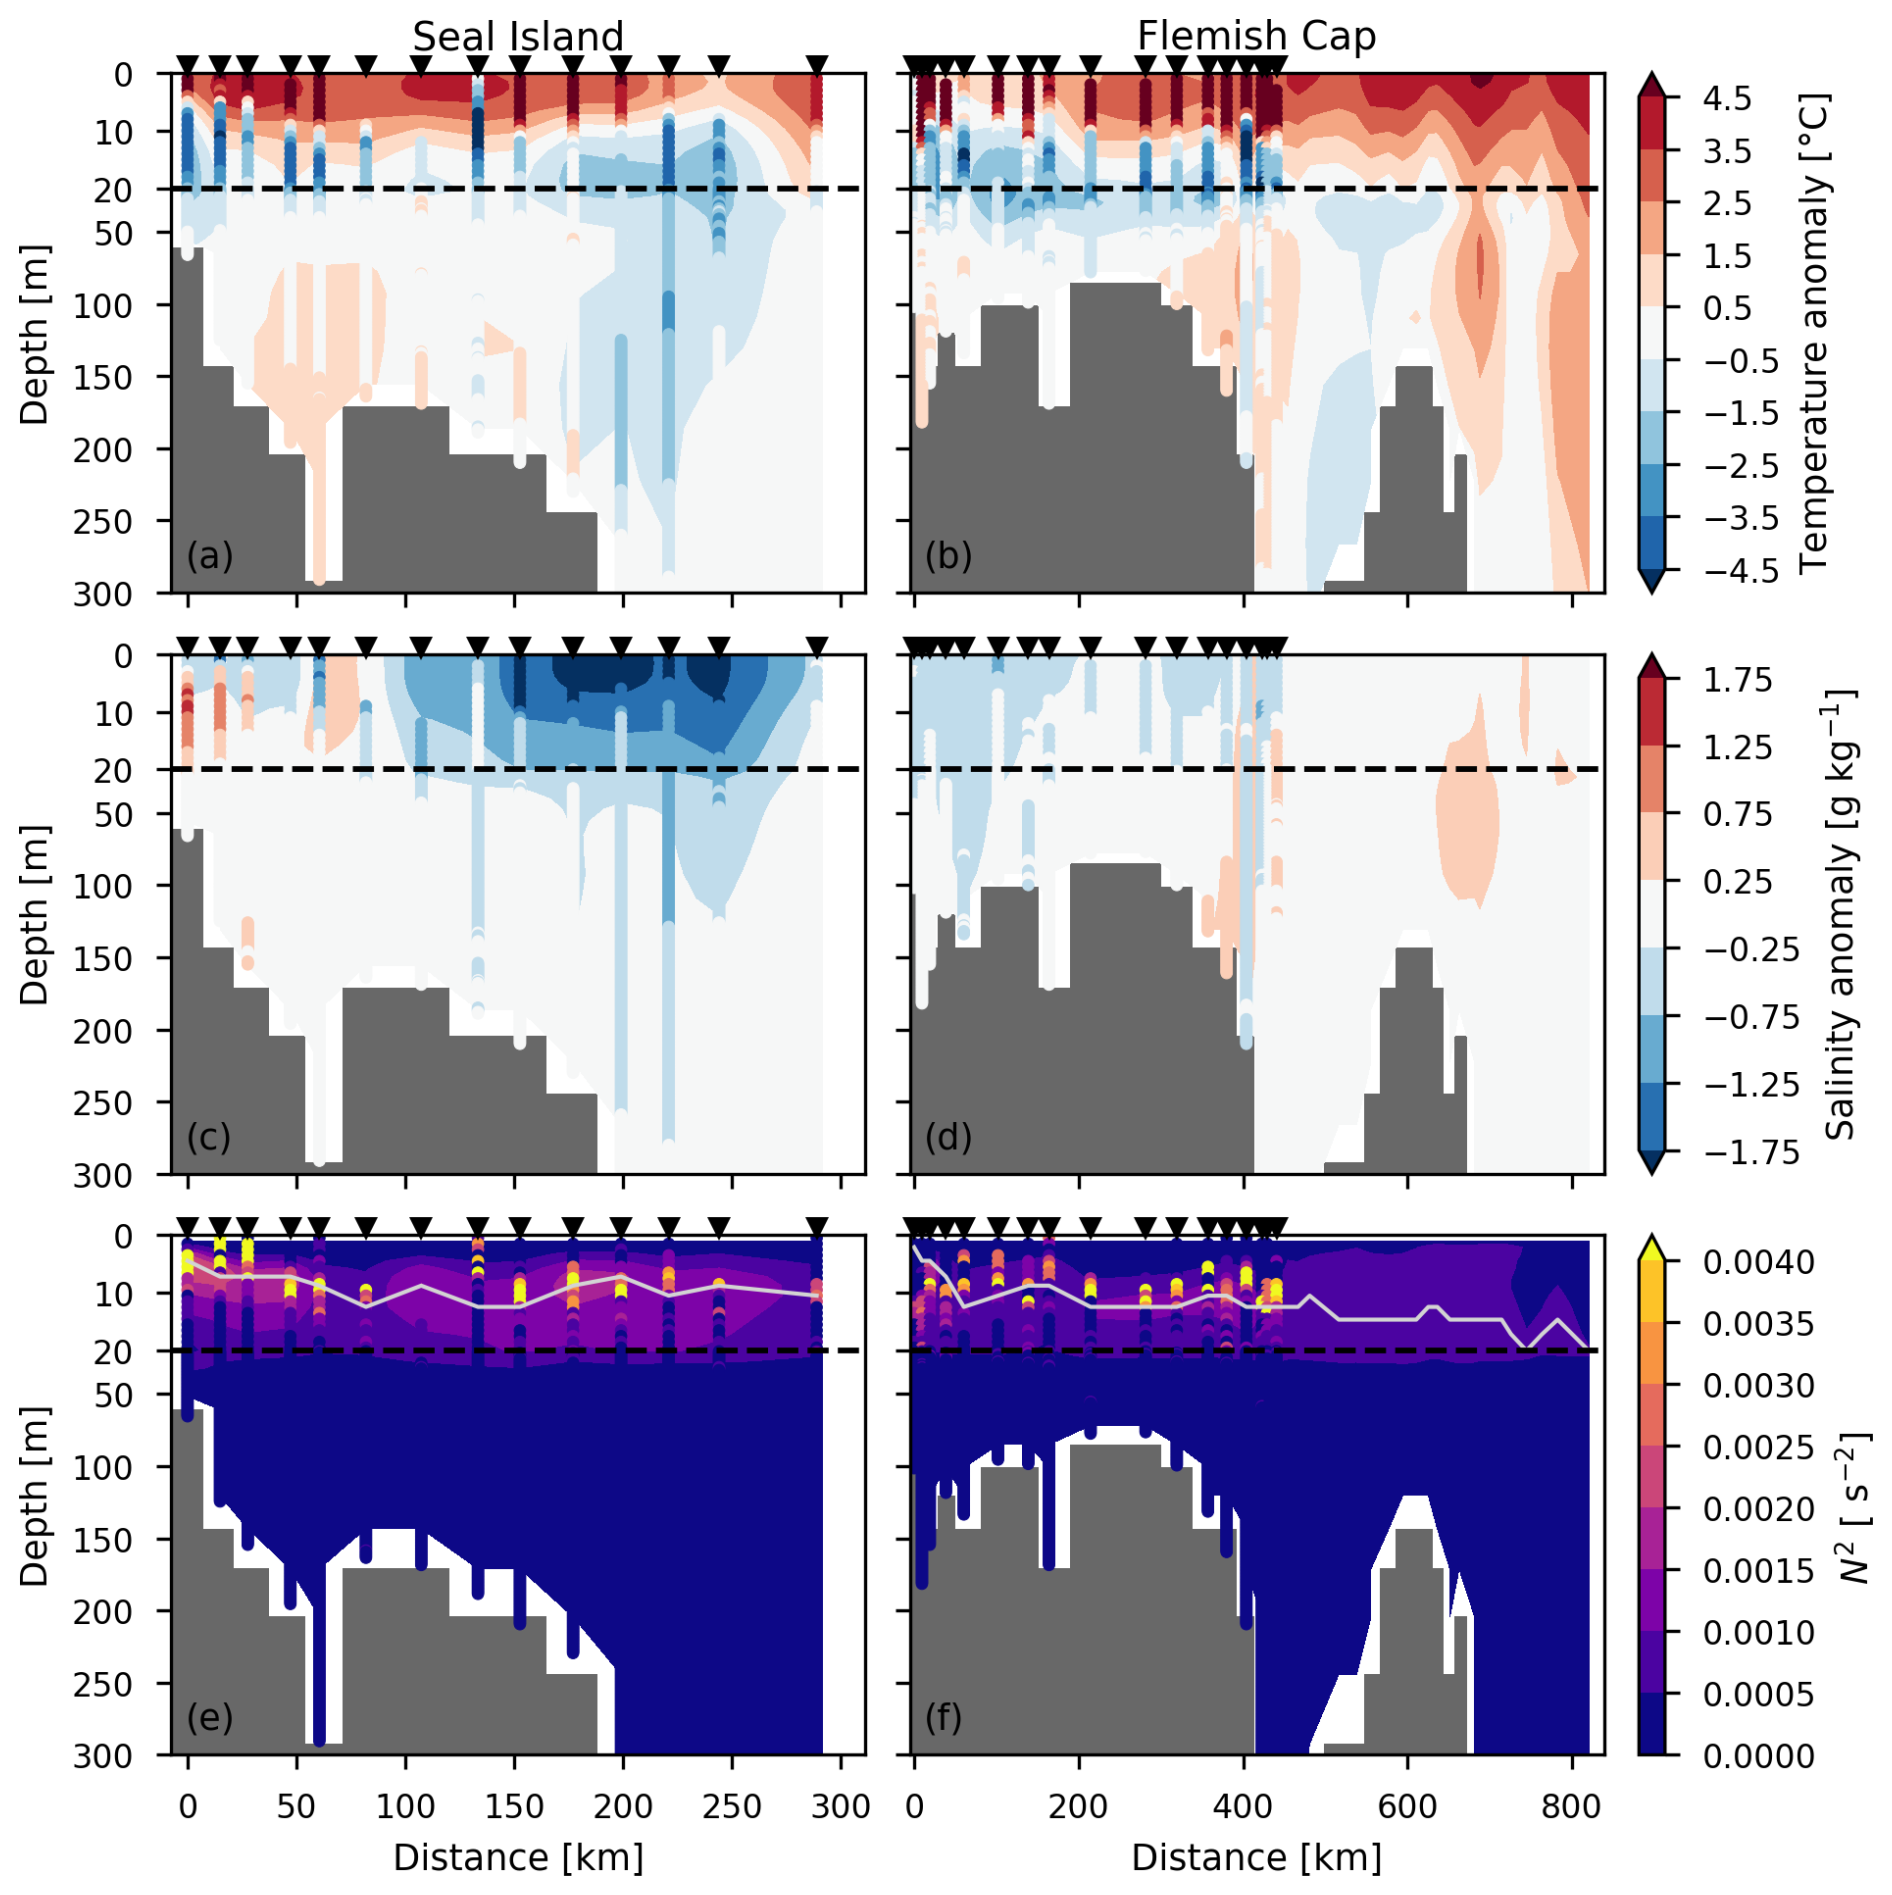
Figure 3Vertical cross-section of temperature anomalies (a, b), salinity anomalies (c, d), and squared-buoyancy frequency (e, f) along the Seal Island (a, c, e) and Flemish Cap (b, d, f) transects shown for AZMP July 2023 occupation dates. For Seal Island, the AZMP occupation occurred on 25 July. For Flemish Cap, the stations inshore of 200 km were sampled on 20 July and the others were sampled on 30 July. GLORYS12V1 data (product ref. no. 1) matched to the AZMP sampling dates are shown in shaded contours, and AZMP data (product ref. no. 2) are shown in the coloured circles which appear as lines extending from top to bottom. In panels (e) and (f), the solid grey line represents the mixed-layer depth defined as the depth of the maximum squared-buoyancy frequency. For Flemish Cap, GLORSY12V1 data at locations offshore of approximately 400 km, which were not sampled by AZMP in July 2023, are taken as the mean of 20 and 30 July. A reference period of 1993–2022 is used to calculate climatologies for both GLORYS12V1 and AZMP. For AZMP, all July and August occupations in the reference period were used to construct the climatology. The black triangles represent the positions of the AZMP stations sampled in July 2023. Note the difference in vertical scale above and below 20 m (dashed black line).
In addition to unusually cold spring SSTs (Fig. 2a–b), subsurface temperatures from about 10–50 m in July were below normal across the Seal Island and Flemish Cap transects in both the GLORYS12V1 (product ref. no. 1) and AZMP (product ref. no. 2) profiles (Fig. 3a–b). Both transects displayed a very warm surface layer reaching to approximately 10 m in depth. Additionally, the Seal Island transect showed anomalously fresh conditions in the upper 20 m across most of the transect in July (Fig. 3c), particularly over the shelf break. Along the Flemish Cap transect, fresh signals were not as strong as at Seal Island at this time, but salinity anomalies between −0.25 and −0.75 g kg−1 were apparent near the coast.
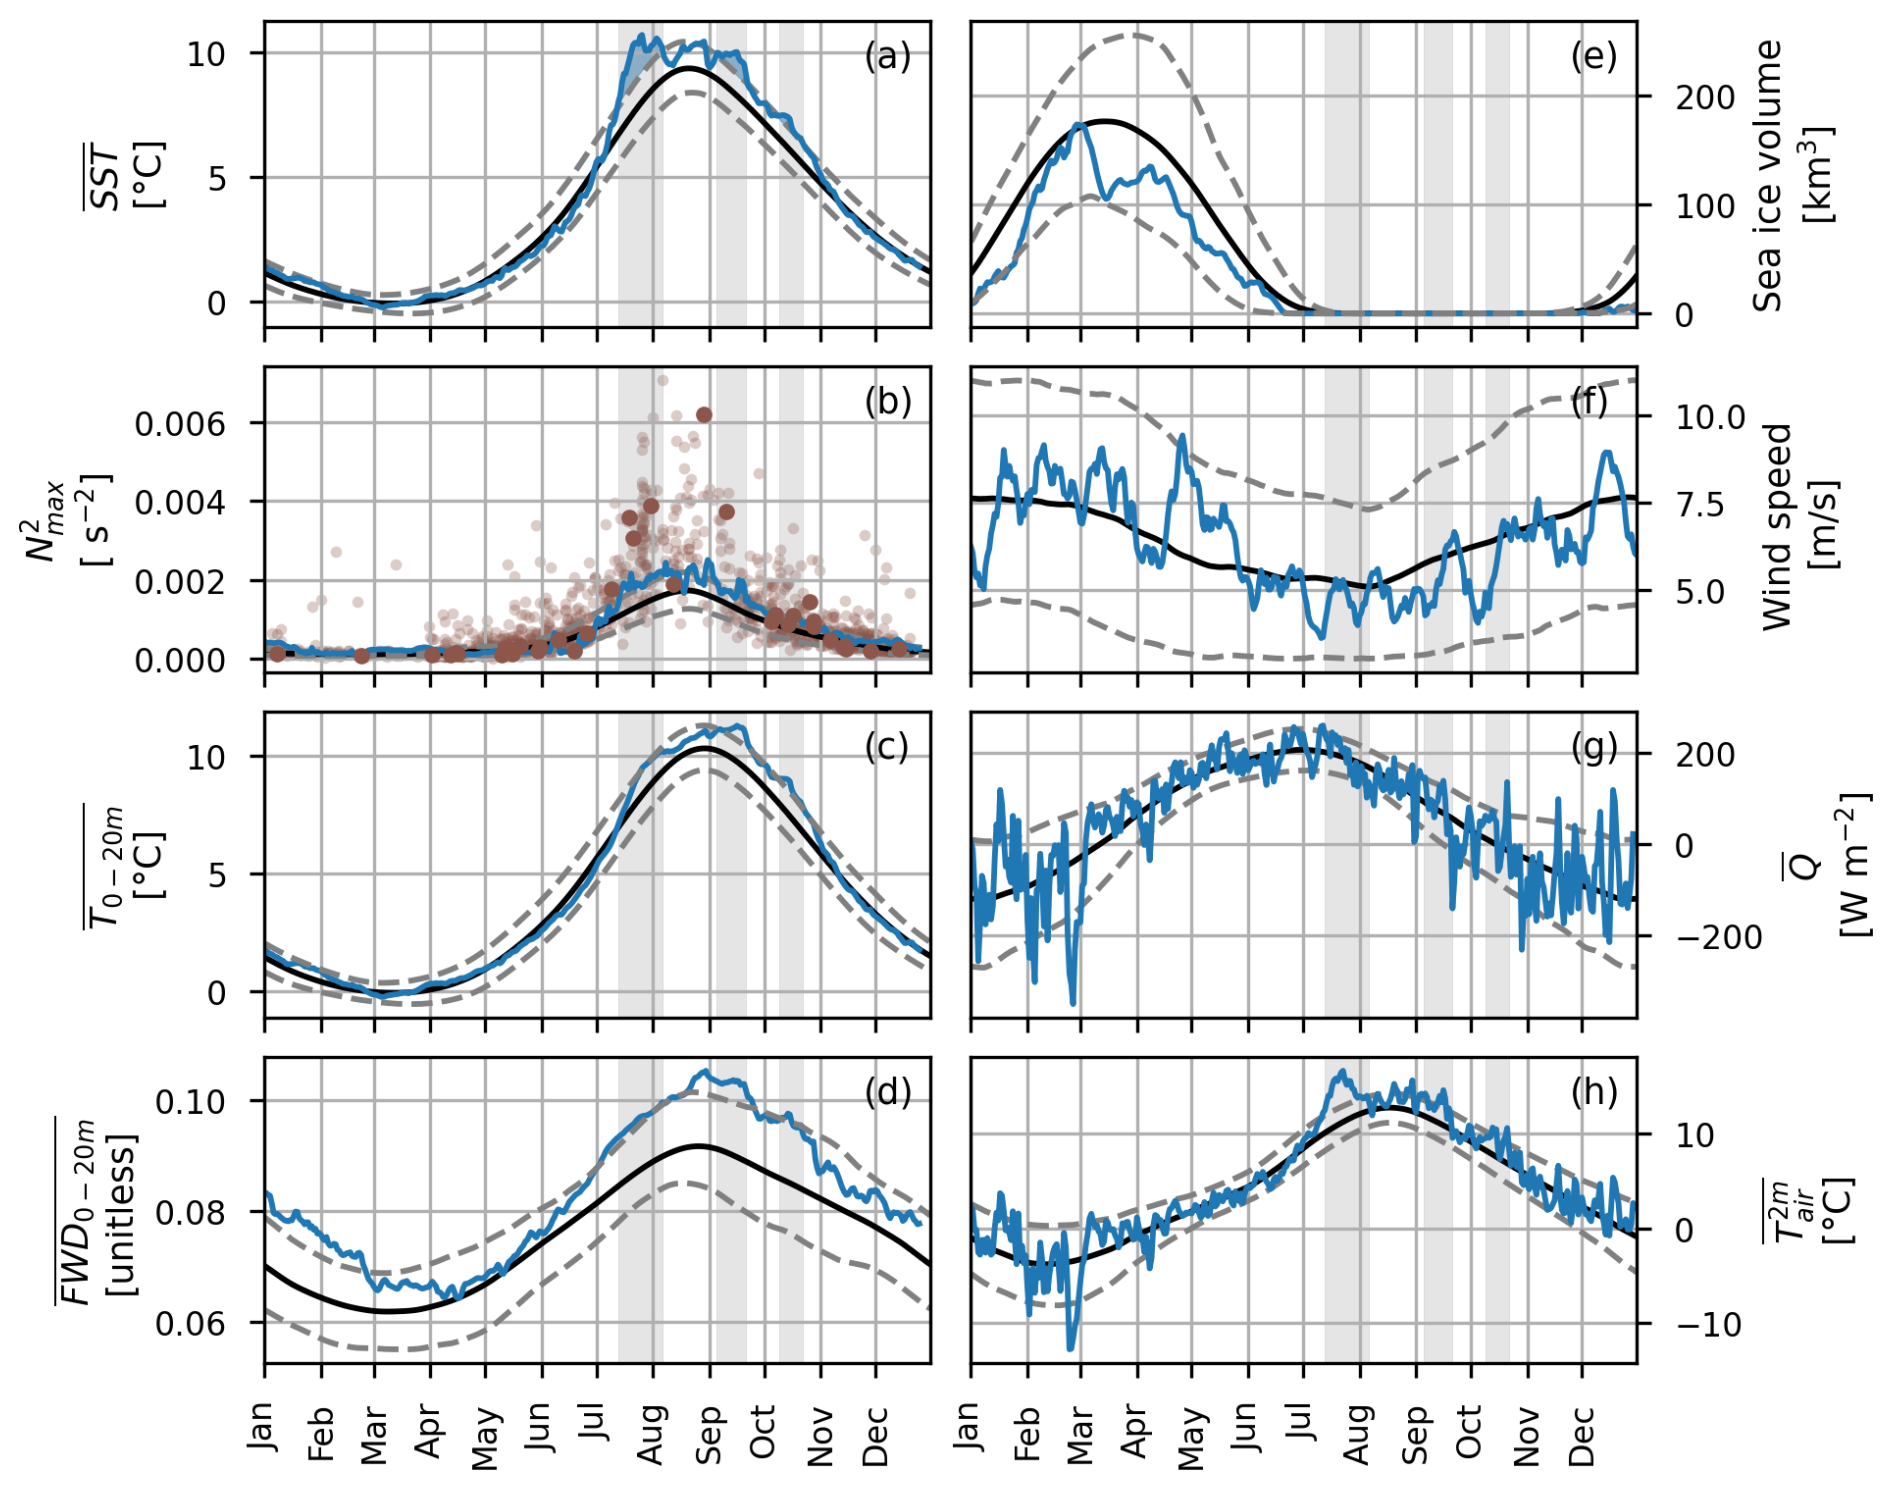
Figure 4Time series plots for 2023 in blue lines, the 1993–2022 climatology in black lines, and the 1993–2022 10th and 90th percentiles in dashed grey lines. Variables from GLORYS12V1 (product ref. no. 1) are (a) sea surface temperature averaged over the NL Shelf, (b) maximum squared-buoyancy frequency at Station 27, (c) depth-averaged temperature from 0–20 m averaged over the NL Shelf, (d) freshwater density from 0–20 m averaged over the NL Shelf, and (e) sea ice volume over the NL Shelf. ERA5 (product ref. no. 3) variables include (f) 10 m wind speed at Station 27, (g) net daily averaged surface heat flux averaged over the NL Shelf (where positive indicates a downward flux), and (h) 2 m air temperature averaged over the NL Shelf. Maximum squared-buoyancy frequency data at Station 27 from AZMP (product ref. no. 2) are shown in panel (b) for 2023 with large dark-brown dots and for 1993–2022 with small light-brown dots. Heat wave periods are indicated by the grey shading.
The anomaly structures of vertical profiles for both temperature and salinity suggest high stratification during the AZMP occupations in July. The squared-buoyancy frequency and mixed-layer depth during those occupations, shown in Fig. 3e and f, indicate stratified conditions in the upper 20 m of the water column. Furthermore, high stratification was apparent at Station 27 in both the GLORYS12V1 and AZMP data throughout nearly the entire summer and early fall (Fig. 4b). High stratification is partially explained by the anomalously cold spring which resulted in a colder-than-typical subsurface layer and, in turn, strong vertical temperature gradients when surface warming commenced as a result of solar heating (see Figs. S6, S7). Furthermore, the 0–20 m freshwater density in Fig. 4d reveals fresher-than-typical near-surface conditions from July through October. This fresh anomaly was concentrated in the upper 20 m (see Fig. S5), further explaining the higher-than-usual stratification. The source of the fresh anomaly is not yet clear, but it is present in both GLORYS12V1 and observations (Fig. 3c and d). Freshwater input due to sea ice melt from both local and remote areas is a possible explanation. Unfortunately, sea ice in GLORYS12V1 may not be helpful to describe this, as its sea ice cover does not appear to match observations very well, with no sea ice present in July 2023 or even in the 90th percentile of the 1993–2022 climatology (Fig. 4e).
Another factor that impacts stratification is the degree of vertical mixing introduced by wind forcing at the ocean surface. The 10 m wind speeds from ERA5 (product ref. no. 3) at Station 27 shown in Fig. 4f demonstrate that periods of below-average wind speeds in the summer and fall (e.g. early July, mid-August to early September, and late September to early October) preceded the three heat wave periods identified in Fig. 4. Furthermore, a return to average wind speeds preceded the end of each heat wave period, with the exception of a wind event in mid-July. This mid-July event corresponded with a reduction in the Station 27 stratification and was followed by a slight dip in the spatially averaged SST as the cold subsurface layer was mixed with the warm surface. Although the periods of average wind speeds were linked with a pause in heat wave conditions, it is likely that these wind events were not strong enough to significantly erode the strongly stratified conditions introduced by a cold spring and fresh early summer. In turn, cold subsurface conditions (from about 20–50 m; not shown), high stratification, and retention of heat near the surface persisted throughout most of the summer and fall.
Additionally, heat transfer between the ocean and atmosphere is an important element to consider (see Figs. 4g and h, and S2). During the July MHW, the 2 m air temperature from ERA5 was extremely high: at times, it was greater than the annual maximum of the climatological 90th percentile (Fig. 4h). Furthermore, the net surface heat flux was anomalously high during the first few days of the July MHW event but approached anomalously low values as the event reached its end. Similarly, the September and October MHWs exhibited higher-than-average air temperature and surface heat flux, although not every period in 2023 with these conditions resulted in an MHW (e.g. mid- to late January, mid-May, December).
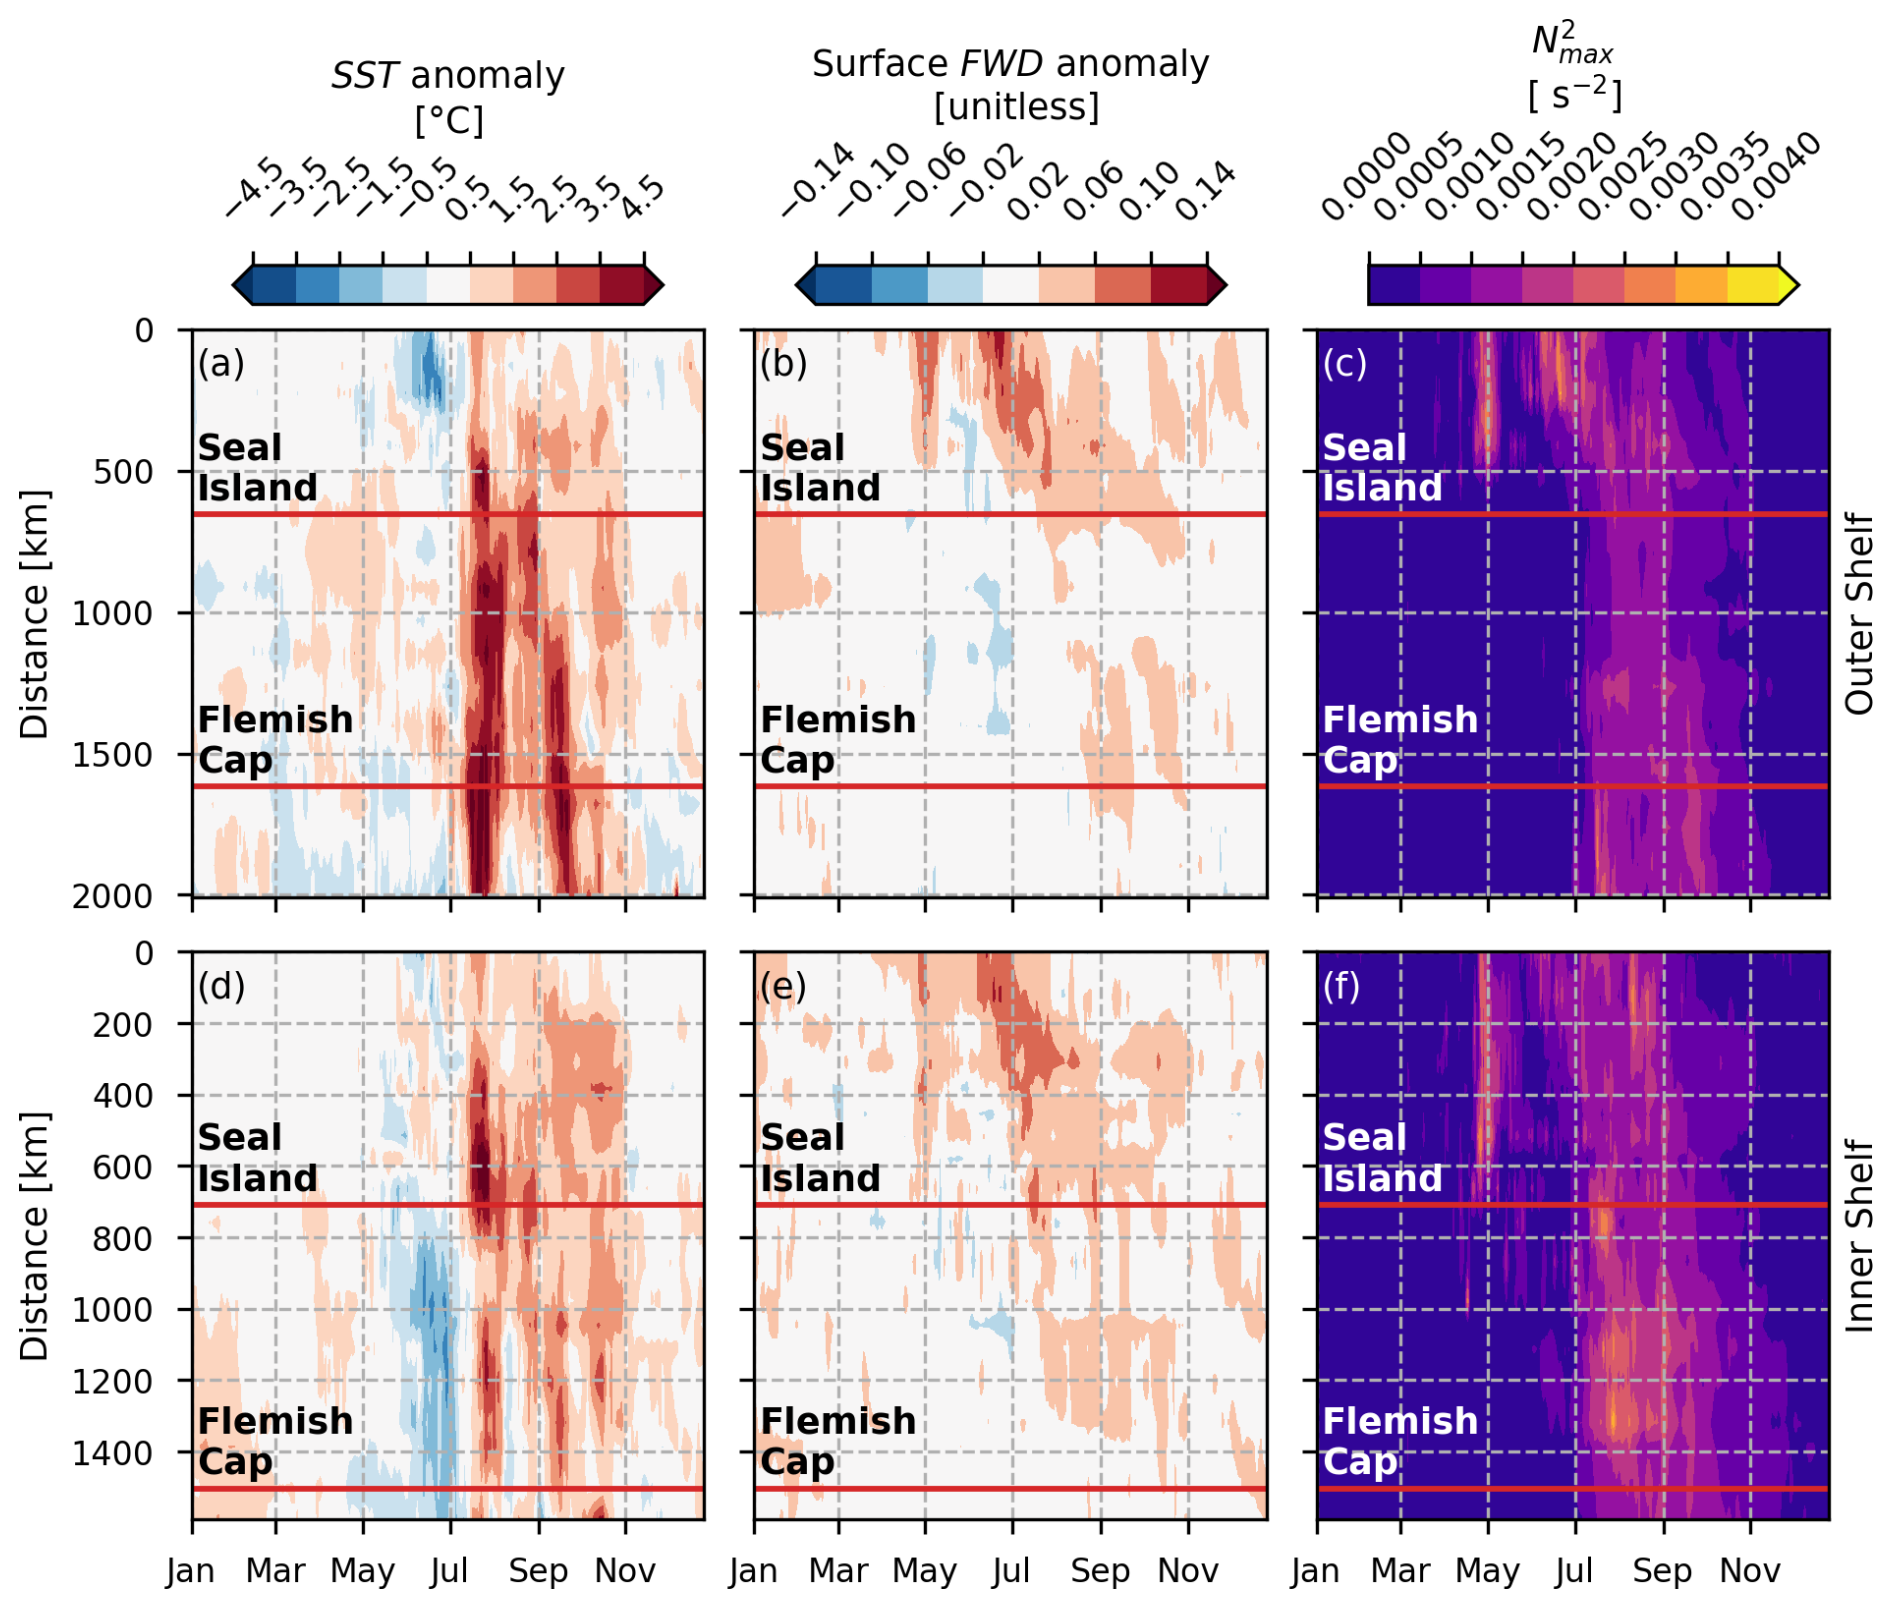
Figure 5Time series of GLORYS12V1 (product ref. no. 1) sea surface temperature anomaly (a, d), surface freshwater density anomaly (b, e), and vertical maximum of the squared-buoyancy frequency (c, f) along the Outer Shelf (a–c) and Inner Shelf (d–f) transects for the year 2023. See Fig. 1a for Outer Shelf and Inner Shelf transect definitions. Distance is measured along each transect starting from the most upstream station. The red horizontal lines represent the along-shelf locations of the Seal Island (a–c) and Flemish Cap (d–f) transects. A reference period of 1993–2022 is used to calculate the climatology used to determine the anomalies.
Finally, the role of advection is illustrated by examining the evolution of surface temperature and freshwater density anomalies and the vertical maximum of the squared-buoyancy frequency along the shelf (Fig. 5). Firstly, advection is evident where periods of positive freshwater density anomaly and high stratification that are seen in May through June in the upstream parts of the transects (approximately 0 to 200 km) gradually propagate downstream. These anomalously fresh conditions arrived at Seal Island by the time of the mid-July MHW, increasing the stratification to above typical conditions (see Fig. S4 for climatological stratification). Throughout the shelf, there is typically a link between periods of increased freshwater density and increased stratification (see Figs. S3 and S4), suggesting advected and/or local freshwater input plays an important role in establishing stratification in this region. Advection may also impact sea surface temperatures through the transport of warm water masses. However, during the July MHW, advection of warm anomalies is not apparent in Fig. 5. Rather, this event was nearly simultaneous and widespread across the entire shelf. Advection of warm water may have been a contributor for the MHW downstream of Seal Island in September through October, although a more detailed analysis is warranted in the future.
A combination of factors illustrated in Fig. 6 resulted in the series of MHWs detected on the NL Shelf in 2023. As an example, stratification increased as the surface layer warmed in July, preconditioned by unusually cold water temperatures in the spring. In addition, conditions were fresher than typical in the upper 20 m (e.g. Figs. 3c, 4d, 5b and e, S5c–d). Although the source of these fresh conditions was not analyzed in this work, other studies suggest that increased Arctic sea ice melt and freshwater release from the Beaufort Gyre are responsible for recent freshening trends in the North Atlantic (Wang et al., 2024; Yashayaev, 2024). In other regions, Barkhordarian et al. (2024) and Richaud et al. (2024) link abrupt sea ice melt and strong stratification with intensified surface MHWs in the Arctic. In 2023, sea ice conditions on the Labrador Shelf were above normal in June, leading to late last occurrence on the southern Labrador Shelf, and decreased very rapidly to zero prior to mid-July (Cyr et al., 2024b; Galbraith et al., 2024). Additionally, periods of low winds during the summer maintained the high stratification by limiting vertical mixing. As a result, heat was retained near the surface resulting in a series of MHWs throughout the summer and fall. This series was interrupted by occasional wind events which excited vertical mixing and reduced SSTs. Recent work by Sun et al. (2024) indicates a strong correlation between changes in the oceanic mixed-layer depth and the occurrence of MHWs globally, highlighting an important connection between mixed-layer restratification and surface MHWs.
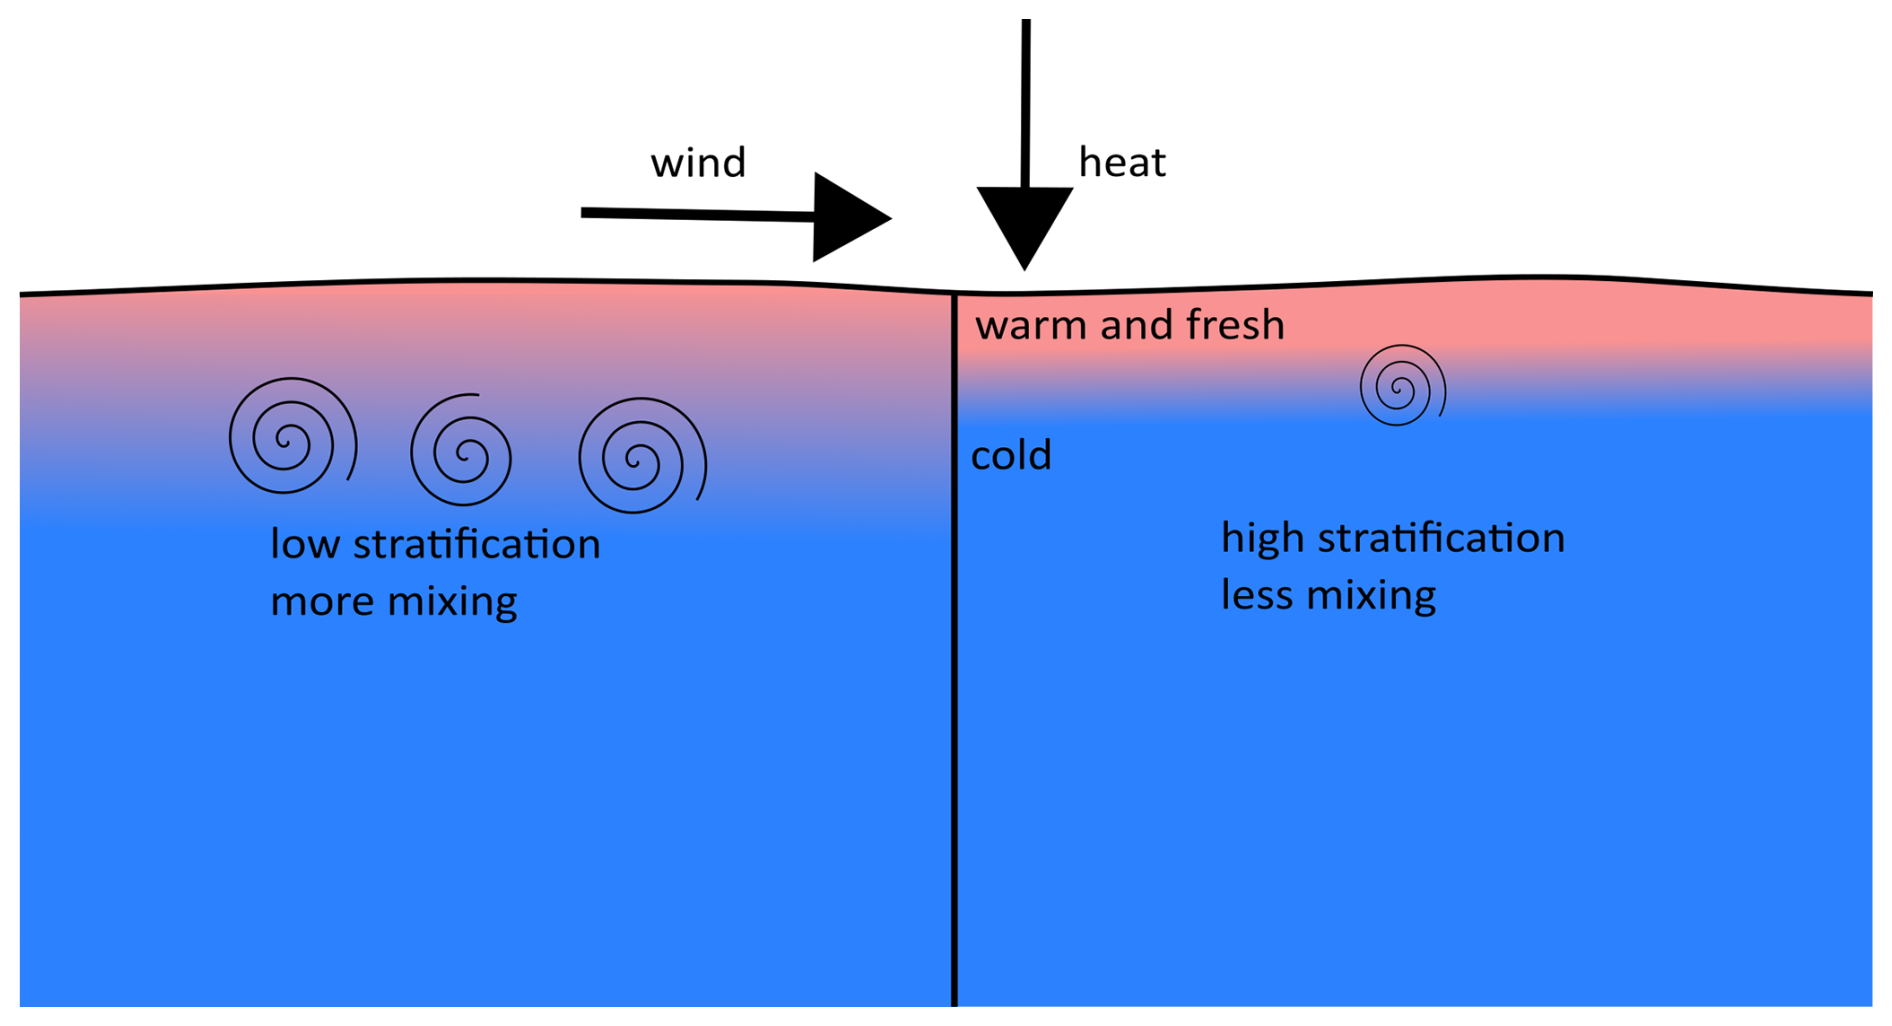
Figure 6Schematic diagram describing the role of increased stratification on surface MHWs. On the left, lower stratification leads to more mixing. On the right, higher stratification leads to less mixing. Both scenarios receive the same heat flux and wind forcing at the surface. The case with higher stratification results in higher SSTs because the heat is confined to the surface due to less mixing.
The role of air–sea interactions and heat transfer between the atmosphere and the ocean is also important. During the July MHW, the 2 m air temperature was extremely high, exceeding the annual maximum of the 1993–2022 climatological 90th percentile for nearly half of the duration of the event. The 2 m air temperature was also higher than normal during the other MHWs in 2023. Previous work by Schlegel et al. (2021) indicates that latent heat flux is an important driver during the onset of MHWs. Indeed, during the beginning of each MHW on the NL Shelf in 2023, the net surface heat flux was higher than typical (Fig. 4g), driven by positive anomalies in the surface latent heat flux and the surface longwave radiation (Fig. S2). However, not all periods of anomalously positive net surface heat flux resulted in an MHW, suggesting a combination of oceanic and atmospheric processes were at play in these surface MHWs.
The role of advection should also be considered. The Labrador Current is responsible for transporting water properties southward along the NL Shelf. For example, the anomalously fresh conditions detected at Seal Island in July (Fig. 3c) were transported south, carrying with them properties such as high stratification. Indeed, Figs. 2d–f and 5a–b show signs that warm anomalies were potentially associated with transport from NNS in August to the outer (inner) edges of GB (FC) in September. A bifurcation of the Labrador Current exists near the northern boundary of GB, directing some of the conditions associated with warm anomalies along the coast of GB in October. However, the October onset of MHWs in LS and NNS and the abrupt initiation of the July MHW across the entire shelf cannot be explained by transport. These events are more likely linked with local meteorological and oceanographic conditions.
A more thorough investigation quantifying the magnitude of these factors and relationships with large-scale atmospheric conditions is considered for future work in the NL Shelf region. For instance, a heat budget analysis in the mixed layer (see Oliver et al., 2021, as an example) could quantify the role of various elements, such as air–sea interaction, transport, and vertical mixing, in establishing MHW conditions. Furthermore, processes such as mesoscale eddies (e.g. Sun et al., 2024) and changes in coastal and shelf-break upwelling (e.g. Reyes-Mendoza et al., 2022) are likely to influence surface temperatures in the NL Shelf region. Higher-resolution modelling experiments could also be used to explore and quantify controls on MHW conditions, particularly when examining shelf-scale processes that are not resolved or well constrained by global reanalysis products.
Finally, the impact of MHWs on the NL Shelf ecosystem is an important area for future work. One area of interest is the vertical distribution of MHWs (e.g. Fig. S5) because not all elements of the marine ecosystem are impacted by high sea surface temperatures. Furthermore, regional differences in MHW intensity, frequency, and duration are important elements when considering ecosystem impacts. Tools such as ocean model reanalyses, analyses, and forecasts can aid in near-real-time monitoring by linking surface MHWs with vertical characteristics such as stratification and by exploring spatial structures in remote areas that are difficult to study directly with observations. These results suggest that ocean model nowcast and reanalysis products can complement observational methods for studying MHWs in near real-time over large geographic areas and at multiple depths.
The data used in this study are available as described in Table 1. The code used in this study can be accessed via a GitLab repository upon request via email to the corresponding author. This study has been conducted using EU Copernicus Marine Service Information: https://doi.org/10.48670/moi-00021 (E.U. Copernicus Marine Service Information (CMEMS), 2024). The data from Hersbach et al. (2023) were downloaded from https://doi.org/10.24381/cds.adbb2d47 (Copernicus Climate Change Service, 2023). The results for ERA5 contain modified Copernicus Climate Change Service information (1993–2023).
The supplement related to this article is available online at https://doi.org/10.5194/sp-6-osr9-12-2025-supplement.
NaS conducted the analysis, produced the visualizations, and prepared the initial draft. NaS, HJA, and JC organized and curated data. All authors contributed to conceptualization of the study, discussions on the methodology and results, and editing and reviewing the article.
The contact author has declared that none of the authors has any competing interests.
The Copernicus Marine Service offering is routinely updated to ensure it remains at the forefront of user requirements. In this process, some product documents and manuals may undergo replacement or renaming, leading to the removal of certain document versions.
If readers have any questions or require assistance regarding these modifications, please feel free to reach out to the Copernicus Marine Service user support team for further guidance. They will be able to provide the necessary information to address concerns and find suitable alternatives.
Neither the European Commission nor ECMWF is responsible for any use that may be made of the Copernicus information or data it contains.
Publisher's note: Copernicus Publications remains neutral with regard to jurisdictional claims made in the text, published maps, institutional affiliations, or any other geographical representation in this paper. While Copernicus Publications makes every effort to include appropriate place names, the final responsibility lies with the authors.
We thank the two anonymous reviewers for constructive comments on the article. We greatly appreciate input from and discussions with David Bélanger regarding 2023 nutrient inventories and primary productivity, along with thoughtful comments from Pierre Pepin. This work is a contribution to the science mission of the Atlantic Zone Monitoring Program.
This paper was edited by Gilles Garric and reviewed by two anonymous referees.
Barkhordarian, A., Nielsen, D. M., Olonscheck, D., and Baehr, J.: Arctic marine heatwaves forced by greenhouse gases and triggered by abrupt sea-ice melt, Commun. Earth Environ., 5, 57, https://doi.org/10.1038/s43247-024-01215-y, 2024.
Copernicus: https://climate.copernicus.eu/global-sea-surface-temperature-reaches-record-high (last access: 8 May 2024), 2023.
Copernicus Climate Change Service: ERA5 hourly data on single levels from 1940 to present, Copernicus Climate Change Service (C3S) Climate Data Store (CDS) [data set], https://doi.org/10.24381/cds.adbb2d47, 2023.
Coyne, J., Cyr, F., Donnet, S., Galbraith, P., Geoffroy, M., Hebert, D., Layton, C., Ratsimandresy, A., Snook, S., Soontiens, N., and Walkusz, W.: Canadian Atlantic Shelf Temperature-Salinity (CASTS), Federated Research Data Repository [data set], https://doi.org/10.20383/102.0739, 2023.
Cyr, F. and Galbraith, P. S.: A climate index for the Newfoundland and Labrador shelf, Earth Syst. Sci. Data, 13, 1807–1828, https://doi.org/10.5194/essd-13-1807-2021, 2021.
Cyr, F., Lewis, K., Bélanger, D., Regular, P., Clay, S., and Devred, E.: Physical controls and ecological implications of the timing of the spring phytoplankton bloom on the Newfoundland and Labrador shelf, Limnol. Oceanogr. Lett., 9, 191–198, https://doi.org/10.1002/lol2.10347, 2024a.
Cyr, F., Coyne, J., Snook, S., Bishop, C., Galbraith, P. S., Chen, N., and Han, G.: Physical Oceanographic Conditions on the Newfoundland and Labrador Shelf during 2023, Can. Tech. Rep. Hydrogr. Ocean Sci., 382, iv + 54 pp., ISBN 978-0-660-72810-0, 2024b.
Cyr, F., Adamack, A. T., Bélanger, D., Koen-Alonso, M., Mullowney, D., Murphy, H., Regular, P., and Pepin, P.: Environmental control on the productivity of a heavily fished ecosystem, Nat. Commun.,16, 5277, https://doi.org/10.1038/s41467-025-60453-6, 2025.
Denaxa, D., Korres, G., Bonino, G., Masina, S., and Hatzaki, M.: The role of air–sea heat flux for marine heatwaves in the Mediterranean Sea, in: 8th edition of the Copernicus Ocean State Report (OSR8), edited by: von Schuckmann, K., Moreira, L., Grégoire, M., Marcos, M., Staneva, J., Brasseur, P., Garric, G., Lionello, P., Karstensen, J., and Neukermans, G., Copernicus Publications, State Planet, 4-osr8, 11, https://doi.org/10.5194/sp-4-osr8-11-2024, 2024.
Drévillon, M., Fernandez, E., and Lellouche, J. M.: EU Copernicus Marine Service Product User Manual for the Global Ocean Physics Reanalysis, GLOBAL_MULTIYEAR_PHY_001_030, Issue 1.5, Mercator Ocean International, https://catalogue.marine.copernicus.eu/documents/PUM/CMEMS-GLO-PUM-001-030.pdf (last access: 19 March 2024), 2023a.
Drévillon, M., Lellouche, J. M., Régnier, C., Garric, G., Bricaud, C., Hernandez, O., and Bourdallé-Badie, R.: EU Copernicus Marine Service Quality Information Document for the Global Ocean Physics Reanalysis, GLOBAL_MULTIYEAR_PHY_001_030, Issue 1.6, Mercator Ocean International, https://catalogue.marine.copernicus.eu/documents/QUID/CMEMS-GLO-QUID-001-030.pdf (last access: 19 March 2024), 2023b.
Edwing, K., Wu, Z., Lu, W., Li, X., Cai, W.-J., and Yan, X.-H.: Impact of Marine Heatwaves on Air-Sea CO2 Flux Along the US East Coast, Geophys. Res. Lett., 51, e2023GL105363, https://doi.org/10.1029/2023GL105363, 2024.
E.U. Copernicus Marine Service Information (CMEMS): Global Ocean Physics Reanalysis, Marine Data Store (MDS) [data set], https://doi.org/10.48670/moi-00021, 2024.
Fratantoni, P. S. and Pickart, R. S.: The western North Atlantic shelfbreak current system in summer, J. Phys. Oceanogr., 37, 2509–2533, https://doi.org/10.1175/JPO3123.1, 2007.
Frölicher, T. L. and Laufkötter, C.: Emerging risks from marine heat waves, Nat. Commun., 9, 650, https://doi.org/10.1038/s41467-018-03163-6, 2018.
Galbraith, P. S., Blais, M., Lizotte, M., Cyr, F., Bélanger, D., Casault, B., Clay, S., Layton, C., Starr, M., Chassé, J., Azetsu-Scott, K., Coyne, J., Devred, E., Gabriel, C.-E., Johnson, C. L., Maillet, G., Pepin, P., Plourde, S., Ringuette, M., and Shaw, J.-L.: Oceanographic conditions in the Atlantic zone in 2023, Can. Tech. Rep. Hydro. and Ocean Sci., 379, v + 39 pp., ISBN 978-0-660-72620-5, 2024.
Geoffroy, M., Bouchard, C, Flores, H., Robert, D., Gjøsæter, H., Hoover, C., Hop, H., Hussey, N. E., Nahrgang, J., Steiner, N., Bender, M., Berge, J., Castellani, G., Chernova, N., Copeman, L., David, C. L., Deary, A., Divoky, G., Dolgov, A. V., Duffy-Anderson, J., Dupont, N., Durant, J. M., Elliott, K., Gauthier, S., Goldstein, E. D., Gradinger, R., Hedges, K., Herbig, J., Laurel, B., Loseto, L., Maes, S., Mark, F. C., Mosbech, A., Pedro, S., Pettitt-Wade, H., Prokopchuk, I., Renaud, P. E., Schembri, S., Vestfals, C., and Walkusz, W.: The circumpolar impacts of climate change and anthropogenic stressors on Arctic cod (Boreogadus saida) and its ecosystem, Elem. Sci. Anth., 11, 00097, https://doi.org/10.1525/elementa.2022.00097, 2023.
Han, G., Ma Z., and Chen, N.: Ocean climate variability off Newfoundland and Labrador over 1979–2010: A modelling approach, Ocean Model., 144, 101505, https://doi.org/10.1016/j.ocemod.2019.101505, 2019.
Hersbach, H., Bell, B., Berrisford, P., Hirahara, S., Horányi, A., Muñoz-Sabater, J., Nicolas, J., Peubey, C., Radu, R., Schepers, D., Simmons, A., Soci, C., Abdalla, S., Abellan, X., Balsamo, G., Bechtold, P., Biavati, G., Bidlot, J., Bonavita, M., De Chiara, G., Dahlgren, P., Dee, D., Diamantakis, M., Dragani, R., Flemming, J., Forbes, R., Fuentes, M., Geer, A., Haimberger, L., Healy, S., Hogan, R. J., Hólm, E., Janisková, M., Keeley, S., Laloyaux, P., Lopez, P., Lupu, C., Radnoti, G., de Rosnay, P., Rozum, I., Vamborg, F., Villaume, S., and Thépaut, J.-N.: The ERA5 global reanalysis, Q. J. Roy. Meteor. Soc., 146, 1999–2049, https://doi.org/10.1002/qj.3803, 2020.
Hersbach, H., Bell, B., Berrisford, P., Biavati, G., Horányi, A., Muñoz Sabater, J., Nicolas, J., Peubey, C., Radu, R., Rozum, I., Schepers, D., Simmons, A., Soci, C., Dee, D., and Thépaut, J.-N.: ERA5 hourly data on single levels from 1940 to present, Copernicus Climate Change Service (C3S) Climate Data Store (CDS) [data set], https://doi.org/10.24381/cds.adbb2d47, 2023.
Hobday, A. J., Alexander, L. V., Perkins, S. E., Smale, D. A., Straub, S. C., Oliver, E. C. J., Benthuysen, J. A., Burrows, M. T., Donat, M. G., Feng, M., Holbrook, N. J., Moore, P. J., Scannell, H. A., Sen Gupta, A., and Wernberg, T.: A hierarchical approach to defining marine heatwaves, Prog. Oceanogr., 141, 227–238, https://doi.org/10.1016/j.pocean.2015.12.014, 2016.
Hobday, A. J., Oliver, E. C. J., Sen Gupta, A., Benthuysen, J. A., Burrows, M. T., Donat, M. G., Holbrook, N. J., Moore, P. J., Thomsen, M. S., Wernberg, T., and Smale, D. A.: Categorizing and naming marine heatwaves, Oceanography, 31, 162–173, https://doi.org/10.5670/oceanog.2018.205, 2018.
IPCC: IPCC Special Report on the Ocean and Cryosphere in a Changing Climate, edited by: Pörtner, H.-O., Roberts, D. C., Masson-Delmotte, V., Zhai, P., Tignor, M., Poloczanska, E., Mintenbeck, K., Alegría, A., Nicolai, M., Okem, A., Petzold, J., Rama, B., and Weyer, N. M., Cambridge University Press, Cambridge, UK and New York, NY, USA, 755 pp., https://doi.org/10.1017/9781009157964, 2019.
IPCC: Climate Change 2023: Synthesis Report. Contribution of Working Groups I, II and III to the Sixth Assessment Report of the Intergovernmental Panel on Climate Change, edited by: Core Writing Team, Lee, H., and Romero, J., IPCC, Geneva, Switzerland, 35–115, https://doi.org/10.59327/IPCC/AR6-9789291691647, 2023.
Jutras, M., Dufour, C. O., Mucci, A., and Talbot, L. C.: Large-scale control of the retroflection of the Labrador Current, Nat. Commun., 14, 2623, https://doi.org/10.1038/s41467-023-38321-y, 2023.
Lazier, J. R. N. and Wright, D. G.: Annual velocity variations in the Labrador Current, J. Phys. Oceanogr., 23, 659–678, https://doi.org/10.1175/1520-0485(1993)023<0659:AVVITL>2.0.CO;2, 1993.
Le Grix, N., Zscheischler, J., Laufkötter, C., Rousseaux, C. S., and Frölicher, T. L.: Compound high-temperature and low-chlorophyll extremes in the ocean over the satellite period, Biogeosciences, 18, 2119–2137, https://doi.org/10.5194/bg-18-2119-2021, 2021.
Lellouche, J.-M., Grenier, E., Bourdallé-Badie, R., Garric, G., Melet, A., Drévillon, M., Bricaud, C., Hamon, M., Le Galloudec, O., Regnier, C., Candela, T., Testut, C.-E., Gasparin, R., Ruggiero, G., Benkiran, M., Drillet, R., and Le Traon, P.-Y.: The Copernicus Global ° Oceanic and Sea Ice GLORYS12 Reanalysis, Front. Earth Sci., 9, 698876, https://doi.org/10.3389/feart.2021.698876, 2021.
McAdam, R., Masina, S., and Gualdi, S.: Seasonal forecasting of subsurface marine heatwaves, Commun. Earth Environ., 4, 225, https://doi.org/10.1038/s43247-023-00892-5, 2023.
McDougall, T. J. and Barker, P. M.: Getting started with TEOS-10 and the Gibbs Seawater (GSW) Oceanographic Toolbox, SCOR/IAPSO WG127, 28 pp., ISBN 978-0-646-55621-5, 2011.
McDougall, T. J., Barker, P. M., Holmes, R. M., Pawlowicz, R., Griffies, S. M., and Durack, P. J.: The interpretation of temperature and salinity variables in numerical ocean model output and the calculation of heat fluxes and heat content, Geosci. Model Dev., 14, 6445–6466, https://doi.org/10.5194/gmd-14-6445-2021, 2021.
Met Office: Cartopy: a cartographic python library with a Matplotlib interface, Exeter, Devon, https://scitools.org.uk/cartopy (last access: January 2025), 2010–2015.
NOAA National Centers for Environmental Information: ETOPO 2022 15 Arc-Second Global Relief Model, NOAA National Centers for Environmental Information, https://doi.org/10.25921/fd45-gt74, 2022.
Oliver, E. C. J., Donat, M. G., Burrows, M.T., Moore, P. J., Smale, D. A., Alexander, L. V., Benthuysen, J. A., Feng, M., Sen Gupta, A., Hobday, A. J., Holbrook, N. J., Perkins-Kirkpatrick, S. E., Scannell, H. A., Straub, S. C., and Wernberg, T.: Longer and more frequent marine heatwaves over the past century, Nat. Commun., 9, 1324, https://doi.org/10.1038/s41467-018-03732-9, 2018.
Oliver, E. C. J., Benthuysen, J. A., Darmaraki, S., Donat, M. G., Hobday, A. J., Holbrook, N. J., Schlegel, R. W., and Sen Gupta, A.: Marine heatwaves, Annu. Rev. Mar. Sci., 13, 313–342, https://doi.org/10.1146/annurev-marine-032720-095144, 2021.
Open Government: Ecosystem Production Units in the Northwest Atlantic, Government of Canada, https://open.canada.ca/data/en/dataset/9a515ef8-0e2a-479e-9b25-55658eae30be (last access: 15 February 2024), 2014.
Pepin, P., Higdon, J., Koen-Alonso, M., Fogarty, M., and Ollerhead, N.: Application of ecoregion analysis to the identification of Ecosystem Production Units (EPUs) in the NAFO Convention Area, NAFO Sci. Counc. Res. Doc, 14/069, no. N6412, https://www.nafo.int/Portals/0/PDFs/sc/2014/scr14-069.pdf (last access: July 2025), 2014.
Perez, E., Ryan, S., Andres, M., Gawarkiewicz, G., Ummenhofer, C. C., Bane, J., and Haines, S.: Understanding physical drivers of the 2015/16 marine heatwaves in the Northwest Atlantic, Sci. Rep., 11, 17623, https://doi.org/10.1038/s41598-021-97012-0, 2021.
Petrie, B.: Does the north Atlantic oscillation affect hydrographic properties on the Canadian Atlantic continental shelf?, Atmos.-Ocean, 45, 141–151, https://doi.org/10.3137/ao.450302, 2007.
Poitevin, P., Thébault, J., Siebert, V., Donnet, S., Archambault, P., Doré, J., Chauvaud, L., and Lazure, P.: Growth Response of Arctica Islandica to North Atlantic Oceanographic Conditions Since 1850, Front. Mar. Sci., 6, 483, https://doi.org/10.3389/fmars.2019.00483, 2019.
Reyes-Mendoza, O., Manta, G., and Carrillo, L.: Marine heatwaves and marine cold-spells on the Yucatan Shelf-break upwelling region, Cont. Shelf Res., 239, 104707, https://doi.org/10.1016/j.csr.2022.104707, 2022.
Richaud, B., Hu, X., Darmaraki, S., Fennel, K., Lu, Y., and Oliver, E. C. J.: Drivers of marine heatwaves in the Arctic Ocean, J. Geophy. Res-Oceans, 129, e2023JC020324, https://doi.org/10.1029/2023JC020324, 2024.
Schlegel, R. W., Oliver, E. C. J., and Chen, K.: Drivers of Marine Heatwaves in the Northwest Atlantic: The Role of Air–Sea Interaction During Onset and Decline, Front. Mar. Sci., 8, 627970, https://doi.org/10.3389/fmars.2021.627970, 2021.
Sims, L. D., Subrahmanyam, B., and Trott, C. B.: Ocean–Atmosphere Variability in the Northwest Atlantic Ocean during Active Marine Heatwave Years, Remote Sens., 14, 2913, https://doi.org/10.3390/rs14122913, 2022.
Smith, K. E., Burrows, M. T., Hobday, A. J., G. King, N. G., Moore, P. J., Sen Gupta, Thomsen, M., S., Wernberg, T., and Smale, D. A.: Biological impacts of marine heatwaves, Annu. Rev. Mar. Sci., 15, 119–145, https://doi.org/10.1146/annurev-marine-032122-121437, 2023.
Sun, W., Wang, Y., Yang, Y., Yang, J., Ji, J., and Dong, C.: Marine heatwaves/cold-spells associated with mixed layer depth variation globally, Geophy. Res. Lett., 51, e2024GL112325, https://doi.org/10.1029/2024GL112325, 2024.
Templeman, N. D.: Ecosystem Status and Trends Report for the Newfoundland and Labrador Shelf. DFO Can. Sci. Advis. Sec. Res. Doc. 2010/026, vi + 72 pp., 2010.
Therriault, J.-C., Petrie, B., Pepin, P., Gagnon, J., Gregory, D., Helbig, J., Herman, A., Lefaivre, D., Mitchel, M., Pelchat, B., Runge, J., and Sameoto, D.: Proposal for a Northwest Atlantic Zonal Monitoring Program, Can. Tech. Rep. Hydro. and Ocean Sci., 194, vii + 57 pp., 1998.
Urrego-Blanco, J. and Sheng, J.: Interannual Variability of the Circulation over the Eastern Canadian Shelf, Atmos.-Ocean, 50, 277–300, https://doi.org/10.1080/07055900.2012.680430, 2012.
Wang, Q., Danilov, S., and Jung, T.: Arctic freshwater anomaly transiting to the North Atlantic delayed within a buffer zone, Nat. Geosci. 17, 1218–1221, https://doi.org/10.1038/s41561-024-01592-1, 2024.
World Meteorological Organization: WMO guidelines on the calculation of climate normals, Tech. rep., Geneva, Switzerland, ISBN 978-92-63-11203-3, 2017.
Wu, Y., Peterson, I. K., Tang, C. C. L., Platt, T., Sathyendranath, S., and Fuentes-Yaco, C.: The impact of sea ice on the initiation of the spring bloom on the Newfoundland and Labrador Shelves, J. Plankton Res., 29, 509–514, https://doi.org/10.1093/plankt/fbm035, 2007.
Yashayaev, I.: Intensification and shutdown of deep convection in the Labrador Sea were caused by changes in atmospheric and freshwater dynamics. Commun. Earth Environ., 5, 156, https://doi.org/10.1038/s43247-024-01296-9, 2024.