the Creative Commons Attribution 4.0 License.
the Creative Commons Attribution 4.0 License.
 | 30 Sep 2025 | OSR9 | Chapter 4.1
The 2023 marine heatwave in the North Atlantic tropical ocean
Amélie Loubet
Simon J. van Gennip
Romain Bourdallé-Badie
Marie Drevillon
In the context of climate change, marine heatwaves (MHWs) are becoming more intense and frequent and/or lasting longer. During the year 2023 and based on the Copernicus Marine forecasting system, the Mercator Ocean International MHW bulletin (https://www.mercator-ocean.eu/ocean-intelligence/ocean-bulletins-and-insights/marine-heatwaves-archive/, last access: 14 May 2025) highlighted week after week a MHW event occurring in the North Atlantic (NA) tropical ocean. In this paper, we propose a 4D characterisation of this event using the Copernicus Marine global reanalyses. We demonstrate how this 2023 MHW event in the NA tropical ocean is extraordinary compared to previous years. All indices commonly used for characterising MHWs (intensity, duration, total activity and area) reached values not observed before at the surface but also in the subsurface. The timing of the event and its vertical structure differ across the basin, with the MHW developing first in the north-east, with peaks of intensity in May and progressively moving south-westward across the basin. A characterisation of MHWs at all vertical levels reveals that the vertical structure differs across subregions with different processes at play: in the eastern and subtropical centre of the gyre heat propagates from the surface to the subsurface, spanning beyond the mixed layer depth, whereas in the Caribbean region, abnormally warm waters at depth are transported from remote equatorial regions by eddies traversing the area.
- Article
(4481 KB) - Full-text XML
- BibTeX
- EndNote


The year 2023 was the warmest year on record, with annual average global atmospheric temperature reaching 1.43 ± 0.11 °C above pre-industrial levels (Forster et al., 2024). Air temperature records were broken for multiple months and regions (WMO, 2024). Europe and the subtropical North Atlantic (NA) region were particularly affected, with the highest recorded air temperature anomalies (ESOTC, 2024). Abnormally high temperature anomalies have also been detected at the surface of the ocean consistently across products (observation, forecasting system, reanalysis) in the NA, where mean temperature estimates have exceeded those of previous years (Copernicus, 2024). A direct result of this warming ocean is the increase in the occurrence of extreme warm events.
When abnormally high ocean temperatures occur for a sustained period of time, it leads to an extreme event referred to in the literature as marine heatwaves (MHWs). A MHW definition was proposed by Hobday at al. (2016, 2018), which has enabled MHW characteristics such as MHW duration, intensity and extent to be documented in a standardised manner on a global scale. MHW frequency increased between 1925–2016 (Oliver et al., 2018) and will keep on increasing due to anthropogenic forcing (Frölicher et al., 2018; Oliver et al., 2019). MHWs threaten marine ecosystems, causing harm from a species to an ecosystem level, such as coral bleaching, reduction of habitat-forming seaweed, harmful algal blooms, species range shift and mass mortality events (Le Nohaïc et al., 2017; Wernberg et al., 2013, 2016; Smith et al., 2023; Cavole et al., 2016).
The regular monitoring of MHW conditions globally (Mercator Ocean International weekly bulletin: https://www.mercator-ocean.eu/ocean-intelligence/ocean-bulletins-and-insights/marine-heatwaves-archive/) revealed the prolonged presence across the year of an MHW event within the North Atlantic basin (NA). Studies documenting MHWs in the NA have only been local to regional, with no records of such widespread events occurring (Frölicher and Laufkötter, 2018; Smith et al., 2021; Zhang et al., 2023). Furthermore, MHWs have been well studied for the surface where long satellite records exist, but their subsurface extent should be considered in more details (Schaeffer et al., 2023). Their vertical structure has been studied using in situ data (Elzahaby and Schaeffer, 2019, 2021; Zhang et al., 2023; Juza et al., 2022; Pirro et al., 2024). Alternative approaches consist of the use of numerical models (Darmaraki et al., 2019; Sun et al., 2023), which provide a continuous complete 3-dimensional ocean state. In this study, we decided to use an eddy-resolving ocean reanalysis (ocean models that use data assimilation) at daily resolution, covering a sufficiently long period to build a 30-year-long reliable climatology, as advised by the World Meteorological Organisation (WMO) (WMO, 2018; Hobday et al., 2016, 2018). The regular update of such a product so that it stays close to real time enables the study of recent events and the assessment of their characteristics relative to previous years.
We propose a 4-dimensional description (3D + time) of the ocean temperature extreme event of 2023 in the NA tropical ocean using the temperature field of the Copernicus Marine Service GLORYS12V1 reanalysis product (Lellouche et al., 2021), to which Hobday's MHW algorithm has been applied (Hobday at al., 2016, 2018). After the method description in Sect. 2, we propose, in Sect. 3, a characterisation of the 2023 event in the NA tropical ocean, from the surface to the subsurface. Conclusions and perspectives are given in Sect. 4.
2.1 Datasets
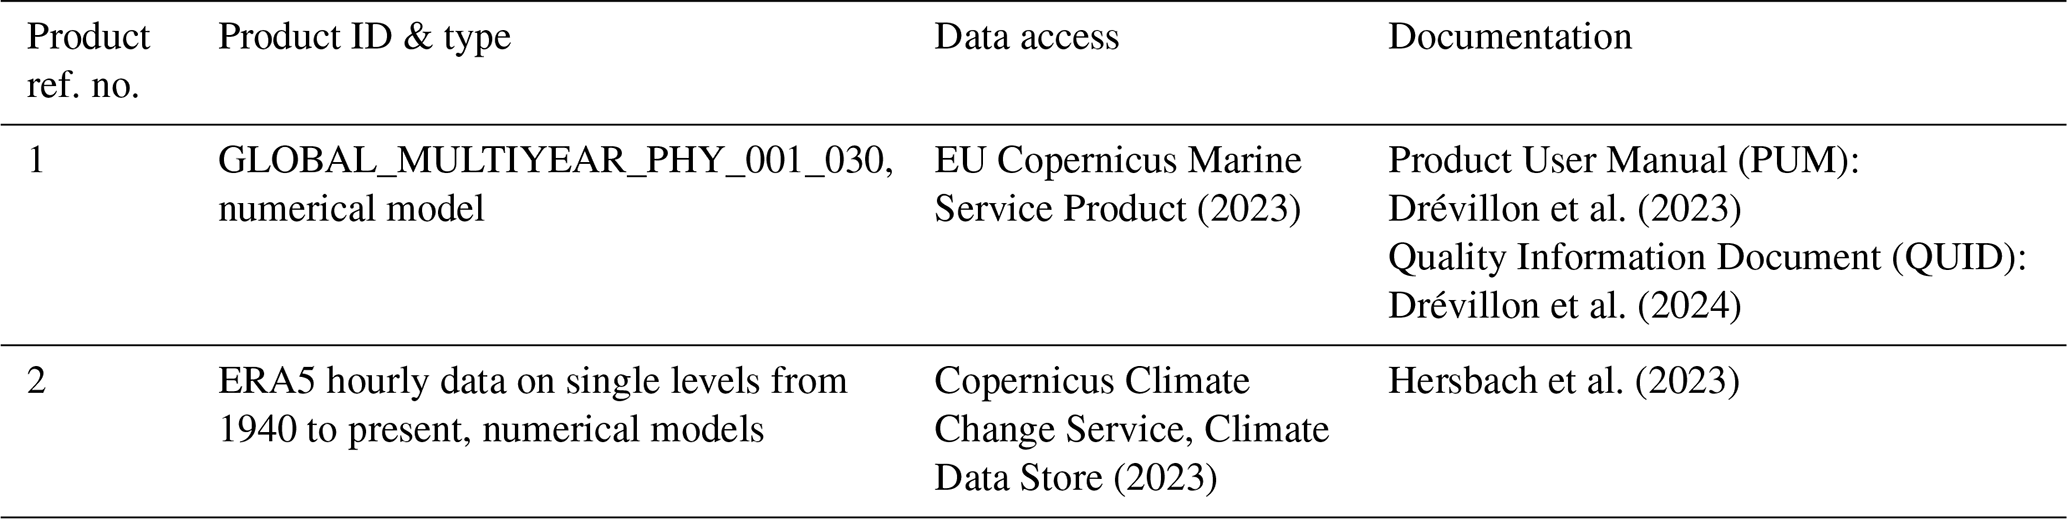
The main product used for this study is the GLOBAL_MULTIYEAR_PHY_001_030 reanalysis distributed by Copernicus Marine Service (product ref. no. 01; Table 1). This reanalysis is developed from the NEMO global ocean model, with a horizontal resolution of ° (9 km at the Equator and 2 km close to the poles) and with 50 vertical levels where observational products are assimilated using a reduced-order Kalman filter. Along-track altimeter data (sea level anomaly), satellite sea surface temperature, sea ice concentration, and in situ temperature and salinity vertical profiles are jointly assimilated. Moreover, a 3D-VAR scheme provides a correction for the slowly evolving large-scale biases in temperature and salinity. This reanalysis covers the period 1993 onward. It was driven by the ERA Interim atmospheric fluxes from 1993 to 2019 and ERA5 thereafter. A more detailed description and study is proposed by Lellouche et al. (2021). The use of ocean reanalysis makes it possible to both study surface MHWs and compare the results with other satellite datasets but also to gain insight in their vertical structure. This reanalysis is particularly well suited to the study of near-surface phenomena due to its refined vertical discretisation in the first 50 m of the ocean (first 18 layers of the reanalysis). In this study we calculated a 30-year 3D daily climatology of temperature using the baseline period 1993–2022 and used the data from the year 2023 to characterise MHWs in the NA tropical ocean.
2.2 Characterisation of marine heatwaves
MHWs are prolonged periods of abnormally high seawater temperature. We identified an MHW event as a period of at least 5 consecutive days where the temperature exceeds the 90th percentile of a 30-year climatology, following the recommendations by Hobday et al. (2016). The 90th percentile and the mean temperature climatology were smoothed using a 31 d moving window to reduce high-frequency noise while detecting MHWs. First, we detected MHWs for the surface layer in 2023 using this definition to characterise the studied event. Then, we detected surface MHWs from 1993 to 2022 in order to compare the MHW characteristics over the climatology period. Additionally, we detected 2023 MHWs from the surface to 2225 m depth (the first 41 depth layers of the reanalysis) to investigate subsurface MHW signatures for this particular year.
The detected MHWs were characterised using common metrics such as duration (number of consecutive days above the 90th percentile threshold), intensity and intensity-based category (moderate, strong, severe and extreme) (Hobday et al., 2016, 2018). Note that depending on the method, MHW intensity is defined either by the temperature anomaly relative to the mean climatology (Hobday et al., 2016; Oliver et al., 2018) or relative to the threshold (Darmaraki et al., 2019; Juza et al., 2022). Here, to focus on the study of extremes, we define MHW intensity as the temperature anomaly relative to the 90th percentile threshold. We also calculated the annual surface MHW activity (from 1993 to 2023) following the definition by Simon et al. (2022):
where “event” refers to a specific MHW event, “year” refers to a specific year, (in °C) is the temperature anomaly during the event averaged over its duration, devent ⊂ year (in days) is the event duration within the specific year and Sevent (in km2) is the spatial extent of the event. Here we calculated activity for each grid cell, so Sevent is the surface of the grid cell. Then we averaged the activity over the studied area to get the annual spatial mean activity (in °C d km2).
We defined the studied area to focus on regions with long-lasting and intense MHWs, choosing the Atlantic from 10° S to 50° N. We divided the study area into coherent subregions following the definition of the Longhurst biogeochemical provinces (Reygondeau et al., 2013; Longhurst, 2007; shapefile from Flanders Marine Institute, 2009). Based on the highest mean activity regions for 2023 (not shown), we focused on the provinces denoted North Atlantic Subtropical Gyral Province (east) (NASE), North Atlantic Tropical Gyral Province (NATR) and Caribbean Province (CARB) (Fig. 2).
For time series, we spatially averaged the daily MHW intensity and the mixed layer depth (MLD) over each chosen Longhurst province. To generate the mean vertical MHW intensity profiles for a given province, we first temporally averaged the daily MHW intensity (using MHW days only) for each grid cell in the province at each depth; then, we spatially averaged the temporal mean values across all grid cell within the province, at each depth. We thus obtained one spatiotemporally averaged intensity vertical profile in the given province. We computed the standard deviation of the spatial mean, which provides insight into the degree of variability or spatial inhomogeneity across the province at each depth. For each province we estimated the MLD by averaging the MLD data distributed by GLOBAL_MULTIYEAR_PHY_001_030 first temporally (over 2023) and then spatially (over each province).
For horizontal Hovmöller diagrams, daily intensities were spatially selected using a mask with the three provinces of focus and then averaged across latitudes. Thus, when regions overlap in longitude (for instance NASE and NATR), data from both regions are averaged together. This method was used to generate Hovmöller diagrams for different depth. For the depth–time Hovmöller diagram, MHW intensity was selected using a mask of the specific region and then averaged over latitude and longitude.
2.3 Atmospheric variables
Using ERA5 reanalysis air temperature (TAIR) and 10 m wind (U10) data, we computed 2023 anomalies based on 30-year climatologies (1993–2022) to match the sea temperature climatology baseline (used to detect MHWs) (product ref. no. 02; Table 1). The air temperature anomaly (TAIR − TAIRclim) was then smoothed over a 7 d window. For the wind at 10 m, we calculated the anomaly of the absolute values ( to focus on anomalies of intensity and not of direction. Then the anomaly was averaged over 2023.
Daily air temperature anomaly was averaged over latitude and used to generate a Hovmöller diagram (using the same method than for MHW intensity Hovmöller diagrams; see Sect. 2.2).
3.1 An event of unprecedented characteristics at the surface
During the year 2023 an MHW event of extraordinary characteristics occurred in the NA tropical ocean, impacting the entire ocean region between 10° S and 50° N (Fig. 1a). The event developed in March, covering ∼ 20 % of the region predominantly in moderate conditions, to progressively peak from August to mid-October gaining in both extent and intensity occupying over 60 % of the area, with strong and higher categories progressively accounting for nearly 60 % of the MHW surface by mid-October (43.5 % for strong, 14.8 % for severe and 1.1 % for extreme on 15 October). A decrease in extent occurred in October and in December, with a small increase in November in between (Fig. 1b).
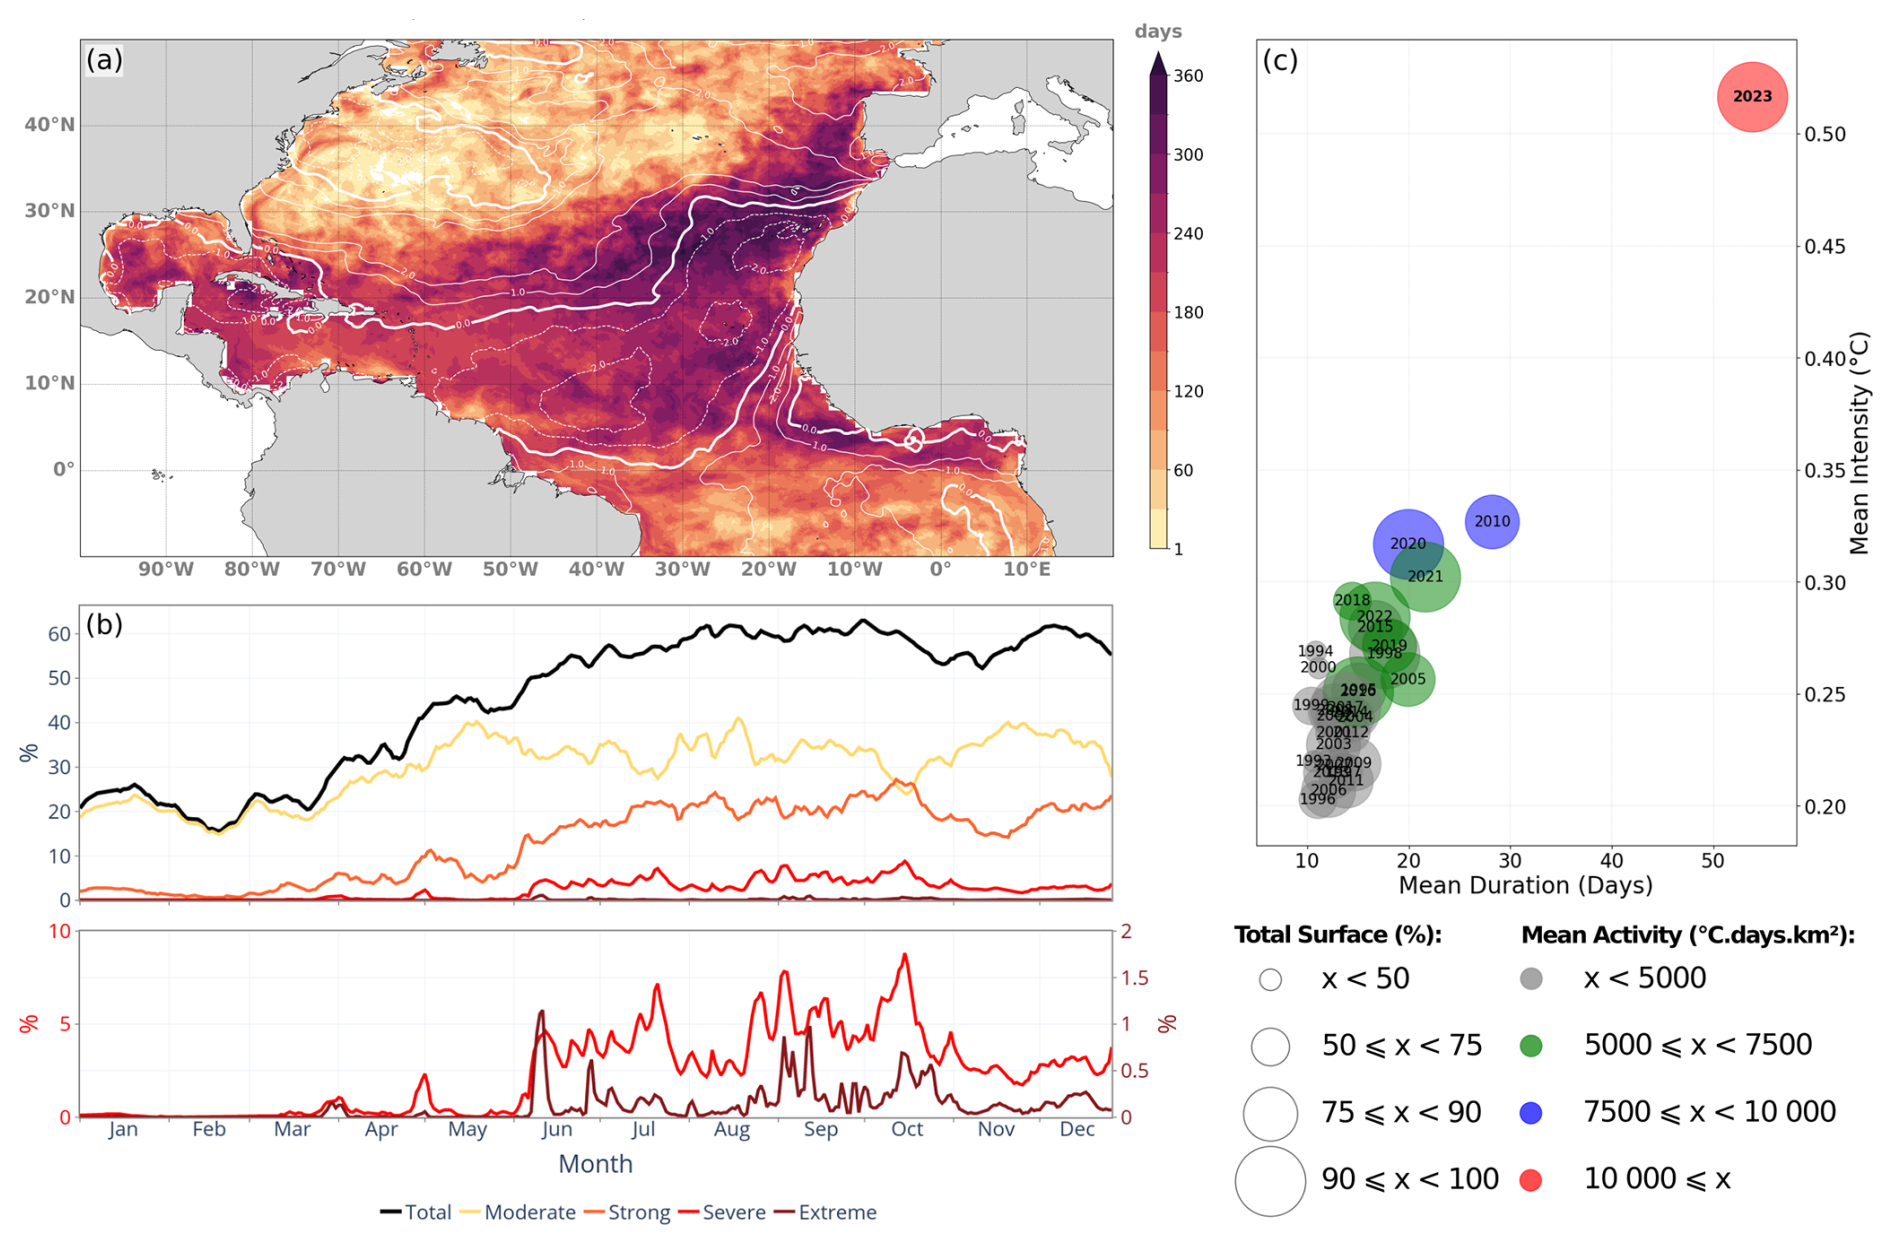
Figure 1Characteristics of the marine heatwave hitting the North Atlantic across 2023 between 10° S and 50° N: total number of heatwave days (a); evolution of the total area and area by category affected by MHW events (b); and representation of the MHW event for 2023 in terms of mean duration, intensity, maximum coverage (bubble size) and activity (coloured bubble) relative to previous years (c). White contours in panel (a) refers to the annual mean of absolute wind anomaly (m s−1).
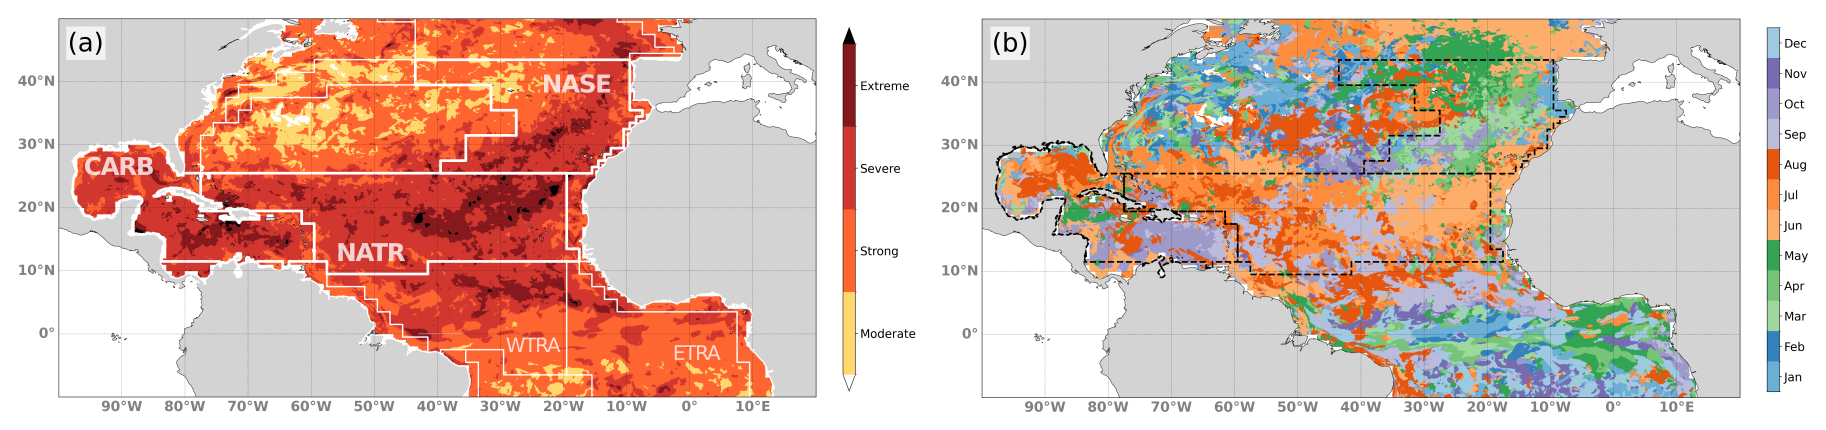
Figure 2Highest marine heatwave category reached in 2023 (a) and month during which the highest category first occurred (b). Zones delimited in white in panel (a) and black in panel (b) refer to the Longhurst biogeochemical provinces.
Overall, nearly the entire area (> 99 %) has been in MHW conditions at some point across the year, with such conditions going beyond moderate in terms of category (Fig. 2a). Indeed, only 8.3 % of the region was exposed to moderate-only events during the year, and this corresponds to regions in the vicinity of the Gulf Stream and its extension. In total, 40.2 % of the region has been exposed to a maximum level of the category strong, 40.7 % of the category severe, and 10.8 % of the category extreme and beyond. The most intense events span the Iberian Peninsula, the eastern side of the basin and the Caribbean region. It is noteworthy that the regions with most intense MHW events (Fig. 2a) coincide with regions with the highest number of marine heatwave days (long-lasting MHW areas of Fig. 1a); for instance, the region between 15 and 35° N spanning the east of the African coast until 40° W and the one close to Hispaniola island in the Caribbean region.
In terms of duration, a large proportion (19.9 % of the study region, mostly constrained within the triangle formed by the Iberian Peninsula, western Africa and the Caribbean region) was in MHW conditions for more than 250 d during the year (Fig. 1a). Most notably, the region off the coast of Morocco was exposed to more than 300 MHW days. The Gulf Stream region was more moderately impacted, with around 100 MHW days over the year 2023.
The year 2023 is characterised by an unprecedented MHW event outstanding in all indices commonly used to describe MHWs, with the highest mean daily intensity, mean duration, total surface exposed and mean activity (Fig. 1c). On average over a year, 2023 exceeds all previous years of the reanalysis product (1993–2022), with a mean duration of 54 d over the area, mean daily intensity of 0.52 °C and mean activity of 17 204 °C d km2 (Simon et al., 2022). No other year presents similar high values for a single one of these metrics (nor all three combined), underlining the extraordinary nature of the 2023 MHW event. Note that this extent corresponds to a strong negative anomaly in surface wind intensity (Fig. 1a).
The timing corresponding to the peak of the event in terms of MHW category (Fig. 2b) varied geographically, with the highest category first reached during springtime in the eastern part of the basin, then during July/August for the centre of the basin and during autumn for the western part.
3.2 Regional vertical structure of MHW
Beyond the extraordinary surface signature of the 2023 MHW event, we further investigate this event by characterising its vertical structure and evolution over time. For this, we divided the study area into physically coherent subregions as defined by Longhurst (Reygondeau et al., 2013; Longhurst, 2007) (Fig. 2a).
We focused on three subregions where intense and long MHW events occurred (Figs. 1a, 2a): the North Atlantic Subtropical Gyral Province (NASE), to the east of the basin; the North Atlantic Tropical Gyral Province (NATR), in the centre; and Caribbean Province (CARB) to the west. For each subregion, we computed the mean intensity depth profile and estimated the mean mixed layer depth (MLD) (see Methods).
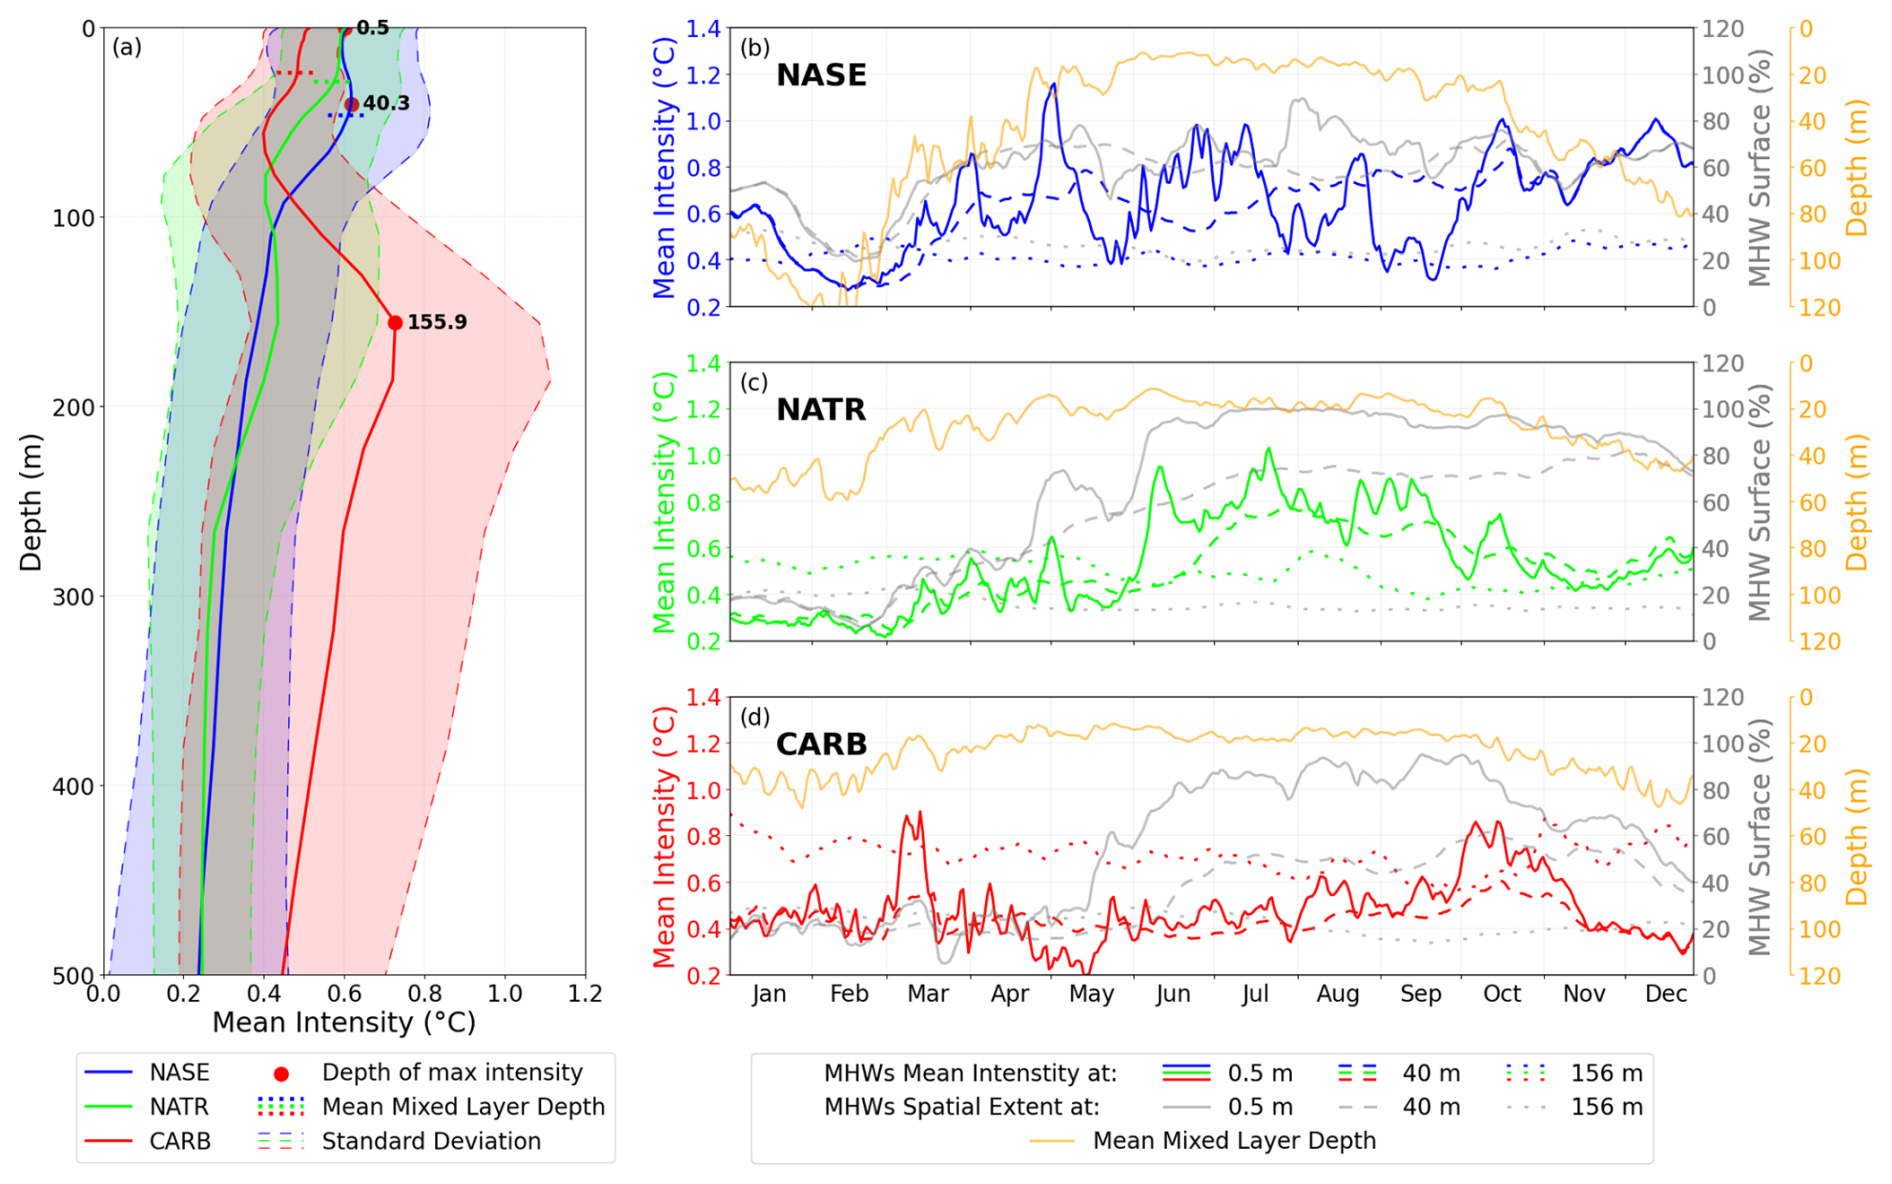
Figure 3Evolution of the intensity and spatial extent of the 2023 marine heatwave for different regions in the North Atlantic. Mean MHW intensity (in °C) profile (a) of NASE (blue), NATR (green) and CARB (red). Shaded areas represent standard deviations of spatial mean. Dotted horizontal lines represent the mean MLD, and red dots represent depth of highest mean intensity for each region. Time series of mean intensity (in °C), surface coverage (in %) and mean mixed layer depth (in m) in NASE (b), NATR (c) and CARB (d) provinces. Blue, green and red lines (NASE, NATR and CARB, respectively) represent the mean intensity at the surface (solid), at 40 m (dashed) and at 156 m (dotted). Grey lines represent the surface coverage at the surface (solid), at 40 m (dashed) and at 156 m (dotted). Orange lines represent the mean layer depth in the corresponding region.
The depth profile of MHW intensity is not identical across the basin, with significant differences across the region, most notably for the depth where the maximum intensity occurred (Fig. 3a). Intensity peaks at much deeper depth in the CARB region (max at 156 m, deeper than the mean MLD of 23.8 m represented by red dotted horizontal line) than for NASE and NATR regions. For NASE and NATR regions, maxima occur at 40 m and close to the surface, respectively, both within the mixed layer (MLD represented by blue and green dotted horizontal lines). The mean intensity profile of MHWs for NASE shows homogeneous levels across the mixed layer with slightly higher values at subsurface (40.3 m depth), at the bottom of the mixed layer. The NATR region shows a different MHW intensity profile than the NASE region, with a maximum in the surface layer. In addition, we notice from the standard deviation of the MHW intensity (shaded area) that spatial inhomogeneity is largest for the CARB region for depths between 150 and 400 m.
3.3 Evolution of MHW intensity and extent across depth
Further insight into MHW characteristics was obtained for each region by evaluating the evolution of intensity and spatial extent of the MHW at depths where maximum intensity occurred in each region (at the surface, 40 m and 156 m) (Fig. 3b, c and d).
At the surface, as observed in the month of highest MHW categories (Fig. 2b), later timing in the peak of MHW for the more westward regions is evidenced in the area-averaged intensity. Maximum intensity is reached earlier in the most eastern region, the NASE region (beginning of May), then in the NATR region (late July) and in the CARB region (October) (Fig. 3b solid blue line, Fig. 3c solid green line and Fig. 3d solid red lines). We also note a peak in March in the CARB region (lasting 10 d and reaching an intensity of 0.9 °C), which seems to be an isolated event and would require further investigation that is not done here.
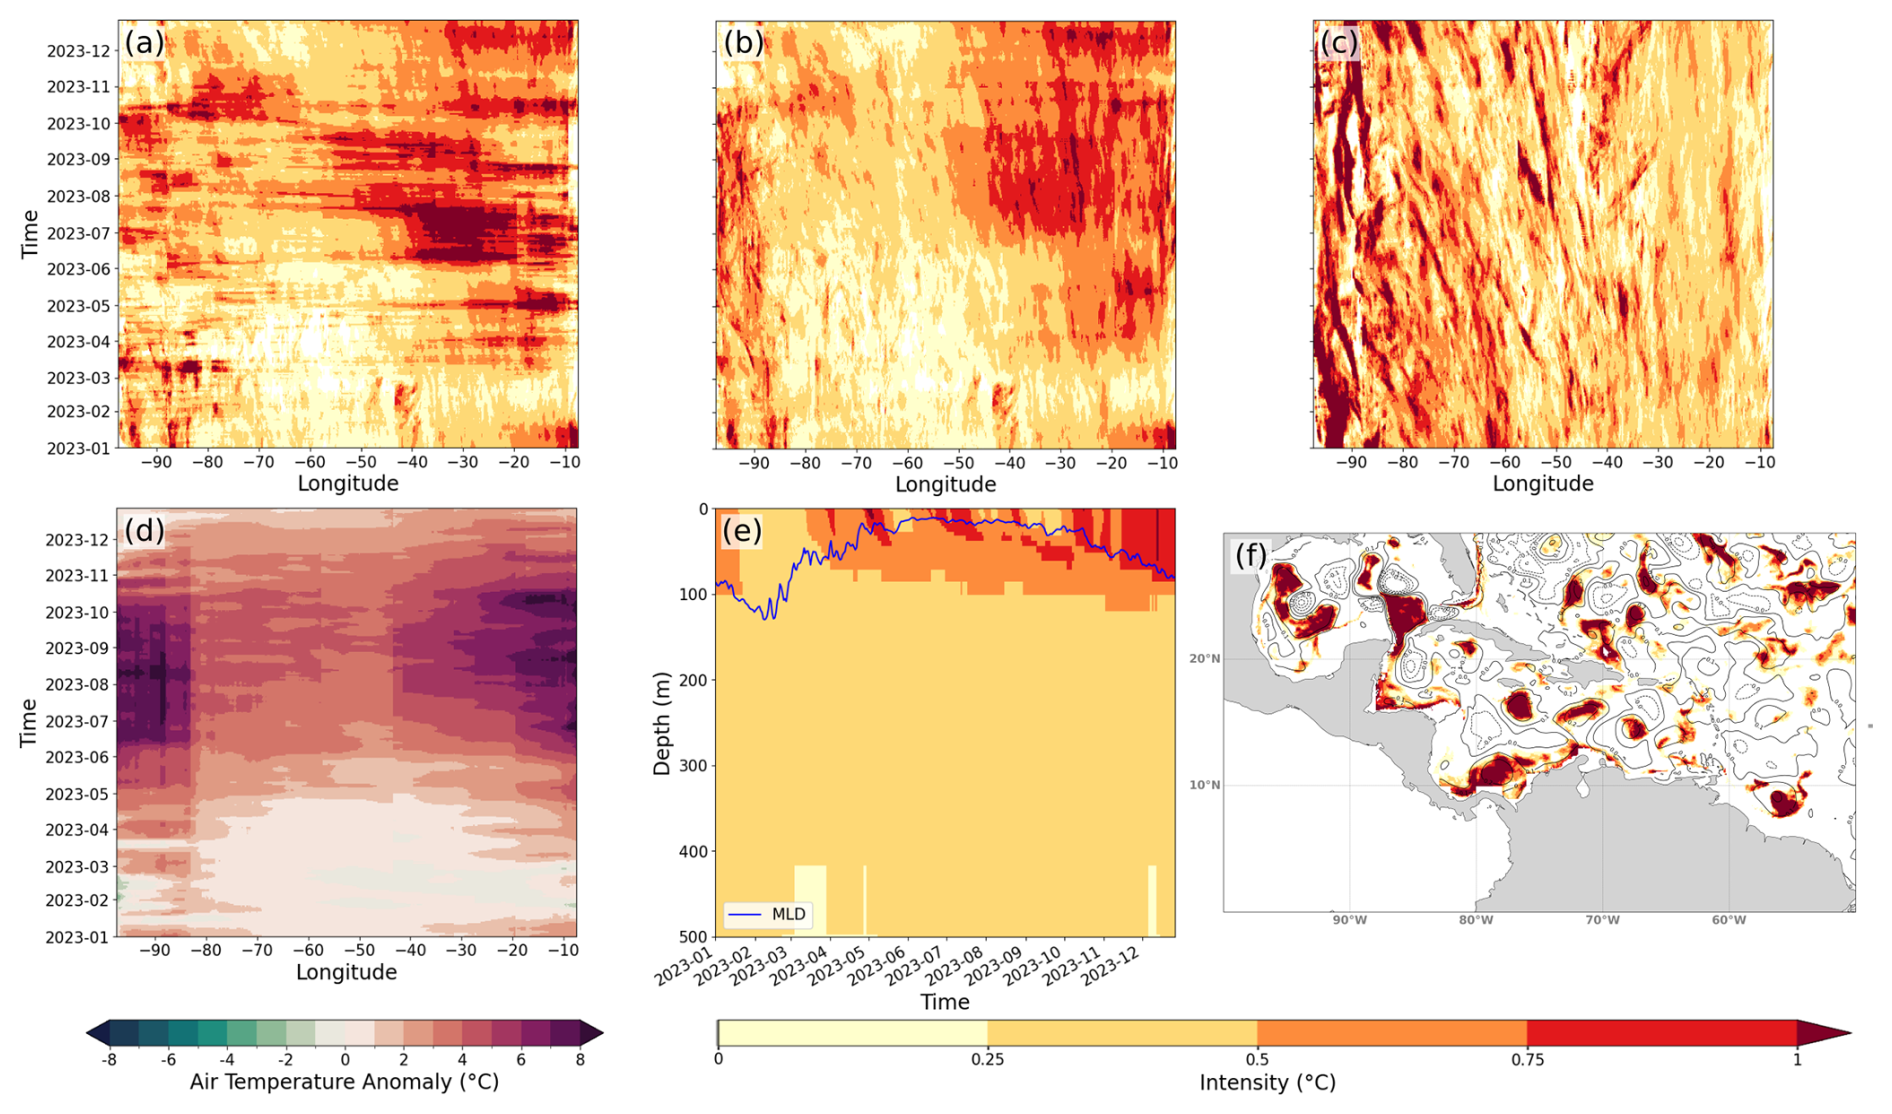
Figure 4Horizontal MHW and atmospheric characteristics evolution in NASE, NATR and CARB regions. Hovmöller diagrams of MHW intensity at the surface (a), at 40 m (b) and at 156 m (c) (data averaged over latitude); Hovmöller diagram of daily air temperature anomaly at 2 m smoothed over a 7 d window (d); depth–time Hovmöller diagram of intensity in NASE region (date averaged over latitude and longitude), where the blue line represents the average MLD over the region (e); and map of MHW intensity on 7 July 2023 at 156 m depth with SSH anomaly contours in black (f).
For the NASE region, the intensity at the surface shows large fluctuations across the year: in total, six maxima of intensity higher than 0.8 °C are observed, followed by low troughs (with differences of 0.3 to 0.8 °C relative to the peaks) (Fig. 3b, solid blue line). The intensity at 40 m depth – where the maximum occurs in the mean intensity depth profile – increases progressively from 0.3 °C in early March to a peak in mid-December at 1.0 °C (Fig. 3b, dashed blue line). In between, some variations exist, with smaller peaks in mid-May and mid-October (occurring shortly after the surface peaks). The MHW signature at the surface develops earlier than at the subsurface. It suggests that the signal propagates from the surface, across the water column to the subsurface and below the MLD (Fig. 3b, orange line). The increase in area occupied by MHWs in March, for both the surface and 40 m depth, coincides with the shoaling of the MLD (Fig. 3b, solid and dashed grey lines, orange line). The horizontal extent is similar for both depths, with values fluctuating around 70 % of the area from April to mid-October. We note that the intensity at the surface and at 40 m depth is equal during the winter period. This is linked to the deepening of the MLD to levels deeper than 40 m, which homogenise temperature (Fig. 3b, orange line). Unlike shallower depths, the intensity at 156 m remains stable around 0.4 °C across the year (Fig. 3b, dotted blue line). Extent is lower at 156 m depth, with values remaining between 20 % and 30 %. Note that, in between 40 and 156 m, surface warming propagates progressively at depth across the year. For instance, at 100 m depth, from February onwards, the intensity levels steadily increase from values of 0.29 to 0.61 °C by mid-November (see Fig. 4e).
The evolution of the mean intensity for NATR, at the surface and at depth, describes a different kind of MHW than for the NASE region (Fig. 3c, green lines). The MHW is characterised by one long temporal event – rather than a series of shorter events – that peaks at the end of July. At the surface, high intensity develops rapidly in early June and remains high until the end of September, with values constantly above 0.5 °C (Fig. 3c, solid green line). Horizontal extent of the MHW increases in two steps: first reaching ∼ 70 % at the end of April–May and then above 90 % from mid-June to November, to finally drop slightly below 80 % (Fig. 3c, solid grey line).
At 40 m depth, a rapid increase in intensity occurs later relative to the surface, starting at the end of May at 0.4 °C to reach a maximum of 0.77 °C by the end of July (Fig. 3c, dashed green line). Spatial extent increases progressively from ∼ 40 % coverage in April to above 80 % by the end of November (Fig. 3c, dashed grey line). These increases (in intensity and at surface) occur when the MLD is shallowest (about 20 m), meaning that the MHW reaches below the MLD (Fig. 3c, orange line). At 156 m depth, intensity levels vary across the year around 0.4–0.6 °C, and the horizontal extent of MHW remains low and stable (around 15 %–20 %) (Fig. 3c, dotted green and grey lines). This signal is decorrelated with what is observed for surface layers.
Dynamics for the CARB region differ with the NASE and NATR regions, with an MHW signal at both surface and depth (Fig. 3d). At the surface, a late and long-lasting peak of MHW intensity (larger than 0.6 °C for 30 d) occurs in October (peaks at 0.86 °C), after the observed peaks in the other two regions (Fig. 3b, c and d, coloured solid lines). At 40 m depth, intensity levels and fluctuations are similar to the surface, with lower magnitude and reduced high-frequency variations (Fig. 3d, red dashed line). Timing in the peaks in March and October shows a lag relative to the surface. MHW horizontal extent at the surface increases from mid-May (∼ 30 %) to a peak in late September (up to 95 % of the area) to then decrease by the end of the year (∼ 40 %) (solid grey line). A similar pattern can be seen at 40 m depth, with an increase in surface occurring later (mid-June) and peaking mid-October at ∼ 60 % to drop to ∼ 30 % by the end of the year (dashed grey line). Again, these similar features between the surface and 40 m depth happen with a MLD of about 20 m, suggesting that the MHW also propagates below the MLD in this region (Fig. 3d, orange line).
At 156 m depth – corresponding to the maximum intensity in the mean profile – unlike for the other two regions, intensity levels are higher than levels reached for shallower depths (dotted red line). The intensity remains stable throughout the year, ranging between 0.6 and 0.8 °C. It is higher than the intensity at shallower depth, except for May and October when surface MHWs develop. High levels of intensity are however not widespread across the subregion as the surface exposed to MHWs remains around 20 % across the year (dotted grey line). It is noteworthy that sub-monthly variations are present in the MHW intensity time series, suggestive of advective transient features like eddies crossing the domain.
3.4 MHW westward and vertical evolution
Analysis of MHW within the three subregions of the NA suggests that MHW surface signature propagates westward and at depth. To further investigate such dynamics and potential drivers, a 3-dimensional decomposition along longitude, depth and time of the MHW intensity field and its possible drivers is carried out. The evolution of MHW across the year and the studied regions is highlighted using Hovmöller diagrams of latitudinal averaged intensity over the three subregions at the three depths of maximum intensity (surface, 40 and 156 m) (see Methods, Fig. 4a, b and c).
For the surface, the strongest intensity (greater than 0.5 °C) takes place primarily in the eastern half of the region (between 60 and 10° W) and during the months of May to December (Fig. 4a). This surface signature of the MHW can be directly associated with atmospheric features as large positive air temperature anomalies are observed, which coincide in time and space with the MHW intensity patterns (Fig. 4d). This suggests a direct response of the surface ocean to the atmospheric anomaly. The eastern part is characterised by a larger number of peaks from March to December (as seen in the MHW intensity time series for the NASE subregion Fig. 3b), whereas moving westwards to the central part of the region, the period of high intensity is reduced to the July to October period, forming a single large spatiotemporal peak. Furthermore, we note that the pronounced intensity patterns in the eastern part (anomalies larger than 0.75 °C) propagate rapidly westward, most notably between 10 and 70° W at an estimated velocity of ∼ 11 m s−1 (first-order estimations based on the slope of the intensity pattern in Fig. 4a), starting in July and occurring nearly every month. To the west (70 to 100° W), fast west propagation from signal in the central part of the basin can be observed in October. Further west than 80° W, a period of strong MHW intensity (July to October) coincides with a period of strong positive air temperature anomalies.
The patterns of intensity at 40 m depth relate strongly with patterns at the surface, namely large intensity in the eastern half of the region spanning April to December (Fig. 4b). Peaks in intensity are smaller than for the surface, and patterns contain less high-frequency signal. Similarly to the surface, multiple peaks in intensity characterise the eastern part and a single long event the central part (30–50° W).
The similarity of the MHW signature at 40 m to the surface suggests that the atmospheric-driven MHW at the surface also reaches deeper layers. This correlation is confirmed by a depth–time Hovmöller diagram of the NASE region (Fig. 4e). Across the period from March to November, the region is exposed to several high peaks in MHW intensity at the surface (as seen in Fig. 3b). These propagate rapidly across the mixed layer and vary from 100 to 20 m in depth between winter and summer seasons.
This vertical propagation also extends below the MLD (Fig. 4e). MHW intensity larger than 0.5 °C can be observed below the MLD from April onwards: at 70 m depth in April and progressively reaching 100 m by November. The propagation across the mixed layer is rapid, with an estimated velocity of ∼ 4 m d−1. Below the MLD, the propagation is slower, ranging between 0.7–1.3 m d−1. A direct consequence is that the MHW-driven heat accumulation is trapped below the MLD to remain within the ocean interior and to be advected far away from the formation area.
At 156 m depth, patterns in MHW intensity are very different to what is observed at the surface (Fig. 4c). On the eastern side, there is no clear signature with only low MHW intensity levels. To the west, MHW intensity also differs from the surface, but unlike the east some small-spatial-scale patterns emerge: west of 70° W and for the period of September to November, intensity displays diagonal patterns, showing MHW intensity propagating westward with an estimated velocity of ∼ 0.1 m s−1. Such westward velocity is characteristic of eddies crossing the Caribbean Basin (Richardson, 2005; Cailleau et al., 2024), suggesting such features are responsible for the intense MHW conditions locally as they trap and carry westward abnormally warm waters. A snapshot of the MHW intensity on 7 July 2023 at 156 m depth overlaid with the sea surface height (SSH) anomaly confirms the intensities are trapped in the anticyclonic eddies at depth in this region (Fig. 4f). Note that blank areas represent areas where no MHWs were detected or that are outside the studied area (e.g. in the Pacific Ocean).
These very strong local intensities (larger than 2 °C above the 90th percentile threshold) are limited in space and explain the low and stable horizontal extent of MHWs in the CARB region at 156 m depth (Fig. 3d, dotted grey line). Some of these anomalies come from the NATR region but predominantly from the Equatorial and North Brazil currents located below the NATR region (e.g. the eddies located at 57° W–10° N on Fig. 4f). A detailed study of this region is necessary to understand the processes leading to eddy-trapped heat crossing the region; this however falls beyond the range of our study area and would also require a longer study period spanning beyond 2023 as MHW signatures are still strongly present in 2024 at the Equator.
Various meteorological and oceanographic estimates showed that the year 2023 was exceptional in terms of heat records and in particular the NA region. We studied the region using the Copernicus Marine global reanalysis product and characterised the MHW signature both at the surface and at depth. Compared to previous years, we show the exceptional nature of the 2023 MHW in the NA tropical ocean, which surpasses the last 30 years in terms of duration, intensity and coverage. A strong link with surface atmospheric conditions is shown (air temperature, negative trade wind anomaly). We also note an evolution of the timing of MHW maxima during the year, with maxima in the east of the basin during the months of May and June, the central part in mid-summer, and the Caribbean Sea in September. A decomposition into different regions of interest for marine biology (Longhurst provinces) and an in-depth study on these regions highlighted the vertical structure and evolution of MHWs in each region. We note a progressive penetration of the MHW below the MLD in the eastern part, together with a progressive intensification of the MHW intensity across the year. This is a remarkable phenomenon, which could potentially be important because it induces transport into the ocean interior of heat anomalies following surface extreme events. In the west, the Caribbean Sea region shows a very strong yet very localised MHW signal in the subsurface, with a maximum around 156 m. These anomalies characteristic of heat trapping eddies originate partly from the NA tropical ocean but mainly from the North Brazil Current. A dedicated study on eddy-trapped heat pathways to the ocean interior should be considered in the future but will have to extend beyond the year 2023 because in the tropical zone (2° S–2° N) MHWs are still ubiquitous in 2024.
Also, a more comprehensive and detailed quantification of the different contributions of ocean and atmospheric processes is needed to thoroughly understand this unprecedented event. In this sense, Guinaldo et al. (2025) describe the ocean preconditioning and mechanism that lead to the occurrence of this unprecedent event. Also, an approach based on the reconstruction of the heat equation could be taken for which the use of the reanalysis would be instrumental to quantify dominant processes (as it would provide gridded 3D fields at a 1 d frequency that reduce errors due to the non-linearity of the equation and the approximation of the estimation of the depth of the mixed layer). In view of the exceptional general characteristics of the MHW of 2023 in the NA, further studies are needed, for example to quantify the impact on marine biogeochemistry (BGC), a study for which a BGC reanalysis of Copernicus Marine can be used (GLOBAL_MULTIYEAR_BGC_001_029), but also on the distribution of Sargassum algae – which have a strong societal harmful impact – that develop largely in the Gulf of Guinea and are advected as far as the Caribbean region (Jouanno et al., 2021). In addition, the definition of extremes could be regionalised and tailored to be representative of harm towards key local species (Capotondi et al., 2024; Oliver et al., 2021).
In this study, the potential of ocean reanalyses to characterise a specific event was shown. Further work on the detection and analysis of extremes would be of interest to assess the MHW impact and importance on the more general climate context. Heat from this NA MHW propagates under the mixed layer to reach different depths depending on the region. Such strong anomalies once away from the surface and trapped within subsurface water masses can potentially be advected over long distances, such as the heat anomalies observed in this study at the Equator, which were consequently advected to the Caribbean region, the Gulf of Mexico and potentially back into the NA through the Gulf Stream. Detection and monitoring of extremes over the 30 years of the reanalysis will enable an initial scheme and an initial quantification of the importance of such extremes for the overall ocean interior heat content to be proposed. This estimate will then have to be compared to datasets with a longer time period in order to validate the hypotheses deduced from the study of the GLORYS12 reanalysis fields.
MHW detection was done using the marineHeatWaves Python module (Oliver, 2016).
Data access information is listed in Table 1.
SJVG and RBB led the conceptualisation of the study, the analysis and writing of the manuscript. AL performed the simulations, data analysis and the writing of the manuscript. MD contributed to the conceptualisation of the study and review of the manuscript.
The contact author has declared that none of the authors has any competing interests.
Publisher's note: Copernicus Publications remains neutral with regard to jurisdictional claims made in the text, published maps, institutional affiliations, or any other geographical representation in this paper. While Copernicus Publications makes every effort to include appropriate place names, the final responsibility lies with the authors.
We would like to thank the Ocean State Report team for the insightful comments and advice during the development of this paper.
This paper was edited by Pierre-Marie Poulain and reviewed by Milena Menna and one anonymous referee.
Cailleau, S., Bessières, L., Chiendje, L., Dubost, F., Reffray, G., Lellouche, J.-M., van Gennip, S., Régnier, C., Drevillon, M., Tressol, M., Clavier, M., Temple-Boyer, J., and Berline, L.: CAR36, a regional high-resolution ocean forecasting system for improving drift and beaching of Sargassum in the Caribbean archipelago, Geosci. Model Dev., 17, 3157–3173, https://doi.org/10.5194/gmd-17-3157-2024, 2024.
Capotondi, A., Rodrigues, R. R., Sen Gupta, A., Benthuysen, J. A., Deser, C., Frölicher, T. L., Lovenduski, N. S., Amaya, D. J., Le Grix, N., Xu, T., Hermes, J., Holbrook, N. J., Martinez-Villalobos, C., Masina, S., Roxy, M. K., Schaeffer, A., Schlegel, R. W., Smith, K. E., and Wang, C.: A global overview of marine heatwaves in a changing climate, Commun. Earth Environ., 5, 1–17, https://doi.org/10.1038/s43247-024-01806-9, 2024.
Cavole, L., Demko, A., Diner, R., Giddings, A., Koester, I., Pagniello, C., Paulsen, M.-L., Ramirez-Valdez, A., Schwenck, S., Yen, N., Zill, M., and Franks, P.: Biological Impacts of the 2013–2015 Warm-Water Anomaly in the Northeast Pacific: Winners, Losers, and the Future, Oceanography, 29, 273–285, https://doi.org/10.5670/oceanog.2016.32, 2016.
Copernicus: Record high global sea surface temperatures continue in August, Copernicus, https://climate.copernicus.eu/record-high-global-sea-surface-temperatures-continue-august (last access: 14 May 2025), 2023.
Copernicus Climate Change Service, Climate Data Store: ERA5 hourly data on single levels from 1940 to present, Copernicus Climate Change Service (C3S) Climate Data Store (CDS) [dataset], https://doi.org/10.24381/cds.adbb2d47, 2023.
Darmaraki, S., Somot, S., Sevault, F., and Nabat, P.: Past Variability of Mediterranean Sea Marine Heatwaves, Geophysical Research Letters, 46, 9813–9823, https://doi.org/10.1029/2019GL082933, 2019.
Drévillon, M., Lellouche, J.-M., Régnier, C., Garric, G., Bricaud, C., Hernandez, O., and Bourdallé-Badie, R.: EU Copernicus Marine Service Quality Information Document for the Globam Physics Reanalysis, GLOBAL_REANALYSIS_PHY_001_030, issue 1.6, Mercator Ocean International, https://documentation.marine.copernicus.eu/QUID/CMEMS-GLO-QUID-001-030.pdf (last access: 14 May 2025), 2023.
Drévillon, M., Fernandez, E., and Lellouche, J. M.: EU Copernicus Marine Service Product User Manual for the Global Ocean Physics Reanalysis, GLOBAL_MULTIYEAR_PHY_001_030, issue 1.6, Mercator Ocean International, https://documentation.marine.copernicus.eu/PUM/CMEMS-GLO-PUM-001-030.pdf (last access: 14 May 2025), 2024.
Elzahaby, Y. and Schaeffer, A.: Observational Insight Into the Subsurface Anomalies of Marine Heatwaves, Front. Mar. Sci., 6, 745, https://doi.org/10.3389/fmars.2019.00745, 2019.
Elzahaby, Y., Schaeffer, A., Roughan, M., and Delaux, S.: Oceanic Circulation Drives the Deepest and Longest Marine Heatwaves in the East Australian Current System, Geophysical Research Letters, 48, e2021GL094785, https://doi.org/10.1029/2021GL094785, 2021.
ESOTC: European State of the Climate 2023, Copernicus Climate Change Service (C3S), https://doi.org/10.24381/BS9V-8C66, 2024.
EU Copernicus Marine Service Product (CMEMS): Global Ocean Physics Reanalysis, Mercator Ocean International [dataset], https://doi.org/10.48670/moi-00021, 2023.
Flanders Marine Institute: Longhurst Provinces, Marine Regions, Flanders Marine Institute [dataset], https://www.marineregions.org/ (last access: 2 August 2024), 2009.
Forster, P. M., Smith, C., Walsh, T., Lamb, W. F., Lamboll, R., Hall, B., Hauser, M., Ribes, A., Rosen, D., Gillett, N. P., Palmer, M. D., Rogelj, J., von Schuckmann, K., Trewin, B., Allen, M., Andrew, R., Betts, R. A., Borger, A., Boyer, T., Broersma, J. A., Buontempo, C., Burgess, S., Cagnazzo, C., Cheng, L., Friedlingstein, P., Gettelman, A., Gütschow, J., Ishii, M., Jenkins, S., Lan, X., Morice, C., Mühle, J., Kadow, C., Kennedy, J., Killick, R. E., Krummel, P. B., Minx, J. C., Myhre, G., Naik, V., Peters, G. P., Pirani, A., Pongratz, J., Schleussner, C.-F., Seneviratne, S. I., Szopa, S., Thorne, P., Kovilakam, M. V. M., Majamäki, E., Jalkanen, J.-P., van Marle, M., Hoesly, R. M., Rohde, R., Schumacher, D., van der Werf, G., Vose, R., Zickfeld, K., Zhang, X., Masson-Delmotte, V., and Zhai, P.: Indicators of Global Climate Change 2023: annual update of key indicators of the state of the climate system and human influence, Earth Syst. Sci. Data, 16, 2625–2658, https://doi.org/10.5194/essd-16-2625-2024, 2024.
Frölicher, T. L. and Laufkötter, C.: Emerging risks from marine heat waves, Nat. Commun., 9, 650, https://doi.org/10.1038/s41467-018-03163-6, 2018.
Frölicher, T. L., Fischer, E. M., and Gruber, N.: Marine heatwaves under global warming, Nature, 560, 360–364, https://doi.org/10.1038/s41586-018-0383-9, 2018.
Guinaldo, T., Cassou, C., Sallée, J.-B., and Liné, A.: Internal variability effect doped by climate change drove the 2023 marine heat extreme in the North Atlantic, Commun. Earth Environ., 6, 1–11, https://doi.org/10.1038/s43247-025-02197-1, 2025.
Hersbach, H., Bell, B., Berrisford, P., Biavati, G., Horányi, A., Muñoz Sabater, J., Nicolas, J., Peubey, C., Radu, R., Rozum, I., Schepers, D., Simmons, A., Soci, C., Dee, D., and Thépaut, J.-N.: ERA5 hourly data on single levels from 1940 to present, Copernicus Climate Change Service (C3S) Climate Data Store (CDS) [dataset], https://doi.org/10.24381/cds.adbb2d47, 2023.
Hobday, A. J., Alexander, L. V., Perkins, S. E., Smale, D. A., Straub, S. C., Oliver, E. C. J., Benthuysen, J. A., Burrows, M. T., Donat, M. G., Feng, M., Holbrook, N. J., Moore, P. J., Scannell, H. A., Sen Gupta, A., and Wernberg, T.: A hierarchical approach to defining marine heatwaves, Prog. Oceanogr., 141, 227–238, https://doi.org/10.1016/j.pocean.2015.12.014, 2016.
Hobday, A. J., Oliver, E. C. J., Gupta, A. S., Benthuysen, J. A., and Burrows, M. T.: Categorizing and Naming Marine Heatwaves, Oceanography, 31, 162–173, https://doi.org/10.5670/oceanog.2018.205, 2018.
Jouanno, J., Benshila, R., Berline, L., Soulié, A., Radenac, M.-H., Morvan, G., Diaz, F., Sheinbaum, J., Chevalier, C., Thibaut, T., Changeux, T., Menard, F., Berthet, S., Aumont, O., Ethé, C., Nabat, P., and Mallet, M.: A NEMO-based model of Sargassum distribution in the tropical Atlantic: description of the model and sensitivity analysis (NEMO-Sarg1.0), Geosci. Model Dev., 14, 4069–4086, https://doi.org/10.5194/gmd-14-4069-2021, 2021.
Juza, M., Fernández-Mora, À., and Tintoré, J.: Sub-Regional Marine Heat Waves in the Mediterranean Sea From Observations: Long-Term Surface Changes, Sub-Surface and Coastal Responses, Front. Mar. Sci., 9, 785771, https://doi.org/10.3389/fmars.2022.785771, 2022.
Lellouche, J.-M., Greiner, E., Bourdallé-Badie, R., Garric, G., Melet, A., Drévillon, M., Bricaud, C., Hamon, M., Le Galloudec, O., Regnier, C., Candela, T., Testut, C.-E., Gasparin, F., Ruggiero, G., Benkiran, M., Drillet, Y., and Le Traon, P.-Y.: The Copernicus Global ° Oceanic and Sea Ice GLORYS12 Reanalysis, Front. Earth Sci., 9, 698876, https://doi.org/10.3389/feart.2021.698876, 2021.
Le Nohaïc, M., Ross, C. L., Cornwall, C. E., Comeau, S., Lowe, R., McCulloch, M. T., and Schoepf, V.: Marine heatwave causes unprecedented regional mass bleaching of thermally resistant corals in northwestern Australia, Sci. Rep., 7, 14999, https://doi.org/10.1038/s41598-017-14794-y, 2017.
Longhurst, A. R.: Ecological Geography of the Sea, Academic Press., Londre, 560 pp., https://doi.org/10.1016/B978-0-12-455521-1.X5000-1, 2007.
Oliver, E. C. J: marineHeatWaves, GitHub [code], https://github.com/ecjoliver/marineHeatWaves (last access: 2 August 2025), 2016.
Oliver, E. C. J., Donat, M. G., Burrows, M. T., Moore, P. J., Smale, D. A., Alexander, L. V., Benthuysen, J. A., Feng, M., Sen Gupta, A., Hobday, A. J., Holbrook, N. J., Perkins-Kirkpatrick, S. E., Scannell, H. A., Straub, S. C., and Wernberg, T.: Longer and more frequent marine heatwaves over the past century, Nat. Commun., 9, 1324, https://doi.org/10.1038/s41467-018-03732-9, 2018.
Oliver, E. C. J., Burrows, M. T., Donat, M. G., Sen Gupta, A., Alexander, L. V., Perkins-Kirkpatrick, S. E., Benthuysen, J. A., Hobday, A. J., Holbrook, N. J., Moore, P. J., Thomsen, M. S., Wernberg, T., and Smale, D. A.: Projected Marine Heatwaves in the 21st Century and the Potential for Ecological Impact, Front. Mar. Sci., 6, 734, https://doi.org/10.3389/fmars.2019.00734, 2019.
Oliver, E. C. J., Benthuysen, J. A., Darmaraki, S., Donat, M. G., Hobday, A. J., Holbrook, N. J., Schlegel, R. W., and Gupta, A. S.: Marine Heatwaves, Annu. Rev. Mar. Sci., 13, 313–342, https://doi.org/10.1146/annurev-marine-032720-095144, 2021.
Pirro, A., Martellucci, R., Gallo, A., Kubin, E., Mauri, E., Juza, M., Notarstefano, G., Pacciaroni, M., Bussani, A., and Menna, M.: Subsurface warming derived from Argo floats during the 2022 Mediterranean marine heat wave, in: 8th edition of the Copernicus Ocean State Report (OSR8), edited by: von Schuckmann, K., Moreira, L., Grégoire, M., Marcos, M., Staneva, J., Brasseur, P., Garric, G., Lionello, P., Karstensen, J., and Neukermans, G., Copernicus Publications, State Planet, 4-osr8, 18, https://doi.org/10.5194/sp-4-osr8-18-2024, 2024.
Reygondeau, G., Longhurst, A., Martinez, E., Beaugrand, G., Antoine, D., and Maury, O.: Dynamic biogeochemical provinces in the global ocean, Global Biogeochem. Cy., 27, 1046–1058, https://doi.org/10.1002/gbc.20089, 2013.
Richardson, P. L.: Caribbean Current and eddies as observed by surface drifters, Deep-Sea Res. Pt. II, 52, 429–463, https://doi.org/10.1016/j.dsr2.2004.11.001, 2005.
Schaeffer, A., Sen Gupta, A., and Roughan, M.: Seasonal stratification and complex local dynamics control the sub-surface structure of marine heatwaves in Eastern Australian coastal waters, Commun. Earth Environ., 4, 1–12, https://doi.org/10.1038/s43247-023-00966-4, 2023.
Simon, A., Plecha, S. M., Russo, A., Teles-Machado, A., Donat, M. G., Auger, P.-A., and Trigo, R. M.: Hot and cold marine extreme events in the Mediterranean over the period 1982-2021, Front. Mar. Sci., 9, 892201, https://doi.org/10.3389/fmars.2022.892201, 2022.
Smith, K. E., Burrows, M. T., Hobday, A. J., Sen Gupta, A., Moore, P. J., Thomsen, M., Wernberg, T., and Smale, D. A.: Socioeconomic impacts of marine heatwaves: Global issues and opportunities, Science, 374, eabj3593, https://doi.org/10.1126/science.abj3593, 2021.
Smith, K. E., Burrows, M. T., Hobday, A. J., King, N. G., Moore, P. J., Gupta, A. S., Thomsen, M. S., Wernberg, T., and Smale, D. A.: Biological Impacts of Marine Heatwaves, Annu. Rev. Mar. Sci., 15, 119–145, https://doi.org/10.1146/annurev-marine-032122-121437, 2023.
Sun, D., Li, F., Jing, Z., Hu, S., and Zhang, B.: Frequent marine heatwaves hidden below the surface of the global ocean, Nat. Geosci., 16, 1099–1104, https://doi.org/10.1038/s41561-023-01325-w, 2023.
Wernberg, T., Smale, D. A., Tuya, F., Thomsen, M. S., Langlois, T. J., De Bettignies, T., Bennett, S., and Rousseaux, C. S.: An extreme climatic event alters marine ecosystem structure in a global biodiversity hotspot, Nat. Clim. Change, 3, 78–82, https://doi.org/10.1038/nclimate1627, 2013.
Wernberg, T., Bennett, S., Babcock, R. C., de Bettignies, T., Cure, K., Depczynski, M., Dufois, F., Fromont, J., Fulton, C. J., Hovey, R. K., Harvey, E. S., Holmes, T. H., Kendrick, G. A., Radford, B., Santana-Garcon, J., Saunders, B. J., Smale, D. A., Thomsen, M. S., Tuckett, C. A., Tuya, F., Vanderklift, M. A., and Wilson, S.: Climate-driven regime shift of a temperate marine ecosystem, Science, 353, 169–172, https://doi.org/10.1126/science.aad8745, 2016.
World Meteorological Organization (WMO): Guide to climatological practices, Doc., WMO-No 100, Geneva, 139 pp., ISBN 978-92-63-10100-6, 2018.
World Meteorological Organization (WMO): WMO confirms that 2023 smashes global temperature record, World Meteorological Organization, https://wmo.int/news/media-centre/wmo-confirms-2023-smashes-global-temperature-record (last access: 14 May 2025), 2024.
Zhang, Y., Du, Y., Feng, M., and Hobday, A. J.: Vertical structures of marine heatwaves, Nat. Commun., 14, 6483, https://doi.org/10.1038/s41467-023-42219-0, 2023.