the Creative Commons Attribution 4.0 License.
the Creative Commons Attribution 4.0 License.
 | 30 Sep 2024 | OSR8 | Chapter 2.3
Monitoring main ocean currents of the Iberia–Biscay–Ireland region
Álvaro de Pascual Collar
Roland Aznar
Bruno Levier
Marcos García Sotillo
The Iberia–Biscay–Ireland (IBI) region is located on the eastern margin of the North Atlantic. This geographical position results in a diverse array of currents, primarily including southward surface currents (associated with the North Atlantic subtropical gyre) and poleward slope currents at intermediate depths following the continental margins of Africa and Europe. Ocean currents have significant climatic, environmental, economic, and social implications, making them a crucial parameter whose variability needs to be monitored to anticipate diagnosis and support decision-making in the face of changing scenarios.
The present study proposes a methodology that allows for systematic monitoring of ocean currents. This methodology is based on calculating volume transports within monitoring windows defined using (i) present knowledge of the ocean and (ii) delineation of the water mass to be monitored based on its density range. The proposed indicator is computed using various sources of observational and modeling data, resulting in a multi-product output. This approach provides not only an ocean monitoring indicator (OMI) of transport anomalies but also an analysis of uncertainties.
The calculation of this OMI on the currents in the IBI region shows that, despite the high uncertainties, the index is capable of detecting events of high and low transport intensity as well as significant transport trends superimposed on the interannual variability of some of the analyzed currents.
- Article
(5196 KB) - Full-text XML
- BibTeX
- EndNote


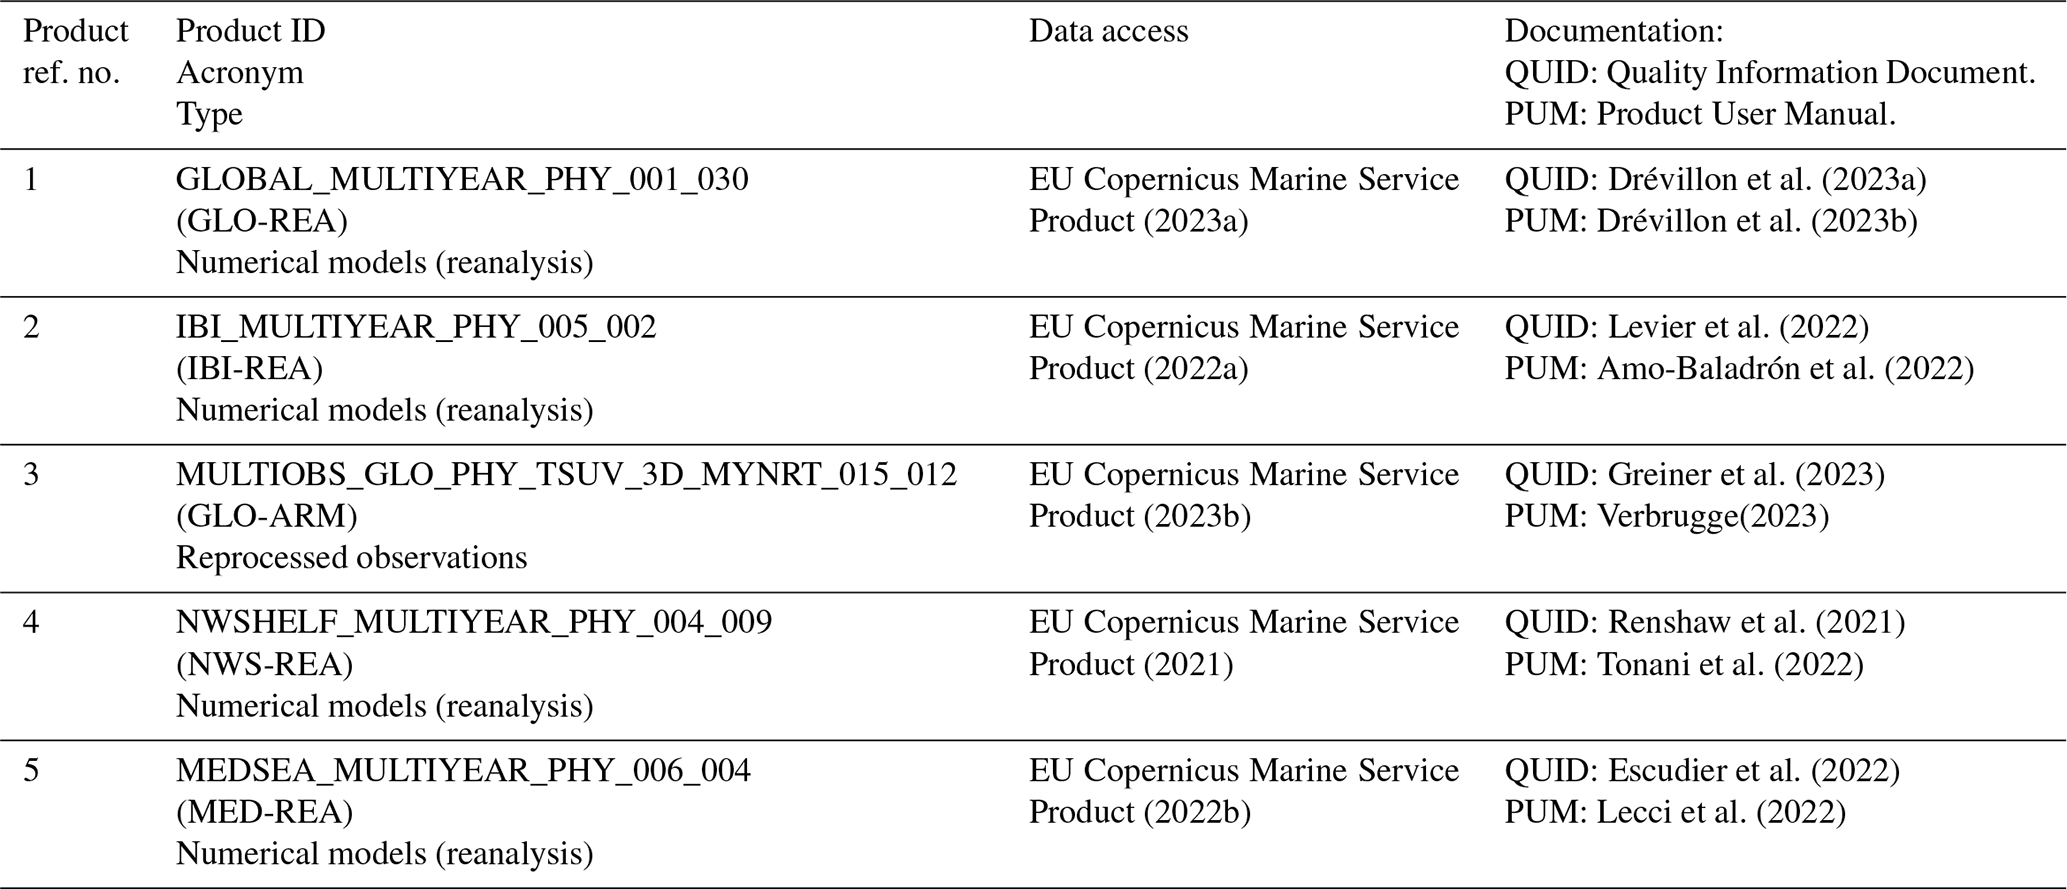
Table 1List of Copernicus Marine products used for the computation of currents in the Iberia–Biscay–Ireland (IBI) region.
The IBI (Iberia–Biscay–Ireland) region encompasses the northeastern Atlantic Ocean from the Canary Islands (latitude 28° N) to the coasts of Ireland and Great Britain (latitude 60° N). This zone is defined as one of the Marine Forecasting Centers of the Copernicus Marine Service (Fig. 1). The IBI area is a very complex region characterized by a remarkable variety of ocean processes and scales (Sotillo et al., 2015). The western, and deeper, side of the IBI domain is affected by large-scale currents, mainly the closure of the North Atlantic Drift, where it splits into two branches, the major one continuing north along the northwestern European shelves (Bower et al., 2002; Holliday et al., 2008) and the other going eastward to form the eastern boundary current of the North Atlantic subtropical gyre. This boundary current is composed of the Azores Current (Jia, 2000; Peliz et al., 2007), the Portugal equatorward current (Pérez et al., 2001), and the Canary Current (Knoll et al., 2002; Mason et al., 2011) along the European continental slope, a subsurface current flow northward following the coasts of Portugal, Spain (Mazé et al., 1997), and the Celtic–Armorican Slope (Fricourt et al., 2007). The signature of this current can be observed as far north as Porcupine Bank (52° N) (White and Bowyer, 1997; Friocourt et al., 2007; Pascual et al., 2018; de Pascual-Collar et al., 2019). The intermediate levels of the Canary basin are affected by the northward-flowing Antarctic Intermediate Water. The flow of this globally important water mass has been described in the Lanzarote Passage, located between the Canary Islands and the African coast (Knoll et al., 2002; Machín et al., 2010). The Alboran Sea, located in the western Mediterranean, is part of the IBI domain. There, the Atlantic surface inflow through the Strait of Gibraltar causes an eastward flow of modified Atlantic Water, forming Western Mediterranean Water. This eastward flow is constrained near the African coast after passing the Almería–Oran front (Tintoré et al., 1988; Benzohra and Millot, 1995; Font et al., 1998), creating the Algerian Current (Font et al., 1998; Sotillo et al., 2016).
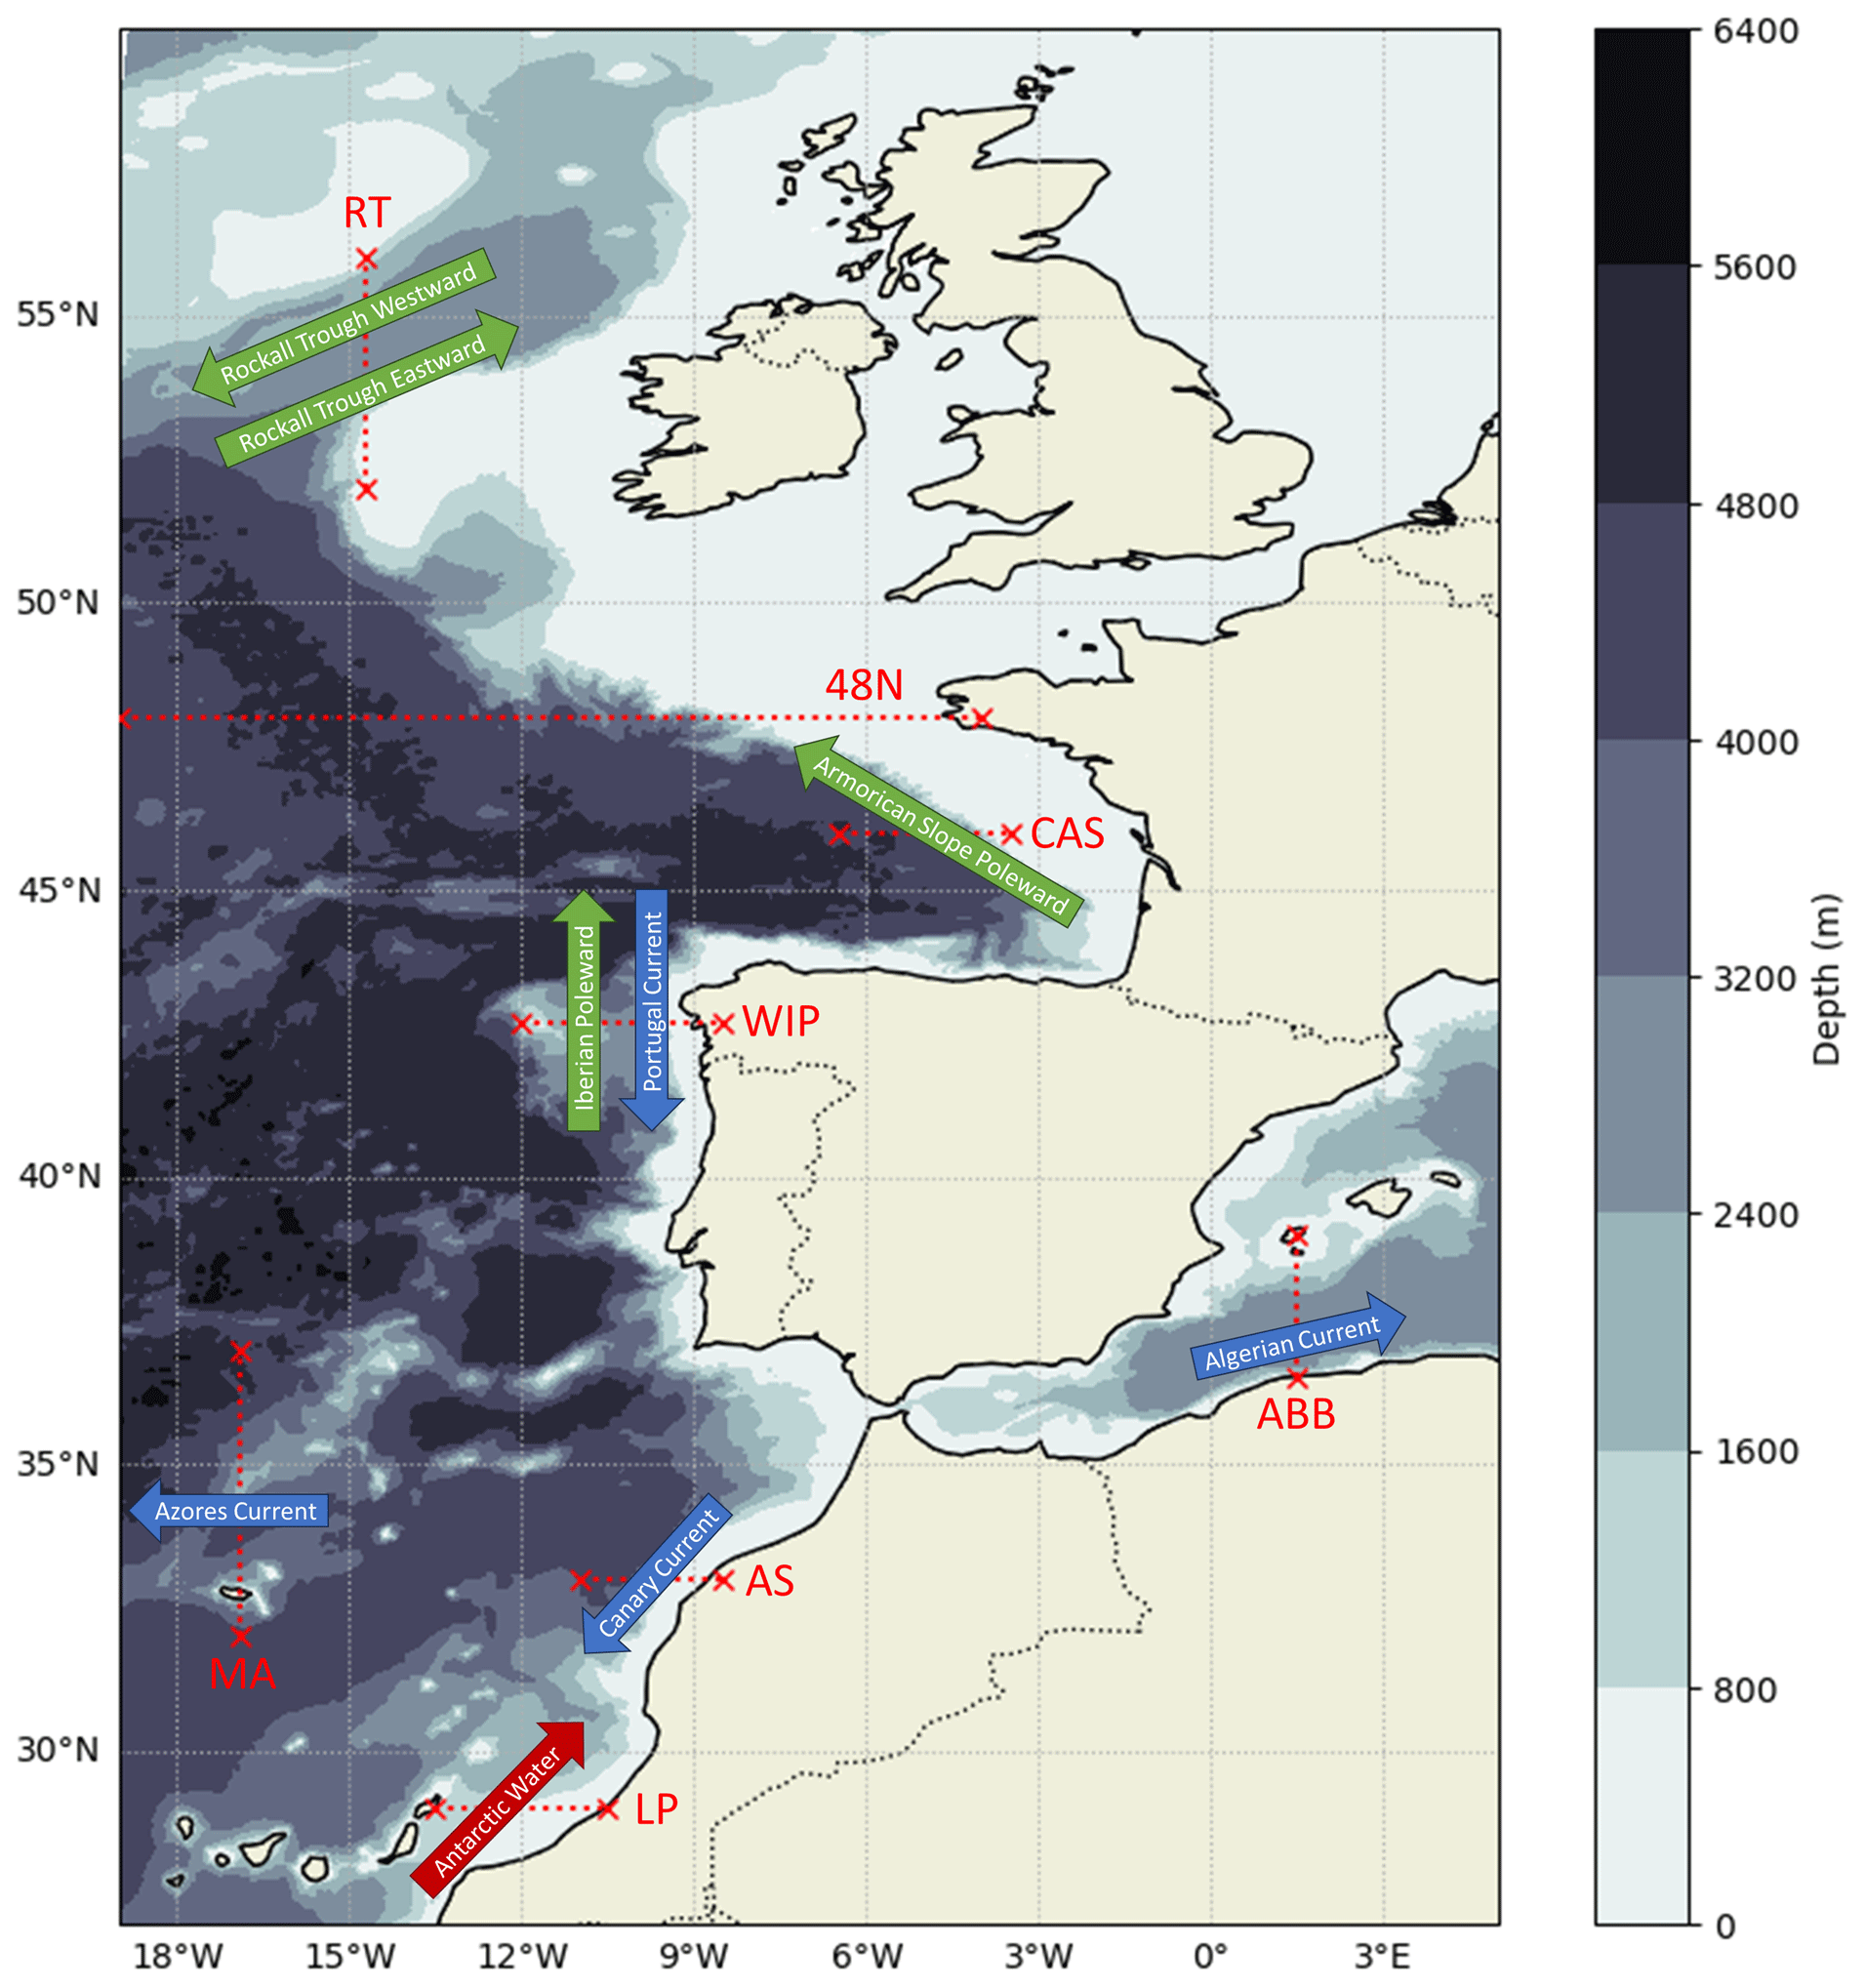
Figure 1Bathymetry of the IBI domain. Dotted red lines indicate the location and acronyms of the sections used to calculate the mean transverse velocity: RT (Rockall Trough), 48N (48° N), CAS (Celtic–Armorican Slope), WIP (West Iberian Peninsula), ABB (Algerian–Balearic Basin), AS (African Slope), MA (Madeira), and LP (Lanzarote Passage). Arrows represent the currents monitored in each section, categorized by an arbitrary color scheme: blue arrows indicate upper levels (0–500 m), green arrows indicate intermediate depths (500–1500 m), and red arrows indicate deep levels (>1500 m).
The variability of ocean currents in the IBI domain is relevant to the global thermohaline circulation and other climatic and environmental issues. For example, as discussed by Fasullo and Trenberth (2008), subtropical gyres play a crucial role in the meridional energy balance. The poleward salt transport of Mediterranean Water, driven by subsurface slope currents, has significant implications for salinity anomalies in the Rockall Trough and the Nordic Seas, as studied by Holliday (2003), Holliday et al. (2008), and Bozec et al. (2011). The Algerian current serves as the sole pathway for Atlantic Water to reach the western Mediterranean. Furthermore, the mixing processes between the Antarctic Intermediate Water and the Mediterranean Water in the African continental slope influences the salinity and nutrient concentration of the Mediterranean Water as it spreads into the North Atlantic (van Aken, 2000; Machín et al., 2010; de Pascual-Collar, 2019). Additionally, ocean currents also influence the spreading of biological populations (Daewel et al., 2008)
Since the main portion of oceanic transports occurs beneath the surface, one of the primary challenges in monitoring ocean currents is the scarcity of observational data for subsurface transport. In this context, modeling data offer a valuable alternative by providing physically consistent results in regions with sparse observations. Additionally, due to modeling data being provided in static grids, the operational computation of oceanic water mass transport is simplified. However, it is worth noting that modeling results at these intermediate and deep levels have a limited level of validation. To address this issue, ensemble approaches can be employed to estimate the uncertainties of the results, thereby improving the reliability of the findings.
In addition to climate-related regional applications, such long-term monitoring of currents in the IBI region can be of great interest for ocean-related activities for which information on regional current variability can enhance decision-making processes in the blue economy sectors (Rayner et al., 2019). This is particularly useful for maritime navigation and safety (Rayner et al., 2019), the fight against pollution, fisheries, aquaculture, marine renewable energy (Cavagnaro et al., 2020), and scientific research. By understanding the dynamics of ocean currents, stakeholders in these sectors would be able to optimize their operations, improving safety as well as planning and developing more sustainable practices. The availability of accurate and up-to-date information on regional ocean currents would contribute to the overall efficiency and effectiveness of ocean-related activities in the IBI region.
The aim of this work is to provide a pool of multi-product OMIs (ocean monitoring indicators) focused on monitoring the activity of the main currents described in the Iberia–Biscay–Ireland regional seas. To this aim, several monitoring vertical sections are proposed, and anomalies of transverse water transports are computed, providing information on the variability and trends of the monitored regional currents.
The present study proposes a methodology to monitor the main ocean currents in the IBI region. This is achieved by analyzing the velocity field in the region and proposing representative monitoring windows where the volume transport is monitored. Since the proposed monitoring windows are defined to follow specific water masses, they are defined not only according to the spatial representativeness of the region but also defining a range of specific densities representative of the targeted water mass.
In order to provide an ensemble-based final result, five Copernicus products listed and referenced in Table 1 have been used. Among these products, there are four reanalysis products (GLO-REA, IBI-REA, NWS-REA, and MED-REA) and one product obtained from reprocessed observations (GLO-ARM).
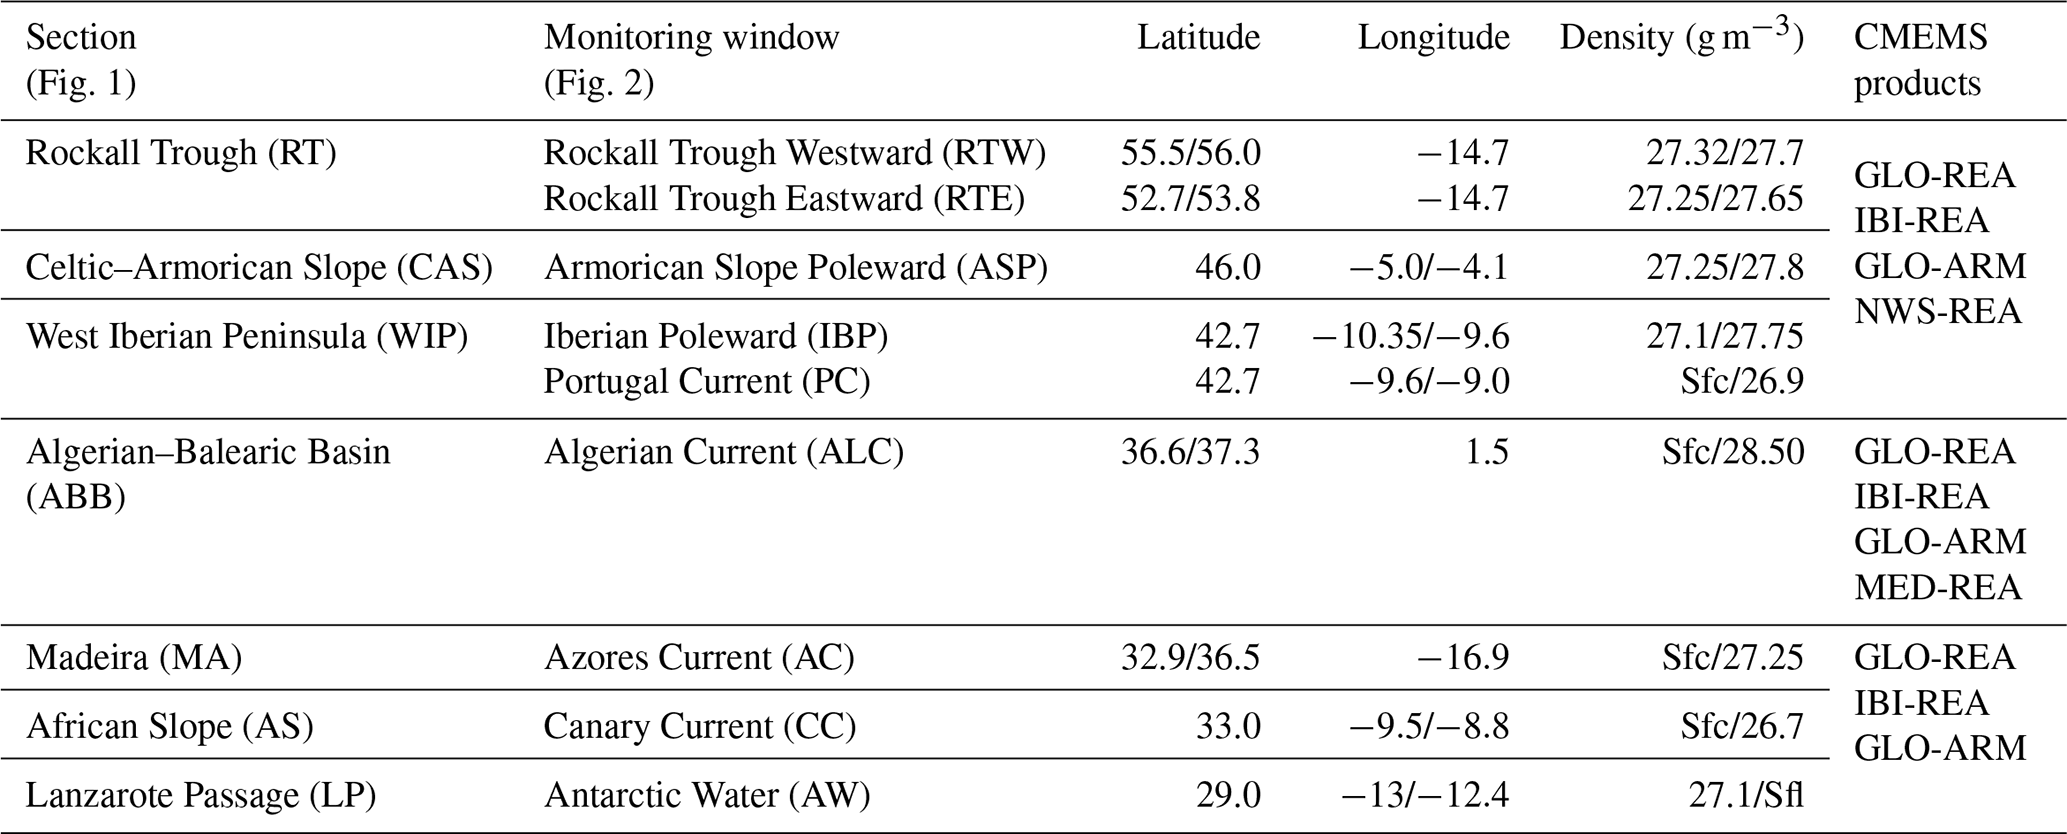
To perform monitoring of the currents described in the Introduction, some vertical sections have been defined (see geographical locations in Fig. 1 and further details in Table 2). These sections have been proposed based on the existing bibliographic description of the main currents occurring in the IBI region. Therefore, the RT (Rockall Trough) section has been defined to monitor zonal transports of Mediterranean-origin water towards the North Sea (Holliday et al., 2008; Lozier and Stewart, 2008). The N48 section has been included to monitor total transports along the parallel 48° N; this section corresponds to another OMI operationally delivered by the Copernicus Marine Service (EU Copernicus Marine Service Product, 2019) but computed in the IBI domain. The CAS (Celtic–Armorican Slope) section has been defined to monitor northward flows along the European continental shelf (Fricourt et al., 2007). The WIP (West Iberian Peninsula) section aims to study both the northwards flow of intermediate Mediterranean Water known as the Iberian Poleward Current (Daniault et al., 1994; Mazé et al., 1997; Fricourt et al., 2007) and the southwards wind-induced surface flows along the Portuguese coast also known as the Portugal Current (Pérez et al., 2001). The ABB (Algerian–Balearic Basin) section has been defined to analyze the behavior of the Algerian Current (Tintoré et al, 1988; Benzohra and Millot, 1995; Font et al., 1998). The AS (African Slope) section has been defined to monitor surface transports induced by the trade winds along the coasts of the African continent, commonly known as the Canary Current (Knoll et al., 2002; Mason et al., 2011). Similarly, the MA (Madeira) section is intended to monitor westward zonal surface flows near the island of Madeira, commonly referred to as the Azores Current (Mason et al., 2011). Finally, the LP (Lanzarote Passage) section has been defined to monitor the flow of deep Antarctic Water between the African continental shelf and the Canary Islands (Knoll et al., 2002; Machín et al., 2010).
Table 2Description of the monitoring windows used to compute the ocean current OMI. Min and max values of latitude, longitude, and density anomaly are detailed (sfc used for surface, sfl for seafloor).
The OMI defined in this study aims to monitor currents by calculating volume transport anomalies in specific layers inside the previously described vertical sections. Since all the products used are in a gridded format, the vector field of transports is computed by multiplying the velocity field components by the cross-sectional area of the calculation grid cells for each product. As each product is provided on a particular grid with a specific resolution, this step is performed using the grid mesh of each product.
Within each section (i.e., RT, 48N, CAS, WIP, AAB, MA, AS, MA, and LP), the signal of each flow associated with specific water masses to be monitored has been identified. This identification is based on the oceanographic description of the region obtained from the literature. Figure 2 presents the results of transverse velocity obtained in the vertical sections defined in Fig. 1. The meridional section defined in Rockall Trough (RT) reveals two regions exhibiting intense and opposing zonal transports: the southern area (situated between approximately 53 and 54° N), characterized by the eastward transport of modified Mediterranean Water into the Nordic Seas, and the northern side, located between latitudes approximately 55.5 and 56° N, displaying subsurface westward transport emanating from Rockall Trough. This observed pattern aligns with the cyclonic circulation previously described in the trough by New and Smythe-Wright (2001). The section defined along parallel 48° N (48N) has been included to compute the same results as other OMIs computed by the Copernicus Marine Service (EU Copernicus Marine Service Product, 2019). This section has not been defined to compute the transport of a specific current but to compute the total southward transport along this latitude. The zonal section defined in the Celtic–Armorican Slope (CAS) depicts a subsurface poleward flow attached to the continental slope, with maximum intensity of the current located at 1000 m depth. The northward flow affects the complete water column, from a few hundred meters to the bottom. The zonal section proposed in the western Iberian Peninsula (WIP) displays a subsurface poleward flow with maximum speed close to the continental slope and a surface equatorward current affecting waters over the continental platform of Portugal. The meridional section between Algeria and the Balearic Islands (Algerian–Balearic Basin; ABB) shows two well-defined currents: the eastward (positive values) current attached to the Algerian coast and westward transport along the Spanish Mediterranean coast. The meridional section north of Madeira (MA) has been defined to monitor the so-called Azores Current. This current is reflected as an eastward transport seen in upper layers (up to 600 m depth), with the center part of the current being influenced (and almost split) by the presence of a sea mountain north of the Azores; below 600 m depth transports are strongly influenced by bathymetry. The zonal section defined in the African Slope (AS) displays a similar structure as the section in the western Iberian Peninsula, marked by an equatorward surface flow over the continental shelf, corresponding to the so-called Canary Current, and an opposite subsurface northward flow attached to the continental slope. The zonal section defined in the Lanzarote Passage (LP) exhibits a clear poleward transport close to the continental slope, and this transport is split into two levels; the upper–intermediate level comprises from 200 up to 550 m depth and corresponds to the slope poleward current seen in other sections (such as the African Slope, western Iberian Peninsula and Celtic–Armorican Slope). The intermediate–deeper level of the poleward current seen in the Lanzarote Passage section comprises the waters from 550 m depth up to the bottom and is associated with the flows of Antarctic Intermediate Water.
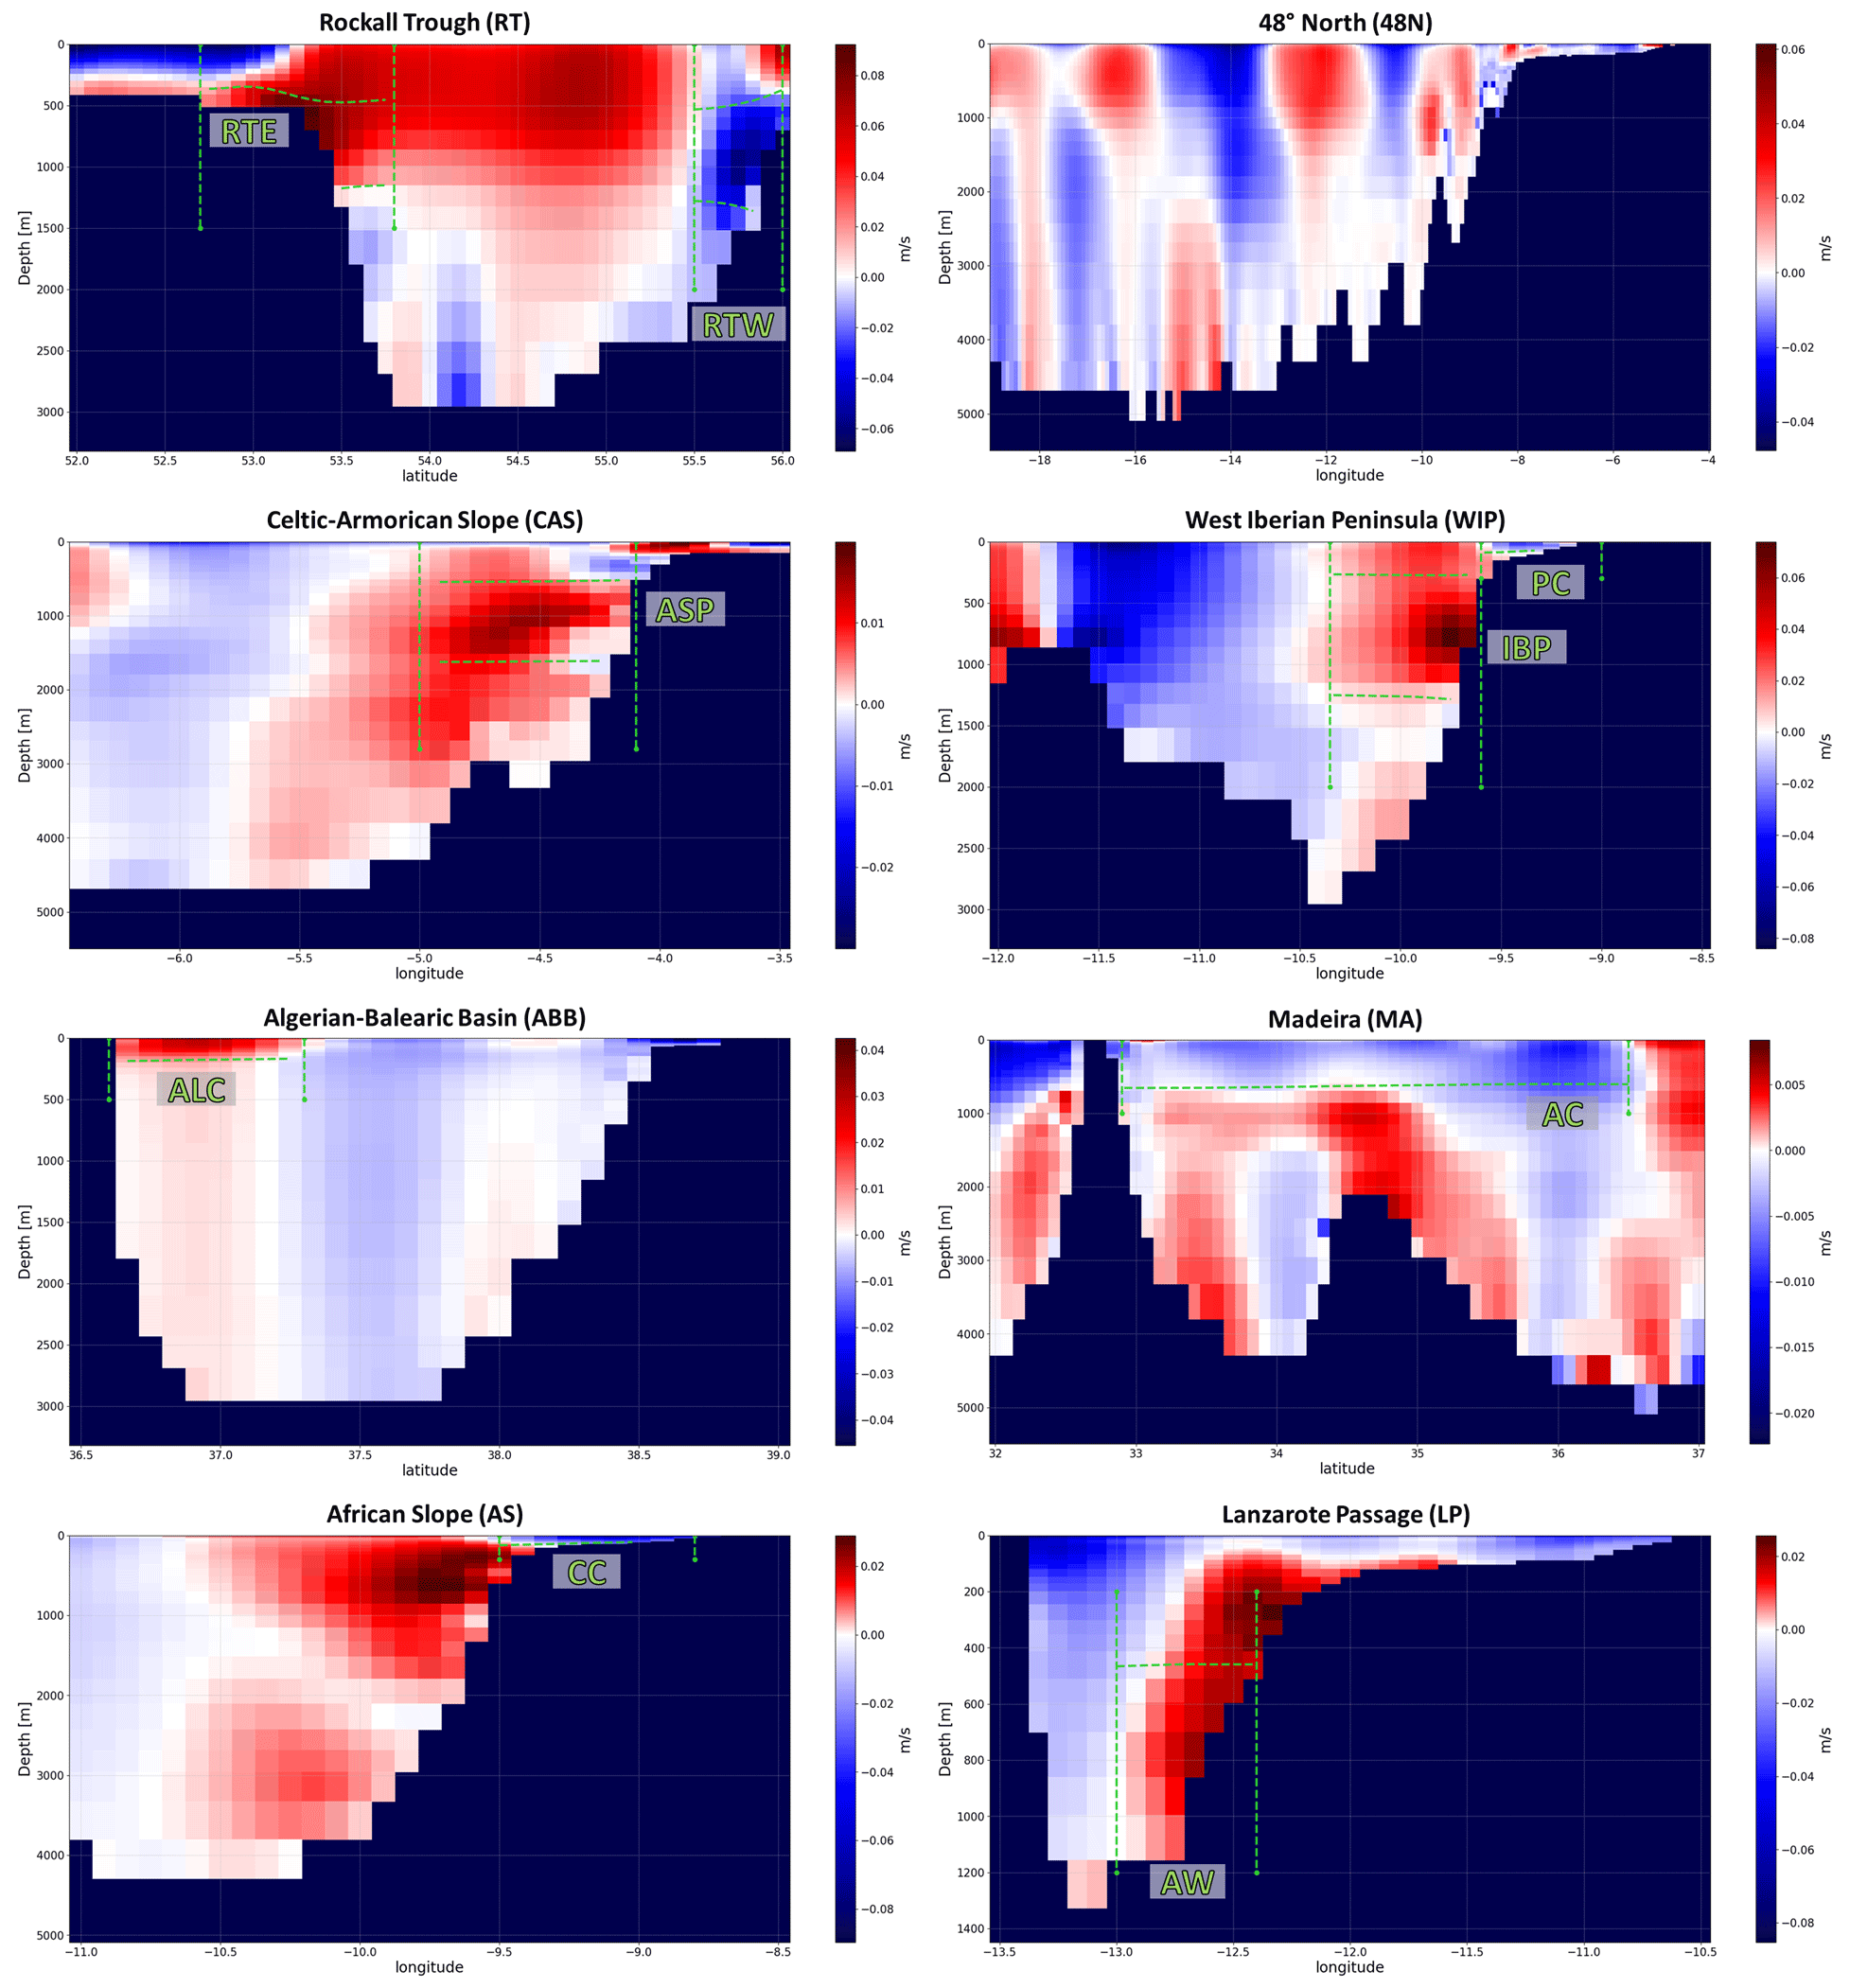
Figure 2Mean vertical sections of transverse velocity along the transects defined in Fig. 1 computed from IBI-REA over the period 1993–2021. Green dashed lines correspond to the monitoring windows defined to describe the variability of the currents defined. RTW: Rockall Trough Westward, RTE: Rockall Trough Eastward, ASP: Armorican Slope Poleward, IBP: Iberian Poleward, PC: Portugal Current, ALC: Algerian Current, CC: Canary Current, AC: Azores Current, and AW: Antarctic Water.
The consistency of the mean transverse velocity in vertical sections found in Fig. 1 and the described currents in the literature provide the support for proposing the lateral boundaries of the monitoring windows defined in Table 2 and marked with vertical dashed green lines in Fig. 2: Rockall Trough Eastward (RTE), Rockall Trough Westward (RTW), Armorican Slope Poleward (ASP), Iberian slope Poleward (IBP), Portugal Current (PC), Algerian Current (ALC), Azores Current (AC), Canary Current (CC), and Antarctic Water (AW). It is worth mentioning that no monitoring windows have been included in the N48 section since the generated OMI will compute the total transport along the 48° N parallel.
Since the tracked currents involve specific water masses, that the vertical boundaries of the monitoring windows are considered to exhibit vertical variability. Thus, the vertical boundaries of the monitoring windows have been defined based on the upper and lower density layers characterizing each monitored water mass. Given that the density field exhibits temporal variability within each product, the vertical boundaries of each window are dynamic, adapting to the oscillations in the ocean's density field. To find these vertical limits, T–S diagrams have been calculated for each monitoring window, temporally averaged over the period 1993–2021. Figure 3 shows the calculated T–S diagrams for each monitoring window using the IBI-REA product. The solid density lines marked on each diagram indicate the boundaries that have been selected to define the water mass characterizing each current. Additionally, these density boundaries are also represented in Fig. 2 as horizontal dashed lines in green. Since there are some monitoring windows whose vertical boundaries may be defined by the surface (PC, CC, AC, and ALC windows) or the seafloor (AW window), some panels in Fig. 3 show a single density line. Table 2 presents the density-defined vertical boundaries used for each window, including windows with the surface or seafloor as their vertical limit.
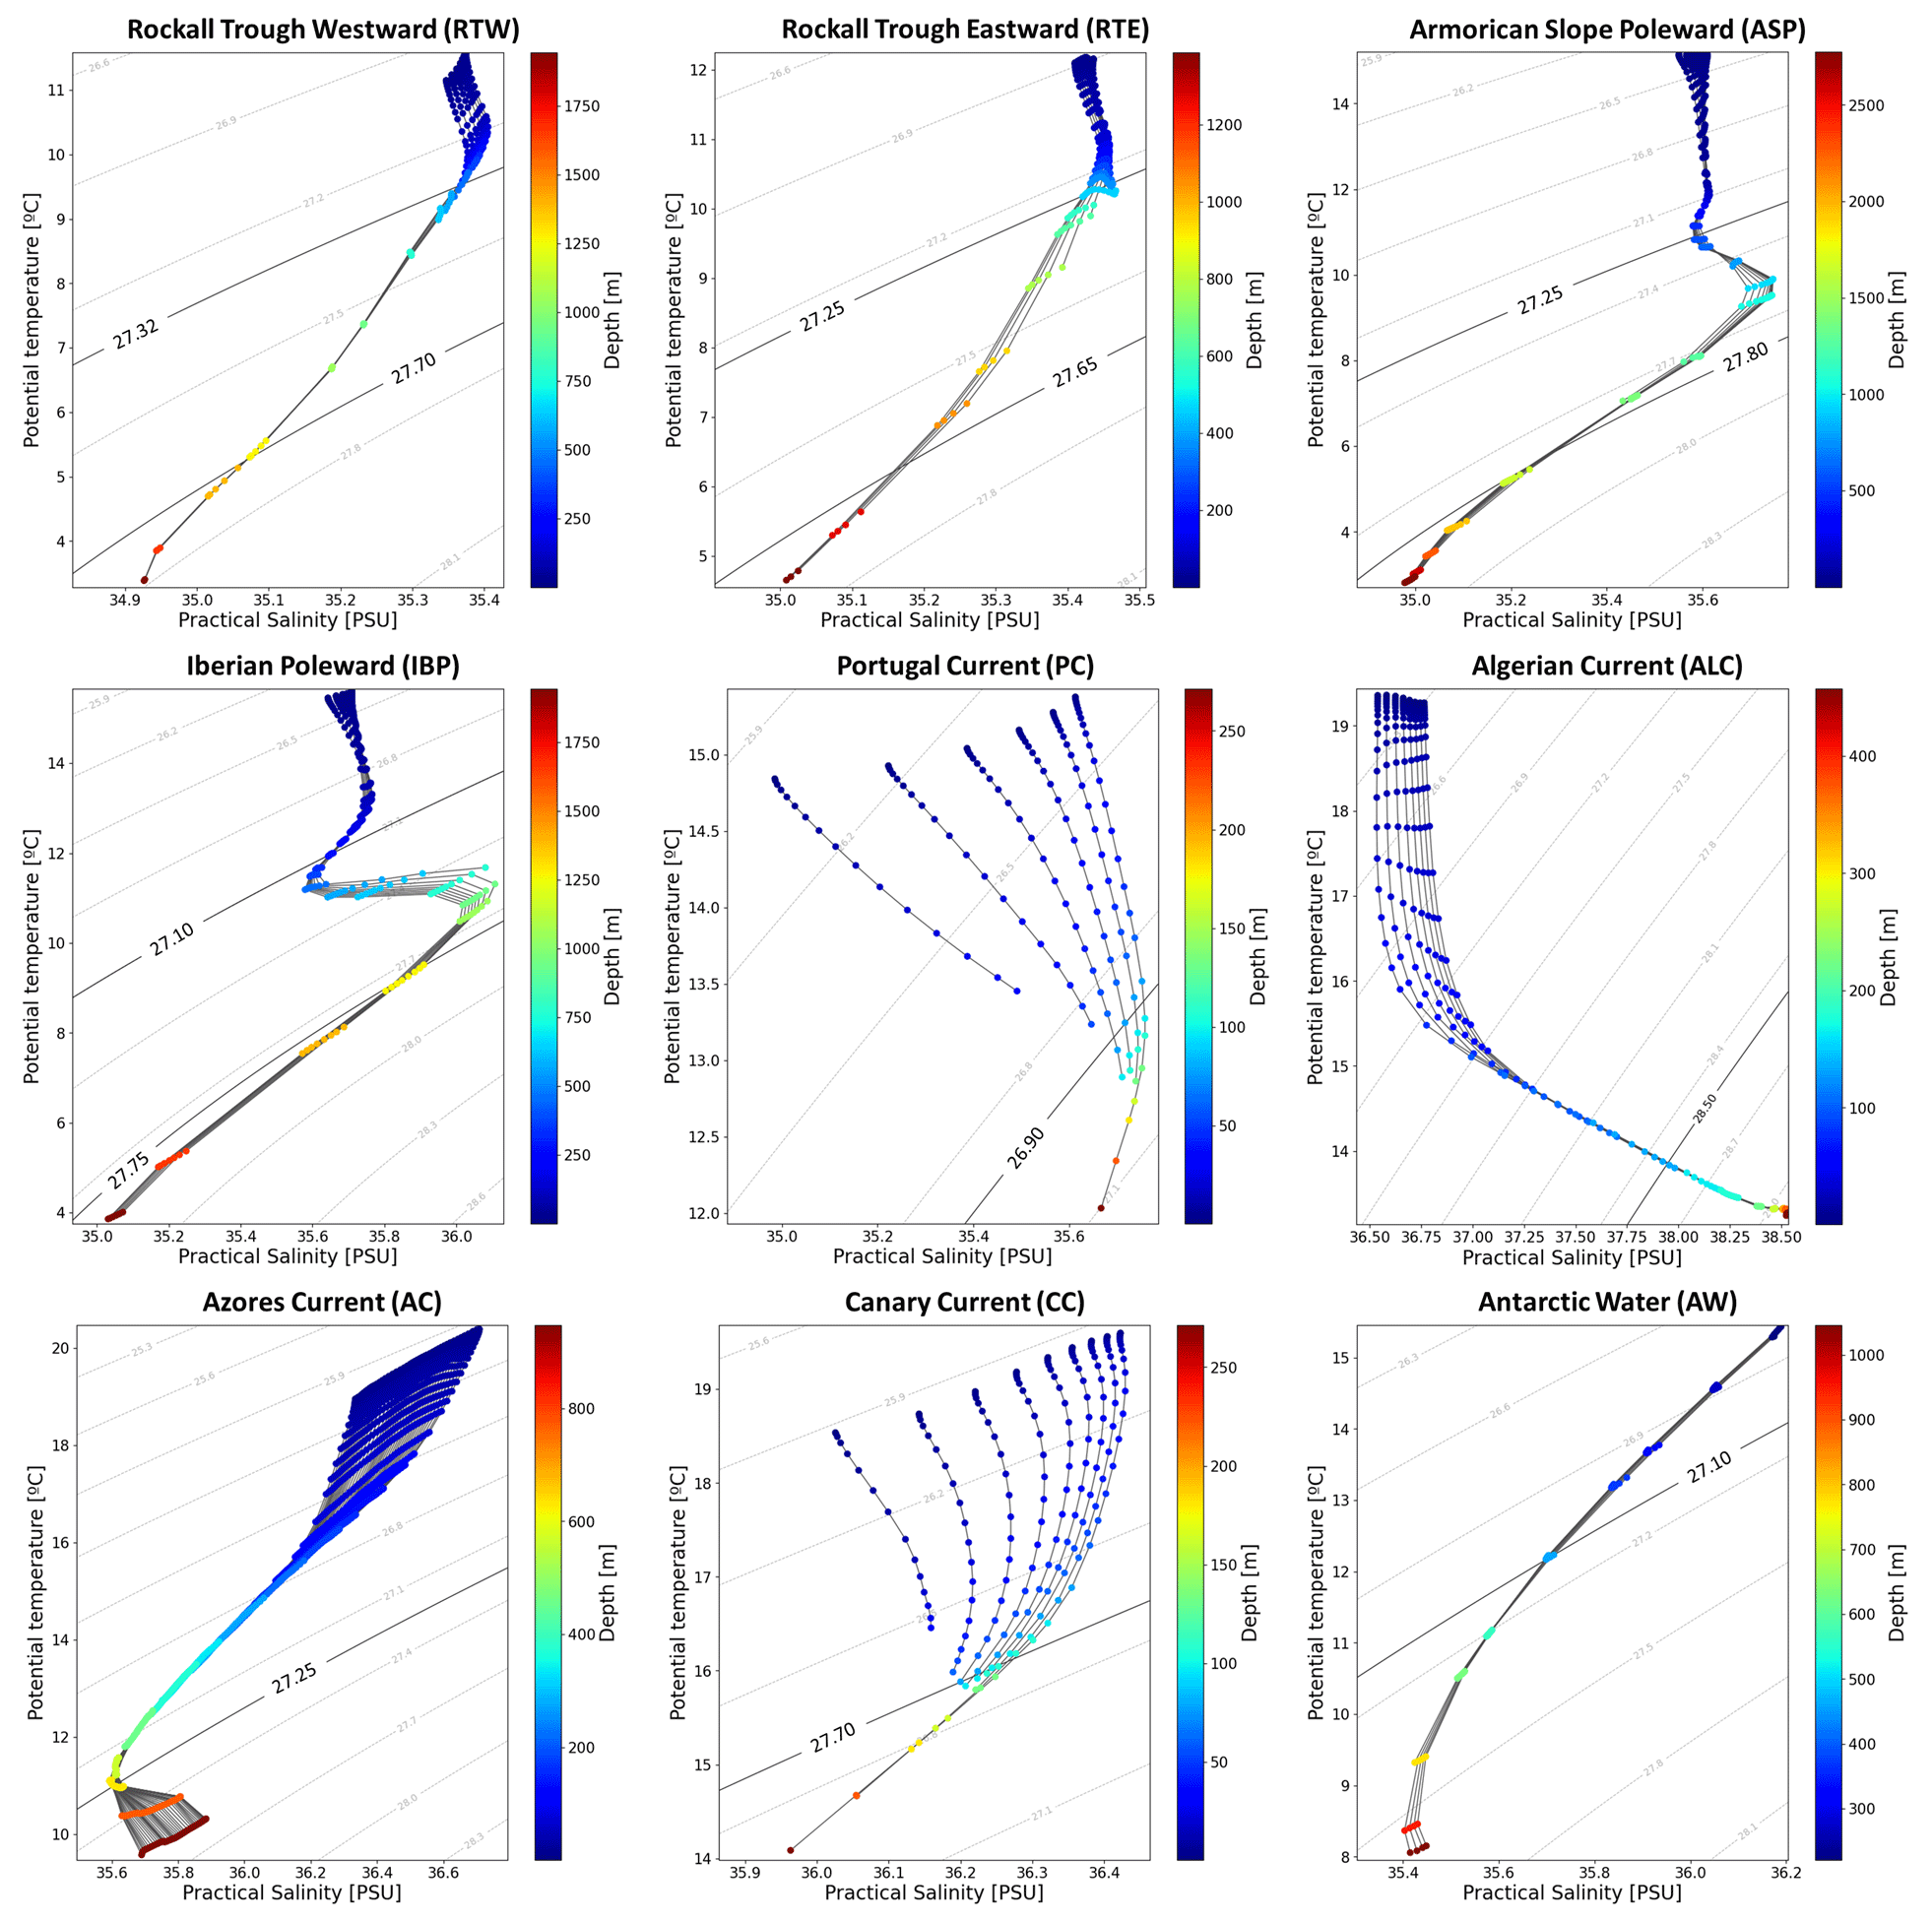
Figure 3Averaged diagrams computed on the monitoring sections using IBI-REA product data over the period 1993–2021. Traces correspond to each vertical profile included on the corresponding monitoring window. The diagrams include the anomaly of potential density field (shown as dotted gray lines), with the vertical boundaries of each monitoring section being represented by the continuous black lines. The diagrams that have a single continuous line correspond to monitoring windows where one of the vertical levels is defined as the surface or seafloor (see Table 2).
Subsequently, the transport estimates are integrated within each defined monitoring window on a monthly basis. As explained earlier, the vertical boundaries of the monitoring windows are dynamic and defined based on specific density layers. The UNESCO equations (Fofonoff and Millard, 1983) are used to estimate the density field from the salinity and potential temperature fields of each product. Thus, each monitoring window is defined at each time step with fixed lateral boundaries (defined as static latitude–longitude locations) and variable vertical boundaries that may vary in time according to vertical oscillations of the density field (Table 2).
After spatial integration, an estimated transport time series is obtained for each product and each monitoring window. Since the proposed OMI aims to focus on interannual and longer timescales, seasonal variability is filtered out, with the data being processed as anomalies by removing the monthly mean from each value, using the climatological average of the time series in the period 1993–2021 as a reference.
Finally, outcomes from the different products are combined to produce an ensemble showing the mean of all products and the standard deviation. Since not all Copernicus products used in this study cover the entire IBI region, some products cannot be used for current monitoring in certain monitoring windows (Table 2 provides a list of the products used to monitor transports in each section).
The anomaly of volume transports in specific monitoring windows (relative to the monthly mean transport between 1993 and 2021) is proposed as an OMI for each regional current (Fig. 4). The uncertainty is assessed by the estimation of indicators with several different Copernicus Marine products (OMIs are estimated with the more complete set of products available in each monitoring window; see Table 2); the higher the agreement of results provided by diverse systems, the higher the statistical robustness.
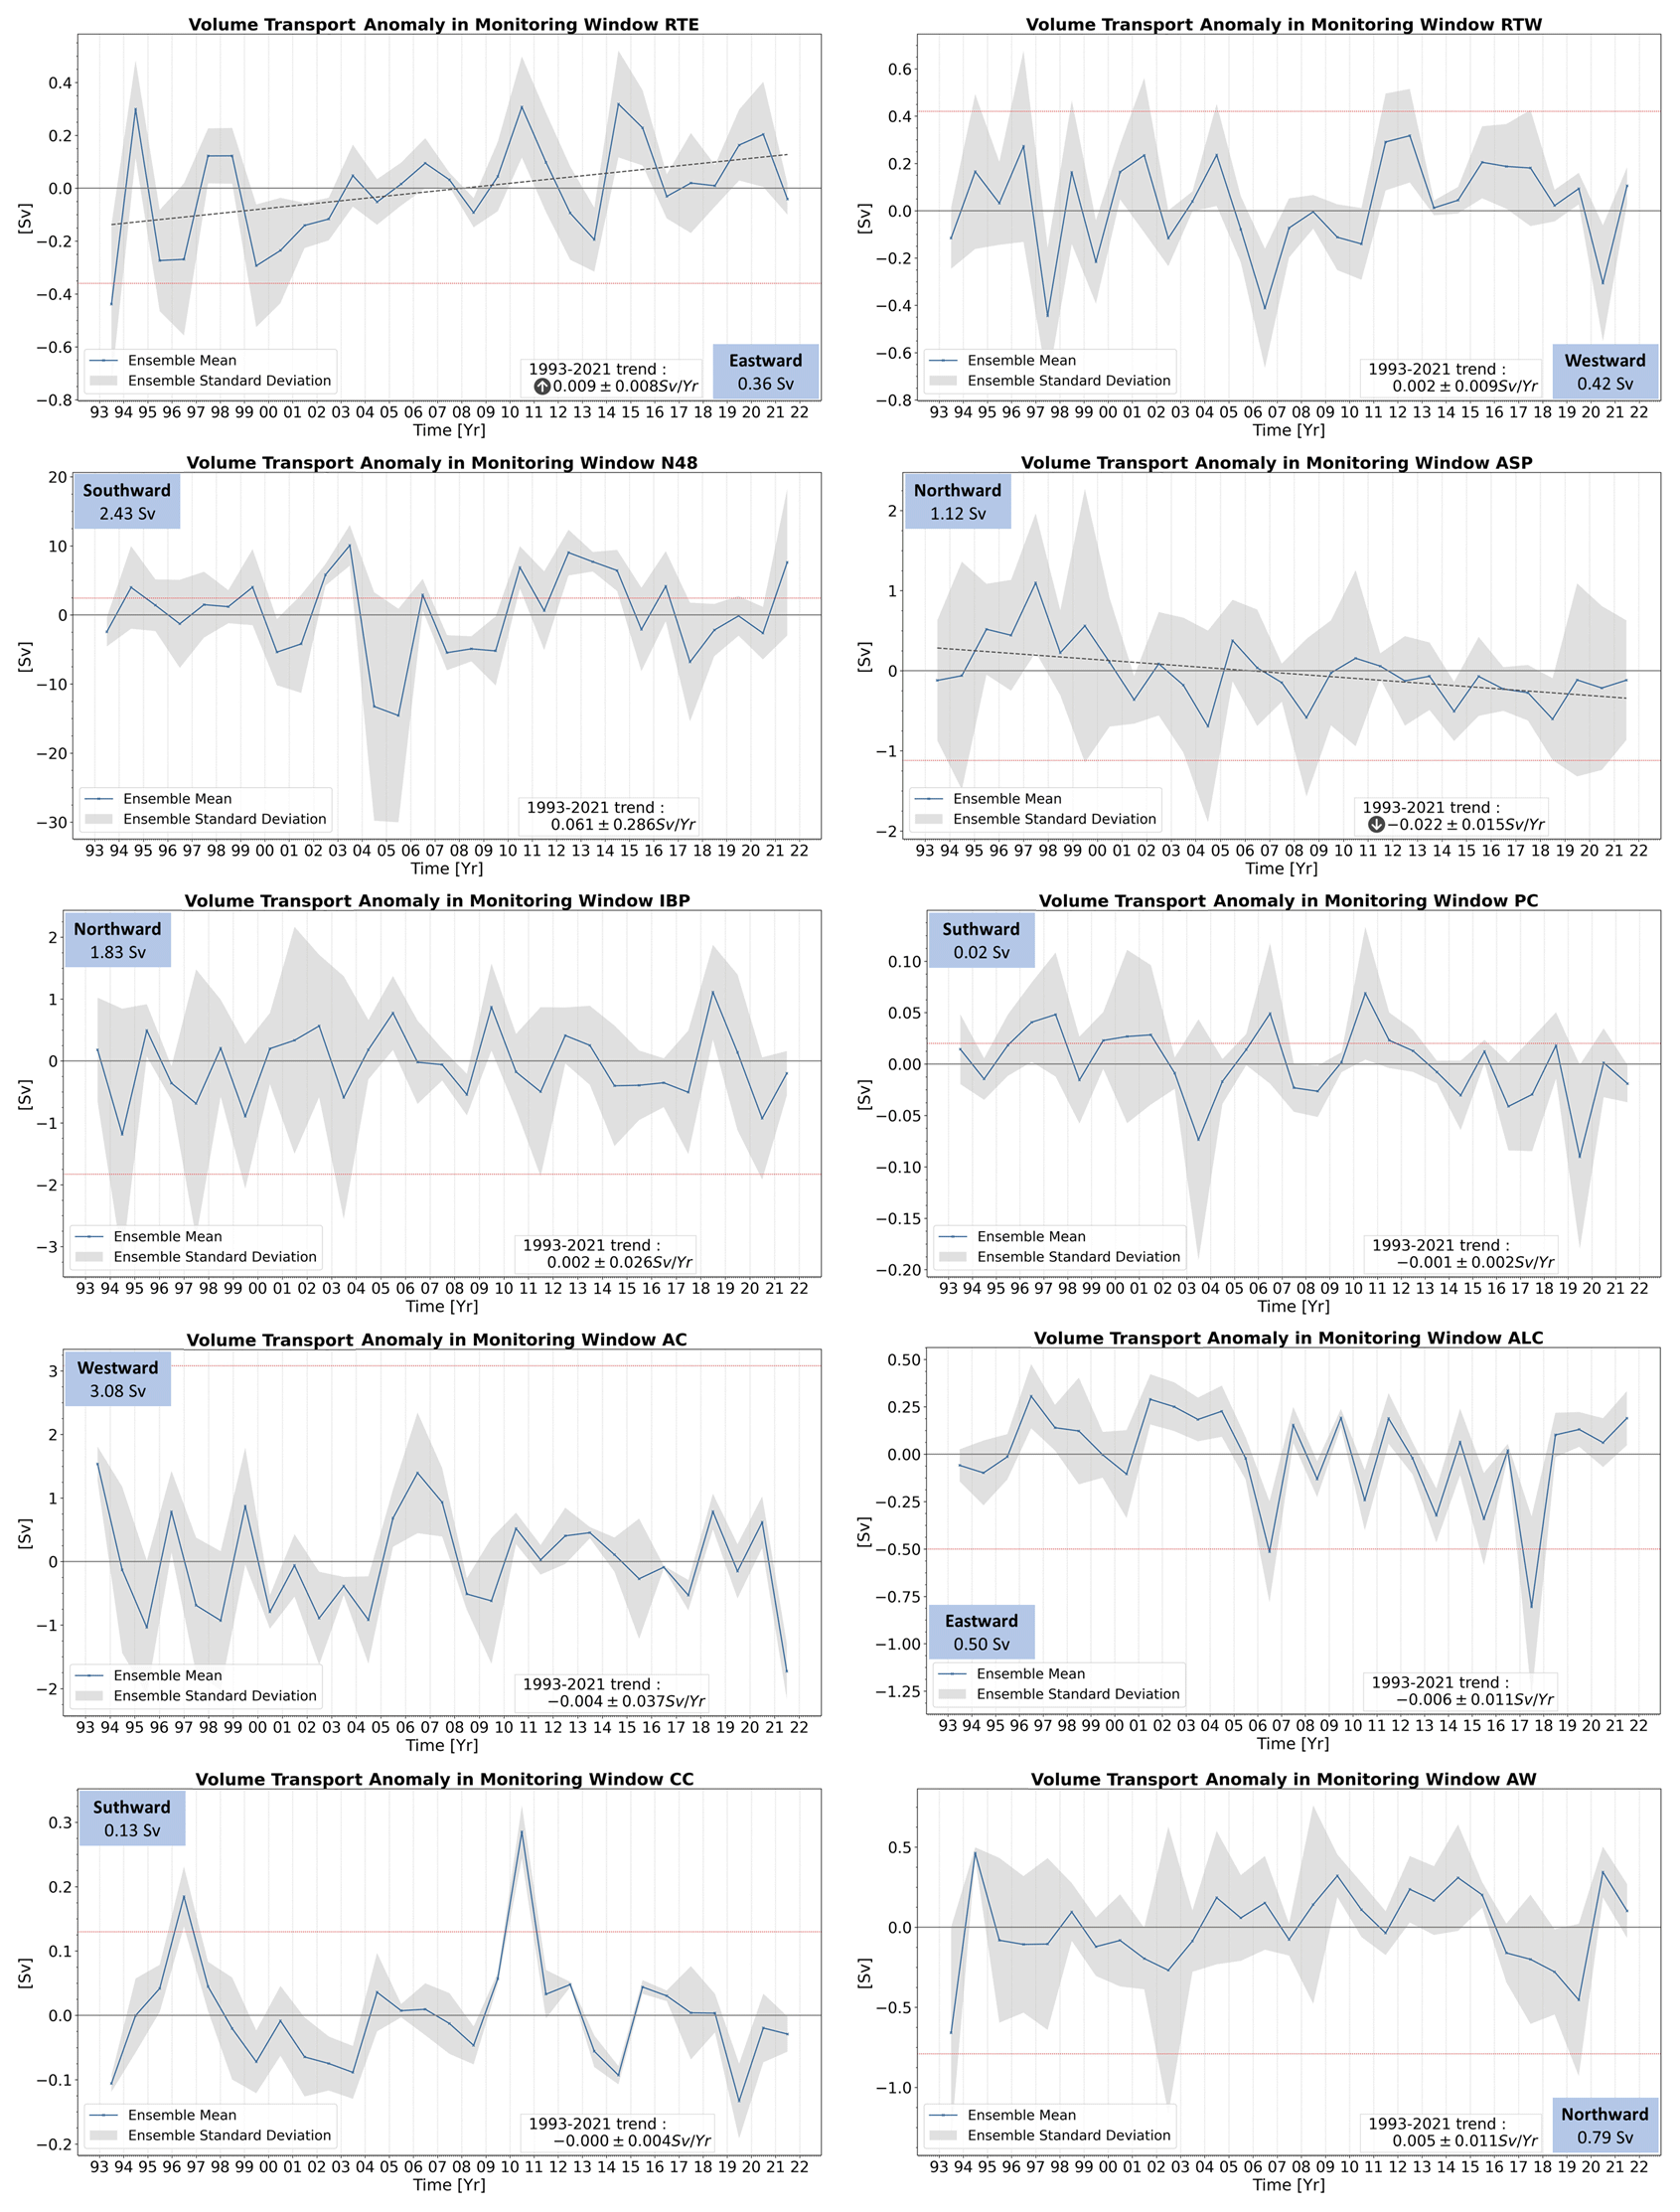
Figure 4Annual anomalies of cross-section volume transport averaged in monitoring windows RTE, RTW, N48, ASP, IBP, PC, AC, ALC, CC, and AW. Time series are computed and averaged from different Copernicus Marine products for each window (see Table 2), providing a multi-product result. The blue line represents the ensemble mean, and shaded gray areas represent the standard deviation of the ensemble. Blue boxes include the direction of the current and mean transport computed in the period 1993–2021. Dashed red lines depict the velocity value at which the direction of the current reverses. This aligns with the average transport value (with sign reversed) and the point where absolute transport becomes zero. The analysis of trends (at 95 % confidence interval) computed in the period 1993–2021 is included (bottom right box). Trend lines (dashed gray line) are only included in the figures when a significant trend is obtained.
The interpretation of the OMI results presented in Fig. 4 should be done considering that the calculated average transports include the sign of the current velocity vector (positive for northward and eastward transports, and vice versa). Therefore, the anomalies shown in the OMI should be interpreted following the same sign convention. Thus, a positive anomaly can indicate an intensification, weakening, or even a reversal of the current. These options can be deduced from the dashed red line included in each plot. It represents the mean value of transport (with the sign reversed); thus, it aligns with the anomaly value that nullifies the transport across the monitoring window. Beyond this line, the transport reverses, indicating a transport in the opposite direction. Among the proposed monitoring windows, RTE, ASP, IBP, AW, and ALC exhibit a positive mean velocity, so positive transport anomalies imply an intensification of the current. On the other hand, the RTW, PC, CC, AC, and N48 monitoring windows show negative mean transport values, where intensification of the current is represented by negative transport anomalies.
Analyzing the uncertainties of the time series, it can be observed that differences among the products sometimes hinder the detection of significant anomalies. This is the case for the ASP, IBP, PC, and AW currents, for which anomalies exceeding the data dispersion are scarce. Conversely, there are other monitoring windows where a lower data dispersion allows for a more precise estimation of the overall variability. This is the case for the CC and ALC currents, where, due to being more stable and shallower currents, the uncertainties are generally smaller than the magnitude of the anomalies. In the remaining monitoring windows (RTE, RTW, AC, and 48N), uncertainties are considerable but sufficiently low, allowing identification of specific events with pronounced variability. In this regard, examples of events of negative anomalies (1995–1996, 1999) and positive anomalies (2010 and 2014) in the RTE section, as well as the positive anomaly of the Azores Current (AC) in 2006 and the anomalous transports along the N48 section in 2003 and 2012, can be highlighted.
The uncertainty of the results also enables the detection of periods during which it can be assumed that the transport within a monitoring window is nonsignificant or null. These are periods in which the uncertainty of the data includes the threshold for null transport. Similarly, it is possible to identify periods in which the current reverses, leading to a significant reverse transport. These periods are characterized by both the ensemble mean and the range of uncertainties being greater than the zero-transport threshold. With this type of analysis, it is possible to detect currents that (i) exhibit occasional halts in transport, as seen in the cases of RTW, ASP, ALC, or AW, where there are years when the net transport is not significant; (ii) display levels of uncertainty sufficiently high to conceal the presence of the current for the majority of the study period (N48 or PC); or (iii) demonstrate significant reversals of the current in specific years, such as the case of CC in 1996 and 2010.
Analyzing the trends in the OMIs, Fig. 4 shows the absence of statistically significant trends in most of the monitoring sections. However, the sections related to the Mediterranean Water flow along the continental shelf do exhibit opposite trends, where the ASP window indicates a decrease of 0.02 Sv yr−1 in northward flow along the Celtic–Armorican Slope and an intensification of transport towards the Scandinavian seas of 0.01 Sv yr−1.
This study proposes a methodology for defining OMIs to monitor variability of the main ocean currents in the IBI region. The objective is to describe the strengths and weaknesses of the associated transports through the proposed indicator. The methodology used to define the OMI involves utilizing various Copernicus Marine products, which allows for an ensemble analysis that not only provides information on the currents, but also yields an assessment of associated uncertainties.
The proposed indicator is based on the definition of monitoring spatial windows that are representative of the overall transport of the current. These spatial windows are defined based on two criteria. Firstly, horizontal boundaries are determined using initially bibliographic criteria and by detection of the targeted currents in the averaged velocity fields. Secondly, vertical limits are defined based on the observed density of water masses. With this methodology, vertical limits of the monitoring window are not statically defined but are adaptive to the inherent vertical variability of water masses.
The results have demonstrated that the OMI is capable of monitoring the targeted regional currents with varying degrees of uncertainty. The different products used show higher agreement in shallower and more persistent currents, while the indicator exhibits more uncertainties when monitoring deep currents or those with higher temporal variability. Nevertheless, and despite the magnitude of the uncertainties, the OMI is able to detect periods of high or low activity in six of the proposed monitoring windows (RTE, RTW, CC, AC, ALC, and N48). Outstanding events, including periods of low activity in the Canary Current (in 1996 and 2010) and in the Azores Current in 2006, as well as a significant intensification of transports associated with the Azores Current in 2021, have been observed.
The OMI also allows detection of statistically significant trends in some of the monitoring spatial windows. Specifically, the RTE and ASP windows show opposite trends in water transports, while there is a transport increase towards the Nordic Seas in the Rockall Trough and a decrease in Mediterranean Water transported northward through the Celtic–Armorican continental slope.
Finally, this study highlights the utility of model data products for monitoring ocean currents. This methodology is particularly relevant for tracking deep currents where observational data availability is limited. The proposed methodology may have a further application in a variety of contexts, such as maritime navigation, fishing, aquaculture, marine renewable energy, and general scientific research. Indeed, the next steps in these fields will involve expanding the methodology to monitor not only water transports, but also the transports of other properties, such as ocean heat transport, freshwater and salt transports, or other biogeochemical properties, enhancing the interest in such OMIs for specific fields, such as the study of planetary climate variability.
The software used for this work is the property of NOW Systems S.L. The methodology strictly describes all the steps followed to develop this code. Anyone interested in accessing this software should contact the corresponding author.
The data used in this work have been obtained from the Copernicus Marine Service. All the mentioned databases are accessible through the Copernicus Marine Service. Their references can be found in the product tables (Table 1).
All authors have contributed to the completion of this work. MGS and RA participated in the conceptualization, methodology, and writing (review and editing) phases. BL contributed to the conceptualization, methodology, validation, and writing (review and editing) stages. Finally, ÁdPC coordinated the work and also participated in the formal analysis, methodology, software development, and writing (original draft preparation).
The contact author has declared that none of the authors has any competing interests.
Publisher's note: Copernicus Publications remains neutral with regard to jurisdictional claims made in the text, published maps, institutional affiliations, or any other geographical representation in this paper. While Copernicus Publications makes every effort to include appropriate place names, the final responsibility lies with the authors.
This work has been conducted under contract number 21002L6-COP-MFC IBI-5600 as part of the ongoing partnership between Nologin and Mercator Ocean International. The authors acknowledge the Copernicus Marine Service for access to the datasets used on this work. Additionally, the helpful comments of anonymous referees are gratefully acknowledged.
This research has been supported by contract number 21002L6-COP-MFC IBI-5600 as part of the ongoing partnership between Nologin and Mercator Ocean International.
This paper was edited by Marta Marcos and reviewed by two anonymous referees.
Amo-Baladrón, A., Levier, B., Aznar, R., and Sotillo, M. G.: Copernicus Marine Service Product User Manual for the Atlantic -Iberian Biscay Irish- Ocean Physics Reanalysis, IBI_MULTIYEAR_PHY_005_002, Issue 4.1, Mercator Ocean International, https://catalogue.marine.copernicus.eu/documents/PUM/CMEMS-IBI-PUM-005-002.pdf (last access: 29 April 2024), 2022.
Benzohra, M. and Millot, C.: Characteristics and circulation of the surface and intermediate water masses off Algeria, Deep-Sea Res. Pt. I, 42, 1803–1830, https://doi.org/10.1016/0967-0637(95)00043-6, 1995.
Bower, A. S., Le Cann, B., Rossby, T., Zenk, T., Gould, J., Speer, K., Richardson, P. L., Prater, M. D., and Zhang, H.-M.: Directly measured mid-depth circulation in the northeastern North Atlantic Ocean, Nature, 419, 603–607, https://doi.org/10.1038/nature01078, 2002.
Bozec, A., Lozier, M. S., Chasignet, E. P., and Halliwel, G. R.: On the variability of the Mediterranean Outflow Water in the North Atlantic from 1948 to 2006, J. Geophys. Res.-Oceans, 116, C09033, https://doi.org/10.1029/2011JC007191, 2011.
Cavagnaro, R. J., Copping, A. E., Green, R., Greene, D., Jenne, S., Rose, D., and Overhus, D.: Powering the blue economy: Progress exploring marine renewable energy integration with ocean observations, Mar. Technol. Soc. J., 54, 114–125, https://doi.org/10.4031/MTSJ.54.6.11, 2020.
Daewel, U. T. E., Peck, M. A., Kuehn, W., St. John, M. A., Alekseeva, I., and Schrum, C.: Coupling ecosystem and individual-based models to simulate the influence of environmental variability on potential growth and survival of larval sprat (Sprattus sprattus L.) in the North Sea, Fish. Oceanogr., 17, 333–351, https://doi.org/10.1111/j.1365-2419.2008.00482.x, 2008.
Daniault, N., Mazé, J. P., and Arhan, M.: Circulation and mixing of Mediterranean Water west of the Iberian Peninsula, Deep-Sea Res. Pt. I, 41, 1685–1714, https://doi.org/10.1016/0967-0637(94)90068-X, 1994.
de Pascual-Collar, Á., G. Sotillo, M., Levier, B., Aznar, R., Lorente, P., Amo-Baladrón, A., and Álvarez-Fanjul, E.: Regional circulation patterns of Mediterranean Outflow Water near the Iberian and African continental slopes, Ocean Sci., 15, 565–582, https://doi.org/10.5194/os-15-565-2019, 2019.
Drévillon, M., Lellouche, J.-M., Régnier, C., Garric, G., Bricaud, C., Hernandez, O., and Bourdallé-Badie, R.: EU Copernicus Marine Service Product Quality Information Document for the Global Ocean Physics Reanalysis, GLOBAL_MULTIYEAR_PHY_001_030, Issue 1.6, Mercator Ocean International, https://catalogue.marine.copernicus.eu/documents/QUID/CMEMS-GLO-QUID-001-030.pdf (last access: 29 April 2024), 2023a.
Drévillon, M., Fernandez, E., and Lellouche J. M.: Copernicus Marine Service Product User Manual for the Global Ocean Physics Reanalysis, GLOBAL_MULTIYEAR_PHY_001_030, Issue 1.5, Mercator Ocean International, https://catalogue.marine.copernicus.eu/documents/PUM/CMEMS-GLO-PUM-001-030.pdf (last access: 29 April 2024), 2023b.
Escudier, R., Clementi, E., Nigam, T., Aydogdu, A., Fini, E., Pistoia, J, Grandi, A., and Miraglio, P.: Copernicus Marine Service Product Quality Information Document for the Mediterranean Sea Physics Reanalysis, MEDSEA_MULTIYEAR_PHY_006_004, Issue 2.3, https://catalogue.marine.copernicus.eu/documents/QUID/CMEMS-MED-QUID-006-004.pdf (last access: 29 April 2024), 2022.
EU Copernicus Marine Service Product: Mean Volume Transport across sections from Reanalysis, Mercator Ocean International [data set], https://doi.org/10.48670/moi-00247, 2019.
EU Copernicus Marine Service Product: Atlantic- European North West Shelf- Ocean Physics Reanalysis, Mercator Ocean International [data set], https://doi.org/10.48670/moi-00059, 2021.
EU Copernicus Marine Service Product: Atlantic-Iberian Biscay Irish- Ocean Physics Reanalysis, Mercator Ocean International [data set], https://doi.org/10.48670/moi-00029, 2022a.
EU Copernicus Marine Service Product: Mediterranean Sea Physics Reanalysis, Mercator Ocean International [data set], https://doi.org/10.25423/CMCC/MEDSEA_MULTIYEAR_PHY_006_004_E3R1, 2022b.
EU Copernicus Marine Service Product: Global Ocean Physics Reanalysis, Mercator Ocean International [data set], https://doi.org/10.48670/moi-00021, 2023a.
EU Copernicus Marine Service Product: Multi Observation Global Ocean 3D Temperature Salinity Height Geostrophic Current and MLD, Mercator Ocean International [data set], https://doi.org/10.48670/moi-00052, 2023b.
Fasullo, J. T. and Trenberth, K. E.: The annual cycle of the energy budget. Part II: Meridional structures and poleward transports, J. Climate, 21, 2313–2325, https://doi.org/10.1175/2007JCLI1936.1, 2008.
Fofonoff, N. P. and Millard Jr., R. C.: Algorithms for the computation of fundamental properties of seawater. Paris, France, UNESCO, UNESCO Technical Papers in Marine Sciences; 44, 53 pp., https://doi.org/10.25607/OBP-1450, 1983.
Font, J., Millot, C., Salas, J., Juliá, A., and Chic, O.: The drift of Modified Atlantic Water from the Alboran Sea to the eastern Mediterranean, Sci. Mar., 62, 211–216, https://doi.org/10.3989/scimar.1998.62n3211, 1998.
Friocourt, Y., Levier, B., Speich, S., Blanke, B., and Drijfhout, S. S.: A regional numerical ocean model of the circulation in the Bay of Biscay, J. Geophys. Res., 112, C09008, https://doi.org/10.1029/2006JC003935, 2007.
Greiner, E., Verbrugge, N., Mulet, S., and Guinehut, S.: EU Copernicus Marine Service Product Quality Information Document for the Multi Observation Global Ocean 3D Temperature Salinity Heights Geostrophic Currents and MLD, MULTIOBS_GLO_PHY_TSUV_3D_MYNRT_015_012, Issue 1.2, Mercator Ocean International, https://catalogue.marine.copernicus.eu/documents/QUID/CMEMS-MOB-QUID-015-012.pdf (last access: 29 April 2024), 2023.
Holliday, N. P.: Air-sea interactionand circulation changes in the north-east Atlantic, J. Geophys. Res., 108, 3259, https://doi.org/10.1029/2002JC001344, 2003.
Holliday, N. P., Hughes, S. L., Bacon, S., Beszczynska-Möller, A., Hansen, B., Lavín, A., Loeng, H., Mork, K. A., Østerhus, S., Sherwin, T., and Walczowski, W.: Reversal of the 1960s to 1990s freshening trend in the northeast North Atlantic and Nordic Seas, Geophys. Res. Lett., 35, L03614, https://doi.org/10.1029/2007GL032675, 2008.
Jia, Y.: Formation of an Azores Current Due to Mediterranean Overflow in a Modeling Study of the North Atlantic, J. Phys. Oceanogr., 30, 9, 2342–2358, https://doi.org/10.1175/1520-0485(2000)030<2342:FOAACD>2.0.CO;2, 2000.
Knoll, M., Hernández-Guerra, A., Lenz, B., López Laatzen, F., Machín, F., Müller, T. J., and Siedler, G.: The Eastern Boundary Current system between the Canary Islands and the African Coast, Deep-Sea Res. Pt. I, 49–17, 3427–3440, https://doi.org/10.1016/S0967-0645(02)00105-4, 2002.
Lecci, R., Drudi, M., Grandi, A., Cretì, S., and Clementi, E.: Copernicus Marine Service Product User Manual for Mediterranenan Sea Physics Reanalysis, MEDSEA_MULTIYEAR_PHY_006_004, Issue 2.3, https://catalogue.marine.copernicus.eu/documents/PUM/CMEMS-MED-PUM-006-004.pdf (last access: 29 April 2024), 2022.
Levier, B., Reffray, G., Sotillo, M.G.: EU Copernicus Marine Service Product Quality Information Document for the Atlantic-Iberian Biscay Irish- Ocean Physics Reanalysis, IBI_MULTIYEAR_PHY_005_002, Issue 5.1, Mercator Ocean International, https://catalogue.marine.copernicus.eu/documents/QUID/CMEMS-IBI-QUID-005-002.pdf (last access: 29 April 2024), 2022.
Lozier, M. S. and Stewart, N. M.: On the temporally varying penetration ofMediterranean overflowwaters and eastward penetration ofLabrador Sea Water, J. Phys. Oceanogr., 38, 2097–2103, https://doi.org/10.1175/2008JPO3908.1, 2008.
Machín, F., Pelegrí, J. L., Fraile-Nuez, E., Vélez-Belchí, P., López-Laatzen, F., and Hernández-Guerra, A.: Seasonal Flow Reversals of Intermediate Waters in the Canary Current System East of the Canary Islands, J. Phys. Oceanogr., 40, 1902–1909, https://doi.org/10.1175/2010JPO4320.1, 2010.
Mason, E., Colas, F., Molemaker, J., Shchepetkin, A. F., Troupin, C., McWilliams, J. C., and Sangra, P.: Seasonal variability of the Canary Current: A numerical study, J. Geophys. Res.-Oceans, 116, C06001, https://doi.org/10.1029/2010JC006665, 2011.
Mazé, J. P., Arhan, M., Mercier, H., Volume budget of the eastern boundary layer off the Iberian Peninsula, Deep-Sea Res. Pt. I, 44, 1543–1574, https://doi.org/10.1016/S0967-0637(97)00038-1, 1997.
New, A. L. and Smythe-Wright, D.: Aspects of the circulation in the Rockall Trough, Cont. Shelf Res., 21, 777–810, https://doi.org/10.1016/S0278-4343(00)00113-8, 2001.
Pascual, A., Levier ,B., Sotillo, M., Verbrugge, N., Aznar, R., and Le Cann, B.: Characterization of Mediterranean Outflow Water in the Iberia-Gulf of Biscay-Ireland region, in: von Schuckmann et al. (2018) The Copernicus Marine Environment Monitoring Service Ocean State Report, J. Oper. Oceanogr., 11, S1–S142, https://doi.org/10.1080/1755876X.2018.1489208, 2018.
Peliz, A., Dubert, J., Marchesiello, P., and Teles-Machado, A.: Surface circulation in the Gulf of Cadiz: Model and mean flow structure, J. Geophys. Res.-Oceans, C11015, 112, https://doi.org/10.1029/2007JC004159, 2007.
Pérez, F. F., Castro, C. G., Álvarez-Salgado, X. A., and Ríos, A. F.: Coupling between the Iberian basin-scale circulation and the Portugal boundary current system: a chemical study, Deep-Sea Res. Pt. I, 48, 1519–1533, https://doi.org/10.1016/S0967-0637(00)00101-1, 2001.
Rayner, R., Jolly, C., and Gouldman, C.: Ocean observing and the blue economy, Frontiers in Marine Science, 6, 330, https://doi.org/10.3389/fmars.2019.00330, 2019.
Renshaw, R., Wakelin, S., Golbeck, I., and O'Dea, E.: Quality Information Document for the Atlantic–European North West Shelf- Ocean Physics Reanalysis, NWSHELF_MULTIYEAR_PHY_004_009, Issue 5.2, Mercator Ocean International, https://catalogue.marine.copernicus.eu/documents/QUID/CMEMS-NWS-QUID-004-009.pdf (last access: 5 July 2023), 2021.
Sotillo, M. G., Cailleau, S., Lorente, P., Levier, B., Aznar, R., Reffray, G., Amo-Baladrón, A., Chanut, J., Benkiran, M., and Alvarez-Fanjul, E.: The MyOcean IBI Ocean forecast and reanalysis systems: operational products and roadmap to the future Copernicus Service, J. Oper. Oceanogr., 8, 63–79, https://doi.org/10.1080/1755876X.2015.1014663, 2015.
Sotillo, M. G., Amo-Baladrón, A., Padorno, E., Garcia-Ladona, E., Orfila, A., Rodríguez-Rubio, P., Conti, D., Jiménez Madrid, J. A., de los Santos, F. J., and Alvarez Fanjul E.: How is the surface Atlantic water inflow through the Gibraltar Strait forecasted? A lagrangian validation of operational oceanographic services in the Alboran Sea and the Western Mediterranean, Deep-Sea Res. Pt. II, 133, 100–117, https://doi.org/10.1016/j.dsr2.2016.05.020, 2016.
Tintoré, J., La Violette, P. E., Blade, I., and Cruzado, A.: A study of an intense density front in the eastern Alboran Sea: the Almeria–Oran front, J. Phys. Oceanogr., 18, 1384–1397, https://doi.org/10.1175/1520-0485(1988)018<1384:ASOAID>2.0.CO;2, 1988.
Tonani, M., Ascione, I., and Saulter, A.: Product User Manual for the Atlantic- European North West Shelf- Ocean Physics Reanalysis, NWSHELF_MULTIYEAR_PHY_004_009, Issue 1.3, Mercator Ocean International, https://catalogue.marine.copernicus.eu/documents/PUM/CMEMS-NWS-PUM-004-009-011.pdf (last access: 5 July 2023), 2022.
van Aken, H. M.: The hydrography of the mid-latitude North- east Atlantic Ocean II: The intermediate water masses, Deep-Sea Res. Pt. I, 47, 789–824, https://doi.org/10.1016/S0967-0637(99)00112-0, 2000.
Verbrugge, N.: Copernicus Marine Service Product User Manual for the Multi Observation Global Ocean 3D Temperature Salinity Heights Geostrophic Currents and MLD, MULTIOBS_GLO_PHY_TSUV_3D_MYNRT_015_012, Issue: 1.2, Mercator Ocean International, https://catalogue.marine.copernicus.eu/documents/PUM/CMEMS-MOB-PUM-015-012.pdf (last access: 29 April 2024), 2023.
White, M. and Bowyer, P.: The shelf-edge current north-west of Ireland, Ann. Geophys., 15, 1076–1083, https://doi.org/10.1007/s00585-997-1076-0, 1997.