the Creative Commons Attribution 4.0 License.
the Creative Commons Attribution 4.0 License.
 | 30 Sep 2024 | OSR8 | Chapter 1.2
The state of the ocean in the northeastern Atlantic and adjacent seas
Karina von Schuckmann
Lorena Moreira
Mathilde Cancet
Flora Gues
Emmanuelle Autret
Ali Aydogdu
Lluis Castrillo
Daniele Ciani
Andrea Cipollone
Emanuela Clementi
Gianpiero Cossarini
Alvaro de Pascual-Collar
Vincenzo De Toma
Marion Gehlen
Rianne Giesen
Marie Drevillon
Claudia Fanelli
Kevin Hodges
Simon Jandt-Scheelke
Eric Jansen
Melanie Juza
Ioanna Karagali
Priidik Lagemaa
Vidar Lien
Leonardo Lima
Vladyslav Lyubartsev
Ilja Maljutenko
Simona Masina
Ronan McAdam
Pietro Miraglio
Helen Morrison
Tabea Rebekka Panteleit
Andrea Pisano
Marie-Isabelle Pujol
Urmas Raudsepp
Roshin Raj
Ad Stoffelen
Simon Van Gennip
Pierre Veillard
Chunxue Yang
In this paper, the Copernicus Ocean State Report offers detailed scientific analysis of the ocean under climate change, ocean variability, and ocean extremes in the northeastern Atlantic and adjacent seas. Major results show that the northeastern Atlantic Ocean and adjacent seas have experienced consistent warming, with sea surface temperatures increasing at a rate of 0.25 ± 0.03 °C per decade since 1982, doubling the global average trend. This warming is most pronounced in the Black Sea, Mediterranean Sea, and Baltic Sea. Sea levels have risen significantly over the past 30 years, particularly in the Baltic and Mediterranean seas. Ocean acidification has also increased, with pH decreasing at a rate of −0.017 ± 0.001 units per decade. Marine heatwaves have intensified and expanded, affecting over 60 % of the region in 2022 and 2023. Over the past 16 years, most extreme wind speeds exceeding 22 m s−1 prevailed in the central and subpolar North Atlantic and northern Mediterranean Sea. The region has also seen significant variability in ocean climate indicators and circulation patterns, including increased Atlantic Water transport to the Arctic Ocean through the Fram Strait and notable variations in the Mediterranean Sea's meridional overturning circulation. No major Baltic inflow occurred in winter 2022/23.
- Article
(13422 KB) - Full-text XML
-
Supplement
(686 KB) - BibTeX
- EndNote


The area of the northeastern Atlantic Ocean and adjacent seas begins in the North Atlantic Ocean from the point at 24.58° N, extends east to 68.5° E, and continues due north to the geographical North Pole along the meridian 44° W, including the regional sea areas such as the Mediterranean Sea, the Black Sea, the North Sea, and the Baltic Sea (Fig. 1). The criteria for the choice of this area rely on both oceanic and policy relevant criteria. Specifically, the northeastern Atlantic Ocean and adjacent seas contain all Copernicus Marine areas and cover all European waters. In addition, the area includes the regional seas areas under the UNEP regional seas conventions (https://www.unep.org/explore-topics/oceans-seas/what-we-do/working-regional-seas/regional-seas-programmes/regional-seas, last access: 11 September 2024) (e.g. OSPAR, https://www.ospar.org/, last access: 11 September 2024). The GOOS regional alliances (https://goosocean.org/who-we-are/goos-regional-alliances/, last access: 11 September 2024), such as EuroGOOS (https://eurogoos.eu, last access: 11 September 2024), MONGOOS (https://mongoos.eurogoos.eu/, last access: 11 September 2024), and Black Sea GOOS (https://goosocean.org/who-we-are/goos-regional-alliances/gra-black-sea-goos/, last access: 11 September 2024), are considered as well. The northeastern Atlantic Ocean and adjacent seas also cover the FAO 27 major fishing area (https://www.fao.org/fishery/en/area/27/en, last access: 11 September 2024), as well as the WMO region VI-Europe (https://wmo.int/about-us/regions/europe#:~:text=The%20WMO%20Regional%20Office%20for,on%20society%20and%20the%20environment, last access: 11 September 2024). On the one hand, this choice allows us to consider the ocean dynamics and processes (e.g. to consider full basin approaches for the regional seas). On the other hand, it aligns with various European and international actors at the science–policy interface.
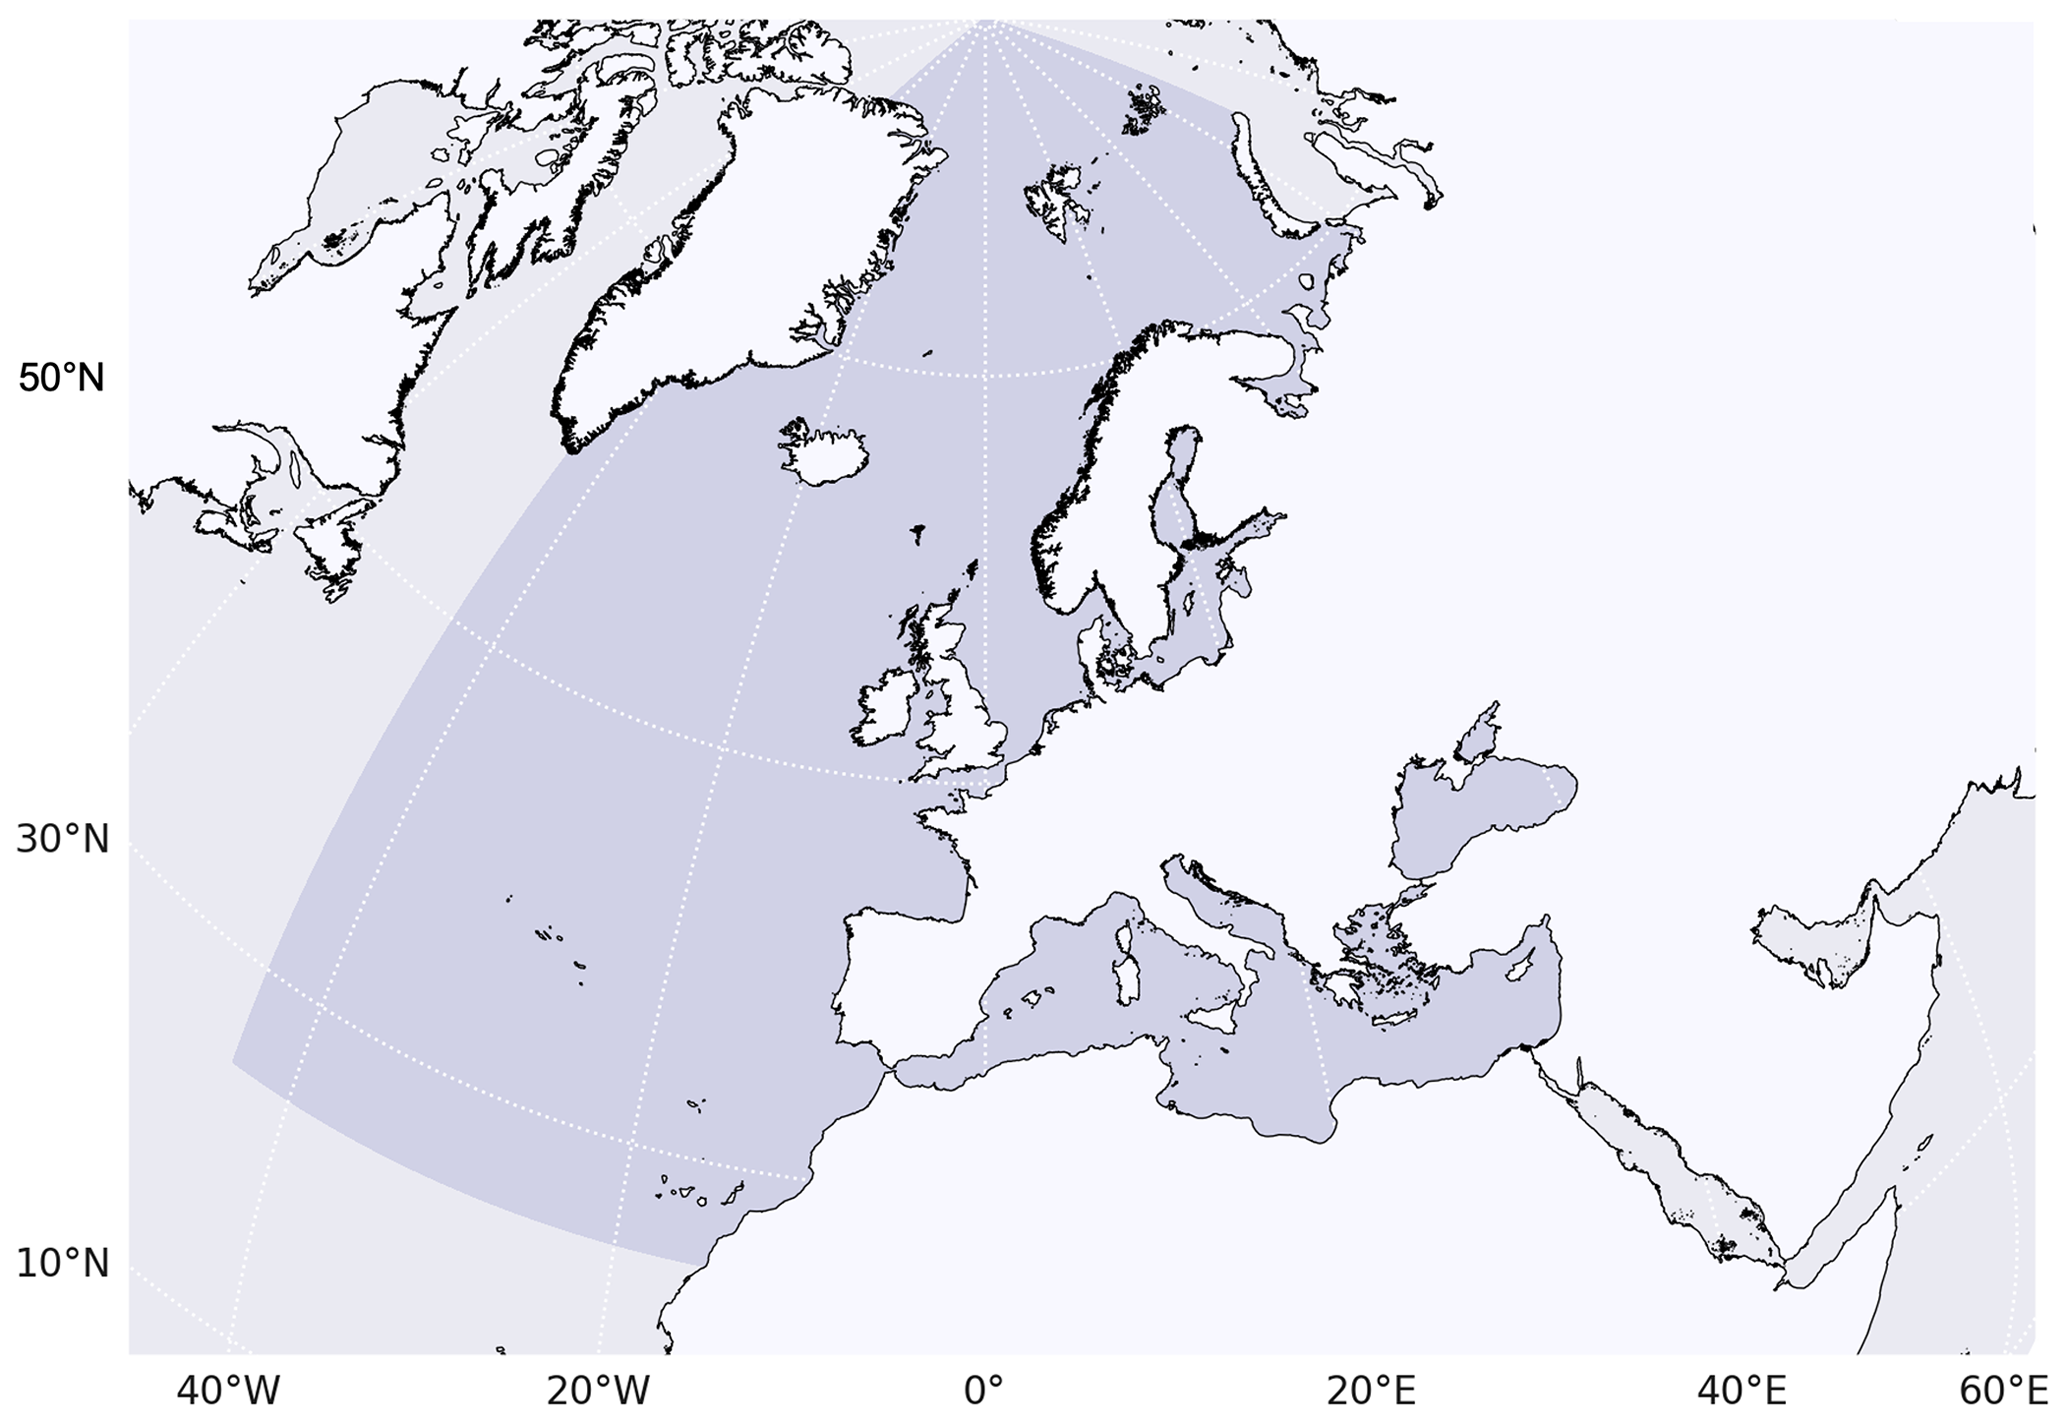
Figure 1Northeastern Atlantic Ocean and adjacent seas region highlighted in blue grey.
Sea surface temperature of the northeastern Atlantic Ocean and adjacent seas shows consistent warming across all ocean subbasins that doubles the global average trend and is most pronounced in the eastern part of the region. Since 1982, the area-averaged sea surface temperature in the northeastern Atlantic Ocean and adjacent seas has been rising at a rate of 0.25 ± 0.03 °C per decade, with the Black Sea, Mediterranean Sea, and Baltic Sea experiencing the most intense warming rates. Overall, nearly the entire western part of the region is warming at least 2 times faster than the global average, while rates gradually decrease when approaching the adjacent large-scale patterns linked to the North Atlantic warming hole in the western part of the region.
The interplay of long-term change and natural variations determine stark variations in ocean warming in the northeastern Atlantic, while the ocean warming trend dominates in the adjacent seas. Large multi-annual- to decadal-scale variations dominate ocean warming in the area-average of the northeastern Atlantic and adjacent seas, as well as in the Iberia–Biscay–Irish area. In the Mediterranean Sea, the Black Sea, and the Baltic Sea, ocean warming dominates at rates exceeding the global mean warming rate.
All ocean areas in the northeastern Atlantic Ocean and adjacent seas have been experiencing sea level rise over the past 30 years as obtained from absolute sea level measurements, particularly in the Baltic Sea and the Mediterranean Sea. Rates of area-averaged sea level rise during the period 1993–2023 in the northeastern Atlantic Ocean and adjacent seas range from 1 ± 0.8 mm yr−1 in the Black Sea, 2.5 ± 0.8 mm yr−1 in the Mediterranean Sea, to 4.1 ± 0.8 mm yr−1 in the Baltic Sea. Regionally, the sea level in 46 % of the ocean area in the northeastern Atlantic Ocean and adjacent seas is rising at a rate larger than the global mean average rate (3.4 mm yr−1 over 1993–2023). Areas of fast sea level rise above the global rate of rise for the last 10 years (mid-2013–mid-2023), estimated to be 4.3 mm yr−1, are observed in the North Atlantic Ocean and in 9 % of the Baltic Sea.
Sea ice coverage in the Baltic Sea does not show a significant trend over the period 1993–2023, and in winter 2022/23 the Baltic Sea experienced a moderate ice season, with 15 % sea ice coverage. The moderate ice season 2022/23 in the Baltic Sea reached a maximum area of about 65 000 km2, which amounts to 15 % of total Baltic Sea ice coverage. Usually, the maximum sea ice extent is reached at the end of February, but in 2023 the maximum ice cover was observed in the second week of March. Although records show a decrease in sea ice extent over the period 1993–2023, the linear trend is not statistically significant.
Regional mean ocean acidification in the northeastern Atlantic Ocean and adjacent seas has continuously increased over the past 37 years (1985–2022), with an observed rate of decrease in ocean pH of −0.017 ± 0.001 pH units per decade. Regional rates of change of ocean pH are not homogenously distributed. About 51 % of the sampled ocean surface in the northeastern Atlantic Ocean and adjacent sea areas is becoming more acidic at a rate of −0.017 pH units per decade. The largest rates of pH decrease are reported in the Mediterranean Sea. In the Baltic Sea and Black Sea, the reporting on ocean acidification is challenged by large uncertainties.
Indicators of ocean climate variability and circulation in the northeastern Atlantic Ocean and adjacent seas all show large variations at interannual to decadal scales, and there is an increase reported in Atlantic Water transport to the Arctic Ocean through the Fram Strait. The meridional overturning circulation in the Mediterranean Sea is stronger in the eastern basin as compared to the western basin, showing stark interannual to decadal change since the late 1980s. The Atlantic Water volume transport in the Nordic Seas show large variations at interannual and decadal timescales. In the Fram Strait, the model data indicates an increase in the Atlantic Water transport to the Arctic Ocean. Major Baltic inflows that determine variations in hydrographic and biogeochemical conditions in the Baltic Sea basin were identified in 1993, 2002, and 2014. There was no major Baltic inflow in winter 2022/23, and in 2023 oxygen was completely consumed below the depth of 75 m.
Since 1982, the frequency, duration, intensity, and regional extension of marine heatwave (MHW) events in the northeastern Atlantic Ocean and adjacent seas have increased, and more than 60 % of the region has experienced at least one strong, severe, or extreme marine heatwave in 2022 and 2023, including areas of European aquaculture activities. From 1982 to 2023, the fraction of the ocean surface in this area that experienced marine heatwave events over the year increased from 20 % to more than 90 %, and since 2013 the cumulative ocean surface fraction affected by strong, severe, and extreme marine heatwave events has been larger than that experiencing moderate events. The duration of the events has also increased, with marine heatwave events of more than 1 month prevailing in the area since 2017. In 2022, about 12 % of the northeastern Atlantic Ocean and adjacent seas have experienced at least one severe to extreme marine heatwave, increasing to about 32 % in 2023. In 2022, the most prominent marine heatwaves lasting for at least 4 months and reaching categories up to severe or extreme are reported for the English Channel and the western Mediterranean Sea. In 2023, the most persistent marine heatwaves are observed in the North Atlantic, lasting 4 months and longer, and in the Adriatic, Ionian, and western Black seas, lasting about 3 months. Severe to extreme categories were reached in all these regions.
In the northeastern Atlantic Ocean and adjacent seas, most extreme ocean surface wind speeds exceeding 22 m s−1 over the past 16 years prevail in the central and subpolar North Atlantic and in the northern Mediterranean Sea. The detection of long-term trends in extreme wind speeds is hampered by their large variability in space and time. Over the period 2007–2023, extreme ocean surface wind speeds in the North Atlantic that exceed more than 22 m s−1 are particularly pronounced along the southern coast of Greenland. Extreme wind speeds also reach about 20 m s−1 in the northwestern Mediterranean Sea. In September 2023, Storm Daniel, which occurred in the Mediterranean Sea, was designated as a Medicane (Mediterranean hurricane) and had devastating impacts on the Greek and Libyan coasts, causing an overwhelming amount of loss and damage in Libya. During the autumn to winter season, larger areas of higher storm density are reported as compared to the spring to summer seasons, such as in the North Atlantic across 40° N from the Canadian coast to the coast of Europe and in all adjacent seas.
2.1 Sea surface temperature
Monitoring changes in regional sea surface temperature is essential for evaluating climate variability and its regional impacts. Over more than the past quarter of a century, a major fraction of the surface ocean in the northeastern Atlantic Ocean and adjacent seas has been warming at rates that are equal to or higher than the global rate (WMO, 2023).
Over the past 4 decades (1982–2023), the Mediterranean Sea surface temperature warmed at a rate of 0.41 ± 0.01 °C per decade, corresponding to a mean surface temperature warming of about 1.7 °C. The spatial pattern of the Mediterranean Sea surface temperature trend shows a general uneven warming tendency following an eastward increased tendency. The strongest surface warming is reported in the eastern Mediterranean Sea, such as in the Adriatic, Aegean, Levantine, and Ionian seas (MedECC, 2020b). Between 2022 and 2023, the Mediterranean Sea experienced an exceptionally long-lasting and intense marine heatwave that hit the whole basin. This marine heatwave started in May 2022, when the mean anomaly increased abruptly from −0.1 ± 0.2 °C (April) to 0.8 ± 0.1 °C (May), reaching the highest values during June (1.7 ± 0.1 °C) and July (1.45 ± 0.07 °C) and persisting until spring 2023 (Marullo et al., 2023).
The Baltic Sea sea surface temperature is rising at a rate of 0.38 ± 0.04 °C per decade (over the period 1982–2023), which represents an average warming of about 1.60 °C. Sea surface warming in the Baltic Sea is characterized by a distinct north–south gradient, and the largest increase in sea surface temperature has been reported for the northern part of the Gulf of Bothnia, the Gulf of Finland, the Gulf of Riga, and the northern part of the Baltic Proper (Meier et al., 2022; von Storch et al., 2015). A long-term increase in surface ocean temperature has also been detected in the North Sea at rates exceeding the global mean values (Huthnance et al., 2016). The rise in sea surface temperature in areas of so-called Large Marine Ecosystems has even been classified within a “superfast warming category”, such as for those located in the Norwegian Sea, North Sea, and along the Celtic-Biscay Shelf (Kessler et al., 2022).
The Black Sea is experiencing the most intense sea surface temperature trend among the European seas, estimated at 0.65 ± 0.02 °C per decade (period: 1982–2023), which corresponds to an average increase of about 2.7 °C during the last 42 years. Together with the Baltic and the Mediterranean seas, the Black Sea represents a hot spot of global warming, where the surface warming trend largely exceeds both the northeastern Atlantic Ocean and adjacent seas and the global mean sea surface temperature trend (0.25 ± 0.03 and 0.13 ± 0.01 °C per decade, respectively).
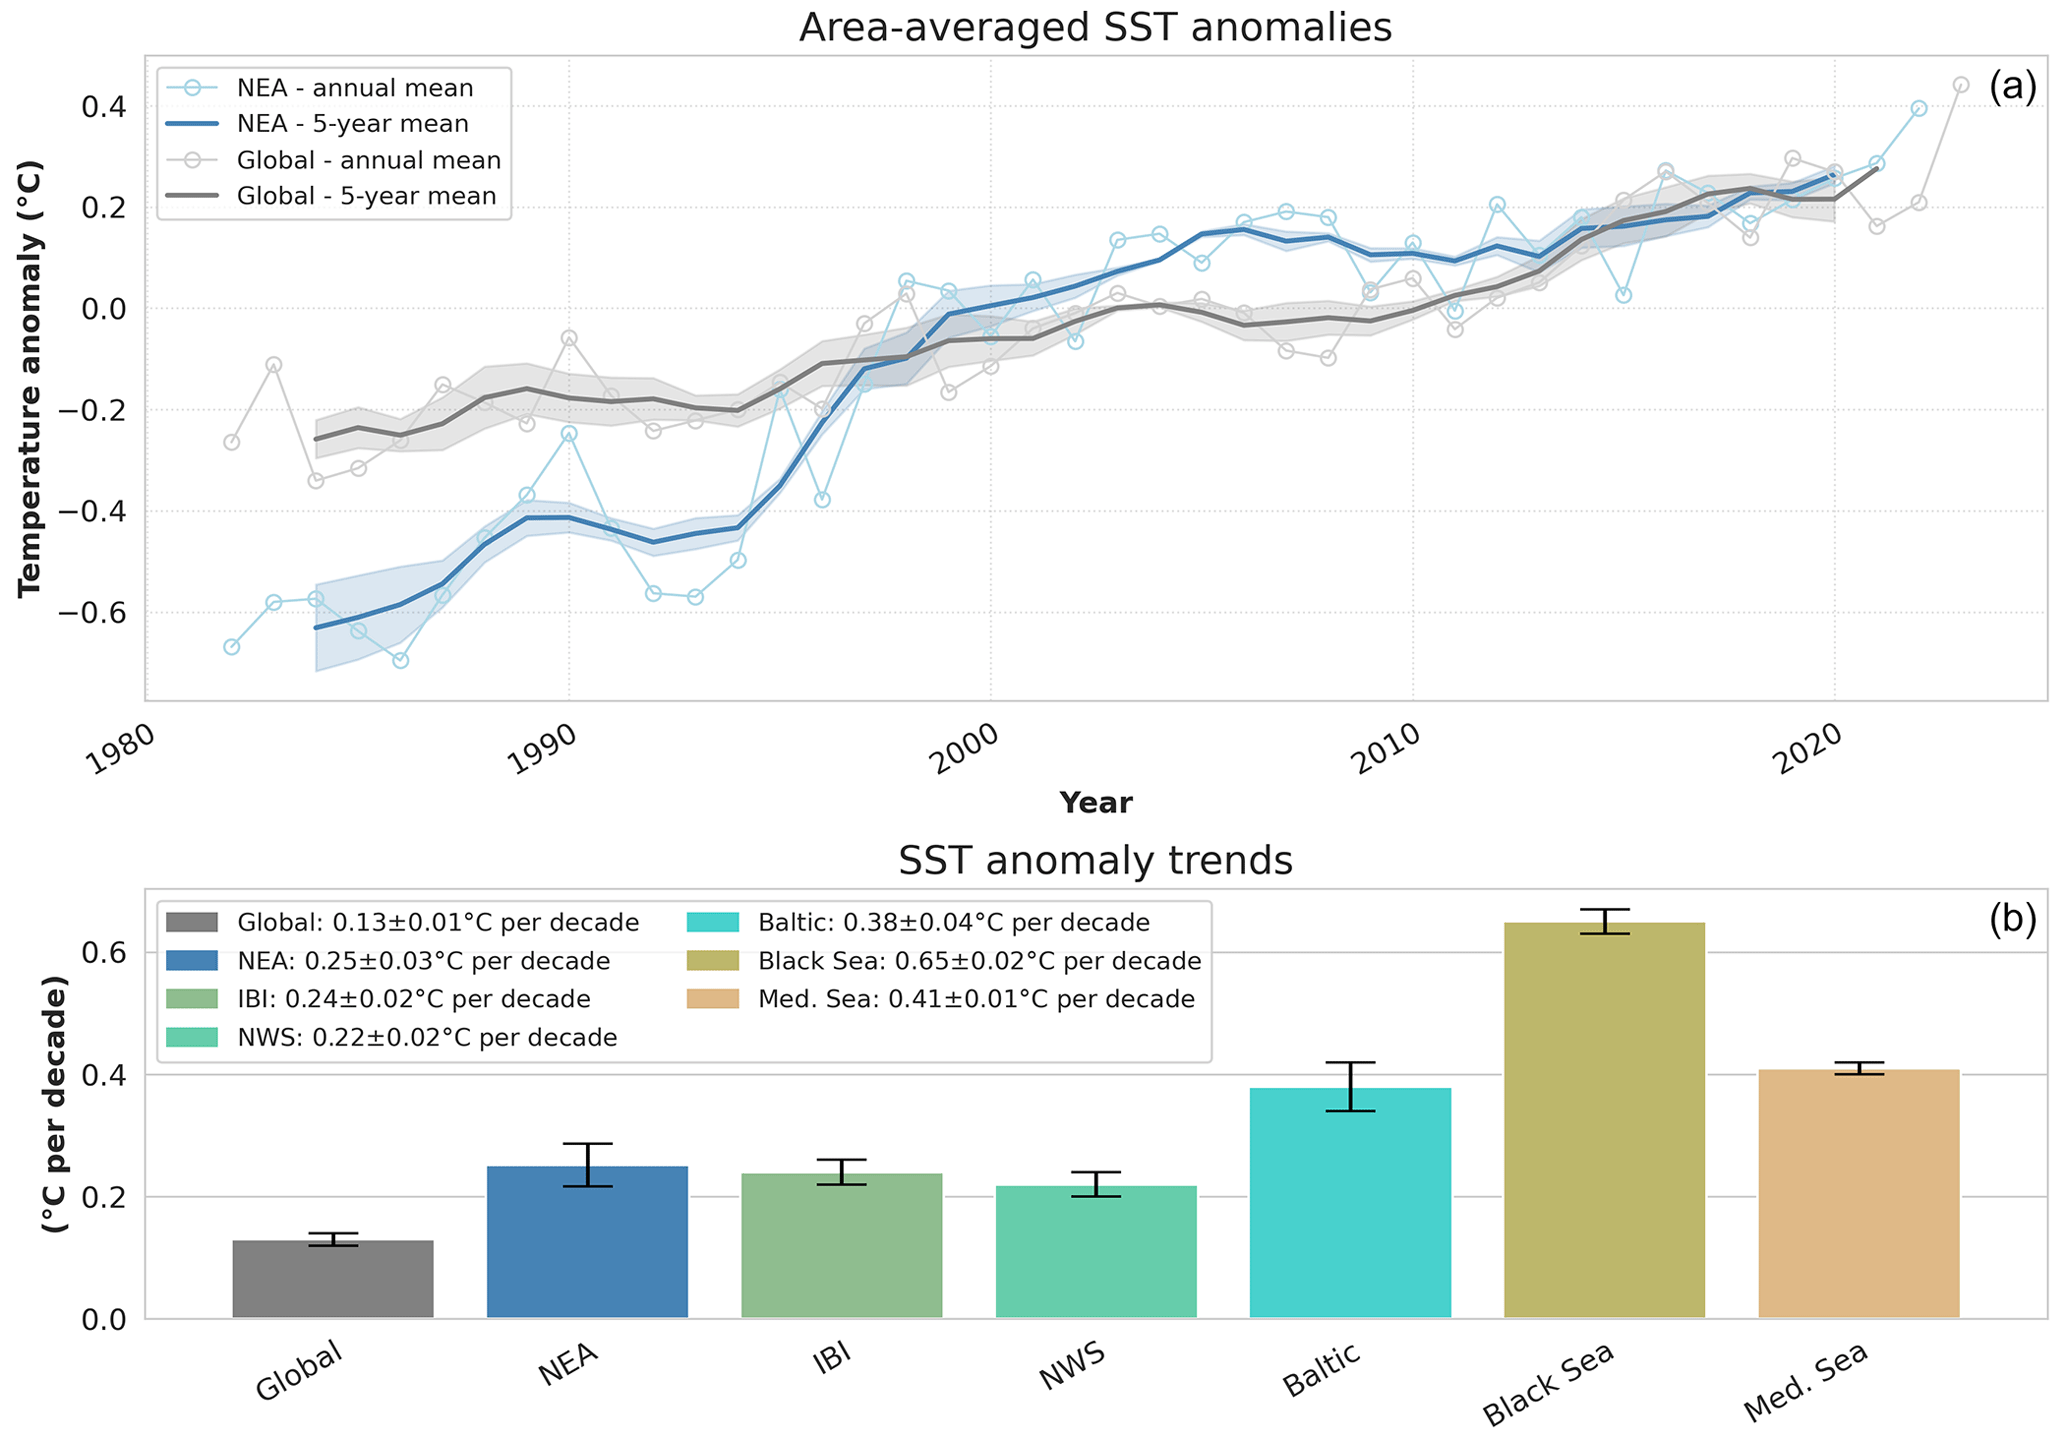
Figure 2(a) Annual (light) and pentadal (bold) data of global (grey) and northeastern Atlantic Ocean and adjacent seas (blue) mean sea surface temperature anomalies (relative to the 1991–2020 baseline) as derived from the product ref. SST.3 (see Supplement). The shaded areas indicate the 2σ envelope using three different products (product refs. SST.1–SST.4) to indicate the agreement between different products. (b) Linear trends (in °C per decade) of area-averaged sea surface temperature over the period 1982–2023 in the global ocean, the northeastern Atlantic Ocean and adjacent seas (designated here as “NEA”), the Iberia–Biscay–Irish (IBI) area, the European North West Shelf (NWS), the Baltic Sea (Baltic), the Black Sea, and the Mediterranean Sea (Med. Sea). Black bars indicate the 2σ uncertainty. Trends and associated uncertainties are estimated by using the X-11 seasonal adjustment procedure (Pezzulli et al., 2005), except for the northeastern Atlantic Ocean and adjacent seas (“NEA”) region (see Fig. 1), which uses linear least-squares regression. The product used for the global and northeastern Atlantic Ocean and adjacent seas averages is similar to panel (a), and for IBI product ref. SST.7 is used, for the Baltic Sea product ref. SST.8 is used, for the Mediterranean Sea product ref. SST.9 is used, for the NWS product ref. SST.6 is used, and for the Black Sea product ref. SST.10 is used.
The Iberia–Biscay–Irish (IBI) and the European North West Shelf (NWS) seas are characterized by milder warming rates estimated at 0.24 ± 0.02 and 0.22 ± 0.02 °C per decade, respectively. These trends are strongly affected by decadal variability superposed on the long-term trend (Fig. 2).
Variations from interannual to decadal scales play a critical role in shaping the evolution of regional sea surface temperature. Major climate modes affect northeastern Atlantic Ocean and adjacent seas sea surface temperature, such as the Atlantic Multidecadal Oscillation (AMO) or the North Atlantic Oscillation (NAO) (Pisano et al., 2020; Yan and Tang, 2021; Valcheva and Slabakova, 2020; Kniebusch et al., 2019), and can, together with ocean processes and cryosphere–ocean interactions, challenge the detection of long-term trends from global warming. For example, in the Baltic Sea, changes in the interplay of atmospheric circulation and ocean processes (e.g. changes in the frequency of coastal upwelling) have resulted in regional patterns of lower-than-average surface warming, which is manifested northeast of Bornholm up to and along the Swedish coast (von Storch et al., 2015). In the North Sea, changes in sea surface temperature are largely affected by decadal variations driven by water mass exchange from the adjacent northeastern Atlantic, superposing any long-term surface warming trend (Huthnance et al., 2016). In the North Atlantic, the so-called “warming hole” – a large pattern of unusual cold sea surface temperature – is discussed as being driven by ocean processes (e.g. circulation change), air–sea interactions, cryosphere–ocean interactions, and changes in anthropogenic forcing (Li et al., 2022; Allan and Allan, 2019; Caesar et al., 2018; Hu and Fedorov, 2020; Qasmi, 2023; Gutiérrez et al., 2021).
Good knowledge of sea surface temperature spatial patterns and trends is also critical to correctly assess European climate trends and projections, as they determine variations in regional weather and climate at a variety of scales that have societal implications (O'Carroll et al., 2019). For example, knowledge of the temporal evolution of sea surface temperature can provide important handles to increase the predictability of certain events, such as wet and dry extremes in Europe (Ionita et al., 2012, 2015; Volosciuk et al., 2016).
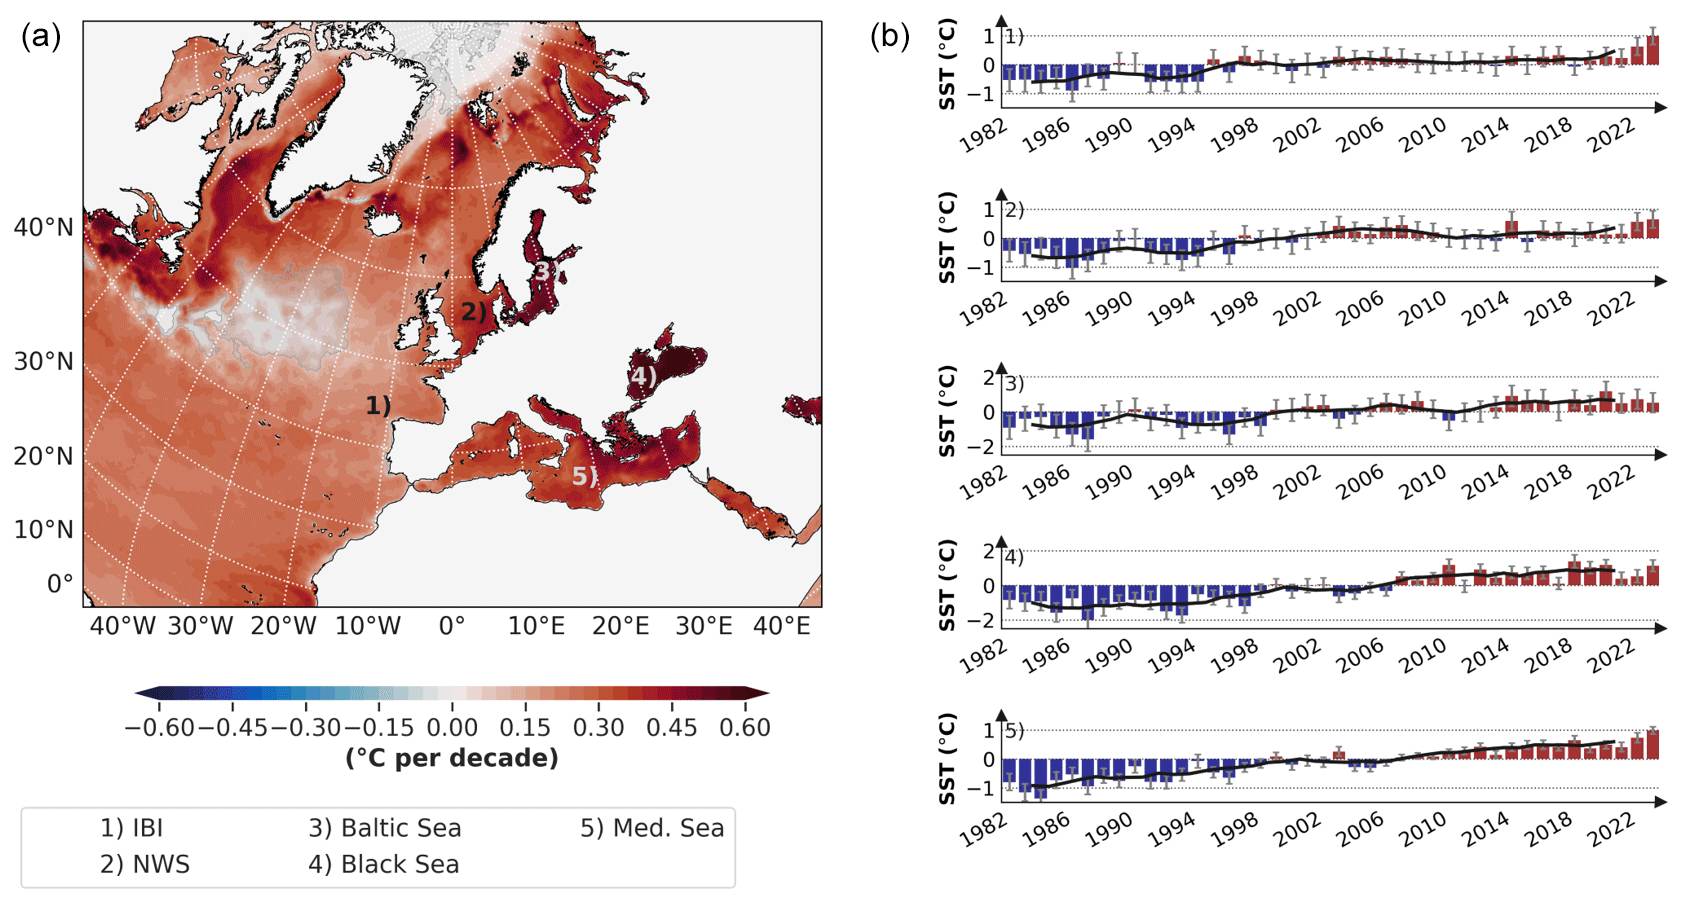
Figure 3(a) Trend of sea surface temperature anomalies (relative to the 1991–2020 baseline) (in °C per decade) for the European regional seas and the North Atlantic over the period 1982–2023 as derived from product ref. SST.3. Grey shading indicates the areas where the trend is not statistically significant. (b) Regional time series of area-averaged sea surface temperature anomalies (relative to the 1991–2020 baseline) for the different regions, i.e. (1) IBI, (2) NWS, (3) Baltic Sea, (4) Black Sea, and (5) Mediterranean Sea (product refs. SST.6–SST.10). Products used for the regional time series are similar to Fig. 4. The black curves show the 5-yearly mean of the sea surface temperature anomalies. The grey ticks on the yearly anomaly bars show the associated uncertainty range.
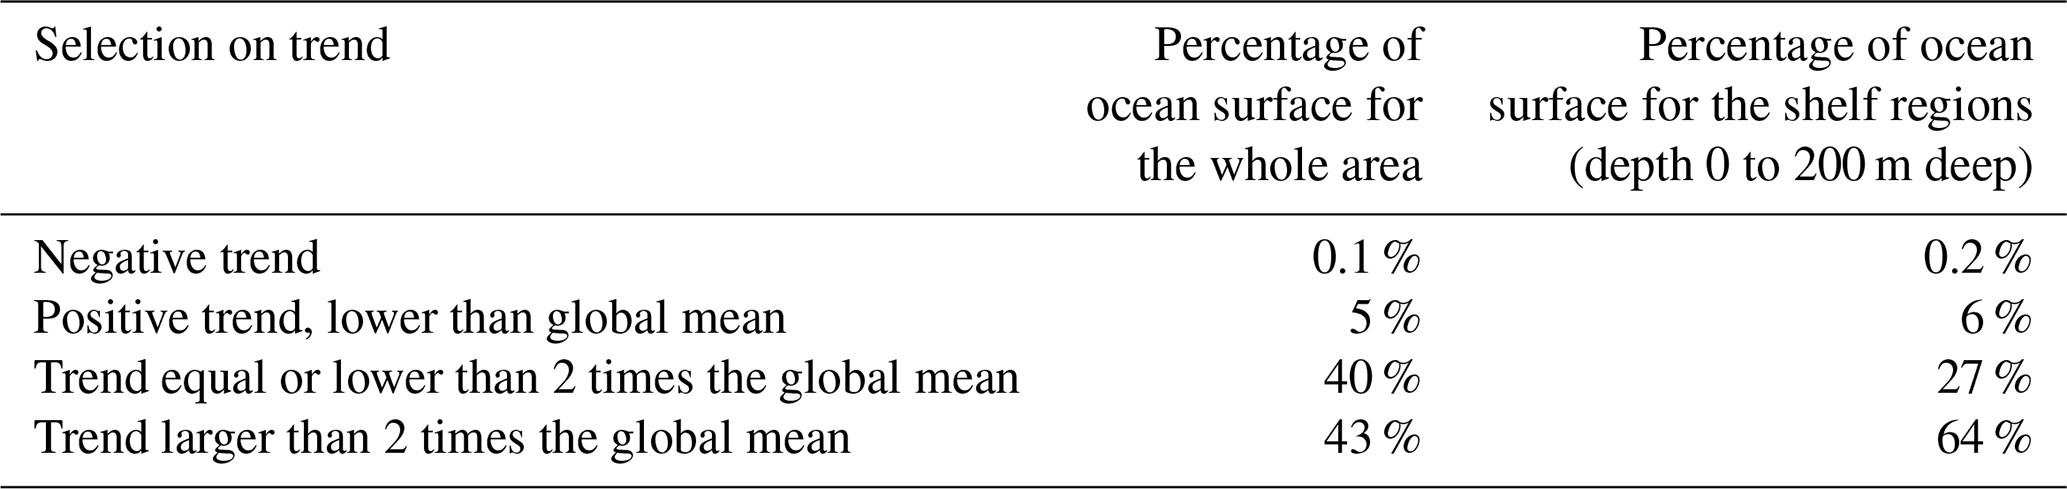
The rise in sea surface temperature is not homogeneous, and the rate of regional surface ocean warming is largest in the eastern part of the European zone and decreases further towards the western part (Fig. 3). The latter is also affected by the extension of the so-called North Atlantic warming hole. However, nearly the entire northeastern Atlantic Ocean and adjacent seas area is affected by an increase in sea surface temperature, and about 43 % of the area is warming at a rate 2 times faster than the global mean warming rate, i.e. in the Mediterranean Sea, North Sea, Baltic Sea, and Black Sea areas (Fig. 4, Table 1).
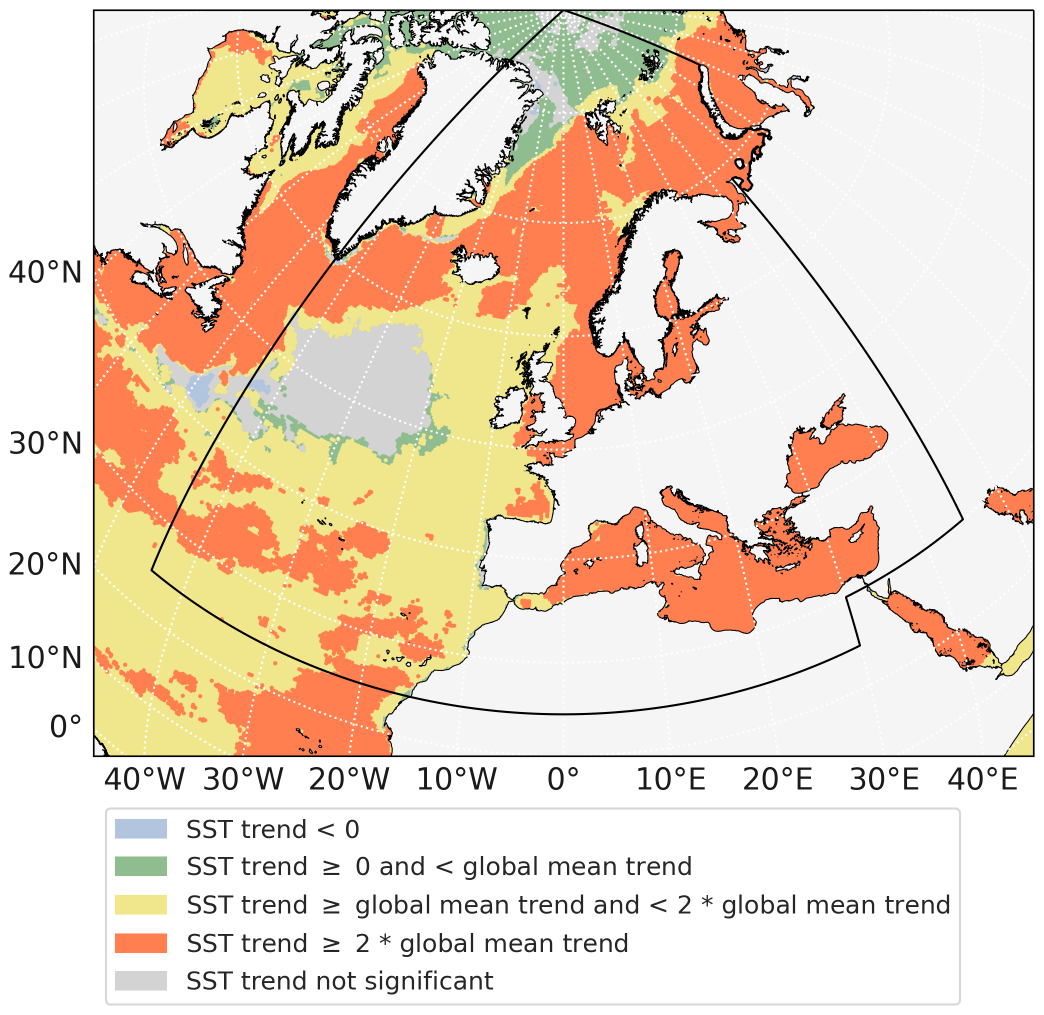
Figure 4Areas where the regional trend is negative (blue), is positive and lower than the global mean sea surface warming trend (green), is equal or less than 2 times the global mean sea surface warming trend (yellow), or exceeds 2 times the global mean sea surface warming trend (orange) as derived from the product ref. SST.3. The grey shading represents areas where the trend is not statistically significant. The black box indicates the northeastern Atlantic Ocean and adjacent seas zone used.
Table 1Percentage of ocean surface affected by different sea surface temperature trends in the northeastern Atlantic Ocean and adjacent seas and when considering only the shallow waters (depth between 0 and 200 m) in the area.
2.2 Ocean heat content
Regional ocean warming is not homogeneous, and the North Atlantic area between 20–50° N has been identified as one of the regions that is affected by unusual strong warming rates as compared to the rest of the global ocean (Cheng et al., 2022, Fig. 5). However, subsurface water temperature changes at various timescales in the subpolar North Atlantic as triggered by several factors, such as anthropogenic warming (Cheng et al., 2022), heat redistribution (Messias and Mercier, 2022), climate variability (e.g. the North Atlantic Oscillation; Hurrell and Deser, 2010), and dynamical processes linked to gyre dynamics and large-scale ocean circulation (Yeager, 2020). In the central subpolar North Atlantic, a decadal-scale cooling of the surface ocean has been reported, also known as the so-called “North Atlantic cold blob” or North Atlantic warming hole (Hansen et al., 2010; Drijfhout et al., 2012; Li et al., 2022; Fan et al., 2023), which impacts North Atlantic storm track activities and weather patterns in Europe (Gervais et al., 2019, 2020; Woollings et al., 2018). The cold blob has been also associated with variations in ocean heat content down to about 1000 m depth (Dubois et al., 2018). Several drivers of the cold blob have been hypothesized, such as evidence for an Atlantic Meridional Overturning Circulation (AMOC) slowdown (Drijfhout et al., 2012; Menary and Wood, 2018; Rahmstorf et al., 2015; Caesar et al., 2018; Chemke et al., 2020), variations in the subpolar gyre circulation (Hu and Fedorov, 2020; Keil et al., 2020; Ma et al., 2020), and changing process at the air–sea interface (Fan et al., 2023; Sanders et al., 2022).
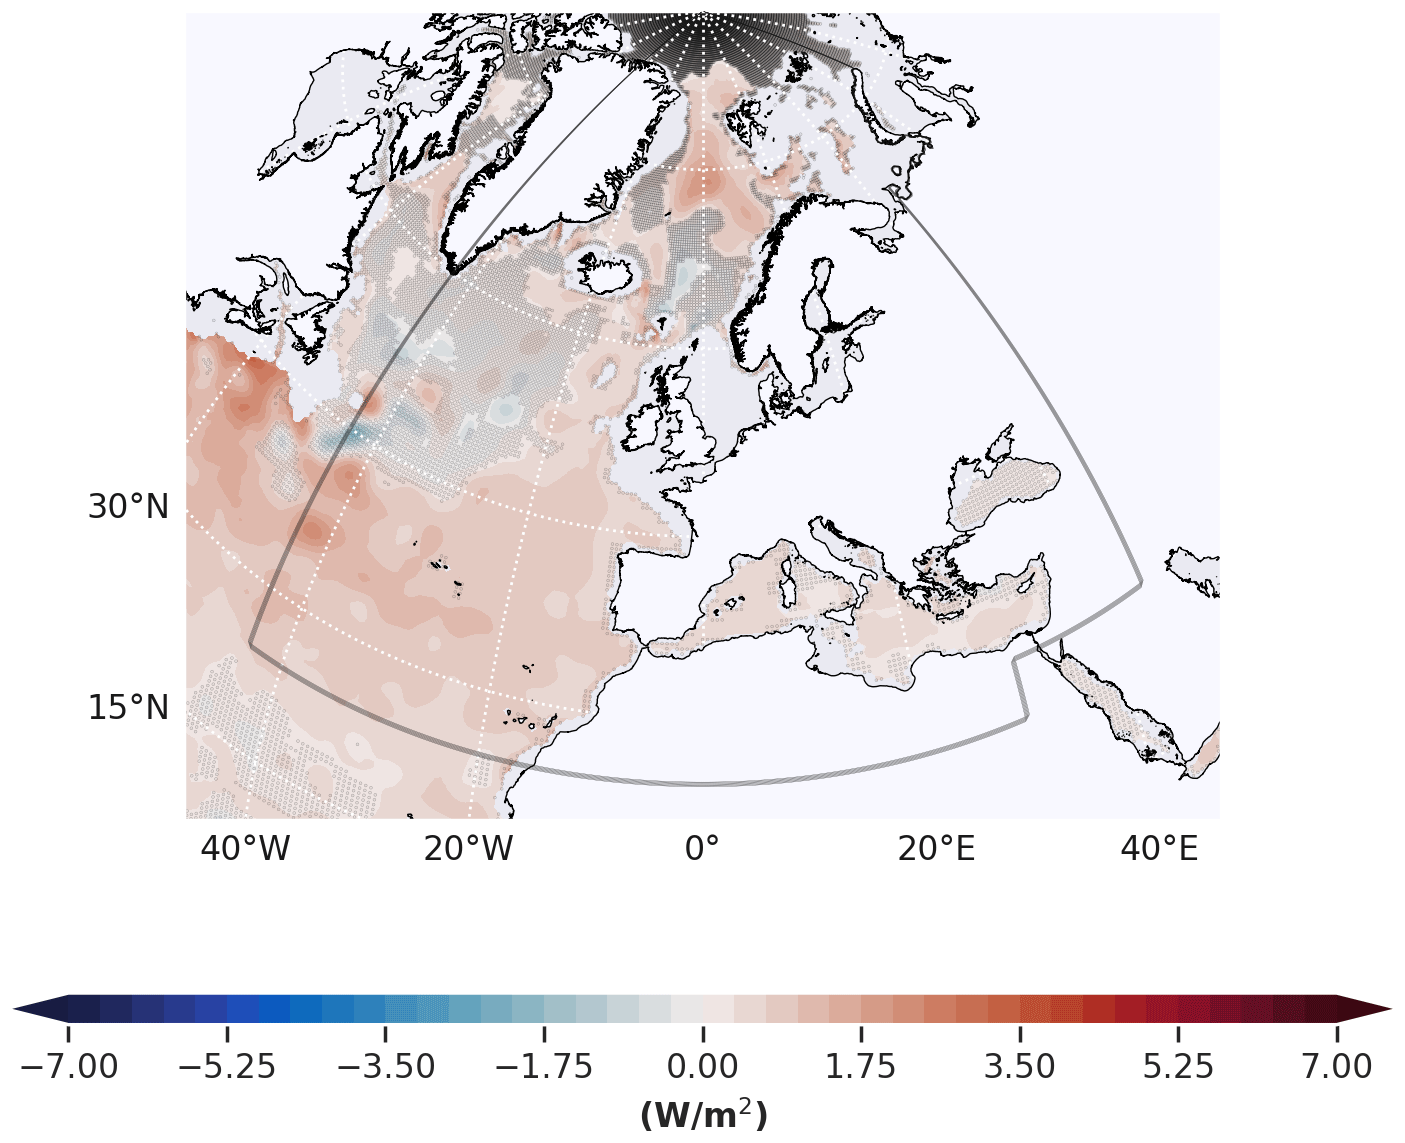
Figure 5Ocean warming regional trends over the period 1960–2023 and integrated over the upper 700 m depth based on the product ref. OHC.3. The shaded grey zones indicate the regions where the noise exceeds the signal of the ensemble product refs. OHC.1–4, indicating the level of disagreement of regional trends in the different products. The bold grey line indicates the study area, i.e. the northeastern Atlantic Ocean and adjacent seas.
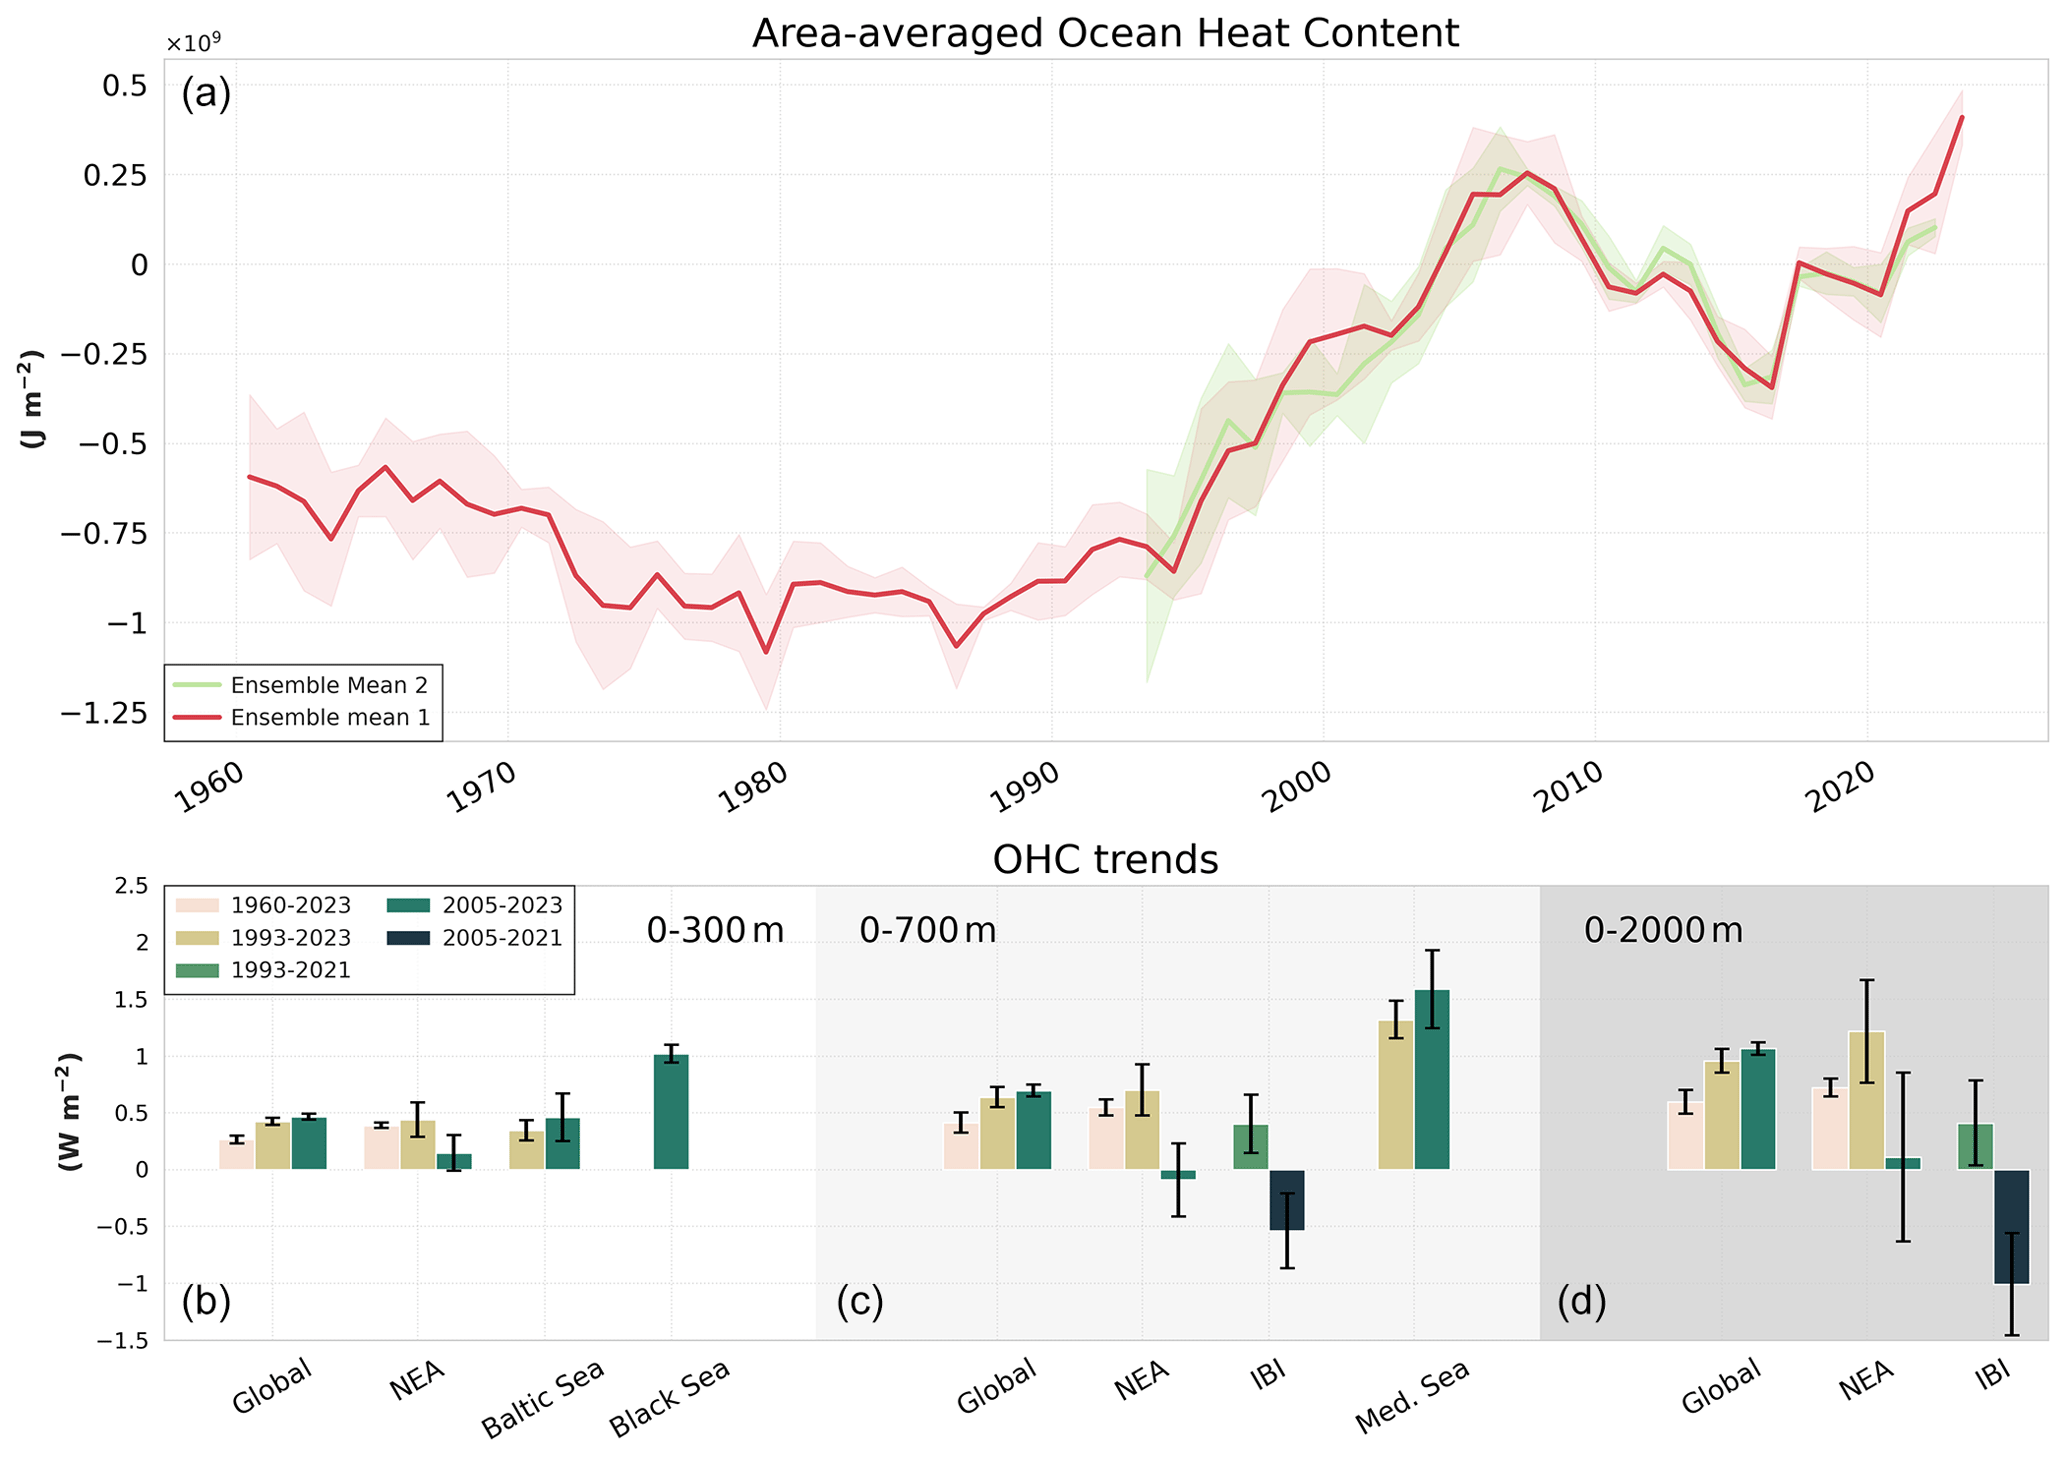
Figure 6(a) Area-averaged ocean heat content in the northeastern Atlantic Ocean and adjacent seas (area indicated in Fig. 5) integrated over the upper 700 m depth based on an observation-based multi-product approach for ensemble 1 (product refs. OHC.1–4) and for the reanalysis-based ensemble 2 (product ref. OHC.8). The shaded areas indicate the ensemble spread. (b–c) Ocean warming trends derived over different periods (long-term: 1960–2023; mid-term: 1993–2023; recent decades: from 2005 onwards) and for different ocean layers (0–300, 0–700, 0–2000 m). Products for the northeastern Atlantic Ocean and adjacent seas area (NEA) include product refs. OHC.1–4; for the Baltic Sea product ref. OHC.9 is used; for the Black Sea product ref. OHC.10 is used; for the Mediterranean Sea product ref. OHC.11 is used; and for the Iberia–Biscay–Irish area product ref. OHC.12 is used. Trends of the global average (ensemble of product refs. OHC.1–2) are added for comparison, and an ordinary least-squares regression is used.
The strong interplay of natural and anthropogenic warming is reflected during the regionalization approach for the ocean warming indicator. Over the period 1960–2023, the area-averaged results for the northeastern Atlantic Ocean and adjacent seas indicate ocean warming at a rate of 0.3 ± 0.1 W m−2 (Fig. 6, ensemble 1). However, temporal changes in ocean warming are strongly affected by natural variations (Fig. 5), and consequently warming rates quantified since the year 2005 are not statistically significant in the northeastern Atlantic and adjacent seas (−0.1 ± 0.4 W m−2, Fig. 6, ensemble 1). The dominant role of large natural variations is also again reflected in the high sensitivity of the ocean warming trend evaluation in this region when considering different time periods (de Pascual-Collar et al., 2023) (Fig. 6).
In the adjacent seas, ocean warming emerges more clearly in the time series. The sea surface of the Black Sea is experiencing the most intense warming since about the 1980s, leading to an average increase of 2.7 °C over the past 42 years (see results on the indicator sea surface temperature in this issue), and basin-wide ocean warming of the upper 300 m shows the highest warming level in the study area over the period 2005–2023 (Fig. 6). Whether this high level is the result of both the ongoing warming trend and natural variability, which is known to play a central role (Lima et al., 2020, 2021), remains a matter of research (Cheng et al., 2024), with a marked increase over the past few decades (Pinardi et al., 2015; Simoncelli et al., 2018; von Schuckmann et al., 2016; Fig. 6).
2.3 Sea level
At a regional scale, the sea level trends show spatial patterns, with regions rising at a faster or slower rate than the global mean rates or even dropping in some areas. The regional sea level trends depart from the global mean sea level rise as a result of the superposition of geographical trend patterns caused by different processes (Cazenave and Moreira, 2022). For example, the sea level trends in the Mediterranean Sea differ from global mean trends as a result of the semi-enclosed conditions of the Mediterranean Sea (Pinardi et al., 2014). The process contributing to the regional variability in sea level trends are regional changes in ocean circulation, temperature, and salinity (stereodynamic changes); redistribution of ocean water mass by the ocean circulation (manometric changes); atmospheric loading; and changes in Earth gravity, Earth rotation, and viscoelastic solid Earth deformation (GRD) due to ongoing changes in the solid Earth caused by past changes in land ice (GIA) and contemporary changes in the mass of water stored on land as ice sheets, glaciers, and land water storage (GRD sea level fingerprints) (Gregory et al., 2019).
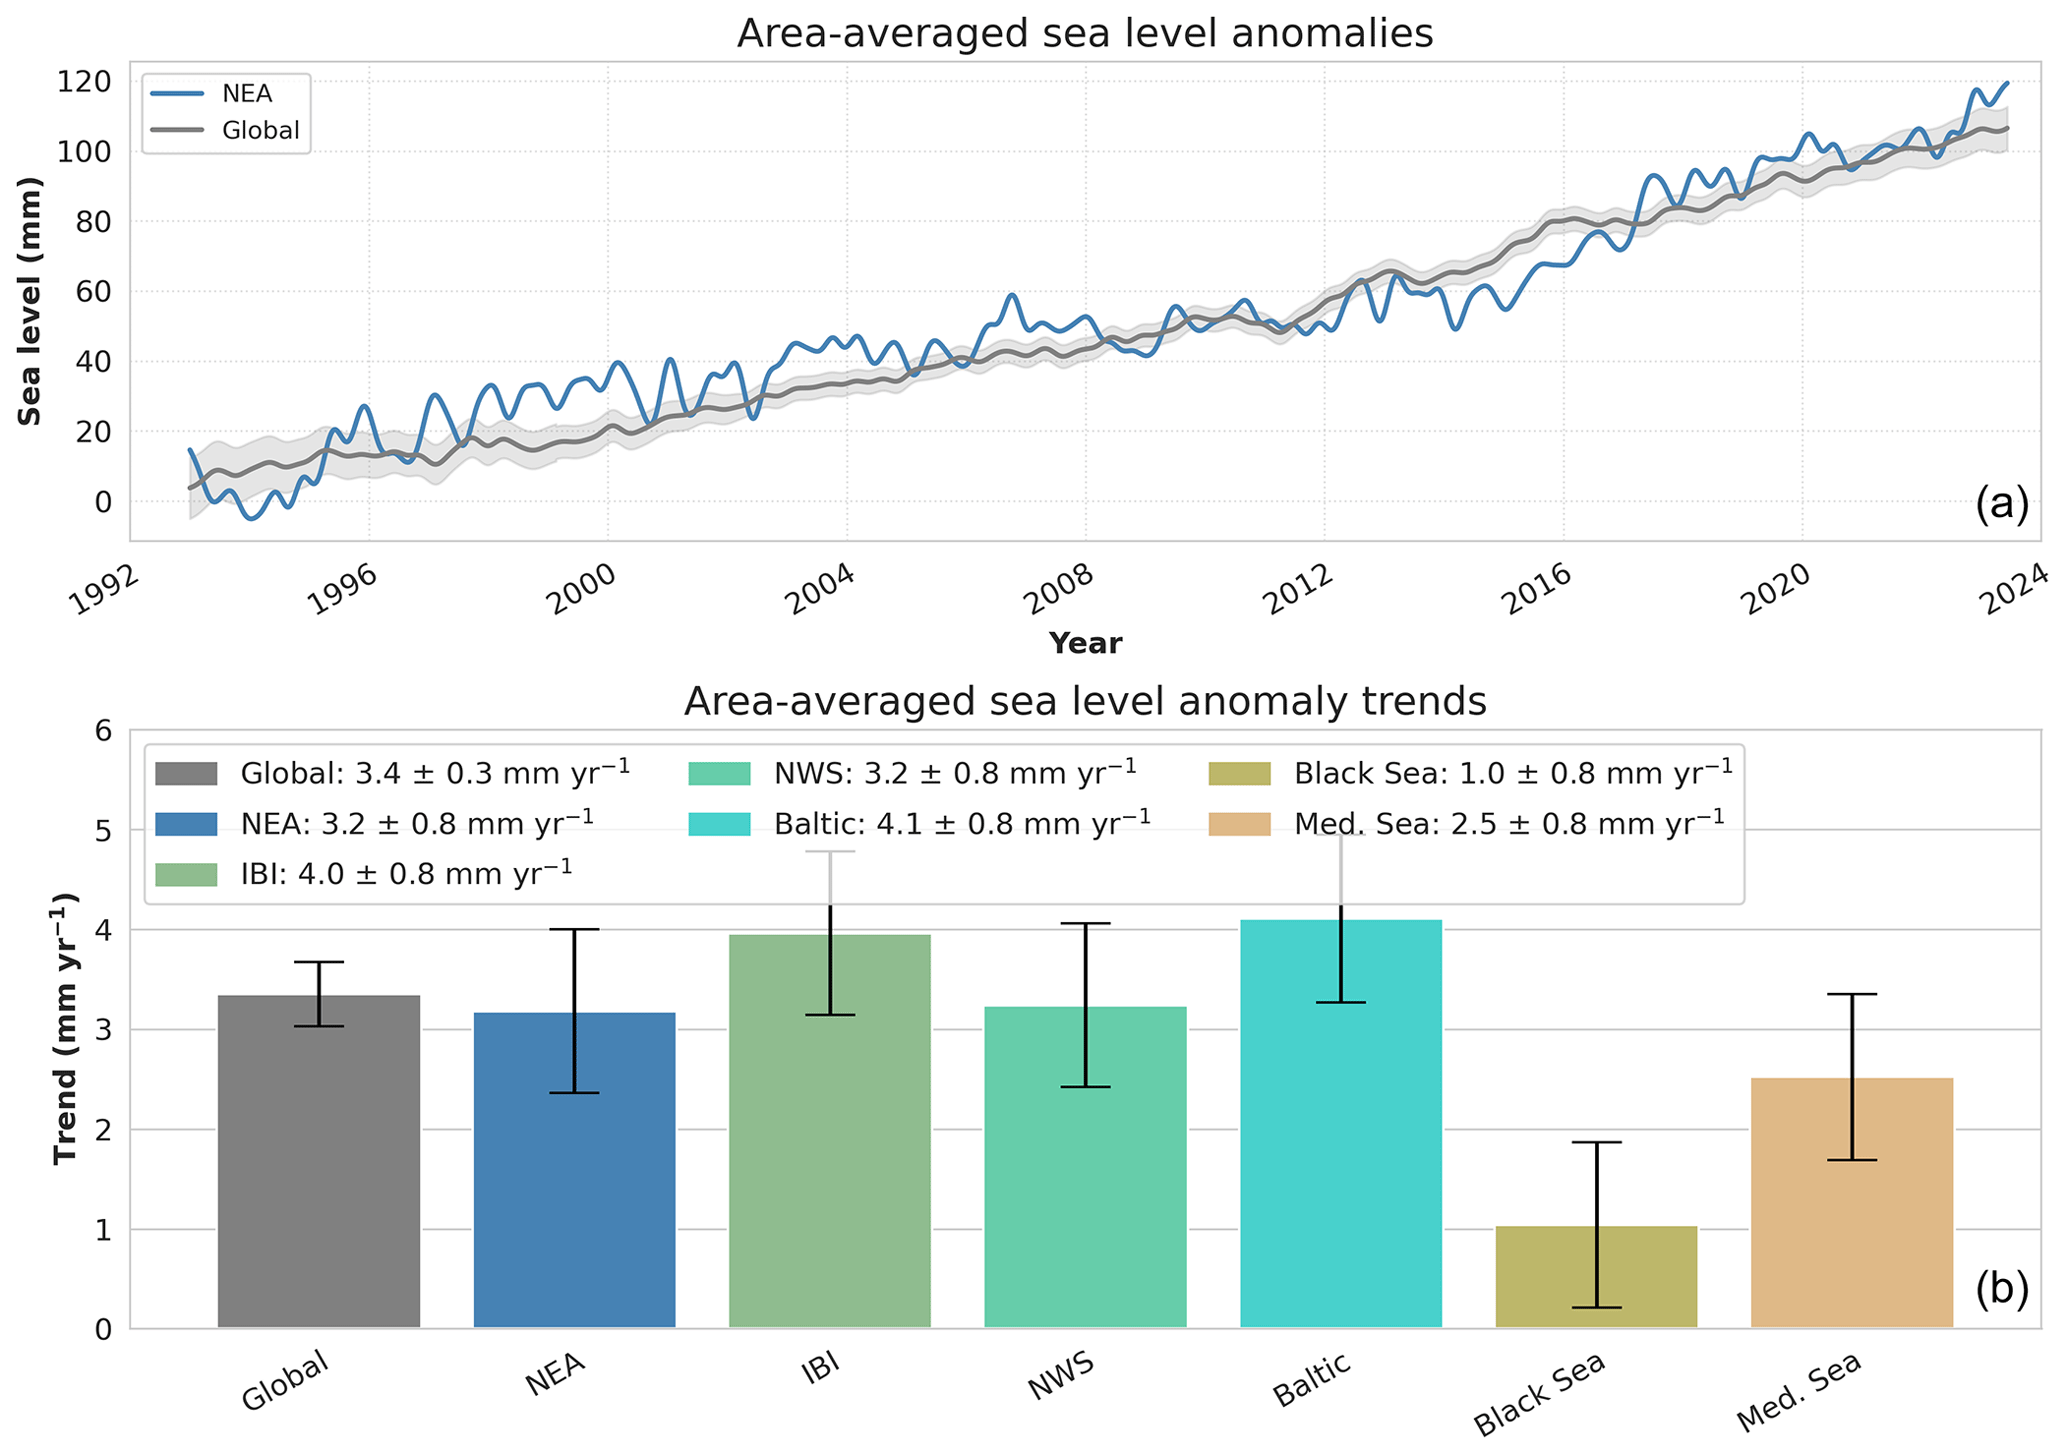
Figure 7(a) Global (product ref. SL.1, grey curve) and northeastern Atlantic Ocean and adjacent seas (blue curve) mean sea level time series from January 1993 to June 2023. The shaded grey envelope shows the uncertainty of the global mean sea level time series. The time series have been adjusted from the seasonal cycle, low-pass-filtered (175 d cut-off), and corrected for GIA (Spada and Melini, 2019) and Topex-A drift (Ablain et al., 2017). The area average for the northeastern Atlantic Ocean and adjacent seas region (NEA) is indicated in Fig. 5 (black box). (b) Linear trends (in mm yr−1) and associated uncertainties (black bars) for the global ocean, northeastern Atlantic Ocean and adjacent seas (NEA), the Iberia–Biscay–Irish (IBI), the North West Shelf (NWS), Baltic Sea, Black Sea, and Mediterranean Sea, shown as area-averaged sea level (product ref. SL.3-SL.7) time series from January 1993 to June 2023.
Depending on the measurement technique used, different information on sea level change can be obtained. For example, relative sea level as obtained from tide gauges is referred to the height of the sea surface relative to the sea floor, and thus to land, at a given location. Sea level from the satellite is linked to the so-called absolute sea level, which is the height of the sea surface at a given location relative to the reference ellipsoid. At a regional scale, these are important concepts allowing for further understanding on the causes of sea level change. For example, in the Baltic Sea the rise in absolute sea level has been assessed to a rate of 1.3 to 1.8 mm yr−1 over the period 1993–2010 (Hünicke et al., 2015; The BACC II Author Team, 2015), whereas relative sea level in the Baltic Sea shows the lowest increase as compared to other ocean areas in Europe due to land uplift (Ranasinghe et al., 2021; Vousdoukas et al., 2017). The Baltic Sea is strongly affected by vertical land motion, especially due to the GIA caused by the melting of past ice sheets (Ludwigsen et al., 2020), and relative sea level trends have been shown to be strongly negative (Passaro et al., 2021). Accordingly, the IPCC (2021a) projected that relative sea level will rise in all European areas except for the Baltic Sea. However, absolute sea level trends show statistically significant positive trends (Fig. 7) (Passaro et al., 2021).
A recent assessment report for the Mediterranean climate has reported a mean sea level rise of 6 cm over the past 20 years, and this trend is likely to accelerate (with regional differences) by the global rate of 43 to 84 cm until 2100 (MedECC, 2020c). In the North Sea, an absolute mean sea level trend of 2.61 ± 0.95 mm yr−1 has been reported over the period 1995–2019, which varies regionally between 1.5 and 3.5 mm yr−1 over the region, with the highest trends in the German Bight and around Denmark and lower trends around the southern part of Great Britain (Dettmering et al., 2021). Sea level change in the northeastern Atlantic up to the European shelf area is known to be largely affected by variations driven by ocean dynamics and processes at the air–sea interface, which have induced large sea level variations at decadal and smaller timescales, superposing the long-term trend in this area (Chafik et al., 2019). In the Black Sea, a recent study has reported a mean rate of total sea level rise of 2.5 ± 0.5 mm yr−1 over the entire basin (Avşar and Kutoglu, 2020), with large interannual- to decadal-scale variations driven by climate variability, freshwater fluxes from land, and sea level fluctuations in the Mediterranean Sea (Volkov and Wilson, 2019).
The Copernicus Marine Service sea level data for the European regional seas have been adjusted for the TOPEX-A instrumental drift based on Ablain et al. (2017) and adjusted for the GIA using latitude and coastal weighting on the map of GIA trend from Spada and Melini (2019). Therefore, the European weighted-mean GIA corrections amount to −0.49 mm yr−1. At basin level, the correction amounts to 0.21 mm yr−1 in the Baltic Sea, whereas in the Mediterranean Sea it is on the order of −0.21 mm yr−1. On the other hand, in the Black Sea the correction is estimated to 0.08 mm yr−1, and it ranges between −0.5 and −0.69 mm yr−1 in the North West shelf and Iberia–Biscay–Irish regions, respectively.
Most recent Ocean State Report estimates of absolute sea level recorded by altimeters onboard satellites show sea level rise over all the European seas ranging from 1.04 to 4.11 mm yr−1 with uncertainties on the order of 0.8 mm yr−1. However, space-based radar altimetry does not provide reliable sea level data within 20 km of the coast, and the amount of valid data strongly decreases due to land contamination within the radar echo in the vicinity of the coast (Cazenave et al., 2022; The Climate Change Initiative Coastal Sea Level Team, 2020; Vignudelli et al., 2019). The sea level rise presents spatial variations with differences across basins, with the Baltic Sea absolute sea level rising at a faster rate and the Black Sea at a comparably slower pace (Fig. 7).
The northeastern Atlantic Ocean and adjacent seas area-averaged sea level time series (Fig. 7a) presents dominant interannual variability that in this region is dominated by the North Atlantic Oscillation (NAO) (Calafat et al., 2022; Chafik et al., 2019; Meli et al., 2023; Passaro et al., 2021; Volkov and Landerer, 2015). Karimi et al. (2022) showed that the NAO dominates the interannual variations of barystatic sea level in the Baltic Sea, whereas steric sea level plays a key role in decadal variations. Additionally, Chafik et al. (2019) proposed that the decadal sea level changes are driven by steric variability in the subpolar North Atlantic. Masina et al. (2022) presented an anticorrelation between the Mediterranean mean sea level and the upper branch of the Atlantic Meridional Overturning Circulation at 26.5° N.
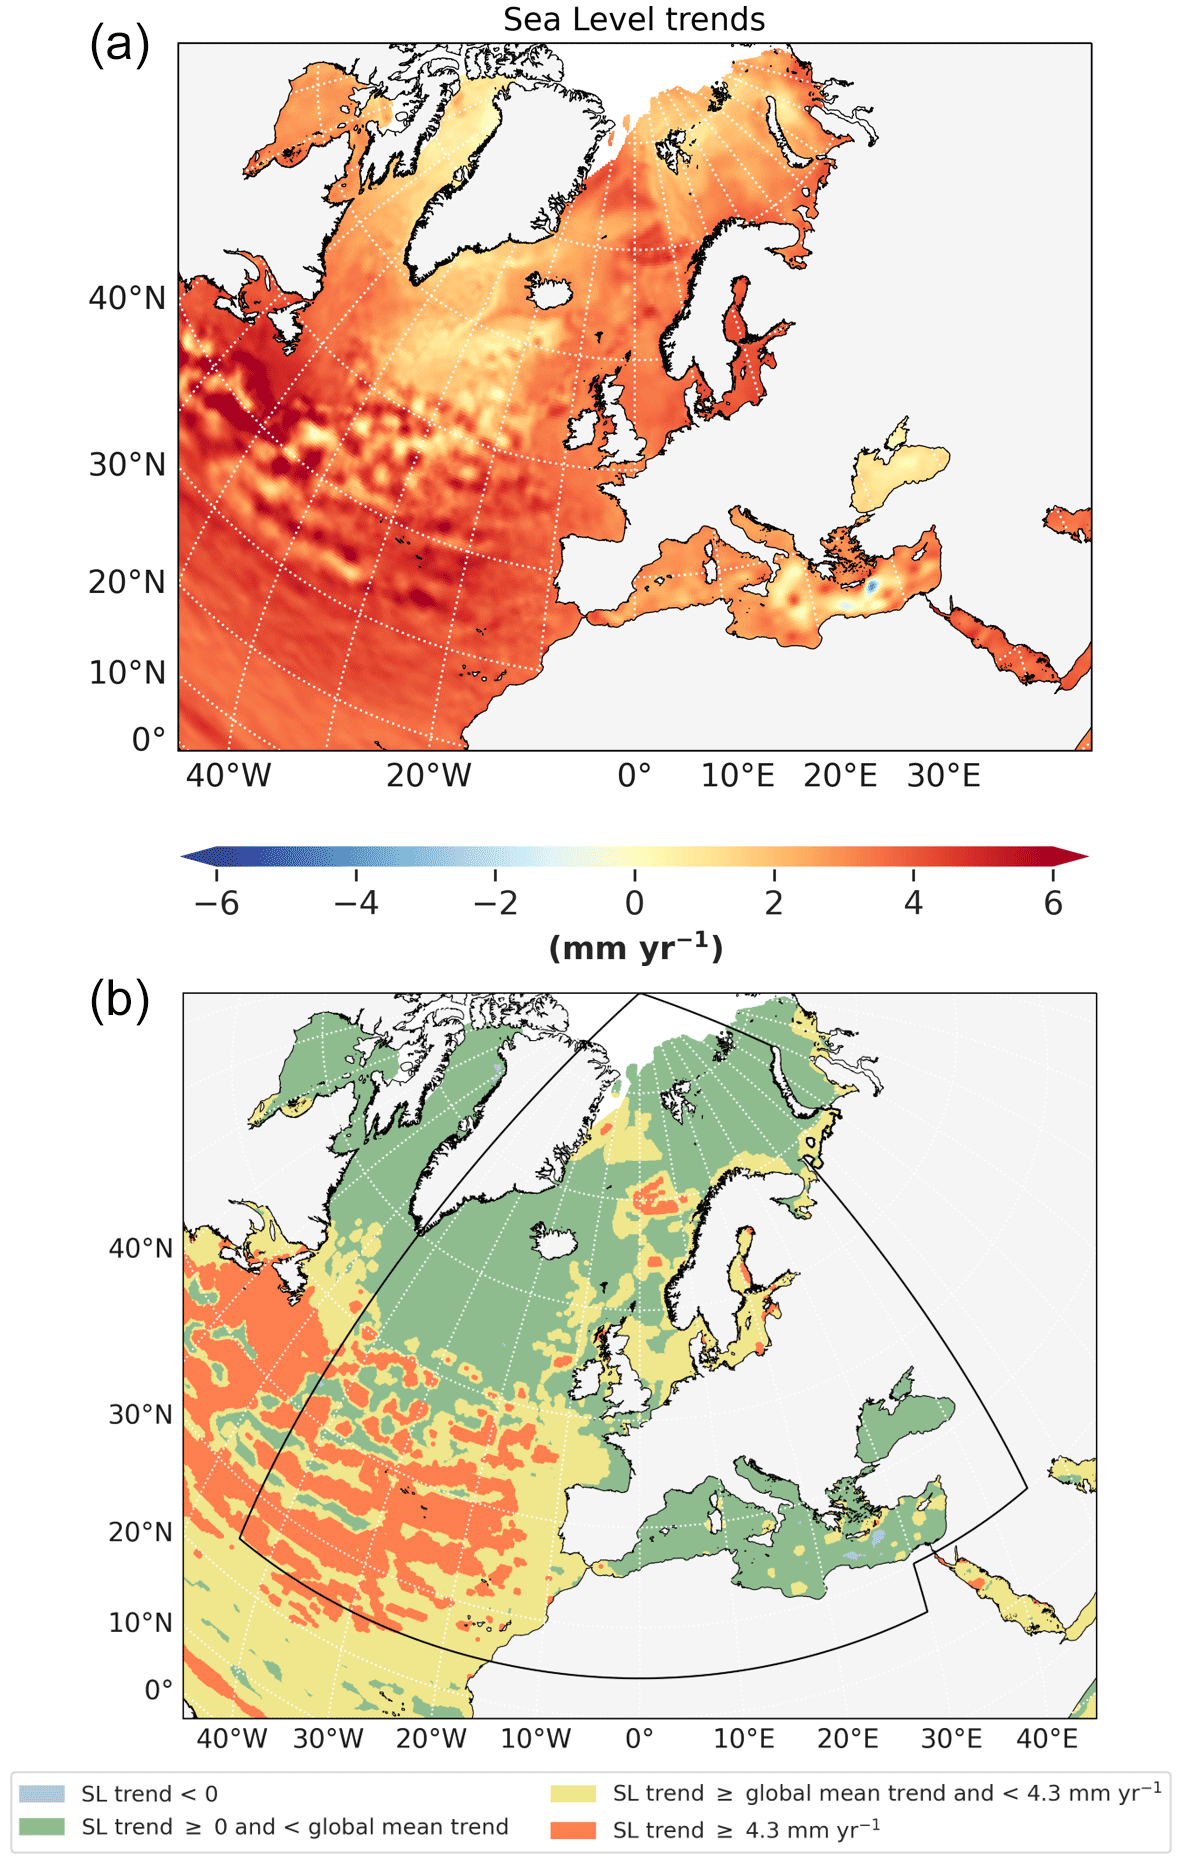
Figure 8(a) Northeastern Atlantic Ocean and adjacent seas sector sea level trends from January 1993 to June 2023 (product ref. SL.2). (b) Shading map indicating the magnitude of the sea level rise rates: blue colour depicts regions with negative sea level trends, green colour indicates areas where sea level is rising slower than the altimetry era global mean sea level rate of rise of 3.4 mm yr−1, yellow colour indicates locations where sea level is increasing at a range between the global mean trend and 4.3 mm yr−1, and orange colour indicates regions where sea level is rising at faster rate than 4.3 mm yr−1, which is the global mean sea level trend estimate over the last 10 years (June 2013–June 2023). The black box indicates the northeastern Atlantic Ocean and adjacent seas zone used. The data used are corrected for GIA (Spada and Melini, 2019) and TOPEX-A drift (Ablain et al., 2017).
Over the January 1993–June 2023 period, the regional rates of rise are positive across the northeastern Atlantic and adjacent seas region, except for some eddy-scale areas in the eastern Mediterranean Sea (Fig. 8a), where negative trends are observed. The rate of sea level rise in the Mediterranean Sea shows spatial variations that reflect changes at basin-scale circulation. Based on data over the altimetry era, Meli et al. (2023) showed that the mass component is the dominant driver in this area, except for in the Levantine and Aegean subbasins, where the steric component is the major contributor to the sea level trends.
In the Black Sea, the major drivers of change have been attributed to steric variability, water mass changes related to the Mediterranean inflow, and freshwater fluxes (precipitation, evaporation, and river discharge) (Tsimplis et al., 2004; Volkov and Landerer, 2015). Most of the Mediterranean Sea and Black Sea are rising a slower rate than the global mean sea level (Fig. 8b). On the other hand, the entire Baltic Sea is rising faster than the global mean sea level trend, estimated to be 3.4 mm yr−1 over 1993–2023. Large areas of the Iberia–Biscay–Irish regional seas and the Gulf Stream region show sea level trends larger than the 4.3 mm yr−1 observed at global level for the last 10 years (June 2013–June 2023; Fig. 8b).
2.4 The Baltic Sea cryosphere
In addition to the polar seas, there are several marine regions around the world where sea ice occurs, such as the Baltic Sea. Sea ice occurs in a wide range of types and forms and significantly and directly affects marine transport and navigation. Specifically, the presence of sea ice cover sets special requirements for navigation, both for the construction of the ships and their behaviour in ice, as in many cases merchant ships need icebreaker assistance (JCOMM Expert Team on Sea Ice, 2017). Variations in sea ice conditions at different timescales in the Baltic Sea can also have implications for regional weather and climate as sea ice influences the way the ocean and atmosphere interact via fluxes of heat, water, or carbon. There is a tight link between surface air temperature and sea ice loss in the Baltic Sea that makes sea ice monitoring a critical climate indicator for this region (Granskog et al., 2006). Changes in sea ice are also known to affect the ecosystem in the Baltic Sea (Pärn et al., 2022; Granskog et al., 2006; Climate Change in the Baltic Sea, 2021; Meier et al., 2022; Eilola et al., 2013). For example, extreme events at the land–sea ice interface that adversely affect infrastructure at the coast happened several times between 2010 and 2019 (Girjatowicz and Łabuz, 2020). They are usually linked to onshore riding up of sea ice from shore to land, i.e. ice ridges, through a combination of specific sea ice conditions, storms, currents, and sea level variations (Leppäranta, 2013).
The importance of sea ice is reflected in the fact that sea ice variations have been monitored regularly in the Baltic Sea since the late 19th century (Meier et al., 2022). Basin-wide assessments have revealed that sea ice in the Baltic Sea undergoes large seasonal and interannual variations, and a long-term trend in sea ice loss has also been observed for this part of the world ocean (Meier et al., 2022; The BACC II Author Team, 2015). In the past, the entire Baltic Sea was covered in ice, as it was in the 1940s (Vihma and Haapala, 2009), whereas in most recent periods only the northern areas of the Baltic Sea are mostly covered in ice (Raudsepp et al., 2020).
Sea ice coverage in the Baltic Sea is strongly seasonal, and sea ice starts to form in October and may last until June of the following year. The ice season 2022/23 had the moderate maximum ice extent in the Baltic Sea and reached a maximum area of about 65 000 km2, which amounts to 15 % of total Baltic Sea ice coverage. Usually, the maximum sea ice extent is reached at the end of February, but in 2023 maximum ice cover was recorded a couple of weeks later (Fig. 9). Although results indicate a decrease in sea ice extent over the period 1993–2023, the linear trend is not statistically significant.
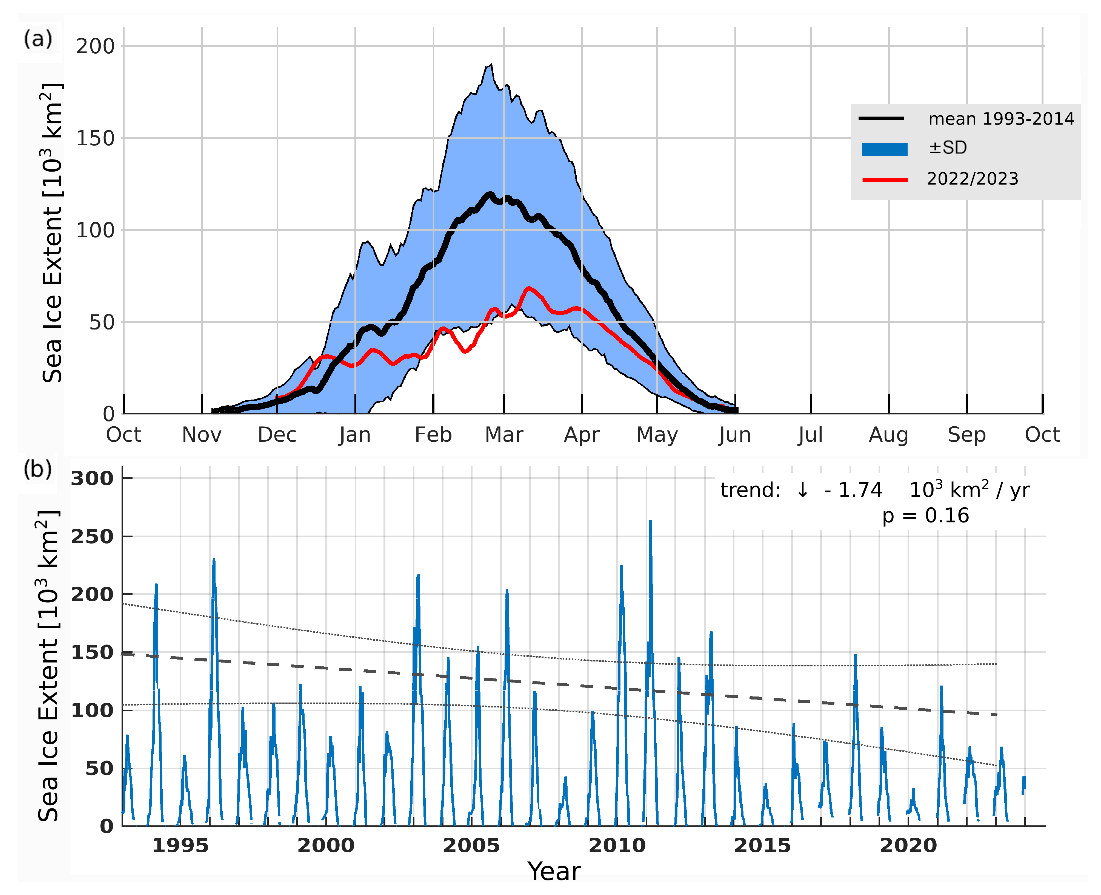
Figure 9(a) Time series of day-of-year averaged sea ice extent derived from remote sensing and in situ observations (product ref. SI.7; Uiboupin et al., 2008; Havsis | SMHI, 2023). Long-term mean (black line) and 1 standard deviation (blue shading) are calculated over the period October 1992–September 2014. Daily sea ice extent is for the 2022/2023 ice season (red line). (b) Time series of the area-integrated daily sea ice extent for the Baltic Sea in 1993–2023. Initial data that consist of remote sensing and in situ observations (product ref. SI.7; Uiboupin et al., 2008; Havsis | SMHI, 2023) are smoothed using 7 d window moving-average filter.
On average, ocean acidification in the northeastern Atlantic Ocean and adjacent seas follows the same path as observed at the global scale, showing a steady decrease in surface pH since 1985 at an average rate on the order of the global mean trend of −0.017 ± 0.001 pH units per decade (Fig. 10). At a regional scale, the map of regional trends of sea surface pH in the northeastern Atlantic Ocean and adjacent seas is not homogeneous and presents geographically varying patterns (Fig. 11). In the open ocean, the main driver of regional ocean surface pH change is predominantly attributed to atmospheric CO2 concentrations (Gehlen et al., 2020). When approaching the coast, additional stressors of industrial or agricultural origin and natural fluctuations from ocean processes (e.g. circulation, coastal upwelling) contribute to variations in ocean pH. For example, nutrient runoff by rivers leads to eutrophication of coastal waters, which can enhance pH variations, particularly in stratified coastal water systems through CO2 uptake (primary production) and release (bacterial respiration) (Carstensen and Duarte, 2019).
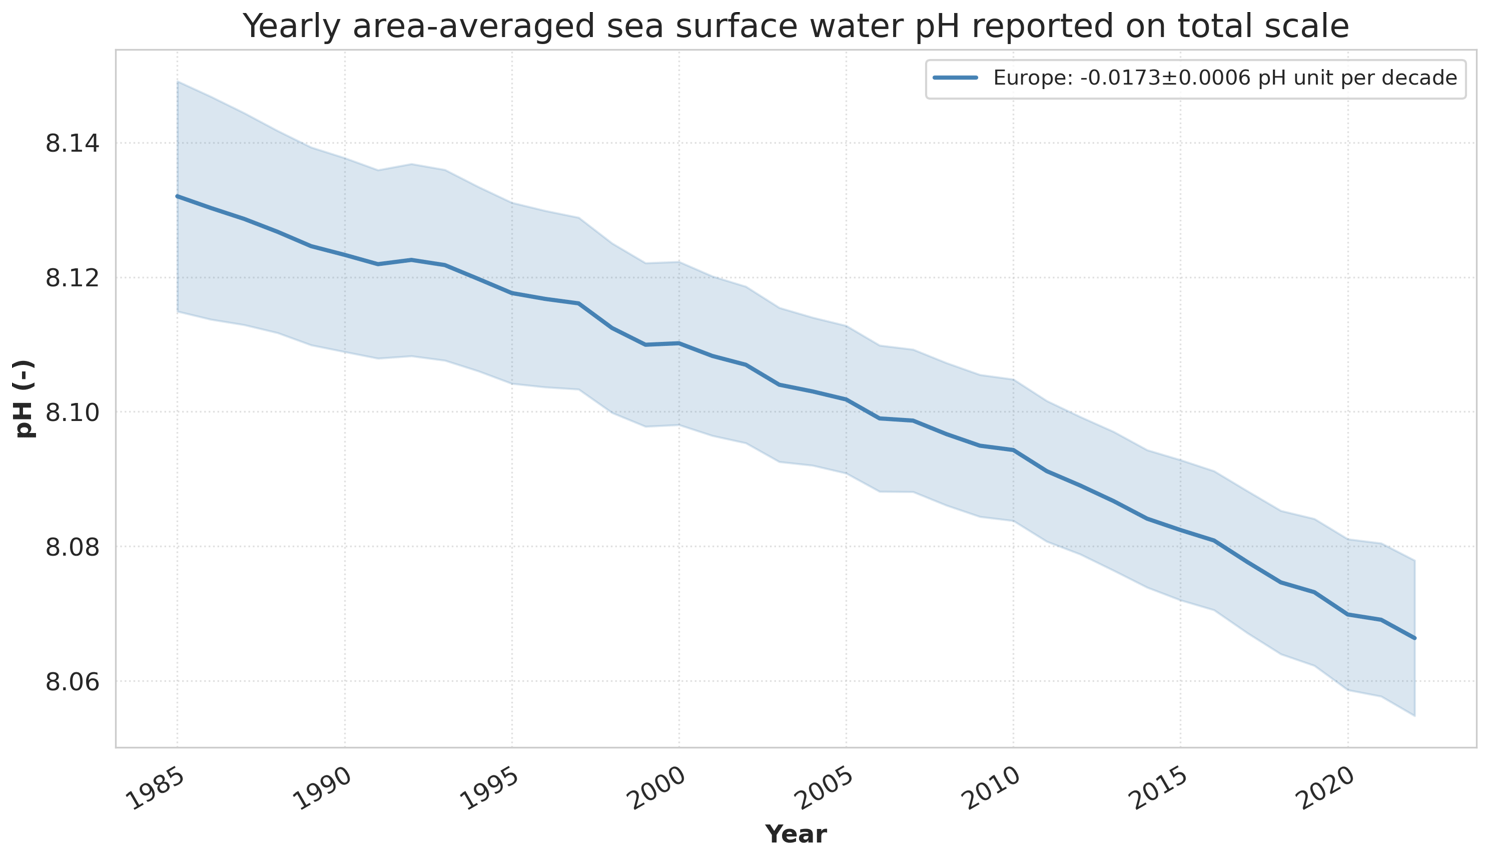
Figure 10Annual mean sea surface water pH reported on a total scale averaged over the northeastern Atlantic Ocean and adjacent seas (black polygon in Fig. 8). The regions of high uncertainty in the regional trend estimates have been excluded from the regional averaging (areas shaded in grey in Fig. 11). The shaded area around the curve indicates the uncertainty envelope computed as a quadratic regional mean of the monthly pH uncertainty estimates, which is then averaged over time to obtain yearly estimates. The northeastern Atlantic Ocean and adjacent seas area-averaged time series is derived from product ref. OA.3.
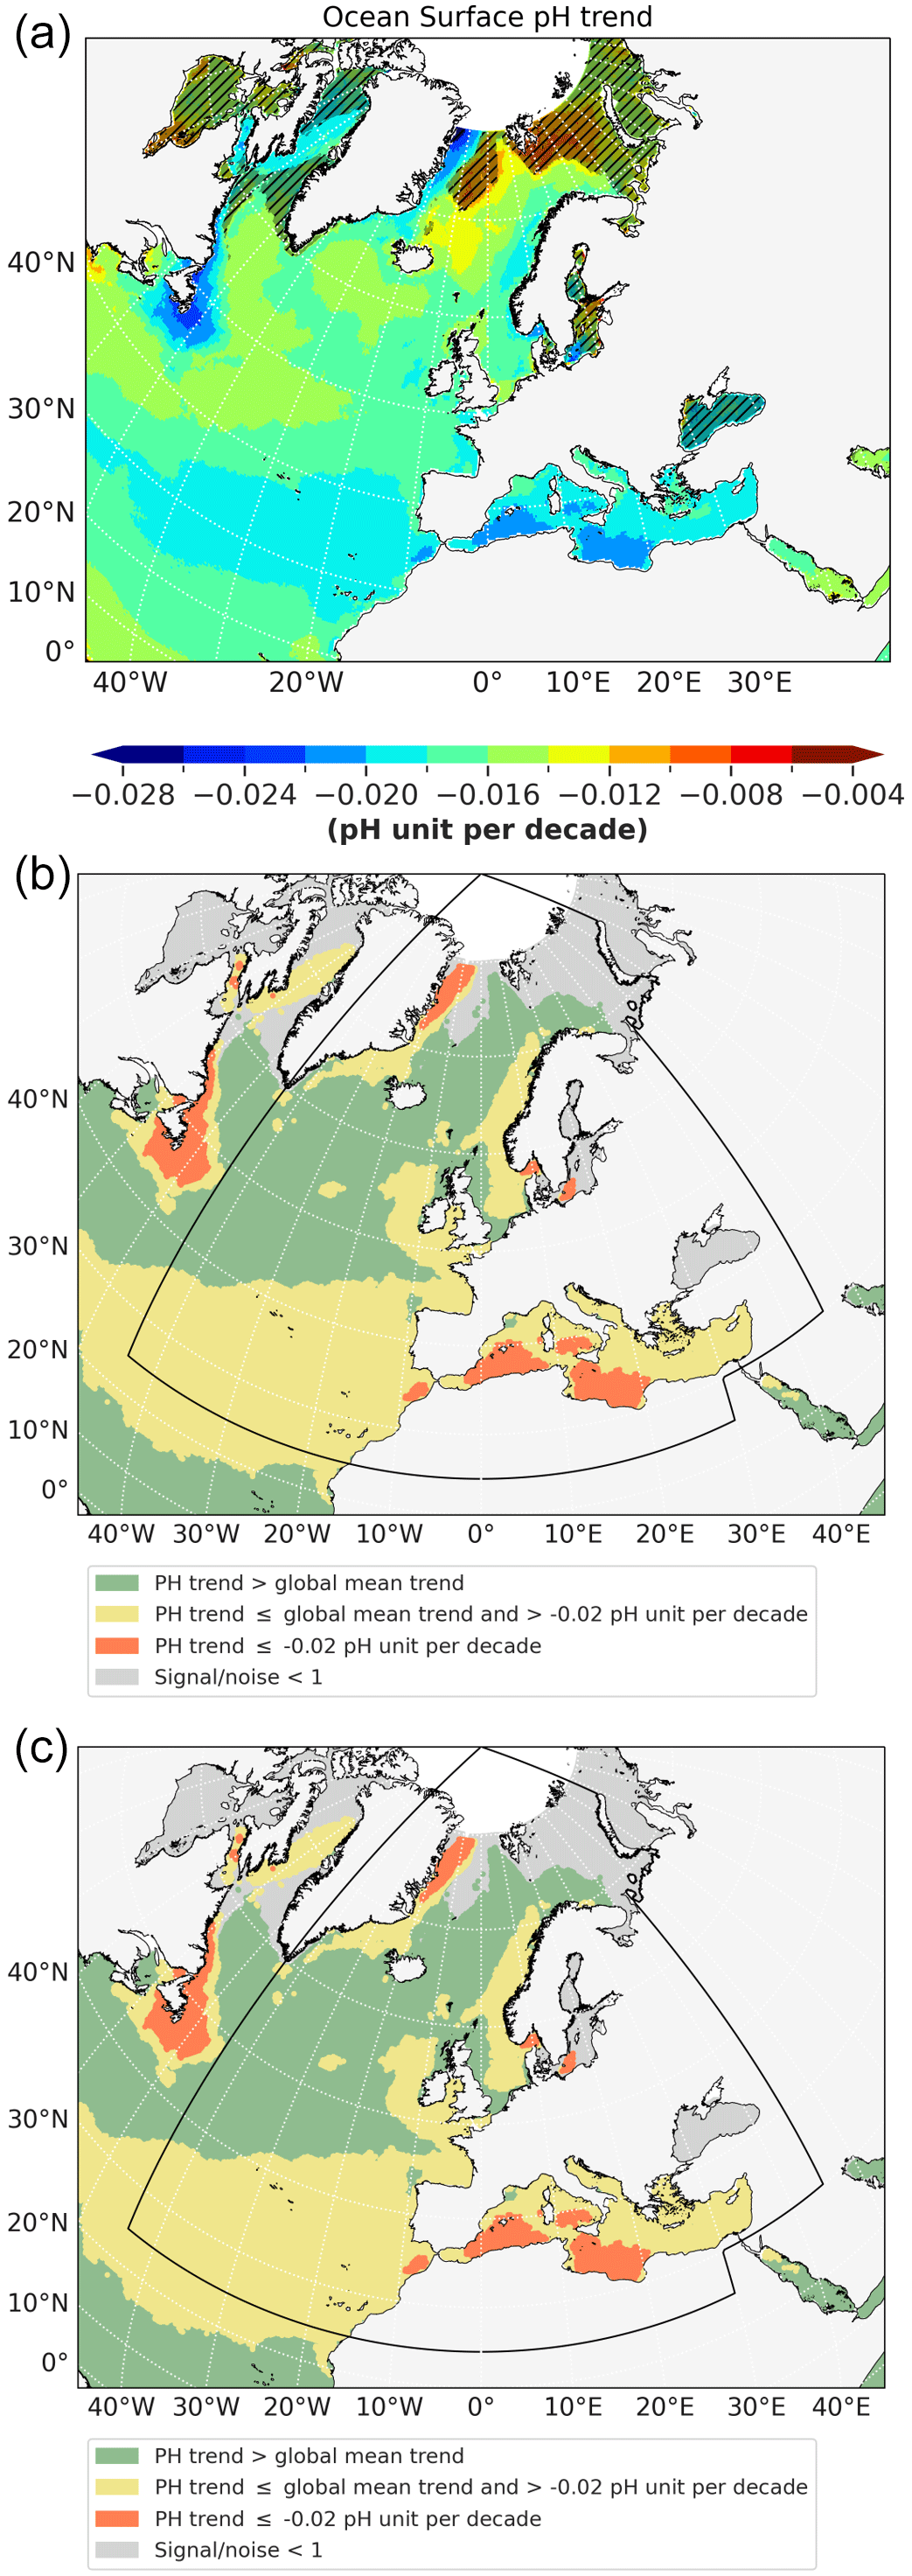
Figure 11(a) Regional trend of sea surface pH (in pH units per decade) over the period 1985–2022 from product ref. OA.1. The black hatches represent areas where the noise exceeds the signal. (b) The same as panel (a) but representing areas where the regional pH is decreasing slower than the global mean sea surface pH trend of −0.017 pH units per decade (green), at a rate between the global mean sea surface pH trend and −0.02 pH units per decade (yellow), or at faster rate than −0.02 pH units per decade (orange). The grey shading represents areas where the noise exceeds the signal. The black box indicates the northeastern Atlantic Ocean and adjacent seas zone used.
In the northeastern Atlantic Ocean, regional patterns of pH decrease range from about −0.020 to −0.012 pH units, i.e. at comparable or higher rates than the global average (Fig. 11). The North Atlantic Ocean is one of the most important anthropogenic CO2 sinks of the global ocean, storing about 25 % of the global oceanic anthropogenic CO2 despite it only covering 15 % of the global ocean surface (Sabine et al., 2004). This is mainly due to the Atlantic Meridional Overturning Circulation (AMOC) that transports ocean surface waters laden with anthropogenic CO2 from the equatorial Atlantic Ocean to the subpolar North Atlantic Ocean, which enters the deep ocean through deep-water mass formation and then flow equatorwards (Bopp et al., 2015; Gruber et al., 2019; Khatiwala et al., 2013; Sabine et al., 2004).
In the Mediterranean Sea, reported rates of pH decrease range from about −0.016 pH units in the northern parts of the basin to more than 0.022 pH units in the southern parts (Fig. 11). Available estimates of pH trend from local in situ observations provide a sparse and quite heterogeneous range of values (Luchetta et al., 2010; Marcellin Yao et al., 2016; Kapsenberg et al., 2017; Merlivat et al., 2018; Hassoun et al., 2019; Wimart-Rousseau et al., 2021; Hassoun et al., 2022), while estimates based on the Copernicus Mediterranean Sea Biogeochemistry Reanalysis (Cossarini et al., 2021) reports a lower range (from −0.012 to −0.006 pH units per decade). The Mediterranean Sea has a very rich and specific biodiversity, and changes in the pH and carbonate chemistry over the long term may have significant impacts on calcifying organisms, such as plankton, corals, and shells, and the whole dependent food web, as well as on aquaculture and fisheries activities (e.g. Cramer et al., 2018; Bednarsek et al., 2023). The Mediterranean Sea has a specifically large capacity to absorb and buffer atmospheric CO2 due to the following features.
-
The Mediterranean Sea has a higher alkalinity from river discharges and Black Sea inflow combined with evaporation, which in turn increases the capacity to neutralize acid and favour dissolution of CO2 (e.g. Middelburg et al., 2020; Schneider et al., 2010; Cossarini et al., 2015).
-
The Mediterranean Sea has a ventilation of deep waters on shorter timescales from a fast overturning circulation (i.e. a few decades to 200 years), which leads to fast transfer of anthropogenic CO2 into deep ocean layers (e.g. Schneider et al., 2010; Hassoun et al., 2015).
The highest alkalinity levels are reported in the eastern Mediterranean Sea, such as in the Aegean and Levantine basins, which are triggered by inflow from the Black Sea, stronger evaporation, and larger salinity than in the western basin (Schneider et al., 2007; Hassoun et al., 2015). Deep water mass formation – generally evolving during winter months – is located in the Gulf of Lion, the Adriatic Sea, and the Aegean basin (Hassoun et al., 2015; Ingrosso et al., 2017). These intermediate and deep-water masses then flow westward until they enter the Atlantic Ocean through the Strait of Gibraltar (Flecha et al., 2019).
In the Black Sea, uncertainties are too large to determine estimates of ocean pH trends, which is predominantly explained by a lack of observations in this area (Fig. 11). In addition, specific hydrographic conditions and dynamics prevail, adding further complexity to the quantification of long-term pH change in this area. For example, the Black Sea is a very stratified system and is a semi-enclosed basin influenced by water exchange with the Sea of Marmara and the Mediterranean Sea (BSC, 2019). The Black Sea is also characterized by a permanent anoxic layer below 100 to 150 m with significant concentrations of hydrogen sulfide, which prevents benthic life beyond the continental shelf. In addition, major inflows from rivers with high alkalinity such as the Danube, the Dnipro, and the Dniester enter the Black Sea, resulting in greater alkalinity as compared to the open-ocean average (Hiscock and Millero, 2006), affecting acidification (Middelburg et al., 2020). During the 1960–1990s, the Black Sea has faced urban and industrial development along its coasts, which brought major chemical and waste pollution, together with overfishing of largest species and an introduction of invasive comb jelly, which strongly disrupted the food web. In addition, large agricultural fertilizer runoff has led to dramatic eutrophication events in the 1980–1990s (Kideys, 2002). In 1992, the Bucharest Convention for the Protection of the Black Sea Against Pollution was signed with the aim, amongst others, of controlling land-based sources of pollution (BSC, 2023). Since then, pollutants have been reduced (BSC, 2019, 2008, 2002), and the Black Sea is now considered in a post-eutrophication state (Mee et al., 2005). The Black Sea is also exposed to ocean warming (see Sect. 2), affecting the atmospheric CO2 uptake in the Black Sea. However, today there is no clear scientific consensus regarding long-term pH decrease (acidification) in the Black Sea, as observations and studies on the subject are rare, and the emergence of a significant climate signal may be dampened by seasonal and interannual pH variations due to the processes and events mentioned above (Polonsky and Grebneva, 2019; Elge, 2021; Polonsky, 2012).
Large uncertainties also hamper the study of ocean acidification in the Baltic Sea (Fig. 11), which is particularly challenged by different terrestrial drivers of pH change (Duarte et al., 2013; Carstensen and Duarte, 2019). In addition, specific geographic and hydrographic conditions induce further complexity. The Baltic Sea is a semi-enclosed sea where ocean waters from the North Sea mix with riverine freshwaters. Low-salinity waters are generally associated with low alkalinity, which provides buffer capacity to ocean acidification (Middelburg et al., 2020; Meier et al., 2022). The waters are brackish with an average salinity of 7 psu in the surface layers and almost fresh waters (0–2 psu) in the northernmost (Gulf of Bothnia) and easternmost (Gulf of Finland) parts of the basin (HELCOM, 2023b). The alkalinity of the Baltic Sea is also affected by river runoff, draining weathered carbonate minerals from rocks in river catchment areas (Müller et al., 2016; Gustafsson and Gustafsson, 2020; Gustafsson et al., 2023). Generally, alkalinity tends to increase on the long-term in the Baltic Sea, due to several drivers that have evolved over the last decades, such as through weathering in the drainage basins, acidic rain, agricultural liming, increase in precipitations, and ocean primary production (Müller et al., 2016; Meier et al., 2022; Gustafsson et al., 2023). In addition to changes in alkalinity, the Baltic Sea also faces ocean warming (Meier et al., 2022) and anthropogenic eutrophication (HELCOM, 2023b; Gustafsson et al., 2012; Andersen et al., 2017; Murray et al., 2019; Gustafsson et al., 2023), affecting regional patterns of ocean pH. Since the 1990s, major efforts have been made by the countries bordering the Baltic to reduce the nutrient inputs into the Baltic Sea and hence to limit eutrophication. Still, there is no clear sign of general recovery of the system (Andersen et al., 2017; HELCOM, 2023a, b), and models project that several decades will be needed to reach good eutrophication status in most of the Baltic Sea (Murray et al., 2019). Moreover, shorter cold seasons, longer mild seasons driven by global warming, and resulting changes in primary production and associated carbonate cycle can in turn impact the evolution of the pH conditions. Some areas alternate roles of CO2 sink and source across the year, and seasonal variations can locally reach more than 0.8 pH units (HELCOM, 2023b). Because of the strong interannual and seasonal variations of these natural and human-induced interlinked processes and some associated mitigation or counteracting effects like the increase in alkalinity, there is currently no significant signal of long-term ocean acidification observed in the Baltic Sea, except in a few regions, such as in the Danish Straits (Carstensen et al., 2018).
4.1 Mediterranean meridional overturning circulation
The Mediterranean Sea is a semi-enclosed basin characterized by peculiar thermohaline circulations consisting of a basin-scale zonal overturning connected to the Atlantic through the Strait of Gibraltar and two internal meridional cells, one for the west and another for the eastern basin, driven by deep-water formation in the Gulf of Lion and the Adriatic Sea, respectively (see Tsimplis et al., 2006; Schroeder et al., 2012; Pinardi et al., 2023 for general information). The latter experienced a major shift in the early 1990s with deep-water formation temporarily occurring in the southern Aegean Sea (the so-called Eastern Mediterranean transient; Roether et al., 2014). A recent investigation of the dynamics of intermediate and deep-water formation can be found in Waldman et al. (2018).
Masina et al. (2022) presented changes in the Gibraltar inflow transport from the Atlantic Ocean into the Mediterranean Sea that trigger basin-mean sea surface height variability, which is anti-correlated with variations in the Atlantic Meridional Overturning circulation (AMOC). They show that during years of weaker (stronger) AMOC and higher (lower) sea surface height in the Mediterranean Sea, a stronger (weaker) Azores Current results in stronger (weaker) Gibraltar inflow transport.
The zonal overturning cell enables the connection between the inflow transport at the Gibraltar Strait and remote areas of the eastern Mediterranean basin. The wide and shallow Strait of Sicily sill divides the western Mediterranean basin from the eastern Mediterranean basin (Pinardi et al., 2019). The western sub-basin clockwise meridional overturning circulation is associated with the deep-water formation area of the Gulf of Lion, while the eastern clockwise meridional overturning circulation is composed of multiple cells associated with different intermediate- and deep-water sources in the Levantine, Aegean, and Adriatic seas (Lyubartsev et al., 2020).
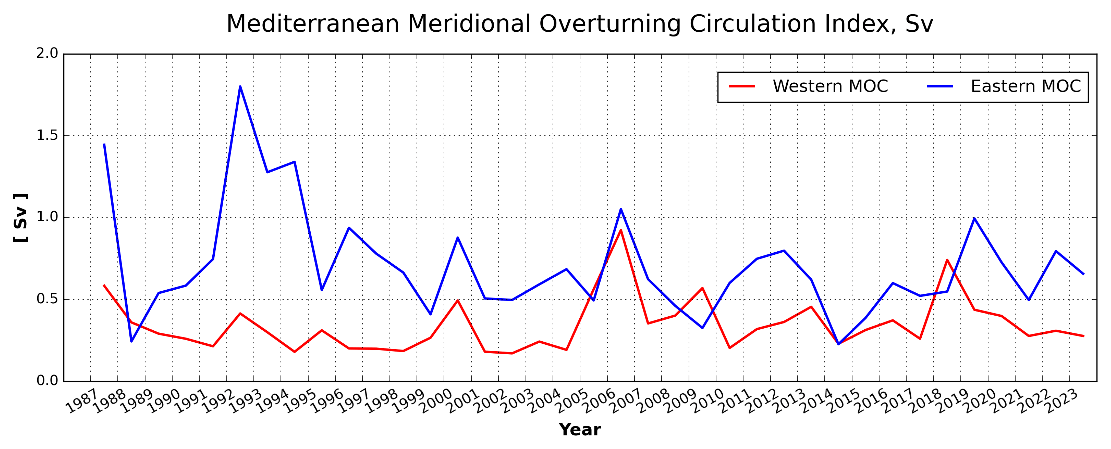
Figure 12Time series of Mediterranean overturning indices (Sverdrup) calculated from the annual average of the meridional stream function based on product ref. OV.3., computed using the reanalysis dataset from January 1987 to July 2022 and the interim dataset August 2022 to December 2024 of product ref. OV.4. Blue represents the eastern Mediterranean overturning index (< 36.5° N), and red represents the western Mediterranean overturning index (≥ 40° N, z > 300 m).
Based on these characteristics, the Mediterranean meridional overturning circulation can be monitored by the western Mediterranean overturning index (WMOI) and eastern Mediterranean overturning index (EMOI) (Lyubartsev et al., 2020) (Fig. 12). These indices are useful for monitoring the health of the Mediterranean Sea in terms of stratification and deep-water formation, as these factors mediate the exchange of oxygen and other tracers between the surface and the deep ocean, fostering the establishment of early warming indices for the Mediterranean Sea to support the Sustainable Development Goal (SDG) 13 Target 13.3 (Lyubartsev et al., 2020).
Both the EMOI and the WMOI show no long-term trend, and both records are characterized by large interannual- to decadal-scale change (Fig. 12). Overall, the overturning circulation in the eastern Mediterranean Sea is stronger as compared to the western basin. This is demonstrated by the generally higher values of EMOI as compared to WMOI (Fig. 12). The difference in both indices is most prominent during the major climatic event in the circulation and water mass properties of the Mediterranean Sea in the last century, i.e. the so-called Eastern Mediterranean Transient (EMT; Roether et al., 2014; Incarbona et al., 2016). The pronounced peak in EMOI in the year 1992 is driven by the EMT. In 1999, the difference between EMOI and WMOI started to decrease because EMT water masses reached the Strait of Sicily flowing into the western Mediterranean Sea (Lyubartsev et al., 2020).
During the past 2 decades, WMOI reached another maximum in the year 2006, potentially linked to anomalous deep-water formation during the Western Mediterranean Transition (Lyubartsev et al., 2020). In 2019, the EMOI reached another high value, which is discussed as being triggered by subduction of the Levantine Intermediate Water along the Cretan Sea and the Rhodes Cyclonic Gyre (Taillandier et al., 2022). In 2022, the EMOI peaked again, possibly linked to deep-water formation events that took place in the northern and central Aegean Sea during the winter of 2021–2022 (Potiris et al., 2024).
4.2 Nordic Seas volume transport
The circulation of the water masses and distribution of heat and salinity between the North Atlantic and the Arctic and in the Arctic Ocean are governed by the northward flow of relatively warm and saline Atlantic Water through the Nordic Seas across the Iceland–Faroe–Scotland Ridge and into the Arctic, balanced by outflow of cold Arctic Water masses through the western Nordic Seas (Lien and Raj, 2018; Mauritzen et al., 2011; Rudels, 2012). Moreover, the exchanges between the North Atlantic and the Arctic have broad effects on sea ice, ecology, biogeochemistry, and atmospheric climate (Smedsrud et al., 2013; Polyakov et al., 2023; Gerland et al., 2023; Lundesgaard et al., 2022). Specifically, the Atlantic Water flow plays an integral part in defining both the physical and biological border between the boreal and Arctic realms. Variability of Atlantic Water flow to the Barents Sea has been found to move the position of the ice edge and influences the sea ice cover in the Barents Sea (Onarheim et al., 2015; Lien et al., 2017) and habitats of various species in the Barents Sea ecosystem (Fossheim et al., 2015; Jørgensen et al., 2022).
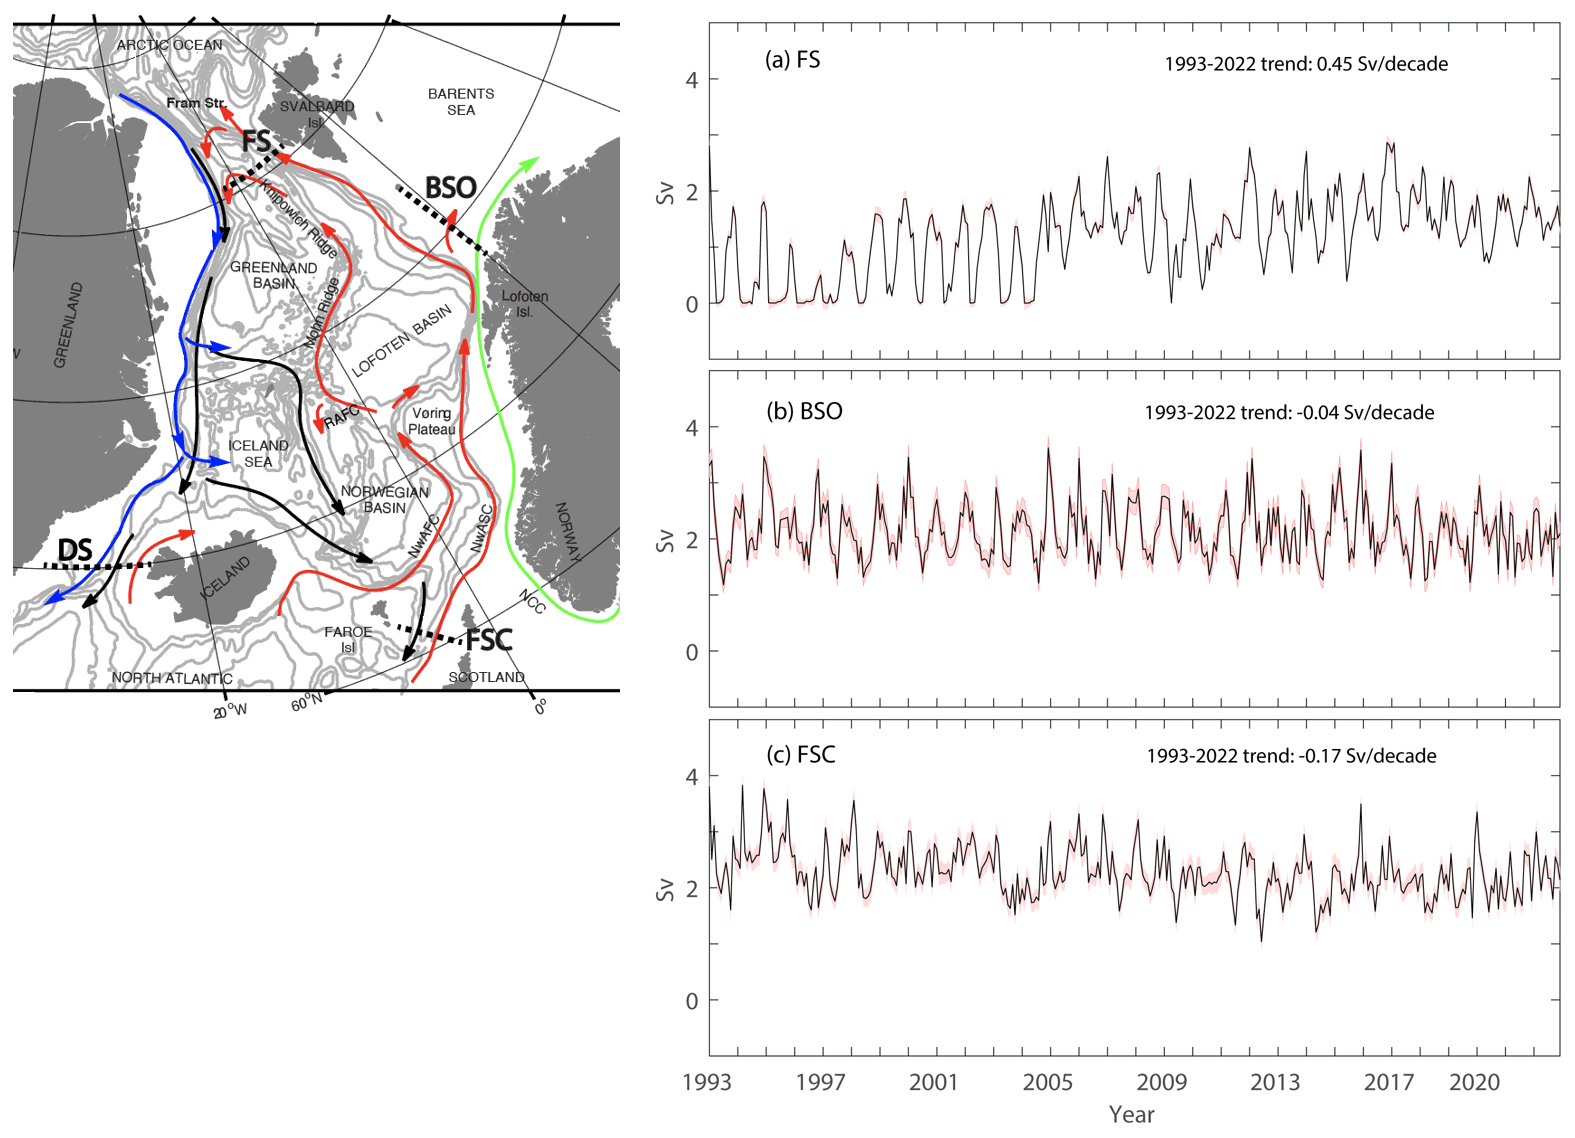
Figure 13The left panel shows schematic water pathways in the Nordic Seas showing the overturning circulation of northward-flowing Atlantic Water (red) to southward-flowing transformed waters at depth (black). The two branches of the Norwegian Atlantic Current, the Norwegian Atlantic slope current (NwASC), and Norwegian Atlantic front current (NwAFC) are represented by red arrows. The fresh Norwegian Coastal Current (NCC) is indicated in green, while the Greenland Current is marked in blue; see Raj and Halo (2016) for details. Grey isobaths are drawn at 600 m depth levels. The dashed lines provide the locations of the sections: Faroe Shetland Channel (FSC), Barents Sea opening (BSO), Fram Strait (FS), and Denmark Strait (DS). The right-hand column shows product ref. OV.5 modelled volume transport of Atlantic Water to the Arctic via the Fram Strait (a), to the Barents Sea via the Barents Sea Opening (b), and to the Nordic Seas via the Faroe Shetland Channel (c). Positive values indicate northward flow. The shaded region indicates the error associated with the monthly mean transport estimates.
The northward flow of Atlantic water into the Arctic through the Faroe–Shetland Channel amounts to 2.5 Sv (1 Sv = 106 m3 s−1) over the period 1993–2022 (Fig. 13), which is in within the uncertainty range of observation-based estimates of 2.7 ± 0.5 Sv (1993–2015) (Berx et al., 2013). In addition, a small but significant negative trend of −0.17 Sv per decade is reported for the period 1993–2022 (Fig. 13). This is in comparison to a reported non-significant trend of −0.006 Sv yr−1 based on observations during the period 1993–2015 (Østerhus et al., 2019). The modelled transport in the most recent year did not differ from the historical values. The hydrographic properties of the inflowing Atlantic Water affects the hydrographic properties in the downstream Norwegian and Barents seas, and these areas are currently recovering from record low salinity levels advected from the North Atlantic (Holliday et al., 2020). Moreover, such changes may also be a precursor for different water mass composition and hence nutrients, phytoplankton, and zooplankton communities being advected into the Nordic Seas (Hátún et al., 2017). However, the strength of the inflow itself has also been shown to impact the hydrographic properties downstream in the Norwegian and Barents seas, where stronger inflow causes increased salinity and temperature (Sundby and Drinkwater, 2007) in addition to regional ocean–atmosphere interaction (Segtnan et al., 2011; Mork et al., 2019).
In the Barents Sea Opening, the model indicates a long-term average net Atlantic water inflow of 2.2 Sv compared to an observation-based estimate of 1.8 Sv (Smedsrud et al., 2013). Note the different time window used for averaging. The model results indicate a small, non-significant negative trend of −0.04 Sv per decade, which is in agreement with observations indicating no trend over the 1998–2020 period (ICES, 2022). According to Østerhus et al. (2019), a positive, significant trend of 0.016 Sv yr−1 was found for the period 1998–2013. Note, however, the different time window used for the calculation. The modelled transport in the most recent year did not differ from historical values. In the Fram Strait, the model data indicate a positive trend in the Atlantic Water transport to the Arctic of 0.45 Sv per decade for the period 1993–2022. This trend is partly explained by increased temperature in the West Spitsbergen Current during the period 2005–2010 (e.g. Walczowski et al., 2012), which caused a larger fraction of the water mass to be characterized as Atlantic Water (T > 2 °C). Moreover, the strong recirculation in the Fram Strait area further complicates the interpretation of the results.
4.3 Major Baltic inflows
In the Baltic Sea, the salinity and its changes are key factors in determining the overall stratification conditions, which strongly influence different ecosystem processes and play an important role in the energy and water cycles in this area (Lehmann et al., 2022). The long-term change in water salinity of the Baltic Sea is determined by the inflow of saline water from the North Sea and its encounter with freshwater originating from numerous rivers across the Baltic coast and from the net precipitation (Lehmann et al., 2022). A major Baltic inflow (MBI) is an event that transports large amounts of saline water into the Baltic Sea through the Danish Straits (Mohrholz, 2018), shaping the stratification and oxygen conditions and hence influencing the marine ecology of the Baltic Sea. MBIs occur sporadically, usually many years apart, and are usually of barotropic origin, initiated by a special sequence of large-scale meteorological events in winter and spring. Since 1996, summer inflows of baroclinic origin have been observed. These summer inflows inject more highly saline water with higher temperatures and low oxygen content into the halocline of the Baltic Sea (Lehmann et al., 2022).
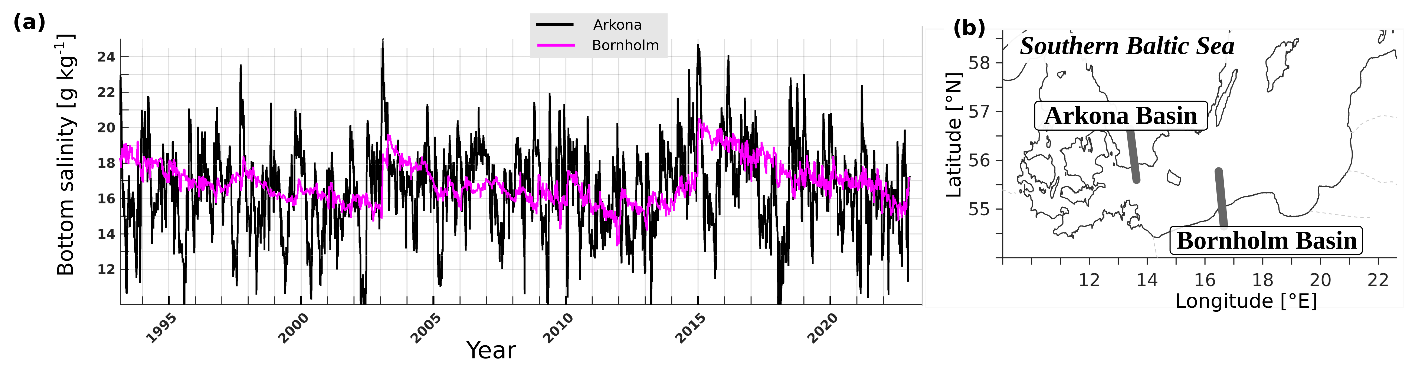
Figure 14Time series of bottom salinity in the Arkona (black line) and Bornholm basins (magenta line) for the period of 1993–2022 (product ref. OV.6 derived from regional Copernicus Marine Service reanalysis) (a). The locations of the Arkona and Bornholm basins are shown in panel (b).
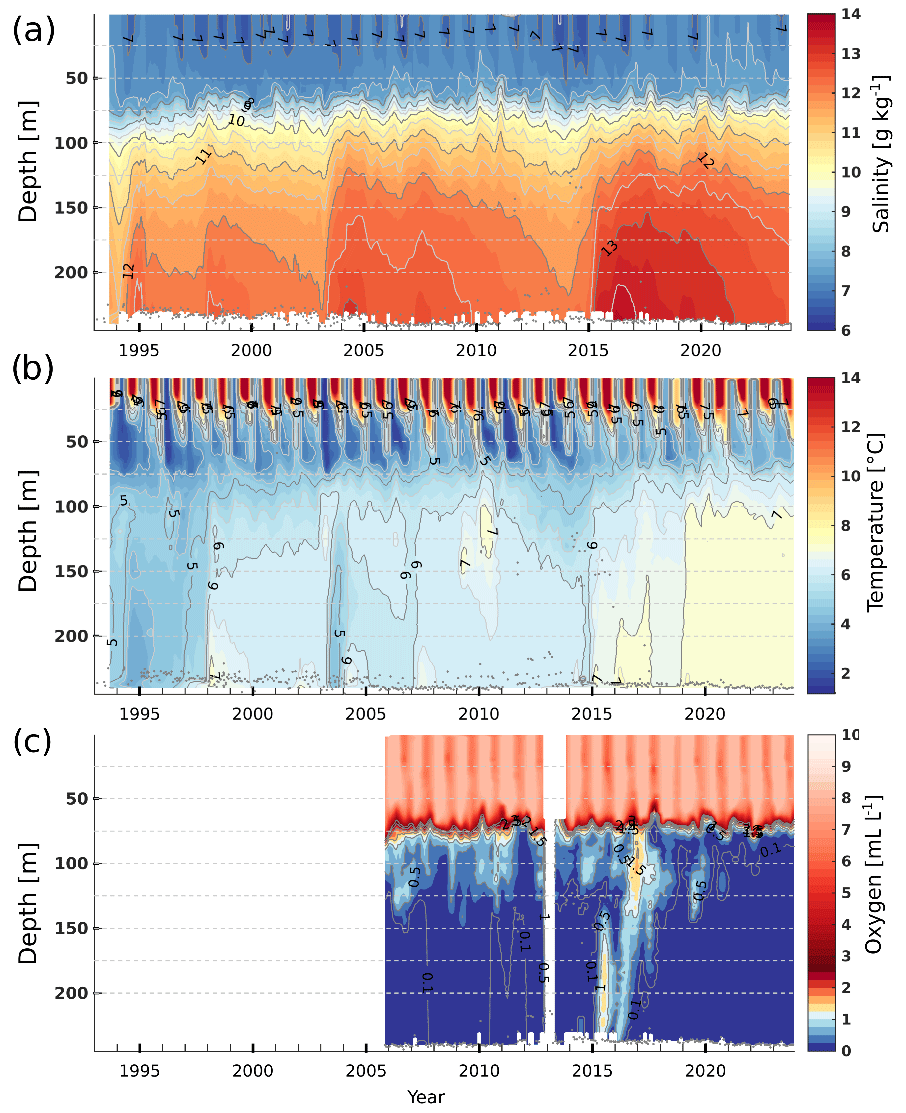
Figure 15Profiles of salinity (a), temperature (b), and dissolved oxygen concentration (c) for the period 1993–2023 in the Gotland Basin in the Baltic Sea (product ref. OV.7) based on in situ near-real-time observations.
MBI can be detected and monitored in the bottom-layer salinity of the Arkona Basin and the Bornholm Basin and through the vertical distribution of temperature, salinity, and dissolved oxygen concentration in the Gotland Basin. Temperature, salinity, and dissolved oxygen profiles in the Gotland Basin enable the estimation of the amount of the major Baltic inflow water that has reached the central Baltic, the depth interval that has been the most affected, and how much the oxygen conditions have been improved. Major Baltic inflows were identified in 1993, 2002, and 2014, showing salinity peaks in the three basins (Figs. 14, 15) and displaying a very clear signal in the Gotland Basin with water salinity, temperature, and dissolved oxygen conditions up to 100 m depth (Raudsepp et al., 2018). The bottom salinity has decreased since 2017 when the effect of the last MBI in 2014 has receded (Fig. 15). There was no MBI in winter 2022/23 and in 2023 salinity continued to decrease and oxygen was completely consumed below the depth of 75 m in the Gotland Basin.
5.1 Marine heatwaves
Marine heatwaves can have dramatic impacts on marine ecosystems, such as reduction of primary production, migration or reduction of endemic species, emergence of species coming from other regions, and mass mortality of organisms (Smith et al., 2023; Oliver et al., 2019; Garrabou et al., 2022), which in turn can have adverse impacts on human systems like fisheries and aquaculture (Cheung and Frölicher, 2020; IPCC, 2022; Wakelin et al., 2021). Like in the global ocean, the frequency, intensity, and duration of MHW events have increased in recent years in the northeastern Atlantic Ocean and adjacent seas and are particularly increased in the semi-enclosed seas like the Mediterranean and Black seas (Peal et al., 2023; Yao et al., 2022; Oliver et al., 2018; IPCC, 2021b; Darmaraki et al., 2019; Dayan et al., 2023; Juza et al., 2022). These events are expected to continue to increase in the future (Yao et al., 2022; Oliver et al., 2019).
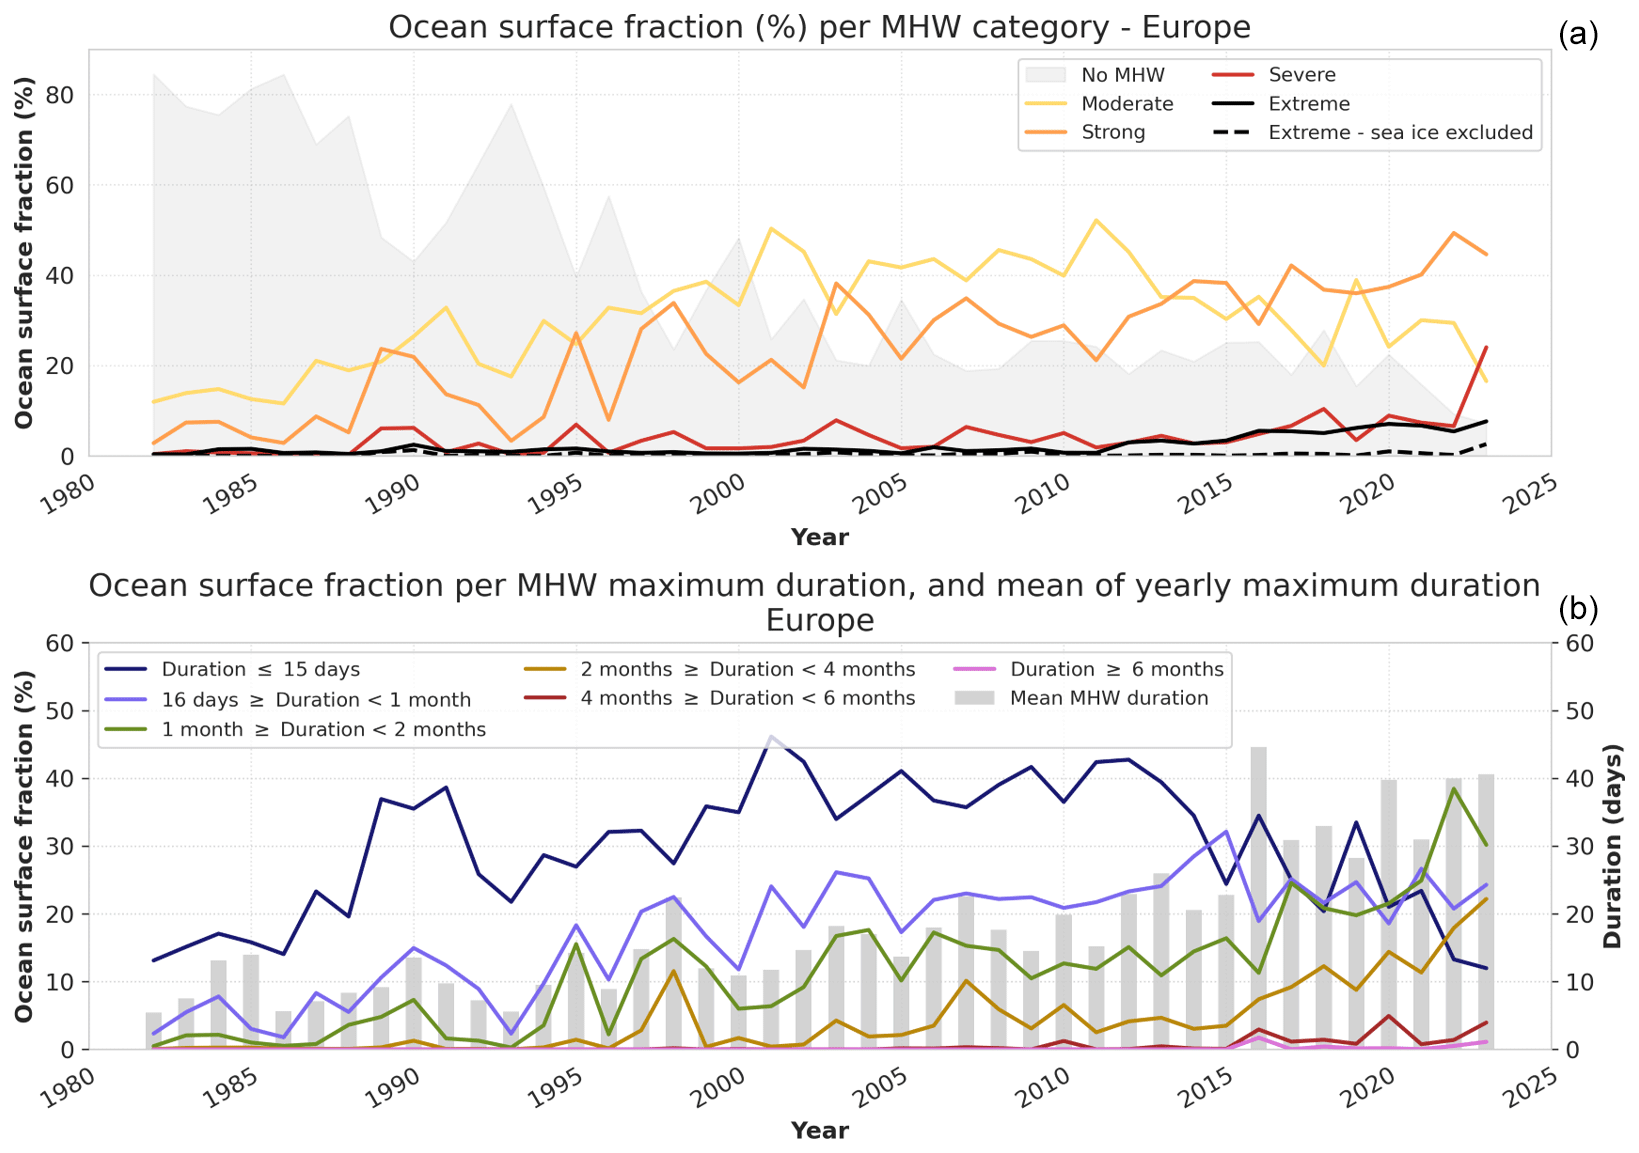
Figure 16(a) Percentage of ocean surface where the maximum marine heatwave category detected was moderate, strong, severe, extreme, or no marine heatwave in the northeastern Atlantic Ocean and adjacent seas zone. The dashed black line shows the same information for extreme categories when excluding sea ice regions from the computation (see Fig. 11 for the sea ice mask applied, with a minor impact for the other categories). These ocean fraction estimates are done following the same method as Hobday et al. (2018). (b) Percentage of global ocean surface where the maximum MHW duration was within a given period (lines) and the yearly mean of maximum MHW durations (bars) in the northeastern Atlantic Ocean and adjacent seas zone (black polygon in Fig. 11). The evaluation of these MHW indicators is done following the method of Hobday et al. (2016) and is derived from product refs. SST.1 and SST.2.
From 1982 to 2023, the fraction of the ocean surface that did not experience any MHW event over the year in the northeastern Atlantic Ocean and adjacent seas (black polygon in Fig. 11) dramatically dropped, from more than 80 % in 1982 to less than 10 % in 2023 (Fig. 11). The major drop occurred between 1982 and the early 2000s. Since then, the yearly fraction of ocean surface without any MHW event has remained relatively stable at around 20 % ± 10 % (i.e. 80 % ± 10 % of the region is affected by MHW events every year). The fraction of ocean surface that was affected by moderate MHW events increased from about 10 % to about 45 % between 1982 and 2001. It remained relatively stable between 2000 and 2010 and then started to drop in 2010 down to less than 20 % in 2023. The fraction of the ocean surface experiencing strong MHW events has been continuously increasing over the whole period, from less than 5 % in 1982 to more than 45 % in 2023. Severe and extreme MHW events also show a positive trend over the last decade. However, the trend of extreme category events is strongly dampened when excluding sea-ice-covered regions (Fig. 11), as is the case for the global estimates. In addition, similar to the global estimates, the impact is minor for the other categories (not shown). Since 2013, the cumulative fraction of ocean surface affected by strong, severe, and extreme MHW events has been almost systematically larger than that affected by moderate MHW events. As we consider a fixed baseline for the climatology, these results are consistent with the fact that this part of the ocean is one of those that have been warming at the fastest rates due to global warming.
Regarding the marine heatwave durations (Fig. 16), the yearly averaged maximum continuously increased from 1982 (less than 10 d) to 2023 (about 40 d). Until the mid-2010s, most of the longest MHW events lasted less than 15 d. Since then, the ocean surface fraction affected by short events at most has dropped, down to about 12 % in 2023. The ocean surface fraction affected by events lasting between 2 weeks and 1 month has increased from 1982 (less than 5 %) to the early 2000s, when it stabilized around 25 %. The ocean surface fraction affected by events lasting between 1 and 2 months has continuously increased from almost no occurrence in 1982 to more than 30 % in 2023, and these events now prevail on other MHW durations in the region. Similarly, the ocean surface fraction experiencing MHW events lasting between two and four months started to rise in the 1990s and reached more than 20 % in 2023. Events lasting more than four months remain at a low level but have also been more observed since 2015. Similar results are obtained when excluding sea-ice covered regions from the computation (not shown).
Table 2Percentage of ocean surface affected by a MHW event in 2022 and 2023, depending on the category, in the northeastern Atlantic Ocean and adjacent seas and when considering only the shallow waters (depth between 0 and 200 m) of the area. The information is also provided when excluding the sea-ice-covered regions from the computation (see Fig. 17 for the sea ice mask applied). These ocean fraction estimates are done following the same method as Hobday et al. (2018).

In 2022 and 2023, 91 % and 93 %, respectively, of the ocean surface in the northeastern Atlantic Ocean and adjacent seas were affected by at least one moderate marine heatwave (Table 2). These numbers rise to about 95 % when considering only the European shelf seas, i.e. regions at depths between 0 and 200 m. In 2022, about 60 % of the northeastern Atlantic Ocean and adjacent seas were affected by strong (49 %) or even severe (7 %) and extreme (5 %, mostly in the Arctic region) marine heatwaves. Some marine heatwave events prevailed for a long period of about 4 to 5 months, such as in the western Mediterranean Sea, the English Channel, and the southern Arctic. Other areas affected by strong to extreme marine heatwaves and events lasting about 1 to 2 months include the central Mediterranean Sea, the North Sea, and large parts of the Iberia–Biscay–Irish areas (Fig. 11).
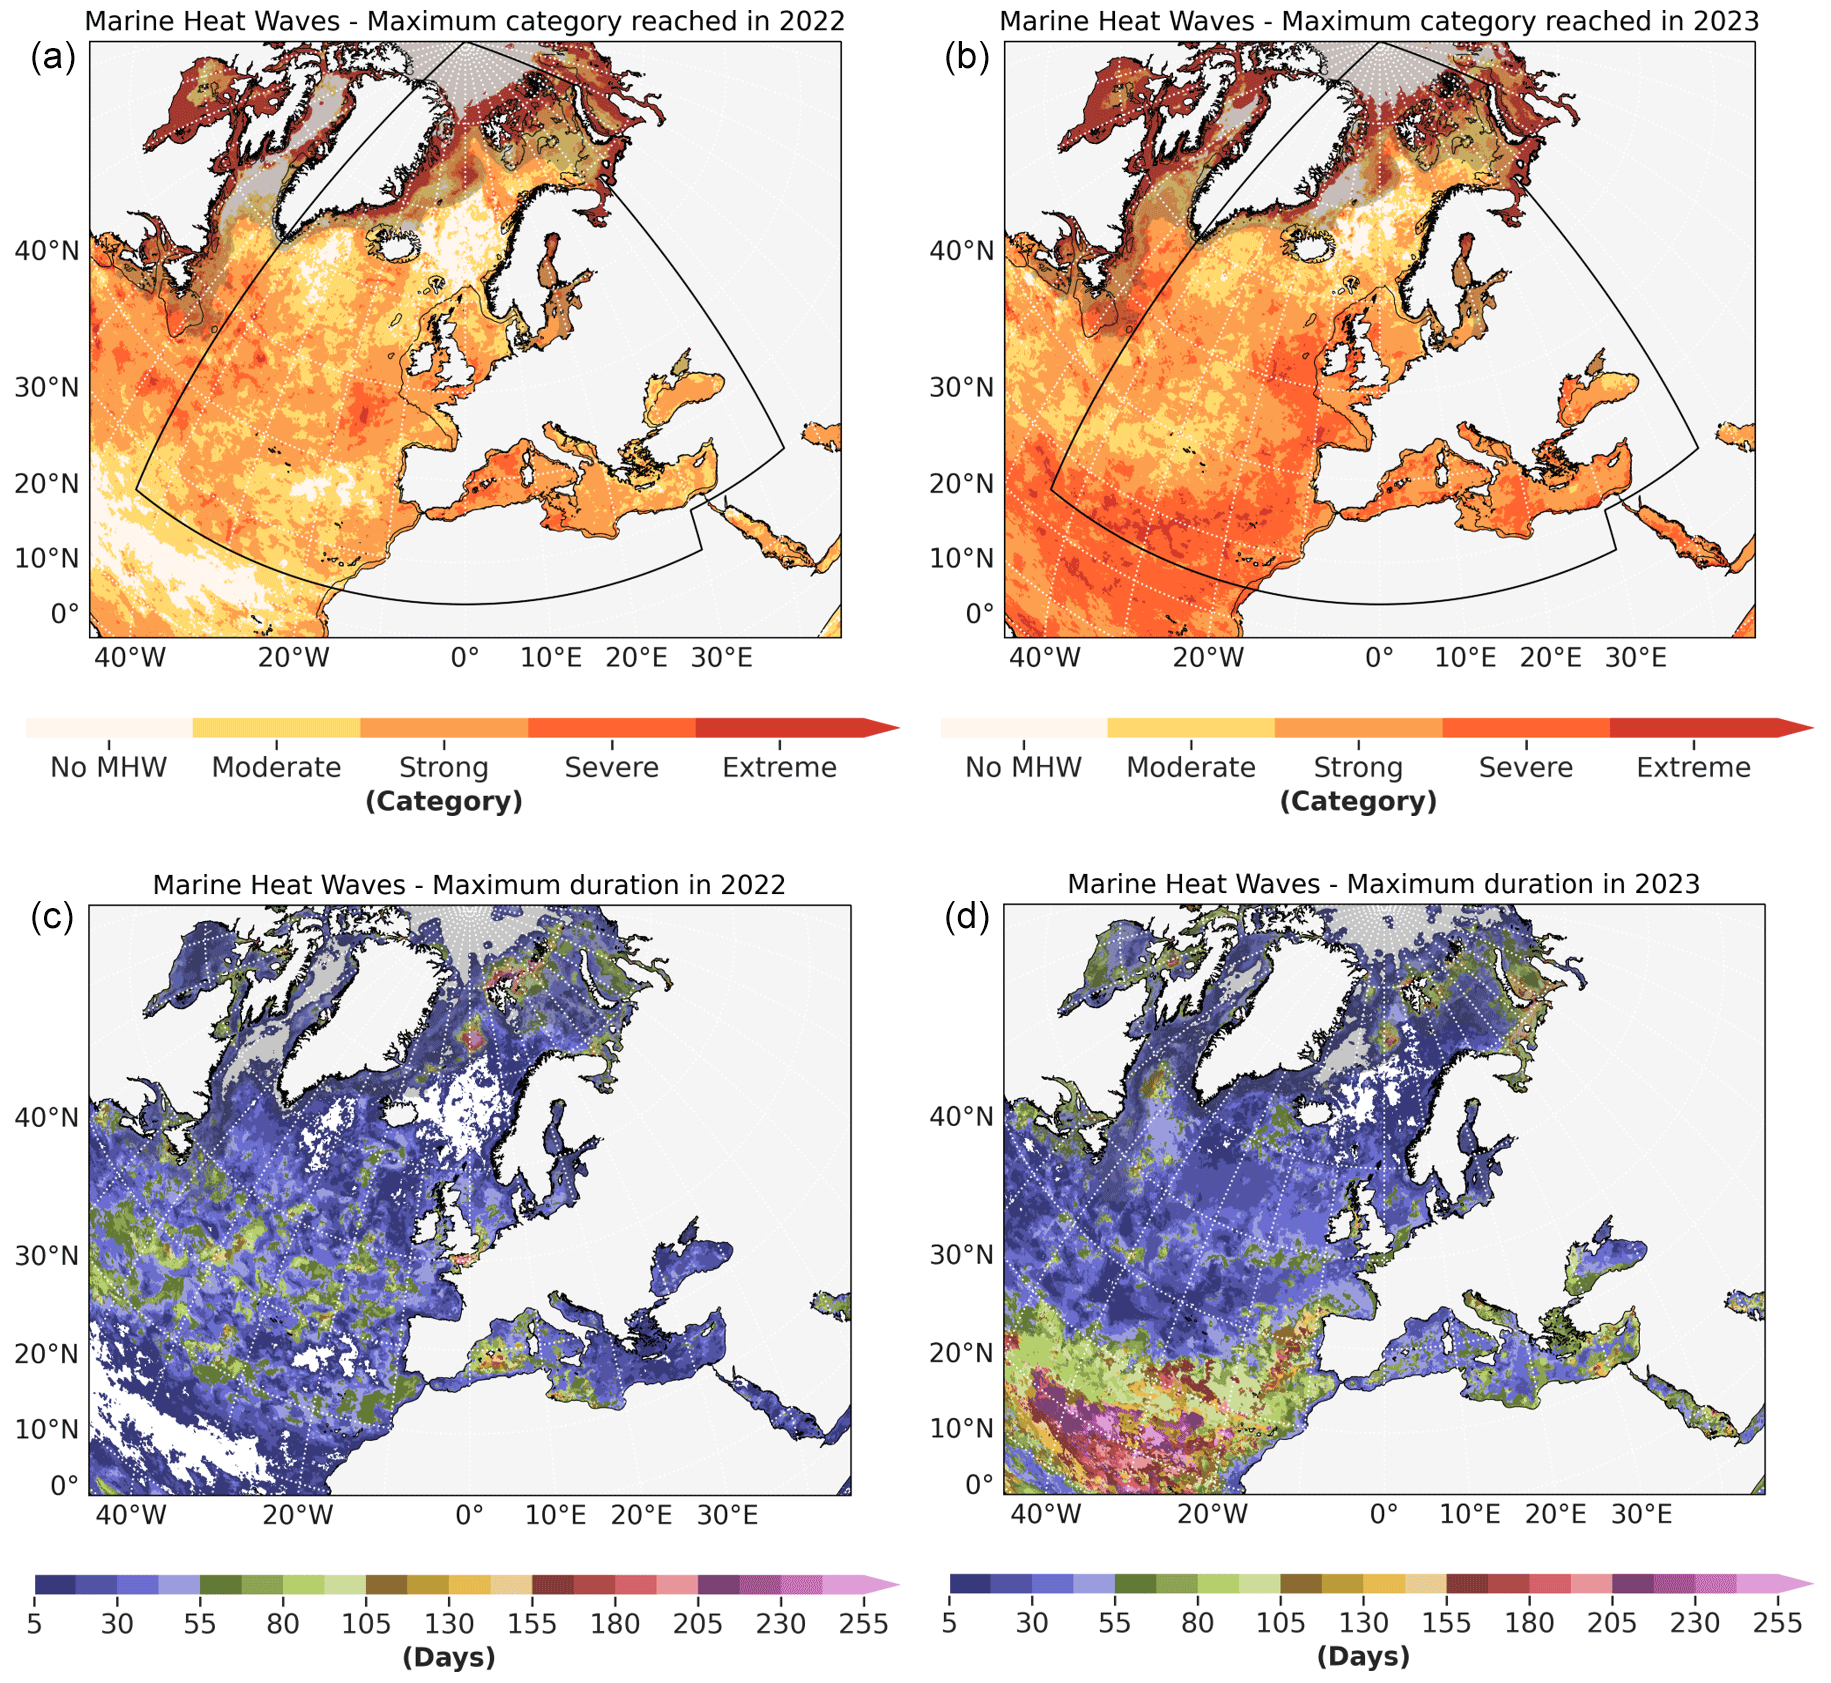
Figure 17Maximum category of marine heatwave reached in 2022 (a) and 2023 (b) in the northeastern Atlantic Ocean and adjacent seas, as derived from product refs. SST.1 and SST.2. The thin black line shows the 200 m isobath for product ref. MHW.1. The black polygon shows the northeastern Atlantic Ocean and adjacent seas region considered in this marine heatwave section. Maximum duration of marine heatwave events in 2022 (c) and 2023 (d) in the northeastern Atlantic Ocean and adjacent seas, as derived from the same sea surface temperature products. The areas shaded in grey correspond to regions where there was at least 1 d of sea ice (sea ice concentration larger than 0.15 in the product ref. SST.1) during the climatological reference period (1993–2016), implying potentially less accurate marine heatwave detections.
In 2023, almost 80 % of the ocean surface in the northeastern Atlantic Ocean and adjacent seas experienced MHW of at least strong (45 %), severe (24 %), or extreme (8 %) categories (Table 2). Compared to 2022, the Bay of Biscay and the northeastern Atlantic region off the Iberian coast were particularly affected by marine heatwaves in 2023 (Fig. 17), with events lasting more than 5 months (Fig. 17). This corresponds to the anomalously warm surface waters that have been observed in the tropical North Atlantic Ocean since March 2023. Other regions hit by MHW events lasting 2 to 3 months in 2023 include the English Channel and the Irish Sea, the Alboran Sea, the Adriatic Sea, the Levantine basin, and the western part of the Black Sea (Fig. 17). All of these regions also experienced strong to severe MHW events over the year 2023 (Fig. 17).
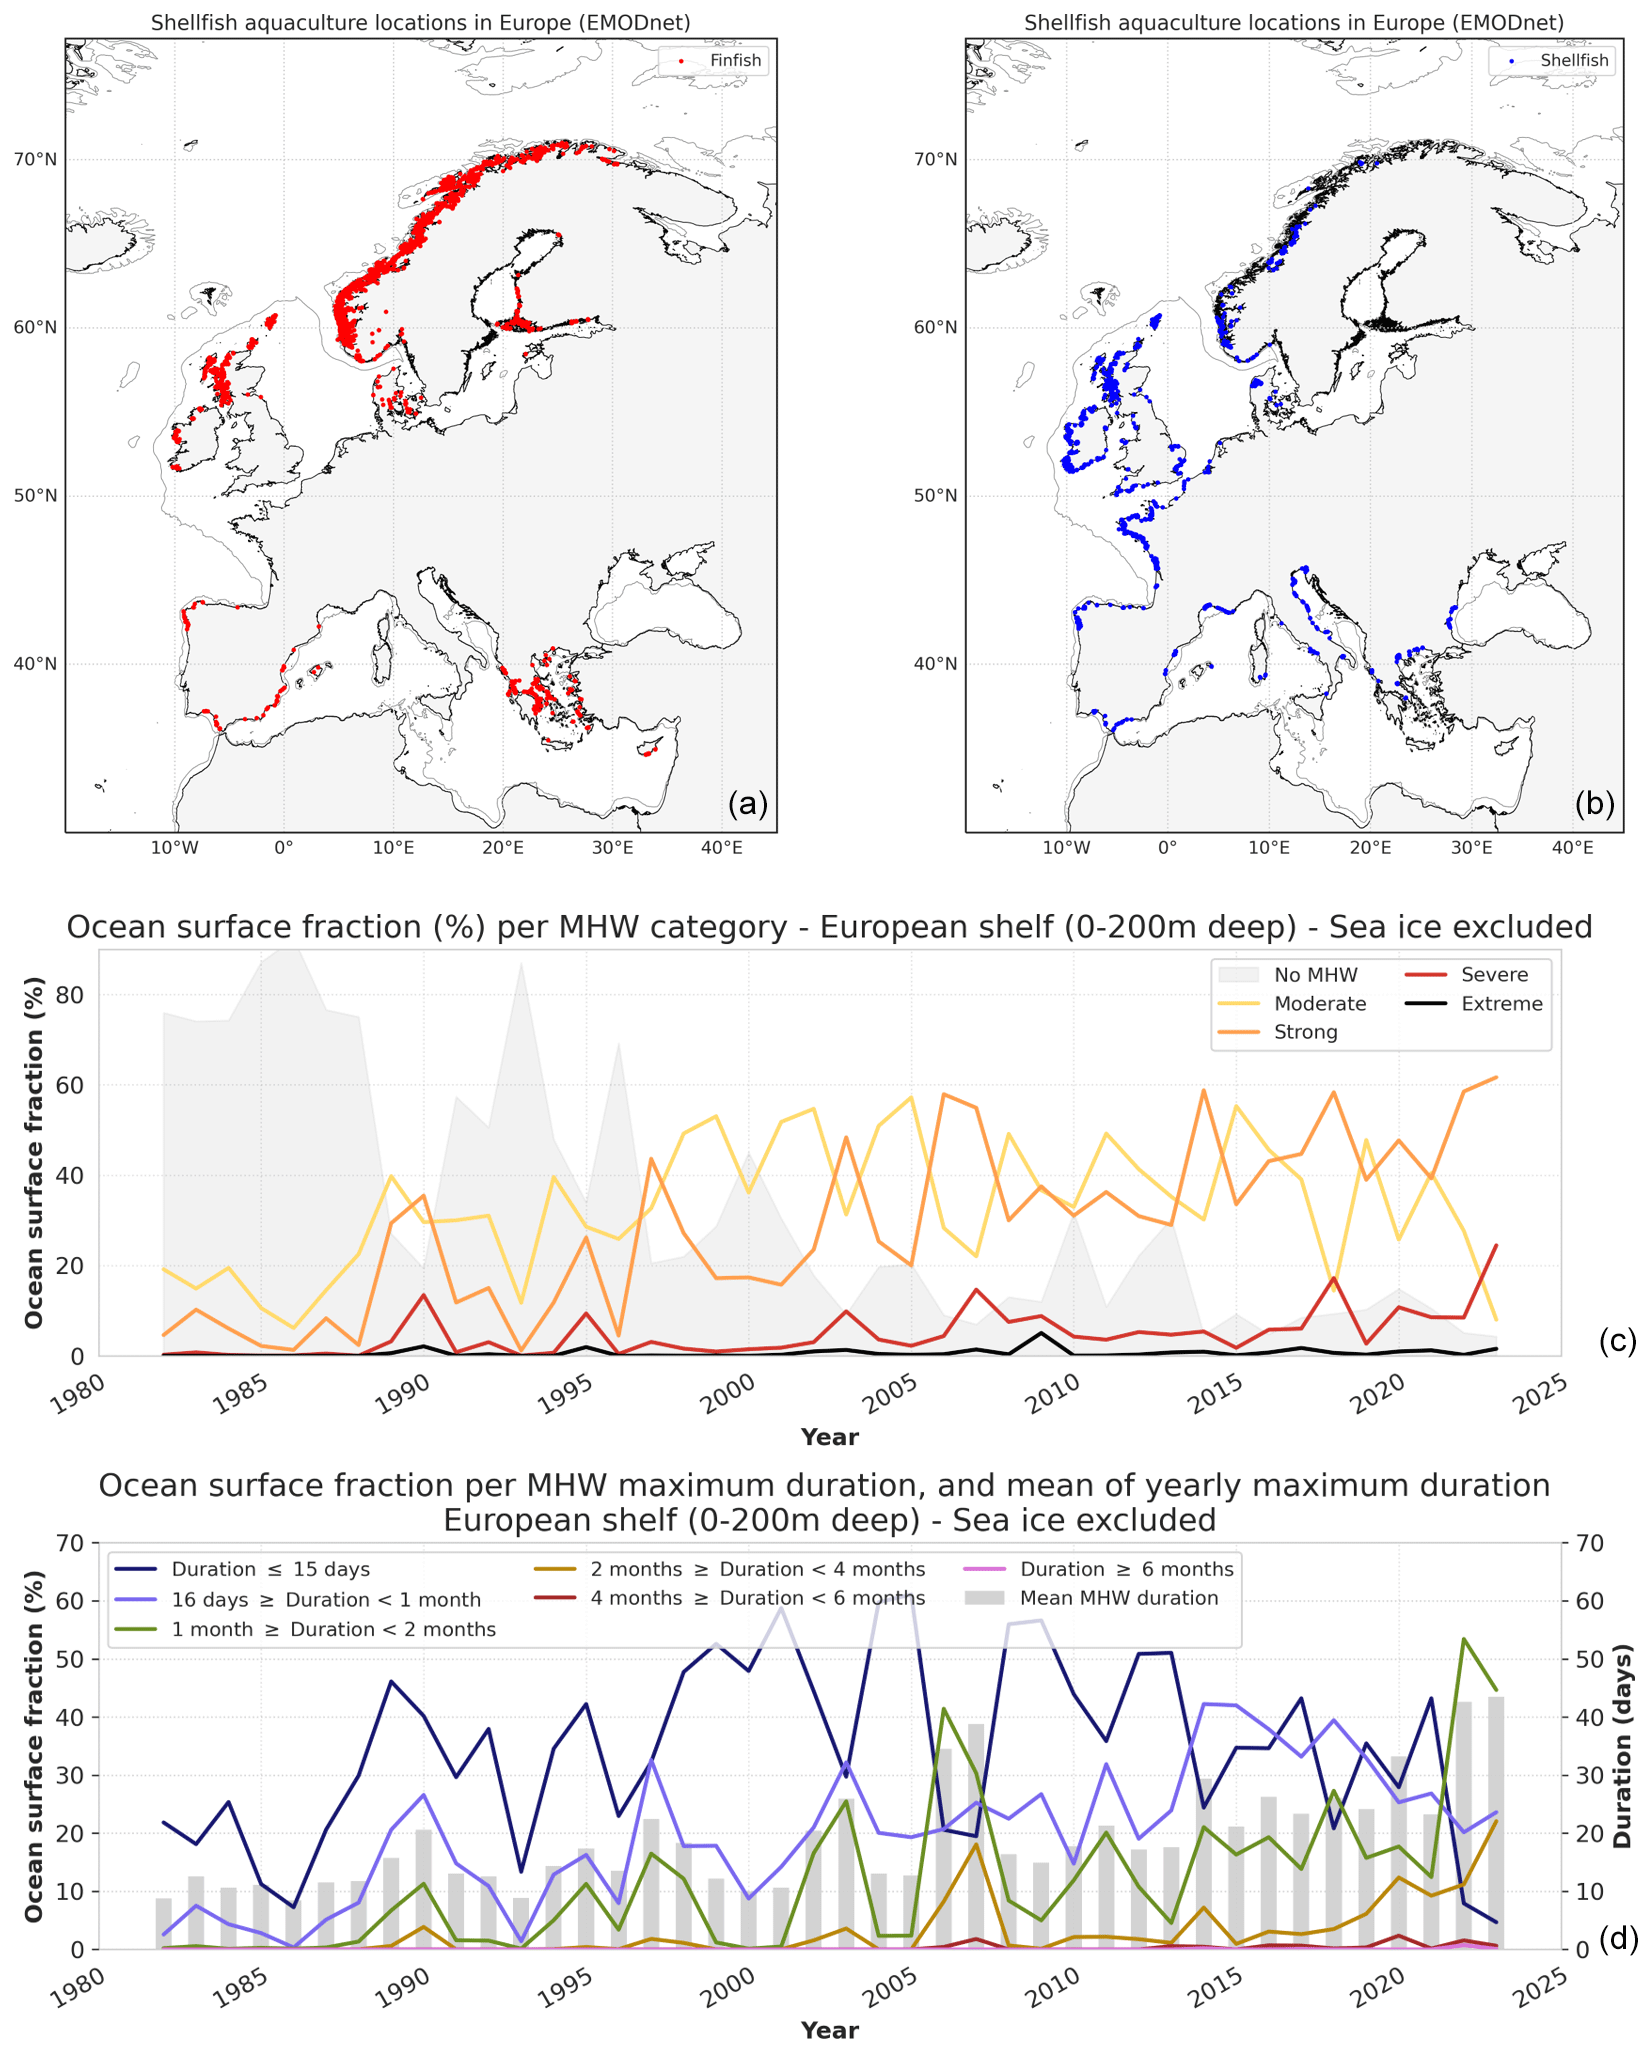
Figure 18(a, b) Aquaculture sites of production in Europe for marine finfish (a) from product ref. MHW.2 and shellfish (b) from product ref. MHW.3. The thin grey line shows the 200 m isobath for product ref. MHW.1. (c) Percentage of ocean surface where the maximum MHW category detected was moderate, strong, severe, extreme, or no showed MHW on the continental shelves of the northeastern Atlantic Ocean and adjacent seas zone (areas within the black polygon in Fig. 17a, with a depth between 0 and 200 m) and excluding sea-ice covered regions (see Fig. 17a for the sea ice mask). These ocean fraction estimates are done following the same method as Hobday et al. (2018). (d) Percentage of global ocean surface where the maximum MHW duration was within a given period (lines) and the yearly mean of maximum MHW durations (bars) for the same continental shelf areas, excluding sea-ice-covered regions (see Fig. 17a for the sea ice mask). The evaluation of the MHW indicators is done following the method of Hobday et al. (2016) and is derived from product refs. SST.1 and SST.2.
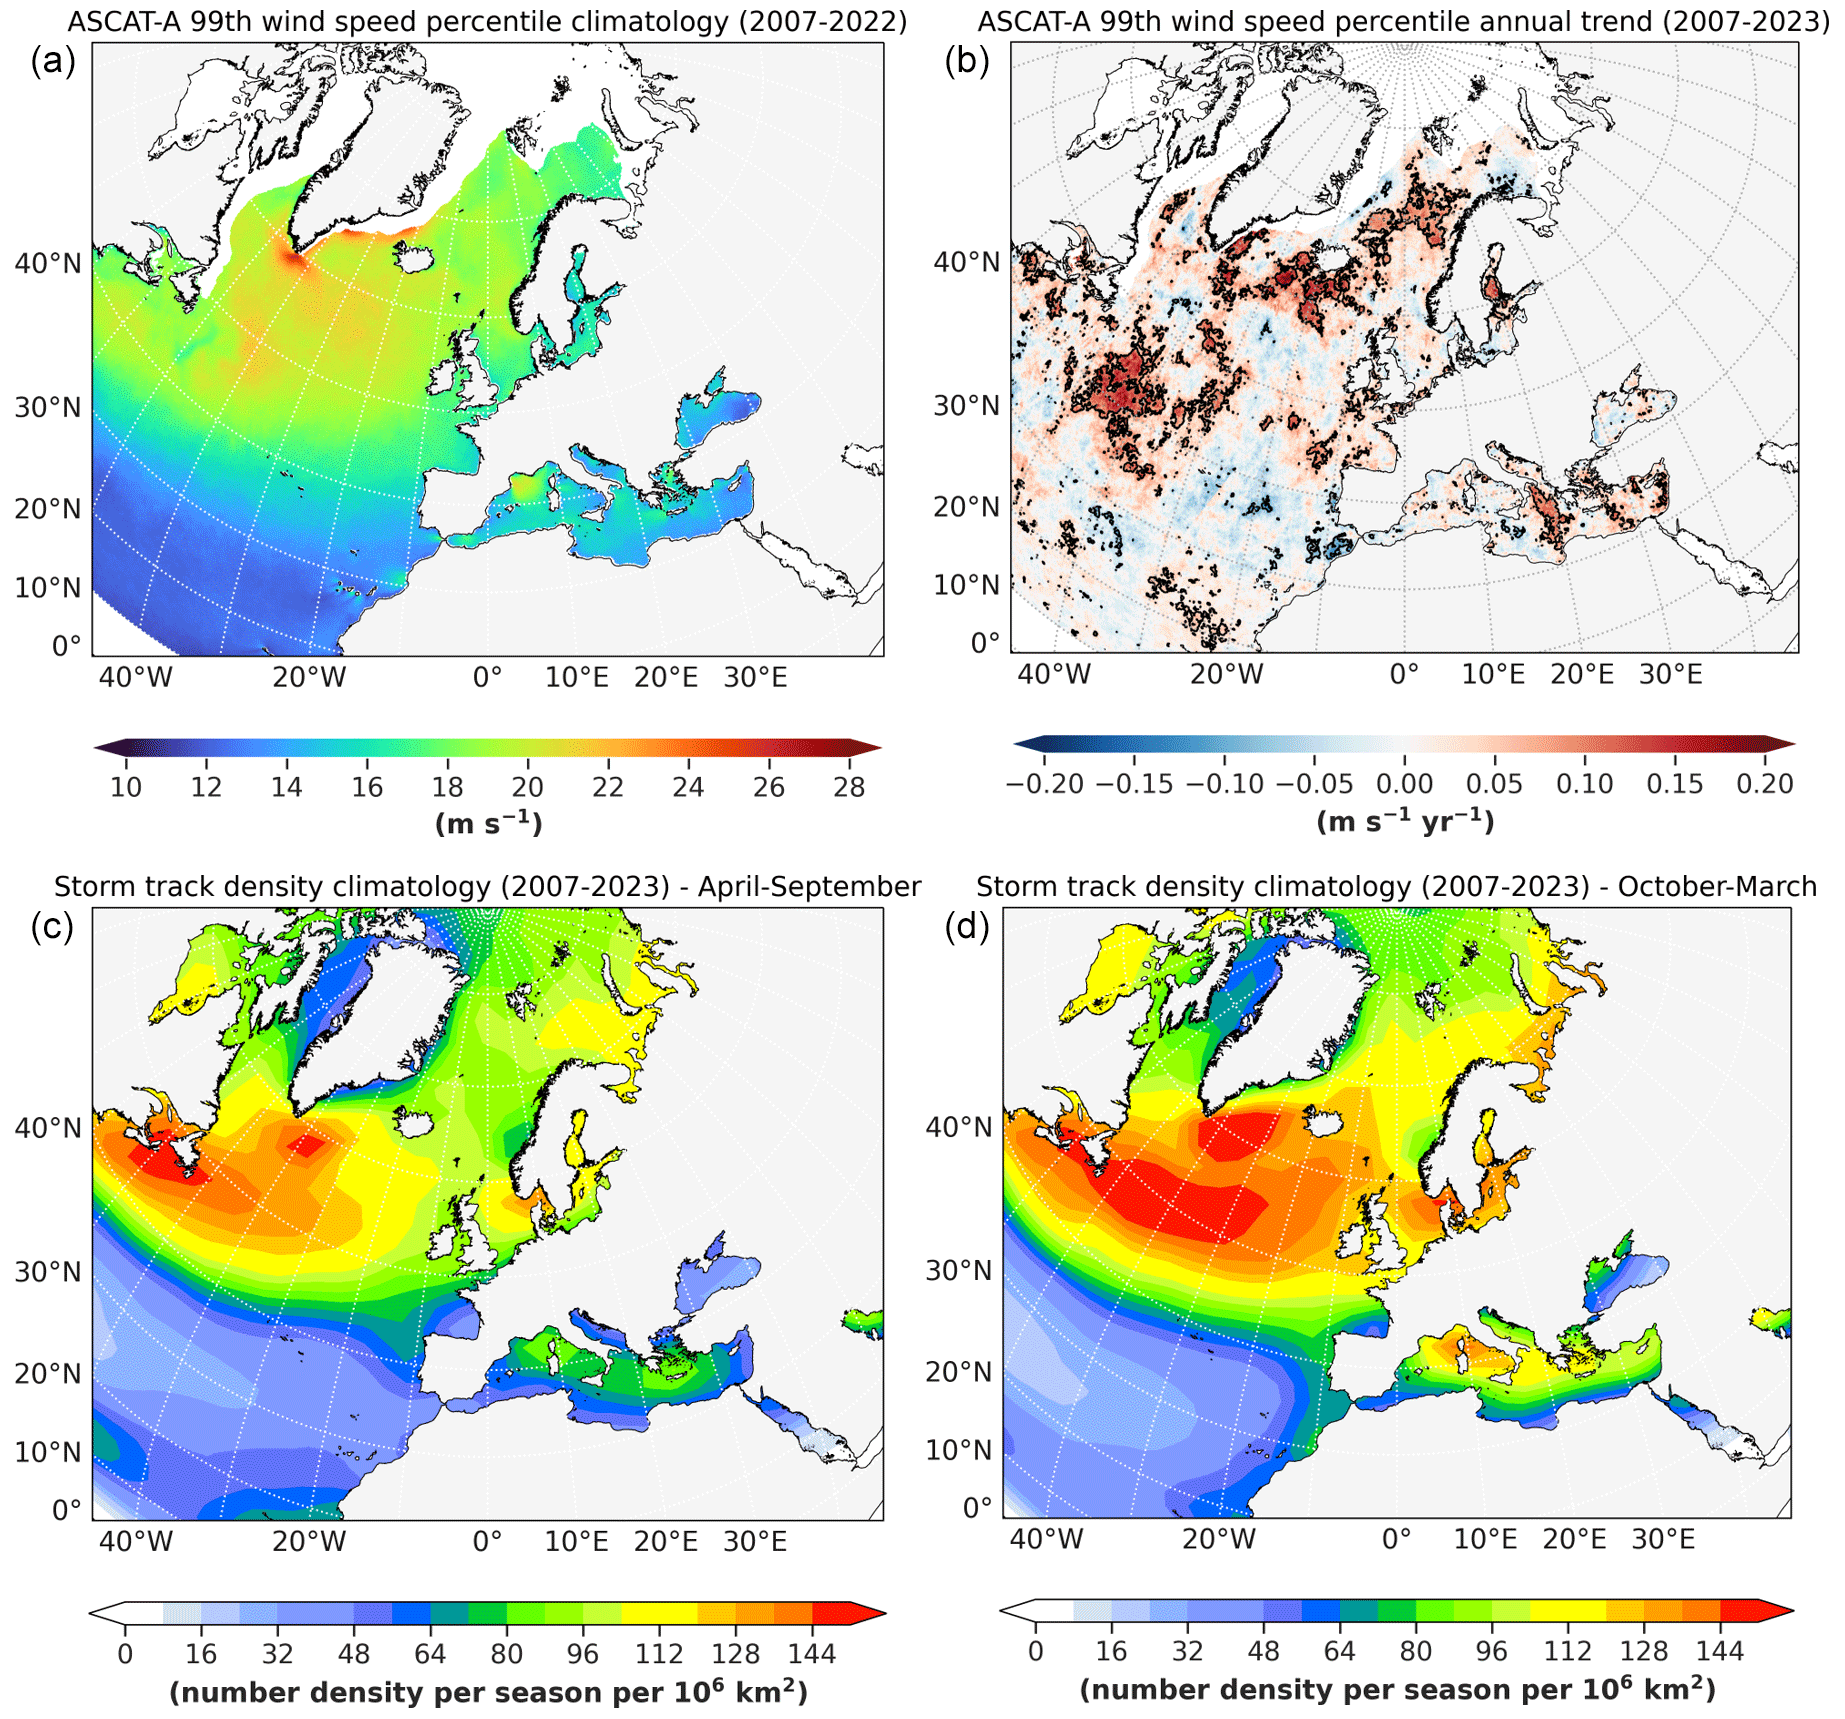
Figure 19The 99th wind speed percentile (a) climatology (2007–2022) and (b) annual trend (2007–2023). Areas with trends significant above the 90 % confidence level are outlined in black. Computation at 0.125° resolution from product ref. Wind.1 (ASCAT-A) following the method of Giesen and Stoffelen (2022). (c, d) Seasonal storm track density climatology over the period 2007–2023, for spring–summer (April to September c) and autumn–winter (October to March, d), in units of number density per season per unit area, where the unit area is a 5° radius spherical cap (i.e. about 106 km2), based on the storm tracks detected from product ref. Wind.2 with a threshold of 10−5 s−1 for the 850 hPa relative vorticity at T63 resolution, considering systems that last longer than 1 d and travel more than 500 km, following Hodges (1999, 1995) and Hoskins and Hodges (2002).
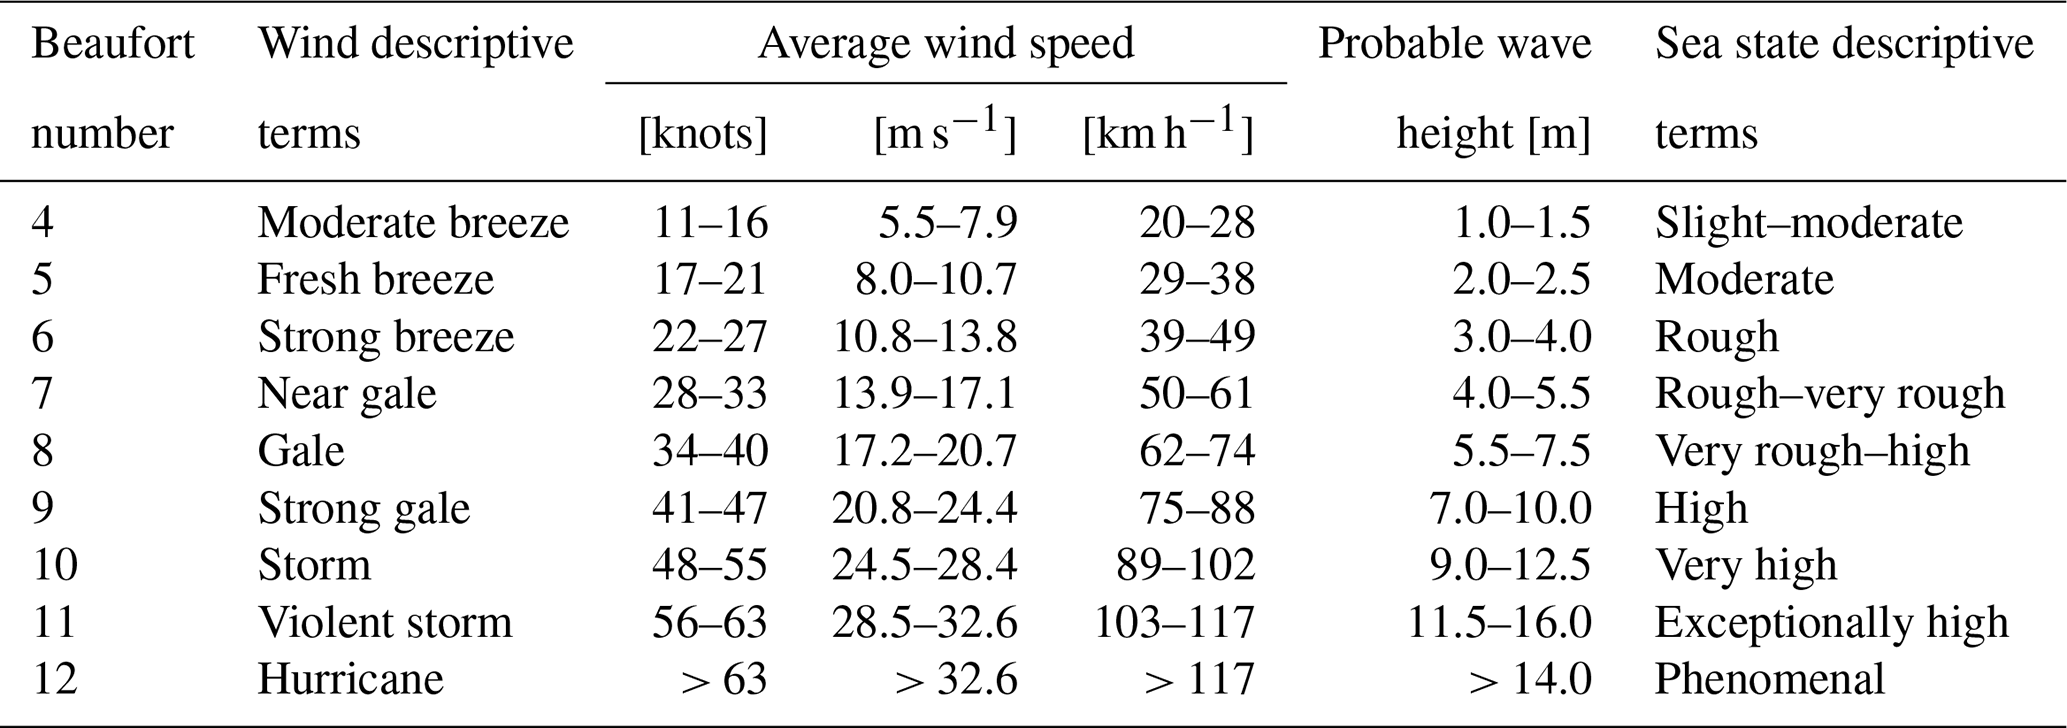
Table 3Beaufort wind scale (ignoring calm conditions from 0 to 3), other commonly used wind speed units, associated probable wave heights in the open ocean, and descriptive terms for wind and waves conditions (WMO, 2019).
The Mediterranean Sea is an area where also a multidecadal increase in the frequency and intensity of marine heatwaves has been reported (Juza et al., 2022; Dayan et al., 2022). This basin experienced an exceptionally long-lasting and intense series of marine heatwave events between 2022 and 2023 (Fig. 17), as MHWs have been continuously detected since June 2022 until the end of 2023, particularly in the western basin (Marullo et al., 2023). In 2022, the heatwave intensity was highest in the northern parts of the western Mediterranean, decreasing to the south and to the east. In 2023, almost the entire Mediterranean Sea experienced at least one marine heatwave of strong category, and the strongest events happened in the Ionian Sea basin (severe category) (Fig. 17).
Thermal stress on marine organisms can lead to a decrease in production (Islam et al., 2022; Smith et al., 2023), and in the worst cases unusual warming of the waters can lead to lower seawater dissolved oxygen quantities, which can cause asphyxia (Keeling et al., 2009; Roman et al., 2019) and/or foster the development of toxic algae or parasites that can prevent the consumption of farmed shellfish and finfish (Cavole et al., 2016; Boudouresque et al., 2024). Some regions of high production of shellfish and/or finfish (Fig. 12) were affected by strong to severe marine heatwaves in 2022 and 2023 (Baltic Sea, Irish Sea, English Channel, northwestern Mediterranean Sea, Adriatic Sea) or by marine heatwave events that sometimes lasted more than 2 or 3 months in a row (English Channel, Irish Sea, Balearic Sea, Adriatic Sea) (Fig. 17).
In 2022, more than 66 % of the shelf ocean surface (regions with depth between 0 and 200 m) in the northeastern Atlantic Ocean and adjacent seas experienced strong (58 %) and severe or extreme (8 %) marine heatwave events. Here we exclude sea-ice-covered regions as they represent 40 % of the considered shelf area and the marine heatwave detections may be less accurate there; see Table 2 and Fig. 17. In 2023, 88 % of these shelf regions were affected by strong (62 %), severe (24 %), or extreme (2 %) marine heatwave events. There is a clear ascending trend in the ocean surface fraction affected by marine heatwave events in these shelf regions over the last 40 years, with about 20 % of the area experiencing MHW events in the 1980s and more than 90 % in 2023 (Fig. 18). The areas affected by strong and severe events have increased over the whole period, while the extreme events are relatively stable and rare. The annual mean maximum duration of the marine heatwave events has also increased, from about 10 d in 1982 to about 40 d in the most recent years, with larger fractions of the ocean surface affected by longer events, in particular those lasting between 2 weeks and 4 months. In general, more interannual variability can be noted in these shelf estimates than when considering the whole northeastern Atlantic Ocean and adjacent seas region (Fig. 16), as the shelf regions are more sensitive to local oceanic and atmospheric dynamics and drivers.
5.2 Wind extremes
Monitoring extreme ocean surface winds, including their evolution and change over time, is of particular importance to ensure accurate representation of all linked ocean parameters (e.g. waves, storm surges, sea surface temperature, currents; Alvarez-Fanjul et al., 2019, 2022; de Alfonso et al., 2020; Staneva et al., 2020; Berta et al., 2020; Raudsepp et al., 2021; Mourre et al., 2023) in order to better understand the associated disaster risks (e.g. coastal flooding and impacts on offshore and coastal infrastructure, activities, and ecosystems), design marine infrastructures, and feed early warning systems and risk prevention and adaptation plans (de Alfonso et al., 2020; Drago et al., 2021), in line with the priorities identified in the United Nations Sendai Framework for Disaster Risk Reduction 2015–2030 (UNDRR, 2024).
When considering the northeastern Atlantic Ocean and adjacent seas, the regions that show the highest extreme ocean surface winds over the 2007–2022 period are the central and northern parts of the North Atlantic Ocean (more than 22 m s−1), especially between Greenland and Iceland and along the southern coast of Greenland (more than 26 m s−1, which corresponds to storms in the Beaufort wind scale; see Table 3) (Fig. 19a). The tropical North Atlantic Ocean (0 and 30° N) is characterized by lower extreme winds in the 99th percentile climatology, ranging between 12 and 14 m s−1.
Another area with strong extreme winds (about 20 m s−1) is the Gulf of Lion in the northwestern Mediterranean Sea, which is a region of strong cyclogenesis known to experience the most severe winds in the entire Mediterranean Sea (e.g. Zecchetto and De Biasio, 2007) and the highest extreme wind waves (Barbariol et al., 2021). In the Mediterranean Sea, a sub-group of cyclonic storms is called Medicanes (Mediterranean hurricanes). Although there is no official physical definition for the meteorological term Medicane, it is generally associated with systems that, despite being smaller in size and intensity (wind speed), share similarities with tropical cyclones, such as a circular shape with a warm core and low wind at the centre, surrounded by strong winds (MedECC, 2020a; Flaounas et al., 2022). As their definition may vary depending on the studies, there is still uncertainty on the statistics of the number or intensity of Medicanes, but they seem to generally occur one to three times per year (Cavicchia et al., 2014; Gaertner et al., 2018; Zhang et al., 2021).
In early September 2023, Storm Daniel was identified as the deadliest Medicane in recent history, hitting the coast of Libya with massive rainfall that led to the destruction of two dams, flooding the coastal city of Darna and causing more than 12 350 deaths in the area (EM-DAT, 2024). In comparison, for the whole year 2022, 43 deaths were reported by this dataset due to storm events in Europe. According to IPCC AR6, the number of Medicane events is likely to decrease, but their intensity is likely to increase under global warming (Seneviratne et al., 2021) as atmospheric convection and moisture are expected to be enhanced by higher sea surface temperatures (Flaounas et al., 2022).
At the regional scale, the detection of long-term changes also remains a challenge due to high variability and the limited length of the time series. Over the past 16 years (2007–2023), increasing extreme wind speeds are observed in several areas over the northeastern Atlantic Ocean and adjacent seas (Fig. 19). These include the central North Atlantic Ocean Gulf Stream region (30–35° N, 30–50° W), the sub-polar Atlantic region between Greenland and south of Iceland, the Norwegian Sea, the Baltic Sea, and the eastern Mediterranean Sea (Ionian Sea and Levantine Sea). Such changes in extreme wind intensity in the North Atlantic Ocean may be associated with the poleward migration of tropical and extra-tropical cyclone tracks that is observed as the tropics expand with global warming (Seneviratne et al., 2021). However, further analysis, specific detection, and attribution studies, as well as longer time series, are needed in the future for the identification of long-term trends in observed extreme wind speeds (Gentile et al., 2023).
Another approach to spatially diagnose extreme ocean surface winds is to evaluate the storm track density (Fig. 19) (Hodges, 1999, 1995; Hoskins and Hodges, 2002). During the spring to summer season (i.e. April to September), the average storm density exceeds 140 south of Greenland and around 40° N at the Canadian coast (Fig. 19c). Areas where the storm density exceeds 100 include the North Sea, the Baltic Sea, the Barents Sea, the Kara Sea, and the northern Mediterranean Sea (Fig. 19c). During the autumn to winter season (i.e. October to March), these patterns intensify and increase in size, spanning the entire Atlantic Ocean across 40° N from the Canadian coast up to the coast of Europe, and the average storm density increases to more than 120 in the adjacent seas (Fig. 19d).
Codes are not publicly available, but can be obtained upon request.
Information about the availability of the datasets used in this paper is provided in the Supplement, and all products are publicly available.
The supplement related to this article is available online at: https://doi.org/10.5194/sp-4-osr8-2-2024-supplement.
KvS, LM, MC, FG: conceptualization, methodology, writing – original draft, investigation, supervision, and formal analysis. All authors: writing – review and editing and data curation.
At least one of the (co-)authors is a member of the editorial board of State of the Planet. The peer-review process was guided by an independent editor, and the authors also have no other competing interests to declare.
Please note that this article has undergone editorial review only.
Publisher's note: Copernicus Publications remains neutral with regard to jurisdictional claims made in the text, published maps, institutional affiliations, or any other geographical representation in this paper. While Copernicus Publications makes every effort to include appropriate place names, the final responsibility lies with the authors.
Ablain, M., Jugier, R., Zawadki, L., Taburet, N., Cazenave, A., and Meyssignac, B.: The TOPEX-A drift and impacts on GMSL time series, AVISO, https://meetings.aviso.altimetry.fr/fileadmin/user_upload/tx_ausyclsseminar/files/Poster_OSTST17_GMSL_Drift_TOPEX-A.pdf (last access: 11 September 2024), 2017.
Allan, D. and Allan, R. P.: Seasonal Changes in the North Atlantic Cold Anomaly: The Influence of Cold Surface Waters From Coastal Greenland and Warming Trends Associated With Variations in Subarctic Sea Ice Cover, J. Geophys. Res.-Oceans, 124, 9040–9052, https://doi.org/10.1029/2019JC015379, 2019.
Alvarez-Fanjul, E., de Pascual Collar, A., Perez-Gomez, B., de Alfonso, M., Garcia Sotillo, M., Staneva, J., Clementi, E., Grandi, A., Zacharioudaki, A., Korres, G., Ravdas, M., Renshaw, R., Tinker, J., Raudsepp, U., Lagemaa, P., Maljutenko, I., Geyer, G., Müller, M., and Yumruktepe, V. Ç.: Sea level, sea surface temperature and SWH extreme percentiles: combined analysis from model results and in situ observations, in: Copernicus Marine Service Ocean State Report, Issue 3, J. Oper. Oceanogr., 12, s31–s43, https://doi.org/10.1080/1755876X.2019.1633075, 2019.
Alvarez-Fanjul, E., Pérez Gomez, B., de Alfonso Alonso-Muñoyerro, M., Lorente, P., Garcia Sotillo, M., Lin-Ye, J., Aznar Lecocq, R., Ruiz Gil de la Serna, M., Perez Rubio, S., Clementi, E., Coppini, G., Garcia-Leon, M., Fernandes, M., Garcia Valdecasas, J., Garcia Valdecasas, J. M., Santos Muñoz, D., Luna Rico, M. Y., Mestres, M., Molina, R., Tintoré, J., Mourre, B., Masina, S., Mosso, C., Reyes, E., and Santana, A.: Western Mediterranean record-breaking storm Gloria: An integrated assessment based on models and observations, in: Copernicus Ocean State Report, Issue 6, J. Oper. Oceanogr., 15, s151–s159, https://doi.org/10.1080/1755876X.2022.2095169, 2022.
Andersen, J. H., Carstensen, J., Conley, D. J., Dromph, K., Fleming-Lehtinen, V., Gustafsson, B. G., Josefson, A. B., Norkko, A., Villnäs, A., and Murray, C.: Long-term temporal and spatial trends in eutrophication status of the Baltic Sea, Biol. Rev., 92, 135–149, https://doi.org/10.1111/BRV.12221, 2017.
Avşar, N. B. and Kutoglu, Ş. H.: Recent Sea Level Change in the Black Sea from Satellite Altimetry and Tide Gauge Observations, ISPRS Int. J. Geo-Inf., 9, 185, https://doi.org/10.3390/IJGI9030185, 2020.
Barbariol, F., Davison, S., Falcieri, F. M., Ferretti, R., Ricchi, A., Sclavo, M., and Benetazzo, A.: Wind Waves in the Mediterranean Sea: An ERA5 Reanalysis Wind-Based Climatology, Front. Mar. Sci., 8, 760614, https://doi.org/10.3389/FMARS.2021.760614, 2021.
Bednarsek, N., Guilloux, B., Canu, D. M., Galdies, C., Guerra, R., Simoncelli, S., Feely, R. A., Pelletier, G., Gašparović, B., Godrijan, J., Malej, A., Solidoro, C., Turk, V., Zunino, S., Bednarsek, N., Guilloux, B., Canu, D. M., Zunino, S., and Guerra, R.: Ocean Acidification as a Governance Challenge in the Mediterranean Sea: Impacts from Aquaculture and Fisheries, 403–432, https://doi.org/10.1007/978-3-031-20740-2_18, 2023.
Berta, M., Corgnati, L., Magaldi, M. G., Griffa, A., Mantovani, C., Rubio, A., Reyes, E., and Mader, J.: Small scale ocean weather during an extreme wind event in the Ligurian Sea, in: Copernicus Marine Service Ocean State Report, Issue 4, J. Oper. Oceanogr., 13, s149–s155, https://doi.org/10.1080/1755876X.2020.1785097, 2020.
Berx, B., Hansen, B., Østerhus, S., Larsen, K. M., Sherwin, T., and Jochumsen, K.: Combining in situ measurements and altimetry to estimate volume, heat and salt transport variability through the Faroe–Shetland Channel, Ocean Sci., 9, 639–654, https://doi.org/10.5194/os-9-639-2013, 2013.
Bopp, L., Lévy, M., Resplandy, L., and Sallée, J. B.: Pathways of anthropogenic carbon subduction in the global ocean, Geophys. Res. Lett., 42, 6416–6423, https://doi.org/10.1002/2015GL065073, 2015.
Boudouresque, C. F., Astruch, P., André, S., Belloni, B., Blanfuné, A., Charbonnel, É., Cheminée, A., Cottalorda, J. M., Dupuy de la Grandrive, R., Marengo, M., Monnier, B., Pergent, G., Pergent-Martini, C., Perret-Boudouresque, M., Ruitton, S., Taupier-Letage, I., and Thibaut, T.: The Heatwave of Summer 2022 in the North-Western Mediterranean Sea: Some Species Were Winners, Water, 16, 219, https://doi.org/10.3390/W16020219, 2024.
BSC: State of the Environment of the Black Sea (1996–2000), Pressures and Trends, Publications of the Commission on the Protection of the Black Sea Against Pollution (BSC), Istambul, Turkey, 65 pp., http://www.blacksea-commission.org/Downloads/SOE_2002English.pdf (last access: 11 September 2024), 2002.
BSC: Commission on the Protection of the Black Sea Against Pollution, http://www.blacksea-commission.org/Official%20Documents/The%20Convention/full%20text/, last access: 1 December 2023.
BSC: State of the Environment of the Black Sea (2001–2006/7), edited by: Oguz, T., Publications of the Commission on the Protection of the Black Sea Against Pollution (BSC), Istambul, Turkey, 448 pp., ISBN 978-9944-245-33-3, 2008.
BSC: State of the Environment of the Black Sea (2009–2014/5), edited by: Krutov, A., Publications of the Commission on the Protection of the Black Sea Against Pollution (BSC), Istambul, Turkey, 811 pp., ISBN 978-605-84837-0-5, http://www.blacksea-commission.org/SoE2009-2014/SoE2009-2014.pdf (last access: 11 September 2024), 2019.
Caesar, L., Rahmstorf, S., Robinson, A., Feulner, G., and Saba, V.: Observed fingerprint of a weakening Atlantic Ocean overturning circulation, Nature, 556, 191–196, https://doi.org/10.1038/s41586-018-0006-5, 2018.
Calafat, F. M., Frederikse, T., and Horsburgh, K.: The Sources of Sea-Level Changes in the Mediterranean Sea Since 1960, J. Geophys. Res.-Oceans, 127, e2022JC019061, https://doi.org/10.1029/2022JC019061, 2022.
Carstensen, J. and Duarte, C. M.: Drivers of pH Variability in Coastal Ecosystems, Environ. Sci. Technol., 53, 4020–4029, https://doi.org/10.1021/ACS.EST.8B03655, 2019.
Carstensen, J., Chierici, M., Gustafsson, B. G., and Gustafsson, E.: Long-Term and Seasonal Trends in Estuarine and Coastal Carbonate Systems, Global Biogeochem. Cy., 32, 497–513, https://doi.org/10.1002/2017GB005781, 2018.
Cavicchia, L., von Storch, H., and Gualdi, S.: A long-term climatology of medicanes, Clim. Dynam., 43, 1183–1195, https://doi.org/10.1007/S00382-013-1893-7, 2014.
Cavole, L. M., Demko, A. M., Diner, R. E., Giddings, A., Koester, I., Pagniello, C. M. L. S., Paulsen, M. L., Ramirez-Valdez, A., Schwenck, S. M., Yen, N. K., Zill, M. E., and Franks, P. J. S.: Biological impacts of the 2013–2015 warm-water anomaly in the northeast Pacific: Winners, Losers, and the Future, Oceanography, 29, 273–285, https://doi.org/10.5670/OCEANOG.2016.32, 2016.
Cazenave, A. and Moreira, L.: Contemporary sea-level changes from global to local scales: A review, P. Roy. Soc. A-Math. Phy., 478, 20220049, https://doi.org/10.1098/RSPA.2022.0049, 2022.
Cazenave, A., Gouzenes, Y., Birol, F., Leger, F., Passaro, M., Calafat, F. M., Shaw, A., Nino, F., Legeais, J. F., Oelsmann, J., Restano, M., and Benveniste, J.: Sea level along the world's coastlines can be measured by a network of virtual altimetry stations, Communications Earth & Environment, 3, 1–9, https://doi.org/10.1038/s43247-022-00448-z, 2022.
Chafik, L., Nilsen, J. E. Ø., Dangendorf, S., Reverdin, G., and Frederikse, T.: North Atlantic Ocean Circulation and Decadal Sea Level Change During the Altimetry Era, Sci. Rep., 9, 1–9, https://doi.org/10.1038/s41598-018-37603-6, 2019.
Chemke, R., Zanna, L., and Polvani, L. M.: Identifying a human signal in the North Atlantic warming hole, Nat. Commun., 11, 1–7, https://doi.org/10.1038/s41467-020-15285-x, 2020.
Cheng, L., von Schuckmann, K., Abraham, J. P., Trenberth, K. E., Mann, M. E., Zanna, L., England, M. H., Zika, J. D., Fasullo, J. T., Yu, Y., Pan, Y., Zhu, J., Newsom, E. R., Bronselaer, B., and Lin, X.: Past and future ocean warming, Nat. Rev. Earth Environ., 3, 776–794, https://doi.org/10.1038/s43017-022-00345-1, 2022.
Cheng, L., Abraham, J., Trenberth, K. E., Boyer, T., Mann, M. E., Zhu, J., Wang, F., Yu, F., Locarnini, R., Fasullo, J., Zheng, F., Li, Y., Zhang, B., Wan, L., Chen, X., Wang, D., Feng, L., Song, X., Liu, Y., Reseghetti, F., Simoncelli, S., Gouretski, V., Chen, G., Mishonov, A., Reagan, J., Von Schuckmann, K., Pan, Y., Tan, Z., Zhu, Y., Wei, W., Li, G., Ren, Q., Cao, L., and Lu, Y.: New Record Ocean Temperatures and Related Climate Indicators in 2023, Adv. Atmos. Sci., 41, 1–15, https://doi.org/10.1007/S00376-024-3378-5, 2024.
Cheung, W. W. L. and Frölicher, T. L.: Marine heatwaves exacerbate climate change impacts for fisheries in the northeast Pacific, Sci. Rep., 10, 1–10, https://doi.org/10.1038/s41598-020-63650-z, 2020.
Climate Change in the Baltic Sea: 2021 Fact Sheet, Baltic Sea Environment Proceedings no. 180, HELCOM/Baltic Earth, https://helcom.fi/wp-content/uploads/2021/09/Baltic-Sea-Climate-Change-Fact-Sheet-2021.pdf (last access: 11 September 2024), 2021.
Cossarini, G., Lazzari, P., and Solidoro, C.: Spatiotemporal variability of alkalinity in the Mediterranean Sea, Biogeosciences, 12, 1647–1658, https://doi.org/10.5194/bg-12-1647-2015, 2015.
Cossarini, G., Feudale, L., Teruzzi, A., Bolzon, G., Coidessa, G., Solidoro, C., Di Biagio, V., Amadio, C., Lazzari, P., Brosich, A., and Salon, S.: High-Resolution Reanalysis of the Mediterranean Sea Biogeochemistry (1999–2019), Front. Mar. Sci., 8, 741486, https://doi.org/10.3389/FMARS.2021.741486, 2021.
Cramer, W., Guiot, J., Fader, M., Garrabou, J., Gattuso, J. P., Iglesias, A., Lange, M. A., Lionello, P., Llasat, M. C., Paz, S., Peñuelas, J., Snoussi, M., Toreti, A., Tsimplis, M. N., and Xoplaki, E.: Climate change and interconnected risks to sustainable development in the Mediterranean, Nat. Clim. Change, 8, 972–980, https://doi.org/10.1038/s41558-018-0299-2, 2018.
Darmaraki, S., Somot, S., Sevault, F., and Nabat, P.: Past Variability of Mediterranean Sea Marine Heatwaves, Geophys. Res. Lett., 46, 9813–9823, https://doi.org/10.1029/2019GL082933, 2019.
Dayan, H., McAdam, R., Masina, S., and Speich, S.: Diversity of marine heatwave trends across the Mediterranean Sea over the last decades, in: Copernicus Ocean State Report, Issue 6, J. Oper. Oceanogr., 15, s49–s56, https://doi.org/10.1080/1755876X.2022.2095169, 2022.
Dayan, H., McAdam, R., Juza, M., Masina, S., and Speich, S.: Marine heat waves in the Mediterranean Sea: An assessment from the surface to the subsurface to meet national needs, Front. Mar. Sci., 10, 1045138, https://doi.org/10.3389/FMARS.2023.1045138, 2023.
de Alfonso, M., Garcia-Valdecasas, J. M., Aznar, R., Perez-Gomez, B., Rodriguez, P., de los Santos, F. J., and Alvarez-Fanjul, E.: Record wave storm in the Gulf of Cadiz over the past 20 years and its impact on harbours, in: Copernicus Marine Service Ocean State Report, Issue 4, J. Oper. Oceanogr., 13, s137–s144, https://doi.org/10.1080/1755876X.2020.1785097, 2020.
de Pascual-Collar, Á., Aznar, R., Levier, B., and García-Sotillo, M.: Ocean heat content in the Iberian–Biscay–Ireland regional seas, in: 7th edition of the Copernicus Ocean State Report (OSR7), edited by: von Schuckmann, K., Moreira, L., Le Traon, P.-Y., Grégoire, M., Marcos, M., Staneva, J., Brasseur, P., Garric, G., Lionello, P., Karstensen, J., and Neukermans, G., Copernicus Publications, State Planet, 1-osr7, 9, https://doi.org/10.5194/sp-1-osr7-9-2023, 2023.
Dettmering, D., Müller, F. L., Oelsmann, J., Passaro, M., Schwatke, C., Restano, M., Benveniste, J., and Seitz, F.: North SEAL: a new dataset of sea level changes in the North Sea from satellite altimetry, Earth Syst. Sci. Data, 13, 3733–3753, https://doi.org/10.5194/essd-13-3733-2021, 2021.
Drago, A., Gauci, A., Azzopardi, J., Sanchez, J., and Alonso-Martirena, A.: Monitoring storms by merged data sources for the Malta shelf area in 2019, in: Copernicus Marine Service Ocean State Report, Issue 5, J. Oper. Oceanogr., 14, s148–s156, https://doi.org/10.1080/1755876X.2021.1946240, 2021.
Drijfhout, S., van Oldenborgh, G. J., and Cimatoribus, A.: Is a Decline of AMOC Causing the Warming Hole above the North Atlantic in Observed and Modeled Warming Patterns?, J. Climate, 25, 8373–8379, https://doi.org/10.1175/JCLI-D-12-00490.1, 2012.
Duarte, C. M., Hendriks, I. E., Moore, T. S., Olsen, Y. S., Steckbauer, A., Ramajo, L., Carstensen, J., Trotter, J. A., Mcculloch, M., Duarte, C. M., Hendriks, I. E., Moore, T. S., Olsen, Y. S., Steckbauer, : A, Ramajo, L., Carstensen, J., Trotter, J. A., and Mcculloch, M.: Is Ocean Acidification an Open-Ocean Syndrome? Understanding Anthropogenic Impacts on Seawater pH, Estuar. Coast., 36, 221–236, https://doi.org/10.1007/S12237-013-9594-3, 2013
Dubois, C., von Schuckmann, K., Josey, S., and Ceschin, A.: Changes in the North Atlantic, in: Copernicus Marine Service Ocean State Report, Issue 2, J. Oper. Oceanogr., 11, s66–s70, https://doi.org/10.1080/1755876X.2018.1489208, 2018.
Eilola, K., Mårtensson, S., and Meier, H. E. M.: Modeling the impact of reduced sea ice cover in future climate on the Baltic Sea biogeochemistry, Geophys. Res. Lett., 40, 149–154, https://doi.org/10.1029/2012GL054375, 2013.
Elge, M.: Acidification Analysis of Black Sea, International Journal of Environment and Geoinformatics, 8, 467–474, https://doi.org/10.30897/IJEGEO.857893, 2021.
EM-DAT: Inventorying hazards & disasters worldwide since 1988, https://www.emdat.be/, last access: 11 September 2024.
Fan, Y., Liu, W., Zhang, P., Chen, R., and Li, L.: North Atlantic Oscillation contributes to the subpolar North Atlantic cooling in the past century, Clim. Dynam., 61, 1–17, https://doi.org/10.1007/S00382-023-06847-Y, 2023.
Flaounas, E., Davolio, S., Raveh-Rubin, S., Pantillon, F., Miglietta, M. M., Gaertner, M. A., Hatzaki, M., Homar, V., Khodayar, S., Korres, G., Kotroni, V., Kushta, J., Reale, M., and Ricard, D.: Mediterranean cyclones: current knowledge and open questions on dynamics, prediction, climatology and impacts, Weather Clim. Dynam., 3, 173–208, https://doi.org/10.5194/wcd-3-173-2022, 2022.
Flecha, S., Pérez, F. F., Murata, A., Makaoui, A., and Huertas, I. E.: Decadal acidification in Atlantic and Mediterranean water masses exchanging at the Strait of Gibraltar, Sci. Rep., 9, 1–11, https://doi.org/10.1038/s41598-019-52084-x, 2019.
Fossheim, M., Primicerio, R., Johannesen, E., Ingvaldsen, R. B., Aschan, M. M., and Dolgov, A. V.: Recent warming leads to a rapid borealization of fish communities in the Arctic, Nat. Clim. Change, 5, 673–677, https://doi.org/10.1038/nclimate2647, 2015.
Gaertner, M. Á., González-Alemán, J. J., Romera, R., Domínguez, M., Gil, V., Sánchez, E., Gallardo, C., Miglietta, M. M., Walsh, K. J. E., Sein, D. V., Somot, S., Dell'Aquila, A., Teichmann, C., Ahrens, B., Buonomo, E., Colette, A., Bastin, S., van Meijgaard, E., and Nikulin, G.: Simulation of medicanes over the Mediterranean Sea in a regional climate model ensemble: impact of ocean–atmosphere coupling and increased resolution, Clim. Dynam., 51, 1041–1057, https://doi.org/10.1007/S00382-016-3456-1, 2018.
Garrabou, J., Gómez-Gras, D., Medrano, A., Cerrano, C., Ponti, M., Schlegel, R., Bensoussan, N., Turicchia, E., Sini, M., Gerovasileiou, V., Teixido, N., Mirasole, A., Tamburello, L., Cebrian, E., Rilov, G., Ledoux, J. B., Souissi, J. Ben, Khamassi, F., Ghanem, R., Benabdi, M., Grimes, S., Ocaña, O., Bazairi, H., Hereu, B., Linares, C., Kersting, D. K., la Rovira, G., Ortega, J., Casals, D., Pagès-Escolà, M., Margarit, N., Capdevila, P., Verdura, J., Ramos, A., Izquierdo, A., Barbera, C., Rubio-Portillo, E., Anton, I., López-Sendino, P., Díaz, D., Vázquez-Luis, M., Duarte, C., Marbà, N., Aspillaga, E., Espinosa, F., Grech, D., Guala, I., Azzurro, E., Farina, S., Cristina Gambi, M., Chimienti, G., Montefalcone, M., Azzola, A., Mantas, T. P., Fraschetti, S., Ceccherelli, G., Kipson, S., Bakran-Petricioli, T., Petricioli, D., Jimenez, C., Katsanevakis, S., Kizilkaya, I. T., Kizilkaya, Z., Sartoretto, S., Elodie, R., Ruitton, S., Comeau, S., Gattuso, J. P., and Harmelin, J. G.: Marine heatwaves drive recurrent mass mortalities in the Mediterranean Sea, Glob. Change Biol., 28, 5708–5725, https://doi.org/10.1111/GCB.16301, 2022.
Gehlen, M., Chau, T. T. T., Conchon, A., Denvil-Sommer, A., Chevallier, F., Vrac, M., and Mejia, C.: Ocean acification, in: Copernicus Marine Service Ocean State Report, Issue 4, J. Oper. Oceanogr., 13, s64–s66, https://doi.org/10.1080/1755876X.2020.1785097, 2020.
Gentile, E. S., Zhao, M., and Hodges, K.: Poleward intensification of midlatitude extreme winds under warmer climate, npj Climate and Atmospheric Science, 6, 1–10, https://doi.org/10.1038/s41612-023-00540-x, 2023.
Gerland, S., Ingvaldsen, R. B., Reigstad, M., Sundfjord, A., Bogstad, B., Chierici, M., Hop, H., Renaud, P. E., Smedsrud, L. H., Stige, L. C., Arthun, M., Berge, J., Bluhm, B. A., Borgå, K., Bratbak, G., Divine, D. V., Eldevik, T., Eriksen, E., Fer, I., Fransson, A., Gradinger, R., Granskog, M. A., Haug, T., Husum, K., Johnsen, G., Jonassen, M. O., Jørgensen, L. L., Kristiansen, S., Larsen, A., Lien, V. S., Lind, S., Lindstrøm, U., Mauritzen, C., Melsom, A., Mernild, S. H., Müller, M., Nilsen, F., Primicerio, R., Søreide, J. E., van der Meeren, G. I., and Wassmann, P.: Still Arctic? – The changing Barents Sea, Elem. Sci. Anth., 11, 1–62, https://doi.org/10.1525/ELEMENTA.2022.00088, 2023.
Gervais, M., Shaman, J., and Kushnir, Y.: Impacts of the North Atlantic Warming Hole in Future Climate Projections: Mean Atmospheric Circulation and the North Atlantic Jet, J. Climate, 32, 2673–2689, https://doi.org/10.1175/JCLI-D-18-0647.1, 2019.
Gervais, M., Shaman, J., and Kushnir, Y.: Impact of the North Atlantic Warming Hole on Sensible Weather, J. Climate, 33, 4255–4271, https://doi.org/10.1175/JCLI-D-19-0636.1, 2020.
Girjatowicz, J. P. and Łabuz, T. A.: Forms of piled ice at the southern coast of the Baltic Sea, Estuar. Coast. Shelf Sci., 239, 106746, https://doi.org/10.1016/J.ECSS.2020.106746, 2020.
Giesen, R. and Stoffelen, A.: Changes in extreme wind speeds over the global ocean, in: Copernicus Ocean State Report, Issue 6, J. Oper. Oceanogr., 15, s8–s15, https://doi.org/10.1080/1755876X.2022.2095169, 2022.
Granskog, M., Kaartokallio, H., Kuosa, H., Thomas, D. N., and Vainio, J.: Sea ice in the Baltic Sea – A review, Estuar. Coast. Shelf Sci., 70, 145–160, https://doi.org/10.1016/J.ECSS.2006.06.001, 2006.
Gregory, J. M., Griffies, S. M., Hughes, C. W., Lowe, J. A., Church, J. A., Fukimori, I., Gomez, N., Kopp, R. E., Landerer, F., Cozannet, G. Le, Ponte, R. M., Stammer, D., Tamisiea, M. E., and van de Wal, R. S. W.: Concepts and Terminology for Sea Level: Mean, Variability and Change, Both Local and Global, Surv. Geophys., 40, 1251–1289, https://doi.org/10.1007/S10712-019-09525-Z, 2019
Gruber, N., Clement, D., Carter, B. R., Feely, R. A., van Heuven, S., Hoppema, M., Ishii, M., Key, R. M., Kozyr, A., Lauvset, S. K., Monaco, C. Lo, Mathis, J. T., Murata, A., Olsen, A., Perez, F. F., Sabine, C. L., Tanhua, T., and Wanninkhof, R.: The oceanic sink for anthropogenic CO 2 from 1994 to 2007, Science, 363, 1193–1199, https://doi.org/10.1126/SCIENCE.AAU5153, 2019.
Gustafsson, B. G., Schenk, F., Blenckner, T., Eilola, K., Meier, H. E. M., Müller-Karulis, B., Neumann, T., Ruoho-Airola, T., Savchuk, O. P., and Zorita, E.: Reconstructing the development of baltic sea eutrophication 1850–2006, Ambio, 41, 534–548, https://doi.org/10.1007/S13280-012-0318-X, 2012.
Gustafsson, E. and Gustafsson, B. G.: Future acidification of the Baltic Sea – A sensitivity study, J. Marine Syst., 211, 103397, https://doi.org/10.1016/J.JMARSYS.2020.103397, 2020.
Gustafsson, E., Carstensen, J., Fleming, V., Gustafsson, B. G., Hoikkala, L., and Rehder, G.: Causes and consequences of acidification in the Baltic Sea: implications for monitoring and management, Sci. Rep., 13, 1–11, https://doi.org/10.1038/s41598-023-43596-8, 2023.
Gutiérrez, J. M., Jones, R. G., Narisma, G. T., Alves, L. M., Amjad, M., Gorodetskaya, I. V, Grose, M., Klutse, N. A. B., Krakovska, S., Li, J., Martínez-Castro, D., Mearns, L. O., Mernild, S. H., Ngo-Duc, T., van den Hurk, B., and Yoon, J.-H.: Atlas, in: Climate Change 2021: The Physical Science Basis. Contribution of Working Group I to the Sixth Assessment Report of the Intergovernmental Panel on Climate Change, edited by: Masson-Delmotte, V., Zhai, P., Pirani, A., Connors, S. L., Péan, C., Berger, S., Caud, N., Chen, Y., Goldfarb, L., Gomis, M. I., Huang, M., Leitzell, K., Lonnoy, E., Matthews, J. B. R., Maycock, T. K., Waterfield, T., Yelekçi, O., Yu, R., and Zhou, B., Cambridge University Press, Cambridge, United Kingdom and New York, NY, USA, 1927–2058, https://doi.org/10.1017/9781009157896.021, 2021.
Hansen, J., Ruedy, R., Sato, M., and Lo, K.: Global Surface Temperature Change, Rev. Geophys., 48, 4004, https://doi.org/10.1029/2010RG000345, 2010.
Hassoun, A. E. R., Gemayel, E., Krasakopoulou, E., Goyet, C., Abboud-Abi Saab, M., Guglielmi, V., Touratier, F., and Falco, C.: Acidification of the Mediterranean Sea from anthropogenic carbon penetration, Deep-Sea Res. Pt. I, 102, 1–15, https://doi.org/10.1016/J.DSR.2015.04.005, 2015.
Hassoun, A. E. R., Fakhri, M., Raad, N., Abboud-Abi Saab, M., Gemayel, E., and De Carlo, E. H.: The carbonate system of the Eastern-most Mediterranean Sea, Levantine Sub-basin: Variations and drivers, Deep-Sea Res. Pt. II, 164, 54–73, https://doi.org/10.1016/J.DSR2.2019.03.008, 2019.
Hassoun, A. E. R., Bantelman, A., Canu, D., Comeau, S., Galdies, C., Gattuso, J. P., Giani, M., Grelaud, M., Hendriks, I. E., Ibello, V., Idrissi, M., Krasakopoulou, E., Shaltout, N., Solidoro, C., Swarzenski, P. W., and Ziveri, P.: Ocean acidification research in the Mediterranean Sea: Status, trends and next steps, Front. Mar. Sci., 9, 892670, https://doi.org/10.3389/FMARS.2022.892670, 2022.
Hátún, H., Azetsu-Scott, K., Somavilla, R., Rey, F., Johnson, C., Mathis, M., Mikolajewicz, U., Coupel, P., Tremblay, J., Hartman, S., Pacariz, S. V., Salter, I., and Ólafsson, J.: The subpolar gyre regulates silicate concentrations in the North Atlantic, Sci. Rep., 7, 1–9, https://doi.org/10.1038/s41598-017-14837-4, 2017.
Havsis | SMHI: https://www.smhi.se/data/oceanografi/havsis, last access: 5 December 2023.
HELCOM: HELCOM Thematic assessment of Eutrophication 2016–2021, Baltic Sea Environment Proceedings No. 192, https://helcom.fi/wp-content/uploads/2023/06/HELCOM-Thematic-assessment-of-eutrophication-2016-2021.pdf (last access: 11 September 2024), 2023a.
HELCOM: State of the Baltic Sea. Third HELCOM holistic assessment 2016-2021, Baltic Sea Environment Proceedings no. 194, https://helcom.fi/wp-content/uploads/2023/10/State-of-the-Baltic-Sea-2023.pdf (last access: 11 September 2024), 2023b.
Hiscock, W. T. and Millero, F. J.: Alkalinity of the anoxic waters in the Western Black Sea, Deep-Sea Res. Pt. II, 53, 1787–1801, https://doi.org/10.1016/J.DSR2.2006.05.020, 2006.
Hobday, A. J., Alexander, L. V., Perkins, S. E., Smale, D. A., Straub, S. C., Oliver, E. C. J., Benthuysen, J. A., Burrows, M. T., Donat, M. G., Feng, M., Holbrook, N. J., Moore, P. J., Scannell, H. A., Sen Gupta, A., and Wernberg, T.: A hierarchical approach to defining marine heatwaves, Prog. Oceanogr., 141, 227–238, https://doi.org/10.1016/J.POCEAN.2015.12.014, 2016.
Hobday, A. J., Oliver, E. C. J., Gupta, A. Sen, Benthuysen, J. A., Burrows, M. T., Donat, M. G., Holbrook, N. J., Moore, P. J., Thomsen, M. S., Wernberg, T., and Smale, D. A.: Categorizing and naming marine heatwaves, Oceanography, 31, 162–173, https://doi.org/10.5670/OCEANOG.2018.205, 2018.
Hodges, K. I.: Feature Tracking on the Unit Sphere, Mon. Weather Rev., 123, 3458–3465, https://doi.org/10.1175/1520-0493(1995)123<3458:FTOTUS>2.0.CO;2, 1995.
Hodges, K. I.: Adaptive Constraints for Feature Tracking, Mon. Weather Rev., 127, 1362–1373, https://doi.org/10.1175/1520-0493(1999)127<1362:ACFFT>2.0.CO;2, 1999.
Holliday, N. P., Bersch, M., Berx, B., Chafik, L., Cunningham, S., Florindo-López, C., Hátún, H., Johns, W., Josey, S. A., Larsen, K. M. H., Mulet, S., Oltmanns, M., Reverdin, G., Rossby, T., Thierry, V., Valdimarsson, H., and Yashayaev, I.: Ocean circulation causes the largest freshening event for 120 years in eastern subpolar North Atlantic, Nat. Commun., 11, 1–15, https://doi.org/10.1038/s41467-020-14474-y, 2020.
Hoskins, B. J. and Hodges, K. I.: New Perspectives on the Northern Hemisphere Winter Storm Tracks, J. Atmos. Sci., 59, 1041–1061, https://doi.org/10.1175/1520-0469(2002)059<1041:NPOTNH>2.0.CO;2, 2002.
Hu, S. and Fedorov, A. V.: Indian Ocean warming as a driver of the North Atlantic warming hole, Nat. Commun., 11, 1–11, https://doi.org/10.1038/s41467-020-18522-5, 2020.
Hünicke, B., Zorita, E., Soomere, T., Madsen, K. S., Johansson, M., and Suursaar, Ü.: Recent Change–Sea Level and Wind Waves, in: Second Assessment of Climate Change for the Baltic Sea Basin. Regional Climate Studies, edited by: The BACC II Author Team, Springer, Cham., 155–185, https://doi.org/10.1007/978-3-319-16006-1_9, 2015.
Hurrell, J. W. and Deser, C.: North Atlantic climate variability: The role of the North Atlantic Oscillation, J. Marine Syst., 79, 231–244, https://doi.org/10.1016/J.JMARSYS.2009.11.002, 2010.
Huthnance, J., Weisse, R., Wahl, T., Thomas, H., Pietrzak, J., Jose Souza, A., van Heteren, S., Schmelzer, N., van Beusekom, J., Colijn, F., Haigh, I., Hjøllo, S., Holfort, J., Kent, E. C., Kühn, W., Loewe, P., Lorkowski, I., Arne Mork, K., Pätsch, J., Quante, M., Salt, L., Siddorn, J., Smyth, T., Sterl, A., Woodworth Huthnance, P. J., Souza Á P Woodworth, Á. A., Souza, A., Woodworth, P., Weisse, R., van Beusekom Á F Colijn Á M Quante, Á. J., van Beusekom, J., Quante, M., Wahl, T., Thomas, H., Pietrzak, J., van Heteren, S., Schmelzer Á Holfort, N. J., Holfort, J., Haigh, I., Hjøllo Á Mork, S. K., Mork, K., Kent, E., Kühn Á Pätsch, W. J., Pätsch, J., Loewe Á Lorkowski, P. I., Lorkowski, I., and Salt, L.: Recent Change–North Sea, in: North Sea Region Climate Change Assessment. Regional Climate Studies, edited by: Quante, M. and Colijn, F., Springer, Cham., 85–136, https://doi.org/10.1007/978-3-319-39745-0_3, 2016.
ICES: Working Group on the Integrated Assessments of the Barents Sea (WGIBAR), edited by: Eriksen, E. and Filin, A., ICES Scientific Reports. Report, 235 pp., https://doi.org/10.17895/ices.pub.20051438, 2022.
Incarbona, A., Martrat, B., Mortyn, P. G., Sprovieri, M., Ziveri, P., Gogou, A., Jordà, G., Xoplaki, E., Luterbacher, J., Langone, L., Marino, G., Rodríguez-Sanz, L., Triantaphyllou, M., Di Stefano, E., Grimalt, J. O., Tranchida, G., Sprovieri, R., and Mazzola, S.: Mediterranean circulation perturbations over the last five centuries: Relevance to past Eastern Mediterranean Transient-type events, Sci. Rep., 6, 1–10, https://doi.org/10.1038/srep29623, 2016.
Ingrosso, G., Bensi, M., Cardin, V., and Giani, M.: Anthropogenic CO2 in a dense water formation area of the Mediterranean Sea, Deep-Sea Res. Pt. I, 123, 118–128, https://doi.org/10.1016/J.DSR.2017.04.004, 2017.
Ionita, M., Lohmann, G., Rimbu, N., Chelcea, S., and Dima, M.: Interannual to decadal summer drought variability over Europe and its relationship to global sea surface temperature, Clim. Dynam., 38, 363–377, https://doi.org/10.1007/S00382-011-1028-Y, 2012.
Ionita, M., Boronean, C., and Chelcea, S.: Seasonal modes of dryness and wetness variability over Europe and their connections with large scale atmospheric circulation and global sea surface temperature, Clim. Dynam., 45, 2803–2829, https://doi.org/10.1007/S00382-015-2508-2, 2015.
IPCC: Climate Change 2021: The Physical Science Basis. Contribution of Working Group I to the Sixth Assessment Report of the Intergovernmental Panel on Climate Change, edited by: Masson-Delmotte, V., Zhai, P., Pirani, A., Connors, S. L., Péan, C., Berger, S., Caud, N., Chen, Y., Goldfarb, L., Gomis, M. I., Huang, M., Leitzell, K., Lonnoy, E., Matthews, J. B. R., Maycock, T. K., Waterfield, T., Yelekçi, O., Yu, R., and Zhou, B., Cambridge University Press, Cambridge, United Kingdom and New York, NY, USA, https://doi.org/10.1017/9781009157896, in press, 2021a.
IPCC: Summary for Policymakers, in: Climate Change 2021: The Physical Science Basis. Contribution of Working Group I to the Sixth Assessment Report of the Intergovernmental Panel on Climate Change, edited by: Masson-Delmotte, V., Zhai, P., Pirani, A., Connors, S. L., Péan, C., Berger, S., Caud, N., Chen, Y., Goldfarb, L., Gomis, M. I., Huang, M., Leitzell, K., Lonnoy, E., Matthews, J. B. R., Maycock, T. K., Waterfield, T., Yelekçi, O., Yu, R., and Zhou, B., Cambridge University Press, Cambridge, United Kingdom and New York, NY, USA, 3–32, https://doi.org/10.1017/9781009157896.001, 2021b.
IPCC: Summary for Policymakers, in: Climate Change 2022: Impacts, Adaptation, and Vulnerability. Contribution of Working Group II to the Sixth Assessment Report of the Intergovernmental Panel on Climate Change, edited by: Pörtner, H.-O., Roberts, D. C., Tignor, M., Poloczanska, E. S., Mintenbeck, K., Alegria, A., Craig, M., Langsdorf, S., Löschke, S., Möller, V., Okem, A., and Rama, B., Cambridge University Press, Cambridge, UK and New York, NY, USA, 3–33, https://doi.org/10.1017/9781009325844.001, 2022.
Islam, M. J., Kunzmann, A., and Slater, M. J.: Responses of aquaculture fish to climate change-induced extreme temperatures: A review, J. World Aquac. Soc., 53, 314–366, https://doi.org/10.1111/JWAS.12853, 2022.
JCOMM Expert Team on Sea Ice: Sea ice information services of the world, Edition 2017, World Meteorological Organization, Geneva, Switzerland, 103 pp., WMO-No.574, https://doi.org/10.25607/OBP-1325, 2017.
Jørgensen, L. L., Pecuchet, L., Ingvaldsen, R. B., and Primicerio, R.: Benthic transition zones in the Atlantic gateway to a changing Arctic ocean, Prog. Oceanogr., 204, 102792, https://doi.org/10.1016/J.POCEAN.2022.102792, 2022.
Juza, M., Fernández-Mora, A., and Tintoré, J.: Sub-Regional Marine Heat Waves in the Mediterranean Sea From Observations: Long-Term Surface Changes, Sub-Surface and Coastal Responses, Front. Mar. Sci., 9, 785771, https://doi.org/10.3389/FMARS.2022.785771, 2022.
Kapsenberg, L., Alliouane, S., Gazeau, F., Mousseau, L., and Gattuso, J.-P.: Coastal ocean acidification and increasing total alkalinity in the northwestern Mediterranean Sea, Ocean Sci., 13, 411–426, https://doi.org/10.5194/os-13-411-2017, 2017.
Karimi, A. A., Ghobadi-Far, K., and Passaro, M.: Barystatic and steric sea level variations in the Baltic Sea and implications of water exchange with the North Sea in the satellite era, Front. Mar. Sci., 9, 963564, https://doi.org/10.3389/FMARS.2022.963564, 2022.
Keeling, R. F., Körtzinger, A., and Gruber, N.: Ocean Deoxygenation in a Warming World, Annu. Rev. Mar. Sci., 2, 199–229, https://doi.org/10.1146/ANNUREV.MARINE.010908.163855, 2009.
Keil, P., Mauritsen, T., Jungclaus, J., Hedemann, C., Olonscheck, D., and Ghosh, R.: Multiple drivers of the North Atlantic warming hole, Nat. Clim. Change, 10, 667–671, https://doi.org/10.1038/s41558-020-0819-8, 2020.
Kessler, A., Goris, N., and Lauvset, S. K.: Observation-based Sea surface temperature trends in Atlantic large marine ecosystems, Prog. Oceanogr., 208, 102902, https://doi.org/10.1016/J.POCEAN.2022.102902, 2022.
Khatiwala, S., Tanhua, T., Mikaloff Fletcher, S., Gerber, M., Doney, S. C., Graven, H. D., Gruber, N., McKinley, G. A., Murata, A., Ríos, A. F., and Sabine, C. L.: Global ocean storage of anthropogenic carbon, Biogeosciences, 10, 2169–2191, https://doi.org/10.5194/bg-10-2169-2013, 2013.
Kideys, A. E.: Ecology: Fall and rise of the Black Sea ecosystem, Science, 297, 1482–1484, https://doi.org/10.1126/SCIENCE.1073002, 2002.
Kniebusch, M., Meier, H. E. M., Neumann, T., and Börgel, F.: Temperature Variability of the Baltic Sea Since 1850 and Attribution to Atmospheric Forcing Variables, J. Geophys. Res.-Oceans, 124, 4168–4187, https://doi.org/10.1029/2018JC013948, 2019.
Lehmann, A., Myrberg, K., Post, P., Chubarenko, I., Dailidiene, I., Hinrichsen, H.-H., Hüssy, K., Liblik, T., Meier, H. E. M., Lips, U., and Bukanova, T.: Salinity dynamics of the Baltic Sea, Earth Syst. Dynam., 13, 373–392, https://doi.org/10.5194/esd-13-373-2022, 2022.
Leppäranta, M.: Land-ice interaction in the Baltic Sea, Est. J. Earth Sci., 62, 2–14, https://doi.org/10.3176/EARTH.2013.01, 2013.
Li, L., Lozier, M. S., and Li, F.: Century-long cooling trend in subpolar North Atlantic forced by atmosphere: an alternative explanation, Clim. Dynam., 58, 2249–2267, https://doi.org/10.1007/S00382-021-06003-4, 2022.
Lien, V. and Raj, R. P.: North Atlantic – Arctic exchanges, in: Copernicus Marine Service Ocean State Report, Issue 2, J. Oper. Oceanogr., 11, s88–s91, https://doi.org/10.1080/1755876X.2018.1489208, 2018.
Lien, V. S., Schlichtholz, P., Skagseth, Ø., and Vikebø, F. B.: Wind-Driven Atlantic Water Flow as a Direct Mode for Reduced Barents Sea Ice Cover, J. Climate, 30, 803–812, https://doi.org/10.1175/JCLI-D-16-0025.1, 2017.
Lima, L., Peneva, E., Ciliberti, S., Masina, S., Lemieux, B., Storto, A., and Chtirkova, B.: Ocean heat content in the Black Sea, in: Copernicus Marine Service Ocean State Report, Issue 4, J. Oper. Oceanogr., 13, s41–s48, https://doi.org/10.1080/1755876X.2020.1785097, 2020.
Lima, L., Ciliberti, S. A., Aydoğdu, A., Masina, S., Escudier, R., Cipollone, A., Azevedo, D., Causio, S., Peneva, E., Lecci, R., Clementi, E., Jansen, E., Ilicak, M., Cretì, S., Stefanizzi, L., Palermo, F., and Coppini, G.: Climate Signals in the Black Sea From a Multidecadal Eddy-Resolving Reanalysis, Frontiers in Marine Science, 8, 710973, https://doi.org/10.3389/FMARS.2021.710973/BIBTEX, 2021.
Luchetta, A., Cantoni, C., and Catalano, G.: New observations of CO2-induced acidification in the northern Adriatic Sea over the last quarter century, Chem. Ecol., 26, 1–17, https://doi.org/10.1080/02757541003627688, 2010.
Ludwigsen, C. A., Khan, S. A., Andersen, O. B., and Marzeion, B.: Vertical Land Motion From Present-Day Deglaciation in the Wider Arctic, Geophys. Res. Lett., 47, e2020GL088144, https://doi.org/10.1029/2020GL088144, 2020.
Lundesgaard, Ø., Sundfjord, A., Lind, S., Nilsen, F., and Renner, A. H. H.: Import of Atlantic Water and sea ice controls the ocean environment in the northern Barents Sea, Ocean Sci., 18, 1389–1418, https://doi.org/10.5194/os-18-1389-2022, 2022.
Lyubartsev, V., Borile, F., Clementi, E., Masina, S., Drudi, M., Coppini, G., Cessi, P., and Pinardi, N.: Interannual variability in the Eastern and Western Mediterranean Overturning Index, in: Copernicus Marine Service Ocean State Report, Issue 4, J. Oper. Oceanogr., 13, s30–s33, 2020.
Ma, X., Liu, W., Allen, R. J., Huang, G., and Li, X.: Dependence of regional ocean heat uptake on anthropogenic warming scenarios, Sci. Adv., 6, 303–309, https://doi.org/10.1126/SCIADV.ABC0303, 2020.
Marcellin Yao, K., Marcou, O., Goyet, C., Guglielmi, V., Touratier, F., and Savy, J. P.: Time variability of the north-western Mediterranean Sea pH over 1995–2011, Mar. Environ. Res., 116, 51–60, https://doi.org/10.1016/J.MARENVRES.2016.02.016, 2016.
Marullo, S., Serva, F., Iacono, R., Napolitano, E., di Sarra, A., Meloni, D., Monteleone, F., Sferlazzo, D., De Silvestri, L., de Toma, V., Pisano, A., Bellacicco, M., Landolfi, A., Organelli, E., Yang, C., and Santoleri, R.: Record-breaking persistence of the 2022/23 marine heatwave in the Mediterranean Sea, Environ. Res. Lett., 18, 114041, https://doi.org/10.1088/1748-9326/AD02AE, 2023.
Masina, S., Pinardi, N., Cipollone, A., Banerjee, D. S., Lyubartsev, V., von Schuckmann, K., Jackson, L., Escudier, R., Clementi, E., Aydogdu, A., and Iovino, D.: The Atlantic Meridional Overturning Circulation forcing the mean sea level in the Mediterranean Sea through the Gibraltar transport, in: Copernicus Ocean State Report, Issue 6, J. Oper. Oceanogr., 15, s36–s43, https://doi.org/10.1080/1755876X.2022.2095169, 2022.
Mauritzen, C., Hansen, E., Andersson, M., Berx, B., Beszczynska-Möller, A., Burud, I., Christensen, K. H., Debernard, J., de Steur, L., Dodd, P., Gerland, S., Godøy, T., Hansen, B., Hudson, S., Høydalsvik, F., Ingvaldsen, R., Isachsen, P. E., Kasajima, Y., Koszalka, I., Kovacs, K. M., Køltzow, M., LaCasce, J., Lee, C. M., Lavergne, T., Lydersen, C., Nicolaus, M., Nilsen, F., Nøst, O. A., Orvik, K. A., Reigstad, M., Schyberg, H., Seuthe, L., Skagseth, T., Skardhamar, J., Skogseth, R., Sperrevik, A., Svensen, C., Søiland, H., Teigen, S. H., Tverberg, V., and Wexels Riser, C.: Closing the loop – Approaches to monitoring the state of the Arctic Mediterranean during the International Polar Year 2007–2008, Prog. Oceanogr., 90, 62–89, https://doi.org/10.1016/J.POCEAN.2011.02.010, 2011.
MedECC: Climate and Environmental Change in the Mediterranean Basin – Current Situation and Risks for the Future. First Mediterranean Assessment Report, edited by: Cramer, W., Guiot, J., and Marini, K., Union for the Mediterranean, Plan Bleu, UNEP/MAP, Marseille, France, 632 pp., Zenodo, https://doi.org/10.5281/zenodo.7224821, 2020a.
MedECC: Climate and Environmental Change in the Mediterranean Basin – Current Situation and Risks for the Future. First Mediterranean Assessment Report, Marseille, France, 632 pp., Zenodo, https://doi.org/10.5281/zenodo.4768833, 2020b.
MedECC: Summary for Policymakers, in: Climate and Environmental Change in the Mediterranean Basin – Current Situation and Risks for the Future. First Mediterranean Assessment Report, edited by: Cramer, W., Guiot, J., and Marini, K., Union for the Mediterranean, Plan Bleu, UNEP/MAP, Marseille, France, 11–40, Zenodo, https://doi.org/10.5281/zenodo.5513887, 2020c.
Mee, L. D., Friedrich, J., and Gomoiu, M. T.: Restoring the Black Sea in times of uncertainty, Oceanography, 18, 100–111, https://doi.org/10.5670/OCEANOG.2005.45, 2005.
Meier, H. E. M., Kniebusch, M., Dieterich, C., Gröger, M., Zorita, E., Elmgren, R., Myrberg, K., Ahola, M. P., Bartosova, A., Bonsdorff, E., Börgel, F., Capell, R., Carlén, I., Carlund, T., Carstensen, J., Christensen, O. B., Dierschke, V., Frauen, C., Frederiksen, M., Gaget, E., Galatius, A., Haapala, J. J., Halkka, A., Hugelius, G., Hünicke, B., Jaagus, J., Jüssi, M., Käyhkö, J., Kirchner, N., Kjellström, E., Kulinski, K., Lehmann, A., Lindström, G., May, W., Miller, P. A., Mohrholz, V., Müller-Karulis, B., Pavón-Jordán, D., Quante, M., Reckermann, M., Rutgersson, A., Savchuk, O. P., Stendel, M., Tuomi, L., Viitasalo, M., Weisse, R., and Zhang, W.: Climate change in the Baltic Sea region: a summary, Earth Syst. Dynam., 13, 457–593, https://doi.org/10.5194/esd-13-457-2022, 2022.
Meli, M., Camargo, C. M. L., Olivieri, M., Slangen, A. B. A., and Romagnoli, C.: Sea-level trend variability in the Mediterranean during the 1993–2019 period, Front. Mar. Sci., 10, 1150488, https://doi.org/10.3389/FMARS.2023.1150488, 2023.
Menary, M. B. and Wood, R. A.: An anatomy of the projected North Atlantic warming hole in CMIP5 models, Clim. Dynam., 50, 3063–3080, https://doi.org/10.1007/S00382-017-3793-8, 2018.
Merlivat, L., Boutin, J., Antoine, D., Beaumont, L., Golbol, M., and Vellucci, V.: Increase of dissolved inorganic carbon and decrease in pH in near-surface waters in the Mediterranean Sea during the past two decades, Biogeosciences, 15, 5653–5662, https://doi.org/10.5194/bg-15-5653-2018, 2018.
Messias, M. J. and Mercier, H.: The redistribution of anthropogenic excess heat is a key driver of warming in the North Atlantic, Communications Earth & Environment, 3, 1–14, https://doi.org/10.1038/s43247-022-00443-4, 2022.
Middelburg, J. J., Soetaert, K., and Hagens, M.: Ocean Alkalinity, Buffering and Biogeochemical Processes, Rev. Geophys., 58, e2019RG000681, https://doi.org/10.1029/2019RG000681, 2020.
Mohrholz, V.: Major Baltic inflow statistics – Revised, Front. Mar. Sci., 5, 385391, https://doi.org/10.3389/FMARS.2018.00384, 2018.
Mork, K. A., Skagseth, Ø., and Søiland, H.: Recent Warming and Freshening of the Norwegian Sea Observed by Argo Data, J. Climate, 32, 3695–3705, https://doi.org/10.1175/JCLI-D-18-0591.1, 2019.
Mourre, B., Reyes, E., Lorente, P., Santana, A., Hernández-Lasheras, J., Hernández-Carrasco, I., García-Jove, M., and Zarokanellos, N. D.: Intense wind-driven coastal upwelling in the Balearic Islands in response to Storm Blas (November 2021), in: 7th edition of the Copernicus Ocean State Report (OSR7), edited by: von Schuckmann, K., Moreira, L., Le Traon, P.-Y., Grégoire, M., Marcos, M., Staneva, J., Brasseur, P., Garric, G., Lionello, P., Karstensen, J., and Neukermans, G., Copernicus Publications, State Planet, 1-osr7, 15, https://doi.org/10.5194/sp-1-osr7-15-2023, 2023.
Müller, J. D., Schneider, B., and Rehder, G.: Long-term alkalinity trends in the Baltic Sea and their implications for CO2-induced acidification, Limnol. Oceanogr., 61, 1984–2002, https://doi.org/10.1002/LNO.10349, 2016.
Murray, C. J., Müller-Karulis, B., Carstensen, J., Conley, D. J., Gustafsson, B. G., and Andersen, J. H.: Past, present and future eutrophication status of the Baltic Sea, Front. Mar. Sci., 6, 428558, https://doi.org/10.3389/FMARS.2019.00002, 2019.
O'Carroll, A. G., Armstrong, E. M., Beggs, H. M., Bouali, M., Casey, K. S., Corlett, G. K., Dash, P., Donlon, C. J., Gentemann, C. L., Høyer, J. L., Ignatov, A., Kabobah, K., Kachi, M., Kurihara, Y., Karagali, I., Maturi, E., Merchant, C. J., Marullo, S., Minnett, P. J., Pennybacker, M., Ramakrishnan, B., Ramsankaran, R., Santoleri, R., Sunder, S., Saux Picart, S., Vázquez-Cuervo, J., and Wimmer, W.: Observational Needs of Sea Surface Temperature, Frontiers in Marine Science, 6, 420, https://doi.org/10.3389/fmars.2019.00420, 2019.
Oliver, E. C. J., Donat, M. G., Burrows, M. T., Moore, P. J., Smale, D. A., Alexander, L. V., Benthuysen, J. A., Feng, M., Sen Gupta, A., Hobday, A. J., Holbrook, N. J., Perkins-Kirkpatrick, S. E., Scannell, H. A., Straub, S. C., and Wernberg, T.: Longer and more frequent marine heatwaves over the past century, Nat. Commun., 9, 1–12, https://doi.org/10.1038/s41467-018-03732-9, 2018.
Oliver, E. C. J., Burrows, M. T., Donat, M. G., Sen Gupta, A., Alexander, L. V., Perkins-Kirkpatrick, S. E., Benthuysen, J. A., Hobday, A. J., Holbrook, N. J., Moore, P. J., Thomsen, M. S., Wernberg, T., and Smale, D. A.: Projected Marine Heatwaves in the 21st Century and the Potential for Ecological Impact, Front. Mar. Sci., 6, 481127, https://doi.org/10.3389/FMARS.2019.00734, 2019.
Onarheim, I. H., Eldevik, T., Årthun, M., Ingvaldsen, R. B., and Smedsrud, L. H.: Skillful prediction of Barents Sea ice cover, Geophys. Res. Lett., 42, 5364–5371, https://doi.org/10.1002/2015GL064359, 2015.
Østerhus, S., Woodgate, R., Valdimarsson, H., Turrell, B., de Steur, L., Quadfasel, D., Olsen, S. M., Moritz, M., Lee, C. M., Larsen, K. M. H., Jónsson, S., Johnson, C., Jochumsen, K., Hansen, B., Curry, B., Cunningham, S., and Berx, B.: Arctic Mediterranean exchanges: a consistent volume budget and trends in transports from two decades of observations, Ocean Sci., 15, 379–399, https://doi.org/10.5194/os-15-379-2019, 2019.
Pärn, O., Friedland, R., Rjazin, J., and Stips, A.: Regime shift in sea-ice characteristics and impact on the spring bloom in the Baltic Sea, Oceanologia, 64, 312–326, https://doi.org/10.1016/J.OCEANO.2021.12.004, 2022.
Passaro, M., Müller, F. L., Oelsmann, J., Rautiainen, L., Dettmering, D., Hart-Davis, M. G., Abulaitijiang, A., Andersen, O. B., Høyer, J. L., Madsen, K. S., Ringgaard, I. M., Särkkä, J., Scarrott, R., Schwatke, C., Seitz, F., Tuomi, L., Restano, M., and Benveniste, J.: Absolute Baltic Sea Level Trends in the Satellite Altimetry Era: A Revisit, Front. Mar. Sci., 8, 647607, https://doi.org/10.3389/FMARS.2021.647607, 2021.
Peal, R., Worsfold, M., and Good, S.: Comparing global trends in marine cold spells and marine heatwaves using reprocessed satellite data, in: 7th edition of the Copernicus Ocean State Report (OSR7), edited by: von Schuckmann, K., Moreira, L., Le Traon, P.-Y., Grégoire, M., Marcos, M., Staneva, J., Brasseur, P., Garric, G., Lionello, P., Karstensen, J., and Neukermans, G., Copernicus Publications, State Planet, 1-osr7, 3, https://doi.org/10.5194/sp-1-osr7-3-2023, 2023.
Pezzulli, S., Stephenson, D. B., and Hannachi, A.: The Variability of Seasonality, J. Climate, 18, 71–88, https://doi.org/10.1175/JCLI-3256.1, 2005.
Pinardi, N., Bonaduce, A., Navarra, A., Dobricic, S., and Oddo, P.: The Mean Sea Level Equation and Its Application to the Mediterranean Sea, J. Climate, 27, 442–447, https://doi.org/10.1175/JCLI-D-13-00139.1, 2014.
Pinardi, N., Zavatarelli, M., Adani, M., Coppini, G., Fratianni, C., Oddo, P., Simoncelli, S., Tonani, M., Lyubartsev, V., Dobricic, S., and Bonaduce, A.: Mediterranean Sea large-scale low-frequency ocean variability and water mass formation rates from 1987 to 2007: A retrospective analysis, Prog. Oceanogr., 132, 318–332, https://doi.org/10.1016/J.POCEAN.2013.11.003, 2015.
Pinardi, N., Cessi, P., Borile, F., and Wolfe, C. L. P.: The Mediterranean Sea Overturning Circulation, J. Phys. Oceanogr., 49, 1699–1721, https://doi.org/10.1175/JPO-D-18-0254.1, 2019.
Pinardi, N., Estournel, C., Cessi, P., Escudier, R., and Lyubartsev, V.: Chapter 7 – dense and deep water formation processes and Mediterranean overturning circulation Oceanography of the Mediterranean Sea, edited by: Schroeder, K. and Chiggiato, J., Elsevier, 209–261, https://doi.org/10.1016/B978-0-12-823692-5.00009-1, 2023.
Pisano, A., Marullo, S., Artale, V., Falcini, F., Yang, C., Leonelli, F. E., Santoleri, R., and Nardelli, B. B.: New Evidence of Mediterranean Climate Change and Variability from Sea Surface Temperature Observations, Remote Sens., 12, 132, https://doi.org/10.3390/RS12010132, 2020.
Polonsky, A.: Had Been Observing the Acidification of the Black Sea Upper Layer in XX Century?, Turk. J. Fish. Aquat. Sci., 12, 391–396, https://doi.org/10.4194/1303-2712-V12_2_27, 2012.
Polonsky, A. B. and Grebneva, E. A.: The Spatiotemporal Variability of pH in Waters of the Black Sea, Dokl. Earth Sci., 486, 669–674, https://doi.org/10.1134/S1028334X19060072, 2019.
Polyakov, I. V., Ingvaldsen, R. B., Pnyushkov, A. V., Bhatt, U. S., Francis, J. A., Janout, M., Kwok, R., and Skagseth, Ø.: Fluctuating Atlantic inflows modulate Arctic atlantification, Science, 381, 972–979, https://doi.org/10.1126/SCIENCE.ADH5158, 2023.
Potiris, M., Mamoutos, I. G., Tragou, E., Zervakis, V., Kassis, D., and Ballas, D.: Dense Water Formation in the North–Central Aegean Sea during Winter 2021–2022, Journal of Marine Science and Engineering, 12, 221, https://doi.org/10.3390/JMSE12020221, 2024.
Qasmi, S.: Past and future response of the North Atlantic warming hole to anthropogenic forcing, Earth Syst. Dynam., 14, 685–695, https://doi.org/10.5194/esd-14-685-2023, 2023.
Rahmstorf, S., Box, J. E., Feulner, G., Mann, M. E., Robinson, A., Rutherford, S., and Schaffernicht, E. J.: Exceptional twentieth-century slowdown in Atlantic Ocean overturning circulation, Nat. Clim. Change, 5, 475–480, https://doi.org/10.1038/nclimate2554, 2015.
Raj, R. P. and Halo, I.: Monitoring the mesoscale eddies of the Lofoten Basin: importance, progress, and challenges, Int. J. Remote Sens., 37, 3712–3728, https://doi.org/10.1080/01431161.2016.1201234, 2016.
Ranasinghe, R., Ruane, A. C., Vautard, R., Arnell, N., Coppola, E., Cruz, F. A., Dessai, S., Islam, A. S., Rahimi, M., Ruiz Carrascal, D., Sillmann, J., Sylla, M. B., Tebaldi, C., Wang, W., and Zaaboul, R.: Climate Change Information for Regional Impact and for Risk Assessment, in: Climate Change 2021: The Physical Science Basis. Contribution of Working Group I to the Sixth Assessment Report of the Intergovernmental Panel on Climate Change, edited by: Masson-Delmotte, V., Zhai, P., Pirani, A., Connors, S. L., Péan, C., Berger, S., Caud, N., Chen, Y., Goldfarb, L., Gomis, M. I., Huang, M., Leitzell, K., Lonnoy, E., Matthews, J. B. R., Maycock, T. K., Waterfield, T., Yelekçi, O., Yu, R., and Zhou, B., Cambridge University Press, Cambridge, United Kingdom and New York, NY, USA, 1767–1926, https://doi.org/10.1017/9781009157896.014, 2021.
Raudsepp, U., Legeais, J.-F., She, J., Maljutenko, I., and Jandt, S.: Baltic inflows, in: Copernicus Marine Service Ocean State Report, Issue 2, J. Oper. Oceanogr., 11, s106–s110, https://doi.org/10.1080/1755876X.2018.1489208, 2018.
Raudsepp, U., Uiboupin, R., Laanemäe, K., and Maljutenko, I.: Geographical and seasonal coverage of sea ice in the Baltic Sea, in: Copernicus Marine Service Ocean State Report, Issue 4, J. Oper. Oceanogr., 13, s115–s121, 2020.
Raudsepp, U., Männik, A., Maljutenko, I., Lagemaa, P., Rikka, S., Alari, V., and Uiboupin, R.: Extreme waves and low sea level during the storm in the Gulf of Bothnia, Baltic Sea, in: Copernicus Marine Service Ocean State Report, Issue 5, J. Oper. Oceanogr., 14, s162–s173, https://doi.org/10.1080/1755876X.2021.1946240, 2021.
Roether, W., Klein, B. and Hainbucher, D.: The Eastern Mediterranean Transient, in: The Mediterranean Sea, edited by: Borzelli, G. L. E., Gačić, M., Lionello, P., and Malanotte-Rizzoli, P., AGU Advancing Earth and Space Sciences, https://doi.org/10.1002/9781118847572.ch6, 2014.
Roman, M. R., Brandt, S. B., Houde, E. D., and Pierson, J. J.: Interactive effects of Hypoxia and temperature on coastal pelagic zooplankton and fish, Front. Mar. Sci., 6, 404311, https://doi.org/10.3389/FMARS.2019.00139, 2019.
Rudels, B.: Arctic Ocean circulation and variability – advection and external forcing encounter constraints and local processes, Ocean Sci., 8, 261–286, https://doi.org/10.5194/os-8-261-2012, 2012.
Sabine, C. L., Feely, R. A., Gruber, N., Key, R. M., Lee, K., Bullister, J. L., Wanninkhof, R., Wong, C. S., Wallace, D. W. R., Tilbrook, B., Millero, F. J., Peng, T. H., Kozyr, A., Ono, T., and Rios, A. F.: The oceanic sink for anthropogenic CO2, Science, 305, 367–371, https://doi.org/10.1126/SCIENCE.1097403, 2004.
Sanders, R. N. C., Jones, D. C., Josey, S. A., Sinha, B., and Forget, G.: Causes of the 2015 North Atlantic cold anomaly in a global state estimate, Ocean Sci., 18, 953–978, https://doi.org/10.5194/os-18-953-2022, 2022.
Schneider, A., Wallace, D. W. R., and Körtzinger, A.: Alkalinity of the Mediterranean Sea, Geophys. Res. Lett., 34, 15608, https://doi.org/10.1029/2006GL028842, 2007.
Schneider, A., Tanhua, T., Körtzinger, A., and Wallace, D. W. R.: High anthropogenic carbon content in the eastern Mediterranean, J. Geophys. Res.-Oceans, 115, 12050, https://doi.org/10.1029/2010JC006171, 2010.
Schroeder, K., García-Lafuente, J., Josey, S. A., Artale, V., Buongiorno Nardelli, B., Carrillo, A., Gacic, M., Gasparini, G. P.,Herrmann, M., Lionello, P., Ludwig, W., Millot, C., Özsoy, E., Pisacane, G., Sánchez-Garrido, J. C., Sannino, G., Santoleri, R.,Somot, S., Struglia, M., Stanev, E., Taupier-Letage, I., Tsimplis,M. N., Vargas-Yáñez, M., Zervakis, V., and Zodiatis, G.: Chapter 3: Circulation of the Mediterranean Sea and its variability, in: The Climate of the Mediterranean Region, from the past to the future, edited by: Lionello, P., Elsevier Insights, Amsterdam, ISBN 9780124160422, 2012.
Segtnan, O. H., Furevik, T., and Jenkins, A. D.: Heat and freshwater budgets of the Nordic seas computed from atmospheric reanalysis and ocean observations, J. Geophys. Res.-Oceans, 116, 11003, https://doi.org/10.1029/2011JC006939, 2011.
Seneviratne, S. I., Zhang, X., Adnan, M., Badi, W., Dereczynski, C., Di Luca, A., Ghosh, S., Iskandar, I., Kossin, J., Lewis, S., Otto, F., Pinto, I., Satoh, M., Vicente-Serrano, S. M., Wehner, M., and Zhou, B.: Weather and Climate Extreme Events in a Changing Climate, in: Climate Change 2021: The Physical Science Basis. Contribution of Working Group I to the Sixth Assessment Report of the Intergovernmental Panel on Climate Change, edited by: Masson-Delmotte, V., Zhai, P., Pirani, A., Connors, S. L., Péan, C., Berger, S., Caud, N., Chen, Y., Goldfarb, L., Gomis, M. I., Huang, M., Leitzell, K., Lonnoy, E., Matthews, J. B. R., Maycock, T. K., Waterfield, T., Yelekçi, O., Yu, R., and Zhou, B., Cambridge University Press, Cambridge, United Kingdom and New York, NY, USA, 1513–1766, https://doi.org/10.1017/9781009157896.013, 2021.
Simoncelli, S., Pinardi, N., Fratianni, C., Dubois, C., and Notarstefano, G.: Water mass formation processes in the Mediterranean Sea over the past 30 years, in: Copernicus Marine Service Ocean State Report, Issue 2, J. Oper. Oceanogr., 11, s96–s101, https://doi.org/10.1080/1755876X.2018.1489208, 2018.
Smedsrud, L. H., Esau, I., Ingvaldsen, R. B., Eldevik, T., Haugan, P. M., Li, C., Lien, V. S., Olsen, A., Omar, A. M., Risebrobakken, B., Sandø, A. B., Semenov, V. A., and Sorokina, S. A.: The Role Of The Barents Sea In The Arctic Climate System, Rev. Geophys., 51, 415–449, https://doi.org/10.1002/ROG.20017, 2013.
Smith, K. E., Burrows, M. T., Hobday, A. J., King, N. G., Moore, P. J., Sen Gupta, A., Thomsen, M. S., Wernberg, T., and Smale, D. A.: Biological Impacts of Marine Heatwaves, Annu. Rev. Mar. Sci., 15, 119–145, https://doi.org/10.1146/annurev-marine-032122-121437, 2023.
Spada, G. and Melini, D.: SELEN4 (SELEN version 4.0): a Fortran program for solving the gravitationally and topographically self-consistent sea-level equation in glacial isostatic adjustment modeling, Geosci. Model Dev., 12, 5055–5075, https://doi.org/10.5194/gmd-12-5055-2019, 2019.
Staneva, J., Behrens, A., and Gayer, G.: Predictability of large wave heights in the western Black Sea during the 2018 winter storms, in: Copernicus Marine Service Ocean State Report, Issue 4, J. Oper. Oceanogr., 13, s144–s149, https://doi.org/10.1080/1755876X.2020.1785097, 2020.
Sundby, S. and Drinkwater, K.: On the mechanisms behind salinity anomaly signals of the northern North Atlantic, Prog. Oceanogr., 73, 190–202, https://doi.org/10.1016/J.POCEAN.2007.02.002, 2007.
Taillandier, V., D'Ortenzio, F., Prieur, L., Conan, P., Coppola, L., Cornec, M., Dumas, F., Durrieu de Madron, X., Fach, B., Fourrier, M., Gentil, M., Hayes, D., Husrevoglu, S., Legoff, H., Le Ster, L., Örek, H., Ozer, T., Poulain, P. M., Pujo-Pay, M., Ribera d'Alcalà, M., Salihoglu, B., Testor, P., Velaoras, D., Wagener, T., and Wimart-Rousseau, C.: Sources of the Levantine Intermediate Water in Winter 2019, J. Geophys. Res.-Oceans, 127, e2021JC017506, https://doi.org/10.1029/2021JC017506, 2022.
The BACC II Author Team: Second Assessment of Climate Change for the Baltic Sea Basin, edited by: The BACC II Author Team, Springer International Publishing, Cham, https://doi.org/10.1007/978-3-319-16006-1, 2015.
The Climate Change Initiative Coastal Sea Level Team: Coastal sea level anomalies and associated trends from Jason satellite altimetry over 2002–2018, Scientific Data, 7, 1–17, https://doi.org/10.1038/s41597-020-00694-w, 2020.
Tsimplis, M. N., Josey, S. A., Rixen, M., and Stanev, E. V.: On the forcing of sea level in the Black Sea, J. Geophys. Res.-Oceans, 109, 8015, https://doi.org/10.1029/2003JC002185, 2004.
Tsimplis, M. N., Zervakis, V., Josey, S. A., Peneva, E. L., Struglia, M. V., Stanev, E. V., Theocharis, A., Lionello, P., Malanotte-Rizzoli, P., Artale, V., Tragou, E., and Oguz, T.: Changes in the Oceanography of the Mediterranean Sea and their Link to Climate Variability, in: Mediterranean Climate Variability, edited by: Lionello, P., Malanotte-Rizzoli, P., and Boscolo, R., Elsevier publishing, 227–282, ISBN 9780124160422, 2006.
Uiboupin, R., Axell, L., Raudsepp, U., and Sipelgas, L.: Comparison of operational ice charts with satellite based ice concentration products in the Baltic Sea, 2008 IEEE/OES US/EU-Baltic International Symposium, 27–29 May 2008, Tallinn, Estonia, https://doi.org/10.1109/BALTIC.2008.4625571, 2008.
UNDRR: Sendai Framework for Disaster Risk Reduction 2015–2030, UNDRR, https://www.undrr.org/publication/sendai-framework-disaster-risk-reduction-2015-2030, last access: 22 March 2024.
Valcheva, N. and Slabakova, V.: Winter and Summer Variability and Trends of Modis Derived Sea Surface Temperatures for the Western Black Sea, in: Proceeding of 1st International Conference on Environmental Protection and Disaster RISKs, 29–30 September 2020, Sofia, Bulgaria, 9–21, ISBN 978-619-7065-39-8, 2020.
Vignudelli, S., Birol, F., Benveniste, J., Fu, L. L., Picot, N., Raynal, M., and Roinard, H.: Satellite Altimetry Measurements of Sea Level in the Coastal Zone, Surv. Geophys., 40, 1319–1349, https://doi.org/10.1007/S10712-019-09569-1, 2019.
Vihma, T. and Haapala, J.: Geophysics of sea ice in the Baltic Sea: A review, Prog. Oceanogr., 80, 129–148, https://doi.org/10.1016/J.POCEAN.2009.02.002, 2009.
Volkov, D. L. and Landerer, F. W.: Internal and external forcing of sea level variability in the Black Sea, Clim. Dynam., 45, 2633–2646, https://doi.org/10.1007/S00382-015-2498-0, 2015.
Volkov, M. D. and Wilson, C.: Atlantic meridional overturning circulation: Observed transport and variability, Front. Mar. Sci., 6, 436930, https://doi.org/10.3389/FMARS.2019.00260, 2019.
Volosciuk, C., Maraun, D., Semenov, V. A., Tilinina, N., Gulev, S. K., and Latif, M.: Rising Mediterranean Sea Surface Temperatures Amplify Extreme Summer Precipitation in Central Europe, Sci. Rep., 6, 1–7, https://doi.org/10.1038/srep32450, 2016.
Von Schuckmann, K., Palmer, M. D., Trenberth, K. E., Cazenave, A., Chambers, D., Champollion, N., Hansen, J., Josey, S. A., Loeb, N., Mathieu, P. P., Meyssignac, B., and Wild, M.: An imperative to monitor Earth's energy imbalance, Nat. Clim. Change, 6, 138–144, https://doi.org/10.1038/nclimate2876, 2016.
von Storch, H., Omstedt, A., Pawlak, J., and Reckermann, M.: Introduction and Summary, in: Second Assessment of Climate Change for the Baltic Sea Basin. Regional Climate Studies, edited by: The BACC II Author Team, Springer, Cham., https://doi.org/10.1007/978-3-319-16006-1_1, 2015.
Vousdoukas, M. I., Mentaschi, L., Voukouvalas, E., Verlaan, M., and Feyen, L.: Extreme sea levels on the rise along Europe's coasts, Earths Future, 5, 304–323, https://doi.org/10.1002/2016EF000505, 2017.
Walczowski, W., Piechura, J., Goszczko, I., and Wieczorek, P.: Changes in Atlantic water properties: an important factor in the European Arctic marine climate, ICES J. Mar. Sci., 69, 864–869, https://doi.org/10.1093/ICESJMS/FSS068, 2012.
Waldman, R., Brüggemann, N., Bosse, A., Spall, M., Somot, S., and Sevault, F.: Overturning the Mediterranean Thermohaline Circulation, Geophys. Res. Lett., 45, 8407–8415, https://doi.org/10.1029/2018GL078502, 2018.
Wakelin, S., Townhill, B., Engelhard, G., Holt, J., and Renshaw, R.: Marine heatwaves and cold-spells, and their impact on fisheries in the North Sea, in: Copernicus Marine Service Ocean State Report, Issue 5, J. Oper. Oceanogr., 14, s91–s96, https://doi.org/10.1080/1755876X.2021.1946240, 2021.
Wimart-Rousseau, C., Wagener, T., Álvarez, M., Moutin, T., Fourrier, M., Coppola, L., Niclas-Chirurgien, L., Raimbault, P., D'Ortenzio, F., Durrieu de Madron, X., Taillandier, V., Dumas, F., Conan, P., Pujo-Pay, M., and Lefèvre, D.: Seasonal and Interannual Variability of the CO2 System in the Eastern Mediterranean Sea: A Case Study in the North Western Levantine Basin, Front. Mar. Sci., 8, 649246, https://doi.org/10.3389/FMARS.2021.649246, 2021.
WMO: Manual on Codes, Volume I.1 – International Codes. Annex II to the WMO Technical Regulations, Part A – Alphanumeric Codes, 2019.
WMO: Provisional State of the Global Climate 2023, WMO https://wmo.int/files/provisional-state-of-global-climate--2023 (last access: 22 February 2024), 2023.
Woollings, T., Barriopedro, D., Methven, J., Son, S. W., Martius, O., Harvey, B., Sillmann, J., Lupo, A. R., and Seneviratne, S.: Blocking and its Response to Climate Change, Current Climate Change Reports, 4, 287–300, https://doi.org/10.1007/S40641-018-0108-Z, 2018.
Yan, X. and Tang, Y.: Multidecadal Variability in Mediterranean Sea Surface Temperature and Its Sources, Geophys. Res. Lett., 48, e2020GL091814, https://doi.org/10.1029/2020GL091814, 2021.
Yao, Y., Wang, C., and Fu, Y.: Global Marine Heatwaves and Cold-Spells in Present Climate to Future Projections, Earths Future, 10, e2022EF002787, https://doi.org/10.1029/2022EF002787, 2022.
Yeager, S.: The abyssal origins of North Atlantic decadal predictability, Clim. Dynam., 55, 2253–2271, https://doi.org/10.1007/S00382-020-05382-4, 2020.
Zecchetto, S. and De Biasio, F.: Sea Surface Winds over the Mediterranean Basin from Satellite Data (2000–04): Meso- and Local-Scale Features on Annual and Seasonal Time Scales, J. Appl. Meteorol. Climatol., 46, 814–827, https://doi.org/10.1175/JAM2498.1, 2007.
Zhang, W., Villarini, G., Scoccimarro, E., and Napolitano, F.: Examining the precipitation associated with medicanes in the high-resolution ERA-5 reanalysis data, Int. J. Climatol., 41, E126–E132, https://doi.org/10.1002/JOC.6669, 2021.