the Creative Commons Attribution 4.0 License.
the Creative Commons Attribution 4.0 License.
Anomalous 2022 deep-water formation and intense phytoplankton bloom in the Cretan area
Ali Aydogdu
Carolina Amadio
Emanuela Clementi
Simone Colella
Valeria Di Biagio
Massimiliano Drudi
Claudia Fanelli
Laura Feudale
Alessandro Grandi
Pietro Miraglio
Andrea Pisano
Jenny Pistoia
Marco Reale
Stefano Salon
Gianluca Volpe
Gianpiero Cossarini
The Mediterranean Sea is a quasi-permanently stratified and oligotrophic basin with intense late-winter and early-spring phytoplankton blooms typically limited to few regions (i.e. northwestern Mediterranean Sea, the southern Adriatic Sea, and the Rhodes Gyre). In these areas, blooms are sustained by nutrient injection to surface layers by winter vertical mixing and convective processes. A markedly intense bloom was predicted in spring 2022 in an unusual area of the southeastern Mediterranean Sea (i.e. southeast of Crete) by the Mediterranean Sea Copernicus Marine Forecasting Centre (MED MFC) system. Combining Copernicus modelling and observation products, the 2022 event and a number of driving and concurrent features have been investigated in a multidisciplinary way. A noticeable cold spell that occurred in Eastern Europe at the beginning of 2022 has been identified as the main driver of an intense deep-water formation event, with associated high nutrient concentrations in the surface layers. Consequently, an extreme phytoplankton bloom that was 50 % more intense than usual occurred in the area southeast of Crete, starting nearly 1 month later than usual and lasting for 3–4 weeks. Impacts on primary production were also relevant in the 2022 event area and were 35 % higher than the climatological annual primary production. Furthermore, the documented link between primary productivity and fishery catches suggests possible consequences along the whole food chain up to the marine ecosystem in the eastern Mediterranean Sea.
- Article
(14914 KB) - Full-text XML
- BibTeX
- EndNote
The Mediterranean, the main regional sea of southern Europe, is a semi-enclosed basin located in a transitional zone between the midlatitude and subtropical climate regimes (Coppini et al., 2023; Cossarini et al., 2019; Lazzari et al., 2012; Siokou-Frangou et al., 2010). The Mediterranean Sea is an almost permanently stratified and oligotrophic basin with a few areas exhibiting recurrent late-winter and early-spring phytoplankton blooms in the northwestern Mediterranean, the southern Adriatic Sea, and the Rhodes Gyre (Siokou-Frangou et al., 2010). In these regions, the blooms are driven by winter deep convective processes, which bring nutrients into the surface layer, and by the subsequent stratification when the phytoplankton is no longer diluted across the water column. At this moment, conditions are suitable for the surface phytoplankton bloom onset since both light and nutrients are available in the surface layer (Habib et al., 2023; Mayot et al., 2017; D'Ortenzio and Ribera d'Alcalà, 2009).
The eastern Mediterranean experiences particularly sharp oligotrophic conditions, and productive areas are limited to the Rhodes Gyre, where deep-water mixing and related bloom events typically occur (Varkitzi et al., 2020), and to the coast of Türkiye (Kubin et al., 2019).
Current evidence suggests that the Mediterranean Sea is facing an increase in marine heat waves and a decrease in cold-spell events (Simon et al., 2022) as a potential consequence of changes in regional climate. However, in March 2022, a strong and unusual atmospheric cold spell affected the eastern Mediterranean region (Demirtaş, 2023), with strong surface air temperature negative anomalies recorded over southeastern Europe (up to −3 °C, according to Copernicus Climate Change Service bulletin; C3S monthly climate bulletin explorer, 2023; Copernicus, 2023).
In the present work, implications for marine physical and biogeochemical dynamics of the unusual 2022 cold event are investigated by exploiting the products of the Copernicus Marine Service (CMEMS, 2023). We use both models and observations to highlight the interplay between biogeochemical and physical processes, considering that intense cold spells usually drive deep-water column mixing and consequent nutrient injections in the surface layer and onset of phytoplankton blooms (Auger et al., 2014). In order to describe the exceptionality of the 2022 event and its possible implications for the Mediterranean ecosystem, its spatial and temporal extent are defined based on the phytoplankton bloom anomaly, and its characteristics in terms of sea surface temperature, mixed-layer depth, surface chlorophyll, nutrient concentrations, and primary production are investigated.
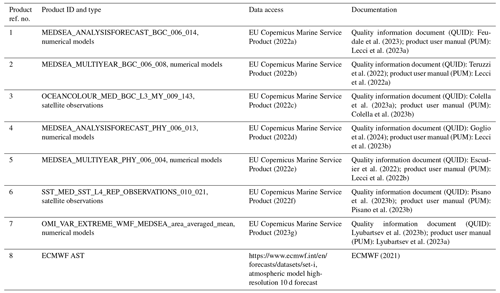
The occurrence and mechanism driving the anomalous deep-convection and phytoplankton bloom episode southeast of Crete (eastern Mediterranean Sea) in spring 2022 was investigated using both model- and satellite-based products. The Mediterranean Sea Copernicus Marine Forecasting Centre (MED MFC) provides 3D ocean biogeochemical and physical variables at ° resolution (product ref. 1, 2, 4, and 5; Table 1). The sea surface temperature (SST) and surface layer chlorophyll concentration are provided by the Copernicus Marine Sea Surface Temperature and Ocean Colour Thematic Assembly Centre (SST TAC and OC TAC, respectively) (product ref. 3 and 6; Table 1). Both near-real time and multi-year products are used to characterise the 2022 event.
A daily climatology based on the 1999–2019 MED MFC biogeochemistry reanalysis (Cossarini et al., 2021; Teruzzi et al., 2022; product ref. 2; Table 1) was calculated, following Hobday et al. (2016), for a subset of variables, namely surface chlorophyll concentration, phosphocline depth, average phosphate concentration above the phosphocline, and primary production integrated in the 0–200 m layer. The nutrient analysis was focused on phosphate since it is known to be the limiting nutrient for the Mediterranean Sea (Siokou-Frangou et al., 2010). For each variable, a set of percentiles is calculated to identify specific thresholds (i.e. 1st, 25th, 50th, 75th, and 99th percentile) using a 10 d window centred on each date of the climatological year. Comparing the 2022 MED MFC analysis and forecast (Salon et al., 2019; Feudale et al., 2023 version 2.1; product ref. 1; Table 1) with the corresponding climatology in the time window of the bloom (20 March–30 April), the chlorophyll concentrations in all the surface grid points of the investigated area (22–32° E, 32–35° N) resulted in values above the 99th percentile for at least 20 % of the time window, indicating that the whole area was affected by intense and anomalous bloom conditions. In order to define the region mostly affected by the anomalous 2022 bloom, following Hobday et al. (2016), the maximum difference with respect to climatology between 20 March and 30 April is calculated (Imax), and the event area is defined as indicated by all the surface grid points with Imax higher than its 90th percentile (0.23 mg chl m−3) (Fig. 1). The characteristics of the anomalous convection and bloom event are investigated by considering marine physical and biogeochemical properties averaged over the event area contoured in Fig. 1. Moreover, a daily sea surface temperature (SST) climatology derived from the Mediterranean SST multi-year satellite product over the period 1982–2021 (Pisano et al., 2023a, b; product ref. 6; Table 1) is used to compare modelled surface temperatures (i.e. first layer of the MED MFC SST; product ref. 4) during the 2022 event time window. To compare the physical and biogeochemical dynamics in the event area and in the Rhodes Gyre area, vertical profiles of temperature, phosphate, and chlorophyll are investigated at two locations (Fig. 1).
Finally, the Copernicus Marine Ocean Monitoring Indicator (Lyubartsev et al., 2023b; product ref. 7; Table 1), computed from the Mediterranean Sea Physics Reanalysis (Escudier et al., 2022; product ref. 6; Table 1), which provides water mass formation rates in the Mediterranean Sea, is considered to analyse the exceptionality of the 2022 event. In particular, the Levantine Deep Water (LDW) formation index is calculated for 2022 and compared with values that occurred in the past (from 1987 onwards).
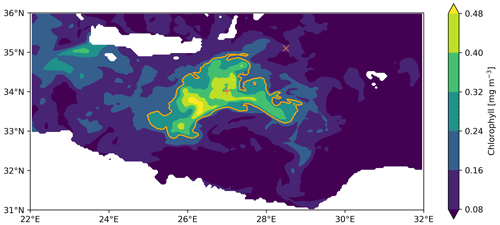
Figure 1Mediterranean Sea analysis and forecast product (product ref. 1; Table 1). Filled contours of the maximum intensity of surface chlorophyll concentration between 20 March and 30 April 2022 and line contour of the 90th percentile of the maximum intensity (0.23 mg chl m−3). The “+” and “×” markers indicate positions inside and outside of the 2022 event.
The signal of the 2022 cold outbreak over Eastern Europe (Demirtaş, 2023) is clearly detectable in the atmospheric surface temperature (AST) extracted from the ECMWF analysis products (ECMWF, 2021; product ref. 8; Table 1). In the second half of January 2022, the AST daily time series reaches a relative minimum (nearly 15 °C), and it is followed by two minima in the March–April time window (Fig. 2a). Accordingly, with a less noticeable variability, sea surface temperature (SST) gradually decreases in the area of interest (Fig. 2a). The satellite SST (Pisano et al., 2023a; product ref. 6; Table 1) shows a constantly negative anomaly of winter 2022 with respect to its climatology (−0.46 °C on average) from the beginning of January to the end of March, indicating that sea surface cooling is the most likely driver of an anomalous deep-convection event. Even lower SST values are provided by the MED MFC analysis and forecast (Goglio et al., 2024 version 2.2; product ref. 4; Table 1), with a minimum in the second half of March, followed by a relatively sharp increase towards the SST satellite climatology. According to the relatively low SST and, similarly, to the typical winter mixing conditions in the Rhodes Gyre area (Kubin et al., 2019), in the 2022 event area (Fig. 1) the mean mixed layer (MLD; calculated as the depth at which the density increases by 0.01 kg m−3 compared to the density at 10 m depth; product ref. 4; Table 1) is deeper than 500 m (Fig. 2b) on several occasions from the end of January to the end of March, which is when the mean MLD gets shallower (up to 50 m). Consistent with the strong March 2022 sea surface cooling, the mean MLD reaches its maximum in March (equal to or deeper than 700 m). The daily maps of AST, SST, SST anomaly, MLD, and heat fluxes during March 2022 provided in Appendix A (Figs. A1–A5) further detail the spatial extent and temporal sequence of the atmospheric and oceanic processes summarised in Fig. 2. Two close and significant drops in AST are, in fact, observed in the area (11–14 March and 19–23 March), according to a cold-air intrusion from the northwest (Fig. A1). Together with the January cold spell (Fig. 2), the March cooling events resulted in significant negative SST anomalies, especially south of Crete, which persisted in the area until the end of March (Fig. A2) with more steady occurrences in the anomalous-event area. Moreover, relatively cold SSTs are also observed by the L3 satellite product (Fig. A3), although only on 7 March and from 14 March onwards (the region is cloudy between 9 and 13 March). Modelling products show that the strong mixing event that started on 9 March and ended on 25 March (Fig. A4) is possibly driven by the cooling and that the area with the highest mixed-layer depths (larger than 1000 m) overlaps well with the April 2022 anomalous bloom. The strong negative heat fluxes into the sea, which occur at the same dates of the cooling events (Fig. A5), further confirm that the driving mechanism of the event is represented by significant heat losses. Considering the Copernicus Marine Ocean Monitoring Indicator (Lyubartsev et al., 2023b; product ref. 7; Table 1), in the Levantine basin, a large dense-water formation rate of approximately 1.3 Sv is documented (not shown1) in the winter of 2022. Confirming the relevant effects of the 2022 cold outbreak on physical marine processes, the same LDW formation index was higher only during the noteworthy eastern Mediterranean transient (EMT; 1992–1993), which is when the formation rate reached up to 1.8 Sv. After that, the LDW formation index showed only two maxima with relatively low values in 2008 and 2012 (0.7 and 1.0 Sv, respectively).
Slightly later, with respect to AST minima and during the strong mixing in March 2022, in the event area southeast of Crete (Fig. 1), the phosphocline depth (PCLD; depth of the maximum phosphate vertical gradient; Salon et al., 2019) is deeper than 400 m, and the PCLD climatology is at the 99th percentile, with two peaks that go down to nearly 600 m (Fig. 2b). The March 2022 anomalous deepening of the phosphocline is preceded in February by a more typical event with the deepening of the phosphocline that stays within its climatology at the 99th percentile and goes down to nearly 400 m. Due to its role as the limiting nutrient in the Mediterranean Sea (Siokou-Frangou et al., 2010), only phosphocline is included in Fig. 3, but we verified that nitrate is very similarly impacted by the 2022 anomalous event processes.
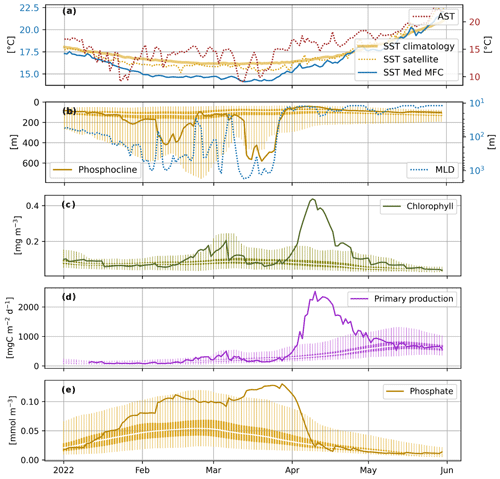
Figure 2Daily time series – spatially averaged over the event area (Fig. 1) – from January to May 2022 for the (a) air surface temperature (AST), sea surface temperature for satellite (SST satellite, product ref. 6; Table 1) and model (SST MED MFC, product ref. 4; Table 1), and SST satellite climatology. (b) Mixed-layer depth (MLD; product ref. 4; Table 1) and phosphocline (product ref. 1; Table 1). (c) Surface chlorophyll concentration. (d) Mean concentration of phosphate above the phosphocline. (e) Primary production integrated in the 0–200 m layer. Climatological percentiles are shown in panels (b), (c), (d), and (e) (thin vertical line: 1st and 99th percentiles; thick vertical line: 25th and 75th percentiles; white marker: median).
At the bloom peak (8 April), the mean surface chlorophyll concentration in the event area (Feudale et al., 2023, version Q4/2022; Fig. 1, product ref. 1; Table 1) is higher than 0.4 mg m−3, i.e. more than twice the climatological 99th percentile (Fig. 2c). Chlorophyll concentrations are higher than the 99th climatological percentile from 2 to 10 April, indicating that the 2022 bloom event is anomalous, both in terms of intensity and timing. In fact, according to the chlorophyll climatology, typical late-winter chlorophyll peaks occur in the first half of March. With the similar timing of the anomalous surface chlorophyll concentration, the primary production integrated over the 0–200 m layer largely exceeds the 99th climatological percentile (Fig. 2d). Related to the strong mixing event that occurred in the late winter of 2022 and to the deepening of the phosphocline (Fig. 2b), the mean phosphate concentration above the phosphocline is higher than the 99th percentile in the month preceding the phytoplankton bloom, with a sharp decrease during the bloom-establishing phase (Fig. 2e). The delay between the large availability of nutrients in the surface layer and the bloom peak is consistent with the Sverdrup theory (Mayot et al., 2017), according to which the surface bloom starts when the MLD becomes shallower than the euphotic layer. Indeed, when the mixing is limited to the surface, phytoplankton is no longer diluted over the water column but remains in the surface layer where both light and nutrients (brought to the surface by the previous deep mixing) are available and favourable to the bloom onset.
The anomalous bloom event is clearly detectable in surface chlorophyll observations (multi-sensor ocean colour product; Colella et al., 2023a; product ref. 3; Table 1) that reach values comparable to those simulated by the analysis and forecast system (Fig. 3). In particular, Fig. 3 shows that high chlorophyll concentrations are observed on 27 and 29 March and on 1 and 6 April, indicating that the event started at around 27 March, maintained high-concentration values on 29 March and 1 and 6 April, and possibly ended between 8 and 9 April. On these dates, the observed chlorophyll concentration is higher than 0.5 mg m−3 (up to 3 mg m−3 on 29 March). Moreover, high chlorophyll concentrations are located in an area that differs (southwestern shifted) from the usual Rhodes Gyre bloom region which, in Fig. 3, is represented by the magenta contour identifying satellite climatology above 0.115 mg m−3 (i.e. half of the threshold used to define the event area; Fig. 1). Furthermore, we observed that the area with climatological concentration above the threshold is largest at the beginning of March (not shown). Model daily maps of model surface chlorophyll concentration provided in the Appendix (Fig. A6) show that in the simulation, the bloom started on 4 April, reached a peak between 8 and 9 April with a concentration larger than 0.5 mg m−3 (i.e. similar values to the ones observed in satellite maps), and gradually extinguished from 11 April onwards. An analysis of the deviation of satellite chlorophyll observations with respect to the 1999–2020 climatology (Fig. A7) demonstrates that on 27 and 29 March and on 1 and 8 April, chlorophyll is at least 3 standard deviations higher than the mean in the event area.
Since the 2022 anomalous surface bloom is the result of a sequence of processes (cold spell, sea surface cooling, vertical mixing, fertilisation, and subsequent stratification), uncertainties in the representation of each of these dynamics by the atmospheric ocean and biogeochemical models may combine and result in inaccuracies in the spatiotemporal representation of the bloom. However, even if the bloom simulation shows a delay of 5–8 d, the use of 3D modelled data allowed us to (i) define the temporal and spatial boundaries of the event and (ii) tackle the sequence of physical and biogeochemical processes that are involved in the bloom dynamics.
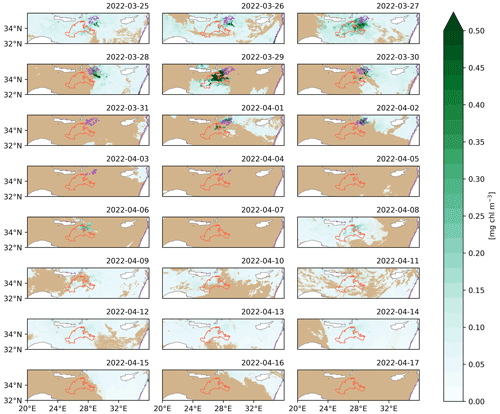
Figure 3Daily maps of satellite surface chlorophyll concentration [mg chl m−3] (product ref. 3; Table 1) from 25 March (upper-left panel) to 17 April 2022 (lower-right panel), with the orange line contour showing the event area (Fig. 1), and the purple line contour identifying satellite climatology above 0.115 mg m−3. Areas without satellite observations are masked in light brown.
The anomalous localisation of the 2022 bloom can be further supported by comparing the vertical processes at two locations (Fig. 4): (i) inside the area of the event and (ii) in the Rhodes Gyre area where the late winter bloom typically occurs (“+” and “×” markers in Fig. 1, respectively). The Hovmöller diagram of temperature inside the event area reveals the gradual outcropping of deep-water masses that reached the surface from 2000 m on 25 March (Fig. 4a). At the same time, the phosphate concentration shows a nearly vertical uniform distribution with persistent high values in the surface layer (>0.15 mmol m−3) until the beginning of the event (4 April), when the nutrient started to be consumed (Fig. 4c). Starting on 4 April, the large chlorophyll concentration in the surface and subsurface layer follows the nutrient injection (Fig. 4e). Finally, a transition to stratified conditions with the formation of a deep-chlorophyll maximum (DCM) occurs from 10 April. The location outside the 2022 event (right column of Fig. 4) shows much less intense and shorter water column mixing with the lower phosphate concentration in surface layers (Fig. 4b and d). In the chlorophyll Hovmöller diagram (Fig. 4f), a transition phase (non-negligible surface concentration with subsurface chlorophyll maximum; Lavigne et al., 2015) toward summer-stratified DCM conditions is already in place at the end of March.
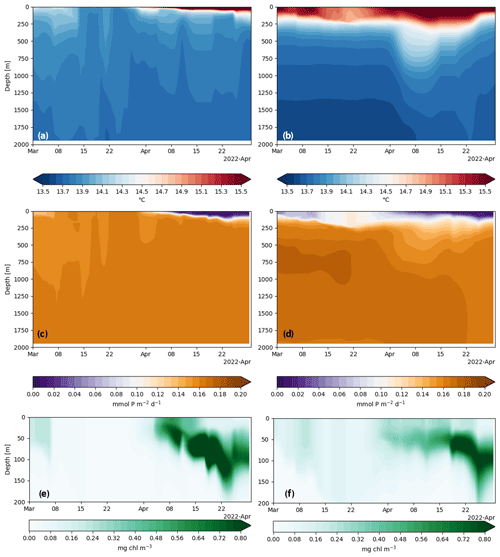
Figure 4Hovmöller diagrams in March and April of temperature (a, b), phosphate and chlorophyll concentrations (c, d and e, f, respectively) inside the event area at 34.02° N–27° E (left panels; white “+” marker in Fig. 1) and outside the event area at 35.1° N–28.5° E (right panels; white “×” marker in Fig. 1).
An anomalous deep-mixing and bloom event in the southeastern Mediterranean in the 2022 early-spring period was detected by means of the Copernicus Marine MED MFC products. In this region, intense phytoplankton blooms related to vertical mixing processes and consequent nutrient supply are usually located in the Rhodes Gyre area and have been previously investigated using in situ and satellite observations and modelling products (e.g. Habib et al., 2023; D'Ortenzio et al., 2021; Varkitzi et al., 2020; Siokou-Frangou et al., 2010), while the 2022 event was located southeast of Crete (Fig. 1). In this work, we analysed and described the 2022 event main features and its drivers.
The deep-convection and the phytoplankton bloom events in the Cretan area are consistent with the anomalous cooling that occurred in southeastern Europe at the beginning of 2022, showing a dynamic similar to the one of the Mediterranean marine cold-spell events described in Simon et al. (2022). For instance, the impact of the 2022 cold spells on the north–central Aegean Sea has been recently demonstrated by Potiris et al. (2024), who show that buoyancy losses during the winter 2021–2022 were comparable to those of 1993–1994, 2002–2003, and 2012, which were all years of dense-water formation (DWF) in the Aegean Sea, as discussed in Sect. 3. The findings of Potiris et al. (2024) further support the fact that the 2022 winter and related marine processes can be considered anomalous for the eastern Mediterranean. Furthermore, the connection between the 2022 atmospheric conditions and sea cooling is corroborated when considering the impacts of atmospheric modes of variability on the Mediterranean Sea surface heat exchange discussed by Josey et al. (2011) and Reale et al. (2020). Indeed, both pattern indexes that are associated with negative heat fluxes in the eastern Mediterranean were relatively high in March 2022 (Index of /cwlinks, 2023).
The frequency and the impacts of marine extreme events in recent years have been investigated in the Mediterranean Sea (Dayan et al., 2023; Martínez et al., 2023; McAdam et al., 2023; Simon et al., 2022; Darmaraki et al., 2019), with the literature also proposing innovative techniques to analyse prolonged episodes in marine ecosystems (Di Biagio et al., 2020). Together with the relatively high number of variables exceeding their 99th percentile during the event (Figs. 2 and 3), the recent decrease in the occurrence of cold-marine extremes in the eastern Mediterranean (Simon et al., 2022) further highlights the exceptionality of the 2022 event.
Our study documents the importance of the value chain composed by atmospheric, ocean, and biogeochemical prediction models in detecting anomalies with respect to the typical state and variability. In particular, the strong anomaly in phytoplankton bloom intensity was revealed to be a suitable descriptor to define the 2022 event localisation, extent, and duration. Moreover, the evaluation of the spatial and temporal mismatch of the simulated event with respect to the Copernicus Marine Ocean Colour product provides an assessment of the capability of the prediction chain to simulate specific events.
Considering that previous anomalous cooling events (1992–1993) were among the drivers of the EMT that impacted the of the whole Mediterranean Sea dynamics (e.g. Pinardi et al., 2019; Roether et al., 2007; Theocharis et al., 2002), with consequences on other marine compartments (e.g. nutrients and productivity, biodiversity, and acidification; Tsiaras et al., 2012; Touratier and Goyet, 2011; Danovaro et al., 2004; Stratford and Haines, 2002; Civitarese and Gacic, 2001), the 2022 event and the related deep-water formation might be worth further investigation.
Our results show that the 2022 anomalous event increased the annual primary production by 35 % in an area of approximately 35 000 km2 (i.e. 11 % and 1.4 % of the Levantine basin and Mediterranean Sea surface, respectively). As a consequence of the increased organic matter synthesis, a non-negligible impact along the whole food chain might have occurred, given the well-proven link between productivity and fish catch sizes (Canu et al., 2022; Colloca et al., 2017; Piroddi et al., 2017; Conti and Scardi, 2010). Due to the relative time proximity of the event and to the non-trivial work needed to collect fish catch data, it was not possible to gather quantitative information on this aspect, although the impact of the 2022 anomaly on the higher trophic level deserves a closer look.
The spatial and temporal extent of the 2022 bloom event and of its drivers can be further investigated using daily maps of a range of marine features in the Cretan area during March 2022. The atmospheric, model sea surface temperature anomaly, and satellite sea surface temperature are shown in Figs. A1–A3, providing evidence of the intense cooling event that occurred in March 2022 and are described in the Sect. 3. Looking at the MLD daily maps (Fig. A4), it is worth noting that on 3 and 4 March the bloom event is already interested by deep mixing (also visible in Fig. 2), possibly related to the relatively low SST values already present at the beginning of March (Fig. A2) and resulting from early-winter cooling events (starting in January 2022, as shown by the AST time series in Fig. 2). Remarkably, the strong MLD deepening in the anomalous event area are followed by positive total heat fluxes in the sea (e.g. 17 March, Fig. A5), due to the deep water reaching the surface layers, together with its temperature being lower than the AST.
Finally, the spatiotemporal evolution of the event as simulated by the Mediterranean Sea Copernicus Marine Forecasting Centre is detailed in the modelled daily maps of surface chlorophyll concentration on the same dates of the satellite observations provided in Fig. 4 (from 25 March to 17 April 2022; Fig. A6).
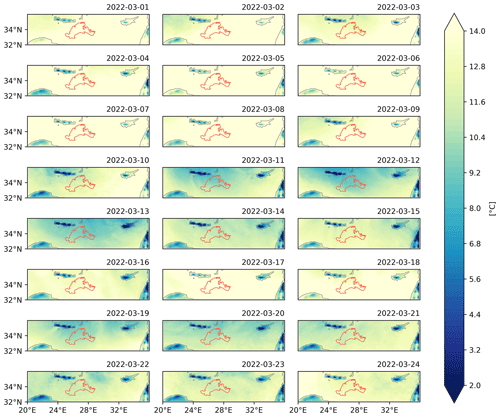
Figure A1Daily maps of ECMWF atmospheric surface temperature [°C] (product ref. 8; Table 1) from 1 March (upper-left panel) to 24 March 2022 (lower-right panel), together with the orange line contour of the event area (Fig. 1).
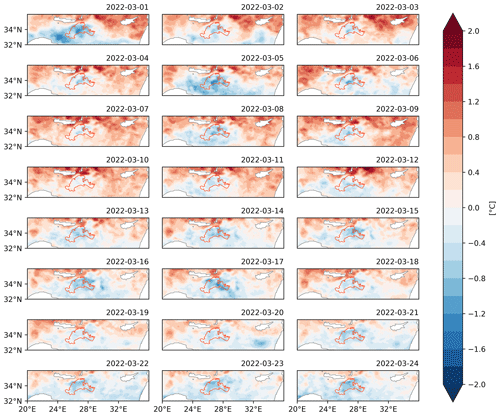
Figure A2Daily maps of the modelled sea surface temperature anomaly [°C] (product ref. 4; Table 1) from 1 March (upper-left panel) to 24 March 2022 (lower-right panel), together with the orange line contour of the event area (Fig. 1).
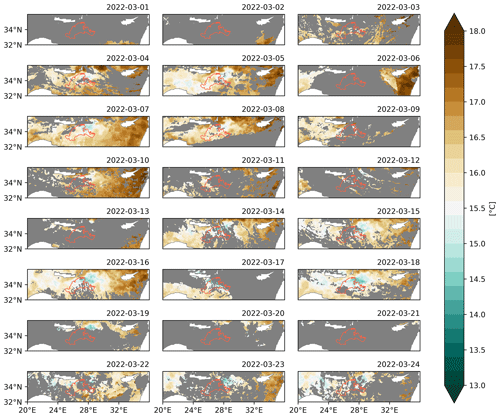
Figure A3Daily maps of satellite sea surface temperature [°C] (product ref. 6; Table 1) from 1 March (upper-left panel) to 24 March 2022 (lower-right panel), together with the orange line contour of the event area (Fig. 1). Areas without satellite observations are masked with grey.
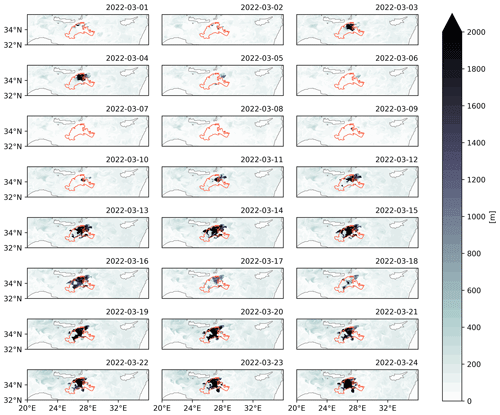
Figure A4Daily maps of mixed-layer depth [m] (product ref. 4; Table 1) from 1 March (upper-left panel) to 24 March 2022 (lower-right panel), together with the orange line contour of the event area (Fig. 1).
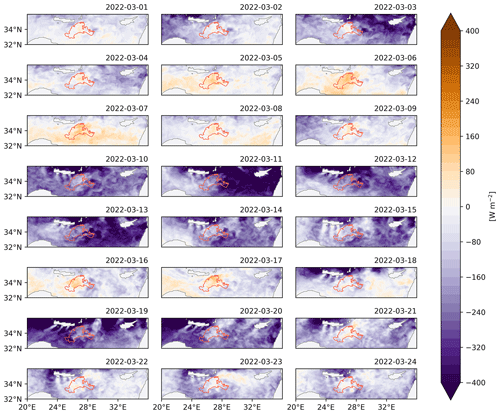
Figure A5Daily maps of total heat fluxes in seawater [W m−2] (product ref. 4; Table 1) from 1 March (upper-left panel) to 24 March 2022 (lower-right panel), together with the orange line contour of the event area (Fig. 1).
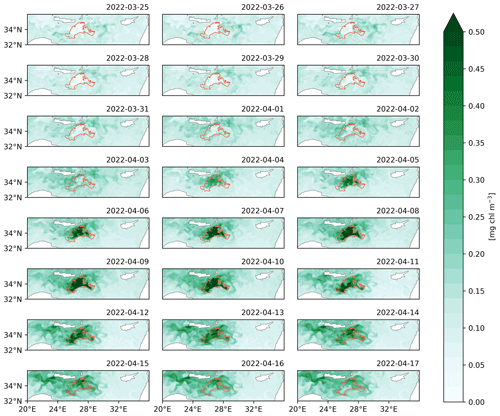
Figure A6Daily maps of modelled surface chlorophyll concentration [mg chl m−3] (product ref. 1; Table 1) from 25 March (upper-left panel) to 17 April 2022 (lower-right panel), together with the orange line contour of the event area (Fig. 1).
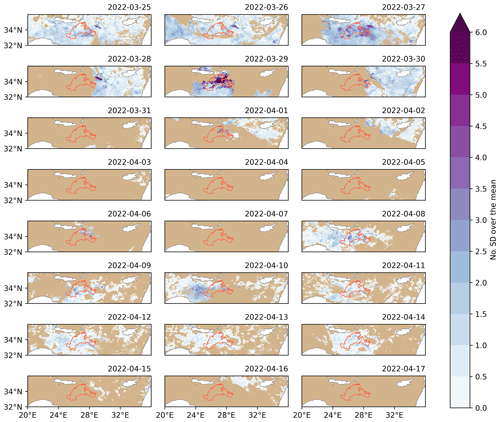
Figure A7Daily maps of the number of standard deviations over the climatological mean (product ref. 3; Table 1) from 25 March (upper-left panel) to 17 April 2022 (lower-right panel), together with the orange line contour of the event area (Fig. 1). Areas without satellite observations are masked with light brown.
Publicly available datasets were analysed in this study. Modelling and in situ data can be found at the Copernicus Marine Service, with references and DOIs indicated in the Table 1 of the paper.
AT, AA, and GC conceived the idea. AT, AA, CF, and SC conducted the analysis. AT, AA, and GC wrote the first draft with contributions from the other co-authors. All the authors discussed and reviewed the submitted article.
The contact author has declared that none of the authors has any competing interests.
Publisher's note: Copernicus Publications remains neutral with regard to jurisdictional claims made in the text, published maps, institutional affiliations, or any other geographical representation in this paper. While Copernicus Publications makes every effort to include appropriate place names, the final responsibility lies with the authors.
This study has been conducted using EU Copernicus Marine Service Information.
This study has been partly funded by the Copernicus Mediterranean – Monitoring Forecasting Centre (contract LOT reference: 21002L5-COP-MFC MED-5500, issued by Mercator Ocean) within the framework of the Marine Copernicus Service.
This paper was edited by Griet Neukermans and reviewed by Maurizio Ribera d'Alcalà and Griet Neukermans.
Auger, P. A., Ulses, C., Estournel, C., Stemmann, L., Somot, S., and Diaz, F.: Interannual control of plankton communities by deep winter mixing and prey/predator interactions in the NW Mediterranean: Results from a 30-year 3D modeling study, Prog. Oceanogr., 124, 12–27, https://doi.org/10.1016/j.pocean.2014.04.004, 2014.
C3S monthly climate bulletin explorer: https://cds.climate.copernicus.eu/cdsapp#!/software/app-c3s-monthly-climate-bulletin-explorer?tab=app, last access: 28 July 2023.
Canu, D., Rosati, G., Cossarini, G., Laurent, C., Bolzon, G., and Solidoro, C.: Winter nutrient content as a basic proxy of ocean fertility, in: Copernicus Ocean State Report, Issue 6, J. Oper. Oceanogr., 15, s133–s138, https://doi.org/10.1080/1755876X.2022.2095169, 2022.
Civitarese, G. and Gacic, M.: Had the Eastern Mediterranean Transient an impact on the new production in the southern Adriatic?, Geophys. Res. Lett., 28, 1627–1630, https://doi.org/10.1029/2000GL012079, 2001.
Colella, S., Brando, V. E., Di Cicco, A., D'Alimonte, D., Forneris, V., and Bracaglia, M.: EU Copernicus Marine Service Quality Information Document for the Mediterranean Sea Ocean Colour Plankton, Reflectance, Transparency and Optics L3 MY daily observations, OCEANCOLOUR_MED_BGC_L3_NRT_009_143, Issue 3.0, Mercator Ocean International, https://catalogue.marine.copernicus.eu/documents/QUID/CMEMS-OC-QUID-009-141to144-151to154.pdf (last access: 17 July 2024), 2023a.
Colella, S., Böhm, E., Cesarini, C., Garnesson, P., Netting, J., and Calton, B.: EU Copernicus Marine Service Product User Manual for the Mediterranean Sea Ocean Colour Plankton, Reflectance, Transparency and Optics L3 MY daily observations, OCEANCOLOUR_MED_BGC_L3_NRT_009_143, Issue 4.0, Mercator Ocean International, https://catalogue.marine.copernicus.eu/documents/PUM/CMEMS-OC-PUM.pdf (last access: 17 July 2024), 2023b.
Colloca, F., Scarcella, G., and Libralato, S.: Recent Trends and Impacts of Fisheries Exploitation on Mediterranean Stocks and Ecosystems, Frontiers in Marine Science, 4, 00244, https://doi.org/10.3389/fmars.2017.00244, 2017.
Conti, L. and Scardi, M.: Fisheries yield and primary productivity in large marine ecosystems, Mar. Ecol. Prog. Ser., 410, 233–244, https://doi.org/10.3354/meps08630, 2010.
Copernicus: Surface air temperature for March 2022, Copernicus, https://climate.copernicus.eu/surface-air-temperature-march-2022, last access: 28 July 2023.
Coppini, G., Clementi, E., Cossarini, G., Salon, S., Korres, G., Ravdas, M., Lecci, R., Pistoia, J., Goglio, A. C., Drudi, M., Grandi, A., Aydogdu, A., Escudier, R., Cipollone, A., Lyubartsev, V., Mariani, A., Cretì, S., Palermo, F., Scuro, M., Masina, S., Pinardi, N., Navarra, A., Delrosso, D., Teruzzi, A., Di Biagio, V., Bolzon, G., Feudale, L., Coidessa, G., Amadio, C., Brosich, A., Miró, A., Alvarez, E., Lazzari, P., Solidoro, C., Oikonomou, C., and Zacharioudaki, A.: The Mediterranean Forecasting System – Part 1: Evolution and performance, Ocean Sci., 19, 1483–1516, https://doi.org/10.5194/os-19-1483-2023, 2023.
Cossarini, G., Mariotti, L., Feudale, L., Mignot, A., Salon, S., Taillandier, V., Teruzzi, A., and D'Ortenzio, F.: Towards operational 3D-Var assimilation of chlorophyll Biogeochemical-Argo float data into a biogeochemical model of the Mediterranean Sea, Ocean Model., 133, 112–128, https://doi.org/10.1016/j.ocemod.2018.11.005, 2019.
Cossarini, G., Feudale, L., Teruzzi, A., Bolzon, G., Coidessa, G., Solidoro, C., Di Biagio, V., Amadio, C., Lazzari, P., Brosich, A., and Salon, S.: High-Resolution Reanalysis of the Mediterranean Sea Biogeochemistry (1999–2019), Frontiers in Marine Science, 8, 741486, https://doi.org/10.3389/fmars.2021.741486, 2021.
Danovaro, R., Dell'Anno, A., and Pusceddu, A.: Biodiversity response to climate change in a warm deep sea, Ecol. Lett., 7, 821–828, https://doi.org/10.1111/j.1461-0248.2004.00634.x, 2004.
Darmaraki, S., Somot, S., Sevault, F., Nabat, P., Cabos Narvaez, W. D., Cavicchia, L., Djurdjevic, V., Li, L., Sannino, G., and Sein, D. V.: Future evolution of Marine Heatwaves in the Mediterranean Sea, Clim. Dynam., 53, 1371–1392, https://doi.org/10.1007/s00382-019-04661-z, 2019.
Dayan, H., McAdam, R., Juza, M., Masina, S., and Speich, S.: Marine heat waves in the Mediterranean Sea: An assessment from the surface to the subsurface to meet national needs, Frontiers in Marine Science, 10, 1045138, https://doi.org/10.3389/fmars.2023.1045138, 2023.
Demirtaş, M.: The Cold Snaps of January 2022 in the Euro-Mediterranean Region in a Warming Climate: In Association with Atmospheric Blocking and the Positive North Atlantic Oscillation, Pure Appl. Geophys., 180, 2889–2900, https://doi.org/10.1007/s00024-023-03297-9, 2023.
Di Biagio, V., Cossarini, G., Salon, S., and Solidoro, C.: Extreme event waves in marine ecosystems: an application to Mediterranean Sea surface chlorophyll, Biogeosciences, 17, 5967–5988, https://doi.org/10.5194/bg-17-5967-2020, 2020.
D'Ortenzio, F. and Ribera d'Alcalà, M.: On the trophic regimes of the Mediterranean Sea: a satellite analysis, Biogeosciences, 6, 139–148, https://doi.org/10.5194/bg-6-139-2009, 2009.
D'Ortenzio, F., Taillandier, V., Claustre, H., Coppola, L., Conan, P., Dumas, F., Durrieu du Madron, X., Fourrier, M., Gogou, A., Karageorgis, A., Lefevre, D., Leymarie, E., Oviedo, A., Pavlidou, A., Poteau, A., Poulain, P. M., Prieur, L., Psarra, S., Puyo-Pay, M., Ribera d'Alcalà, M., Schmechtig, C., Terrats, L., Velaoras, D., Wagener, T., and Wimart-Rousseau, C.: BGC-Argo Floats Observe Nitrate Injection and Spring Phytoplankton Increase in the Surface Layer of Levantine Sea (Eastern Mediterranean), Geophys. Res. Lett., 48, e2020GL091649, https://doi.org/10.1029/2020GL091649, 2021.
ECMWF: IFS Documentation CY47R3, E.: IFS Documentation CY47R3 https://doi.org/10.21957/eyrpir4vj, 2021.
Escudier, R., Clementi, E., Nigam, T., Aydogdu, A., Fini, E., Pistoia, J., Grandi, A., and Miraglio, P.: EU Copernicus Marine Service Quality Information Document for the Mediterranean Sea Physics Reanalysis, MEDSEA_MULTIYEAR_PHY_006_004, Issue 2.3, Issue 2.3, Mercator Ocean International, https://catalogue.marine.copernicus.eu/documents/QUID/CMEMS-MED-QUID-006-004.pdf (last access: 18 July 2024), 2022.
EU Copernicus Marine Service Product: Mediterranean Sea Biogeochemistry Analysis and Forecast, Mercator Ocean international [data set], https://doi.org/10.25423/CMCC/MEDSEA_ANALYSISFORECAST_BGC_006_014_MEDBFM4, 2022a.
EU Copernicus Marine Service Product: Mediterranean Sea Biogeochemistry Reanalysis, Mercator Ocean international [data set], https://doi.org/10.25423/cmcc/medsea_multiyear_bgc_006_008_medbfm3, 2022b.
EU Copernicus Marine Service Product: Mediterranean Sea Ocean Colour Plankton, Reflectance, Transparency and Optics L3 NRT daily observations, Mercator Ocean international [data set], https://doi.org/10.48670/moi-00297, 2022c.
EU Copernicus Marine Service Product: Mediterranean Sea Physics Analysis and Forecast, Mercator Ocean international [data set], https://doi.org/10.25423/CMCC/MEDSEA_ANALYSISFORECAST_PHY_006_013_EAS7, 2022d.
EU Copernicus Marine Service Product: Mediterranean Sea Physics Reanalysis, Mercator Ocean international [data set], https://doi.org/10.25423/CMCC/MEDSEA_MULTIYEAR_PHY_006_004_E3R1, 2022e.
EU Copernicus Marine Service Product: Mediterranean Sea – High Resolution L4 Sea Surface Temperature Reprocessed, Mercator Ocean international [data set], https://doi.org/10.48670/moi-00173, 2022f.
EU Copernicus Marine Service Product: Mediterranean Water Mass Formation Rates from Reanalysis, Mercator Ocean international [data set], https://doi.org/10.48670/mds-00318, 2022g.
Feudale, L., Teruzzi, A., Salon, S., Bolzon, G., Lazzari, P., Coidessa, G., Di Biagio, V., Álvarez, E., Amadio, C., and Cossarini, G.: EU Copernicus Marine Service Quality Information Document for the Mediterranean Sea Biogeochemistry Analysis and Forecast, MEDSEA_ANALYSISFORECAST_BGC_006_014, Issue 3.1, Mercator Ocean International, https://catalogue.marine.copernicus.eu/documents/QUID/CMEMS-MED-QUID-006-014.pdf (last access: 17 July 2024), 2023.
Goglio, A. C., Clementi, E., Grandi, A., Moulin, A., Giurato, M., Aydogdu, A., Pistoia, J., Miraglio, P., Mariani, A., and Drudi, M.: EU Copernicus Marine Service Quality Information Document for the Mediterranean Sea Physics Analysis and Forecast, MEDSEA_ANALYSISFORECAST_PHY_006_013, Issue 2.4, Mercator Ocean International, https://catalogue.marine.copernicus.eu/documents/QUID/CMEMS-MED-QUID-006-013.pdf, last access: 17 July 2024.
Habib, J., Ulses, C., Estournel, C., Fakhri, M., Marsaleix, P., Pujo-Pay, M., Fourrier, M., Coppola, L., Mignot, A., Mortier, L., and Conan, P.: Seasonal and interannual variability of the pelagic ecosystem and of the organic carbon budget in the Rhodes Gyre (eastern Mediterranean): influence of winter mixing, Biogeosciences, 20, 3203–3228, https://doi.org/10.5194/bg-20-3203-2023, 2023.
Hobday, A. J., Alexander, L. V., Perkins, S. E., Smale, D. A., Straub, S. C., Oliver, E. C. J., Benthuysen, J. A., Burrows, M. T., Donat, M. G., Feng, M., Holbrook, N. J., Moore, P. J., Scannell, H. A., Sen Gupta, A., and Wernberg, T.: A hierarchical approach to defining marine heatwaves, Prog. Oceanogr., 141, 227–238, https://doi.org/10.1016/j.pocean.2015.12.014, 2016.
CMEMS: https://marine.copernicus.eu/, last access: 28 July 2023.
Index of /cwlinks: https://ftp.cpc.ncep.noaa.gov/cwlinks/, last access: 31 July 2023.
Josey, S. A., Somot, S., and Tsimplis, M.: Impacts of atmospheric modes of variability on Mediterranean Sea surface heat exchange, J. Geophys. Res.-Oceans, 116, C02032, https://doi.org/10.1029/2010JC006685, 2011.
Kubin, E., Poulain, P.-M., Mauri, E., Menna, M., and Notarstefano, G.: Levantine Intermediate and Levantine Deep Water Formation: An Argo Float Study from 2001 to 2017, Water, 11, 1781, https://doi.org/10.3390/w11091781, 2019.
Lavigne, H., D'Ortenzio, F., Ribera D'Alcalà, M., Claustre, H., Sauzède, R., and Gacic, M.: On the vertical distribution of the chlorophyll a concentration in the Mediterranean Sea: a basin-scale and seasonal approach, Biogeosciences, 12, 5021–5039, https://doi.org/10.5194/bg-12-5021-2015, 2015.
Lazzari, P., Solidoro, C., Ibello, V., Salon, S., Teruzzi, A., Béranger, K., Colella, S., and Crise, A.: Seasonal and inter-annual variability of plankton chlorophyll and primary production in the Mediterranean Sea: a modelling approach, Biogeosciences, 9, 217–233, https://doi.org/10.5194/bg-9-217-2012, 2012.
Lecci, R., Salon S., Bolzon, G., and Cossarini, G.: EU Copernicus Marine Service Product User Manual for the Mediterranean Sea Biogeochemistry Reanalysis, MEDSEA_MULTIYEAR_BGC_006_008, Issue 3.2, Mercator Ocean International, https://catalogue.marine.copernicus.eu/documents/PUM/CMEMS-MED-PUM-006-008.pdf (last access: 17 July 2024), 2022a.
Lecci, R., Drudi, M., Grandi, A., Cretì, S., and Clementi, E.: EU Copernicus Marine Service Product User Manual forMediterranean Sea Physics Reanalysis, MEDSEA_MULTIYEAR_PHY_006_004, Issue 2.3, Mercator Ocean International, https://catalogue.marine.copernicus.eu/documents/PUM/CMEMS-MED-PUM-006-004.pdf (last access: 17 July 2024), 2022b.
Lecci, R., Salon S., Bolzon, G., and Cossarini, G.: EU Copernicus Marine Service Product User Manual for the Mediterranean Sea Biogeochemistry Analysis and Forecast, MEDSEA_ANALYSISFORECAST_BGC_006_014, Issue 2.3, Mercator Ocean International, https://catalogue.marine.copernicus.eu/documents/PUM/CMEMS-MED-PUM-006-014.pdf (last access: 17 July 2024), 2023a.
Lecci, R., Drudi, M., Grandi, A., Cretì, S., and Clementi, E.: EU Copernicus Marine Service Product User Manual for the the Mediterranean Sea Physics Analysis and Forecast, MEDSEA_ANALYSISFORECAST_PHY_006_013, Issue 2.3, Mercator Ocean International, https://catalogue.marine.copernicus.eu/documents/PUM/CMEMS-MED-PUM-006-013.pdf (last access: 17 July 2024), 2023b.
Lyubartsev, V., Miraglio, P., and Clementi, E.: EU Copernicus Marine Service Product User Manual for the Mediterranean Water Mass Formation Rates from Reanalysis, OMI_VAR_EXTREME_WMF_MEDSEA_area_averaged_mean, Issue 1.1, Mercator Ocean International, https://catalogue.marine.copernicus.eu/documents/PUM/CMEMS-OMI-PUM-VAR-EXTREME-WMF-MEDSEA.pdf (last access: 17 July 2024), 2023a.
Lyubartsev, V., Clementi, E., Aydogdu, A., Miraglio, P., Masina, S., and Pinardi, N.: EU Copernicus Marine Service Quality Information Document for the Mediterranean Water Mass Formation Rates from Reanalysis, OMI_VAR_EXTREME_WMF_MEDSEA_area_averaged_mean, Issue 1.1, Mercator Ocean International, https://catalogue.marine.copernicus.eu/documents/QUID/CMEMS-OMI-QUID-VAR-EXTREME-WMF-MEDSEA.pdf (last access: 17 July 2024), 2023b.
Martínez, J., Leonelli, F. E., García-Ladona, E., Garrabou, J., Kersting, D. K., Bensoussan, N., and Pisano, A.: Evolution of marine heatwaves in warming seas: the Mediterranean Sea case study, Frontiers in Marine Science, 10, 1193164, https://doi.org/10.3389/fmars.2023.1193164, 2023.
Mayot, N., D'Ortenzio, F., Taillandier, V., Prieur, L., Fommervault, O. P. de, Claustre, H., Bosse, A., Testor, P., and Conan, P.: Physical and Biogeochemical Controls of the Phytoplankton Blooms in North Western Mediterranean Sea: A Multiplatform Approach Over a Complete Annual Cycle (2012–2013 DEWEX Experiment), J. Geophys. Res.-Oceans, 122, 9999–10019, https://doi.org/10.1002/2016JC012052, 2017.
McAdam, R., Masina, S., and Gualdi, S.: Seasonal forecasting of subsurface marine heatwaves, Commun. Earth Environ., 4, 225, https://doi.org/10.1038/s43247-023-00892-5, 2023.
Pinardi, N., Cessi, P., Borile, F., and Wolfe, C. L. P.: The Mediterranean Sea Overturning Circulation, J. Phys. Oceanogr., 49, 1699–1721, https://doi.org/10.1175/JPO-D-18-0254.1, 2019.
Piroddi, C., Coll, M., Liquete, C., Macias, D., Greer, K., Buszowski, J., Steenbeek, J., Danovaro, R., and Christensen, V.: Historical changes of the Mediterranean Sea ecosystem: modelling the role and impact of primary productivity and fisheries changes over time, Sci. Rep., 7, 44491, https://doi.org/10.1038/srep44491, 2017.
Pisano, A., Fanelli, C., Tronconi, C., Cesarini, C., La Padula, F., and Buongiorno Nardelli, B.: EU Copernicus Marine Service Quality Information Document for the Mediterranean Sea High Resolution L4 Sea Surface Temperature Reprocessed, SST_MED_SST_L4_REP_OBSERVATIONS_010_021, Issue 3.0, Mercator Ocean International, https://catalogue.marine.copernicus.eu/documents/QUID/CMEMS-SST-QUID-010-021-022-041-042.pdf (last access: 17 July 2024), 2023a.
Pisano, A., Fanelli, C., Tronconi, C., Cesarini, C., La Padula, F., and Buongiorno Nardelli, B.: EU Copernicus Marine Service Product User Manual for the Mediterranean Sea High Resolution L4 Sea Surface Temperature Reprocessed, SST_MED_SST_L4_REP_OBSERVATIONS_010_021, Issue 3.0, Mercator Ocean International, https://catalogue.marine.copernicus.eu/documents/PUM/CMEMS-SST-PUM-010-021-022-041-042.pdf (last access: 20 June 2023), 2023b.
Potiris, M., Mamoutos, I. G., Tragou, E., Zervakis, V., Kassis, D., and Ballas, D.: Dense Water Formation in the North–Central Aegean Sea during Winter 2021–2022, Journal of Marine Science and Engineering, 12, 221, https://doi.org/10.3390/jmse12020221, 2024.
Reale, M., Salon, S., Somot, S., Solidoro, C., Giorgi, F., Crise, A., Cossarini, G., Lazzari, P., and Sevault, F.: Influence of large-scale atmospheric circulation patterns on nutrient dynamics in the Mediterranean Sea in the extended winter season (October–March) 1961–1999, Clim. Res., 82, 117–136, https://doi.org/10.3354/cr01620, 2020.
Roether, W., Klein, B., Manca, B. B., Theocharis, A., and Kioroglou, S.: Transient Eastern Mediterranean deep waters in response to the massive dense-water output of the Aegean Sea in the 1990s, Prog. Oceanogr., 74, 540–571, https://doi.org/10.1016/j.pocean.2007.03.001, 2007.
Salon, S., Cossarini, G., Bolzon, G., Feudale, L., Lazzari, P., Teruzzi, A., Solidoro, C., and Crise, A.: Novel metrics based on Biogeochemical Argo data to improve the model uncertainty evaluation of the CMEMS Mediterranean marine ecosystem forecasts, Ocean Sci., 15, 997–1022, https://doi.org/10.5194/os-15-997-2019, 2019.
Simon, A., Plecha, S. M., Russo, A., Teles-Machado, A., Donat, M. G., Auger, P.-A., and Trigo, R. M.: Hot and cold marine extreme events in the Mediterranean over the period 1982–2021, Frontiers in Marine Science, 9, 892201, https://doi.org/10.3389/fmars.2022.892201, 2022.
Siokou-Frangou, I., Christaki, U., Mazzocchi, M. G., Montresor, M., Ribera d'Alcalá, M., Vaqué, D., and Zingone, A.: Plankton in the open Mediterranean Sea: a review, Biogeosciences, 7, 1543–1586, https://doi.org/10.5194/bg-7-1543-2010, 2010.
Stratford, K. and Haines, K.: Modelling nutrient cycling during the eastern Mediterranean transient event 1987–1995 and beyond, Geophys. Res. Lett., 29, 5-1–5-4, https://doi.org/10.1029/2001GL013559, 2002.
Teruzzi, A., Di Biagio, V., Feudale, L., Bolzon, G., Lazzari, P., Salon, S., Coidessa, G., and Cossarini, G.: EU Copernicus Marine Service Quality Information Document for the Mediterranean Sea Biogeochemistry Reanalysis, MEDSEA_MULTIYEAR_BGC_006_008, Issue 3.2, Mercator Ocean International, https://catalogue.marine.copernicus.eu/documents/QUID/CMEMS-MED-QUID-006-008.pdf (last access: 17 July 2024), 2022.
Theocharis, A., Klein, B., Nittis, K., and Roether, W.: Evolution and status of the Eastern Mediterranean Transient (1997–1999), J. Marine Syst., 33–34, 91–116, https://doi.org/10.1016/S0924-7963(02)00054-4, 2002.
Touratier, F. and Goyet, C.: Impact of the Eastern Mediterranean Transient on the distribution of anthropogenic CO2 and first estimate of acidification for the Mediterranean Sea, Deep-Sea Res. Pt. I, 58, 1–15, https://doi.org/10.1016/j.dsr.2010.10.002, 2011.
Tsiaras, K. P., Kourafalou, V. H., Raitsos, D. E., Triantafyllou, G., Petihakis, G., and Korres, G.: Inter-annual productivity variability in the North Aegean Sea: Influence of thermohaline circulation during the Eastern Mediterranean Transient, J. Marine Syst., 96–97, 72–81, https://doi.org/10.1016/j.jmarsys.2012.02.003, 2012.
Varkitzi, I., Psarra, S., Assimakopoulou, G., Pavlidou, A., Krasakopoulou, E., Velaoras, D., Papathanassiou, E., and Pagou, K.: Phytoplankton dynamics and bloom formation in the oligotrophic Eastern Mediterranean: Field studies in the Aegean, Levantine and Ionian seas, Deep-Sea Res. Pt. II, 171, 104662, https://doi.org/10.1016/j.dsr2.2019.104662, 2020.
The Ocean Monitoring Indicator of the water mass formation will be extended to 2022 and published in the Copernicus Marine catalogue by 2024.


