the Creative Commons Attribution 4.0 License.
the Creative Commons Attribution 4.0 License.
 | 30 Sep 2024 | OSR8 | Chapter 1.1
The state of the global ocean
Karina von Schuckmann
Lorena Moreira
Mathilde Cancet
Flora Gues
Emmanuelle Autret
Jonathan Baker
Clément Bricaud
Romain Bourdalle-Badie
Lluis Castrillo
Lijing Cheng
Frederic Chevallier
Daniele Ciani
Alvaro de Pascual-Collar
Vincenzo De Toma
Marie Drevillon
Claudia Fanelli
Gilles Garric
Marion Gehlen
Rianne Giesen
Kevin Hodges
Doroteaciro Iovino
Simon Jandt-Scheelke
Eric Jansen
Melanie Juza
Ioanna Karagali
Thomas Lavergne
Simona Masina
Ronan McAdam
Audrey Minière
Helen Morrison
Tabea Rebekka Panteleit
Andrea Pisano
Marie-Isabelle Pujol
Ad Stoffelen
Sulian Thual
Simon Van Gennip
Pierre Veillard
Chunxue Yang
Here, the Copernicus Ocean State Report offers detailed scientific analysis of the ocean under climate change, ocean variability, and ocean extremes. This evidence-based reporting is based on a set of key ocean indicators such as sea surface temperature, sea level rise, ocean heat content, ocean acidification, and sea ice extent. Moreover, key indicators for ocean variability such as the El Niño–Southern Oscillation and major ocean current systems such as the Atlantic Meridional Overturning Circulation are tackled. Major results show that the global ocean's sea surface temperature continues to steadily increase, particularly in the Northern Hemisphere, with a global warming rate of 0.13 ± 0.01 °C per decade from 1982 to 2023. Since around the 1970s, the ocean warming trend has intensified, doubling its rate over the past 2 decades. Concurrently, global mean sea level has risen significantly at intensifying rates from 2.1 mm yr−1 in the 1990s to 4.3 mm yr−1 in recent years, with regional disparities. The Arctic Ocean has faced unprecedented sea ice loss and warming, while Antarctic sea ice has reached record lows. Ocean acidification has progressed, decreasing pH at a rate of −0.017 per decade. Marine heatwaves have become more frequent, intense, and extensive, affecting up to 80 % of the global ocean surface annually. Despite significant variability, extreme ocean surface wind speeds have been prevalent, particularly in the North Atlantic, North Pacific, and Southern Ocean. The Atlantic Meridional Overturning Circulation shows no significant decline but varies substantially. In 2023, La Niña conditions have transitioned to El Niño conditions in the Pacific Ocean.
- Article
(15473 KB) - Full-text XML
-
Supplement
(686 KB) - BibTeX
- EndNote


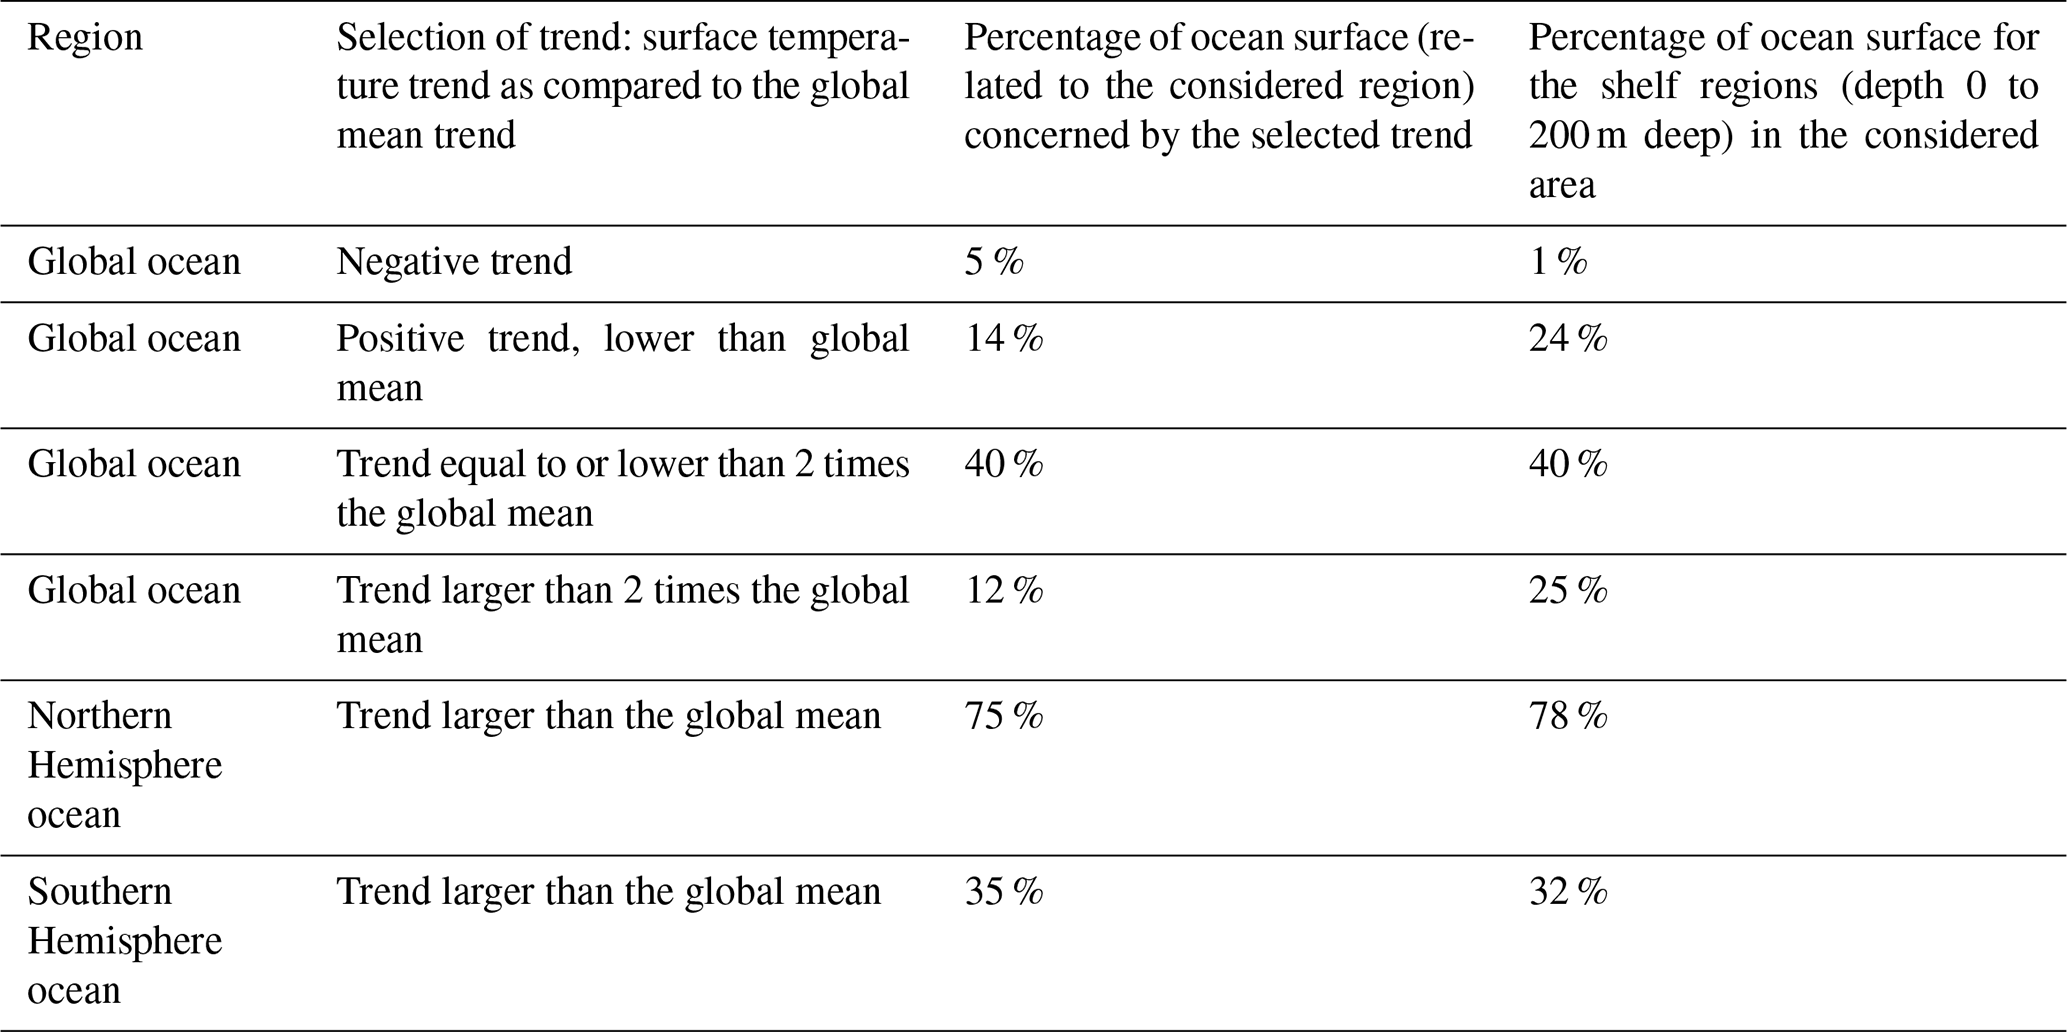
The sea surface temperature (SST) of the global ocean continues to warm, and this warming is not uniform across ocean basins and particularly pronounced in the Northern Hemisphere. Global mean sea surface temperature is warming at a rate of 0.13 ± 0.01 °C per decade over the period 1982–2023. Apart from areas of major ocean current systems in the Pacific, Atlantic, and Southern Ocean, the ocean surface is warming. In particular, 75 % of the Northern Hemisphere ocean surface is warming faster than the global average, compared to 35 % of the Southern Hemisphere ocean.
Ocean warming continues to increase globally, and since the 1960s, rates of change have doubled in the past 2 decades. Over the period 1960–2023, the global ocean heat content increased at a rate of 0.58 ± 0.1 W m−2. Since 2005, this global rate has increased to 1.05 ± 0.2 W m−2. Regionally, ocean warming is evolving differently in various areas of the global ocean, while since 1960, the strongest upper 2000 m ocean warming has occurred in the Southern Ocean (60–35° S), the North Atlantic (20–50° N), and the South Atlantic (60° S–0°).
Global mean sea level observed by satellite altimetry has risen more than 10 cm, at a rate of 3.4 ± 0.3 mm yr−1, and accelerated by 0.11 ± 0.05 mm yr−2 over the past 30 years. Global mean sea level rose from 2.1 ± 0.3 mm yr−1 over the period 1993–2002 to 4.3 ± 0.3 mm yr−1 over 2013–2023. Regional sea level rise is not uniform, and almost 50 % of the ocean is rising faster than the global average. The regions with faster rates are the major western boundary currents (in the Kuroshio current in the western North Pacific and in the Gulf Stream and the Brazil and Malvinas currents in the Atlantic Ocean), large parts of the western Pacific Ocean and Indian Ocean, and some areas in the Atlantic Ocean.
The Arctic Ocean has been exposed to unprecedented sea ice loss and surface ocean warming of 4.37 °C since the 1980s, and in 2016, Antarctic sea ice entered a new state of low sea ice, reaching the lowest levels on record in 2023. Over the period 1979–2023, the Northern Hemisphere sea ice extent decreased by −4.33 % per decade on annual average, by −12.64 % per decade in September (Summer), and by −2.55 % per decade in March (Winter). Record summer sea ice loss is reported during the years 2012 and 2020. The trend in surface temperature in the Arctic Ocean amounts to 0.104 ± 0.005 °C yr−1 between 1982 and 2023. Most of the Arctic Ocean basin is experiencing surface warming, particularly in the northern Barents Sea, the Kara Sea, the Beaufort Sea, and the Eurasian part of the Arctic Ocean. Antarctic sea ice extent does not show a long-term trend on average due to high variability and contrasting regional trends over the period 1982–2023. In 2016, Antarctic sea ice showed a rapid decrease, entering a new low state of sea ice, and 2023 became by far the lowest year on record. Global mean sea ice extent in the polar regions was at its lowest point in 2023 as compared to the 1993–2010 reference period.
Global ocean acidification has continuously increased over the past 37 years (1985–2022), with an observed rate of decrease in ocean pH of −0.017 pH unit per decade. Regionally, ocean acidification is not increasing uniformly. About 47 % of the sampled ocean is getting more acidic at a faster rate than the global average, particularly in the Indian Ocean, the Southern Ocean, the eastern equatorial Pacific Ocean, the northern tropical Pacific, and some regions in the Atlantic Ocean.
The year 2022 was the third consecutive year of El Niño–Southern Oscillation (ENSO) La Niña conditions, and the year 2023 was marked by developing El Niño conditions. The tropical Pacific Ocean experienced multi-year La Niña conditions persisting during 2020, 2021, and 2022. This phase of ENSO reverted afterwards, transitioning to neutral conditions in boreal spring 2023 and then to a warm El Niño phase in the second half of 2023.
The Atlantic Meridional Overturning Circulation (AMOC) strength does not show a statistically significant decline over the period 1993–2023. Since 1993, the strength of AMOC has undergone stark variations in both the reanalyses and observations, superposing any long-term change. Scientific controversy prevails in the published literature, and several studies estimate low AMOC strength or even predict a near-term collapse, while other studies elevate fluctuations of AMOC.
Since 1982, the frequency, duration, intensity, and regional extension of marine heatwaves of strong and extreme categories have increased, and during the years 2022 and 2023, large areas of the surface ocean were affected. Over the period 1982–2023, the fraction of the global ocean surface that experienced a marine heatwave (MHW) event over 1 year increased from 50 % to 80 %. The spatial extension of strong MHW events and the yearly averaged maximum duration of MHW events in recent years have doubled since 2008 from about 20 % to 40 % and from 20 to 40 d, respectively, while they were relatively stable before the mid-2000s. In 2022, 12 % of the global ocean surface experienced at least one marine heatwave event of severe to extreme category, with most persistent events lasting 6 months or longer occurring in the Coral Sea, affecting waters off northeast Australia and the Melanesian Pacific Island states. In 2023, 22 % of the global ocean surface experienced at least one severe to extreme marine heatwave event. The most prominent events, lasting 6 months or longer, occurred in the tropical central and eastern Pacific, associated with the emerging 2023–2024 El Niño and the coastal Niño off the coast of Peru, and in the northern tropical Atlantic and the Southern Ocean south of 40° S.
Globally, most extreme ocean surface wind speeds exceeding 20 m s−1 over the past 16 years prevail in the central and subpolar North Atlantic, the North Pacific, and the Southern Ocean. The detection of long-term trends in extreme wind speeds is hampered by their large variability in space and time, such as being triggered by the El Niño–Southern Oscillation. Over the period 2007–2023, ocean surface extreme wind speeds in the North Atlantic exceeding more than 22 m s−1 were particularly pronounced along the southern coast of Greenland. Extreme winds also reach more than 20 m s−1 in the North Pacific and Southern Ocean. Extreme wind speeds in the tropical bands (10–30° of latitude) amount typically to about 13 m s−1 and around or below 10 m s−1 in the equatorial band (0–10° of latitude). Wind speed extremes in the western tropical Pacific are closely correlated with the El Niño–Southern Oscillation index, with more extreme wind speeds and longer-lived tropical cyclones during El Niño years.
1.1 Sea surface temperature
The surface of the ocean is in permanent dialogue with the overlying atmosphere, and every change in this complex interaction governed by air–sea processes transferring energy, momentum, and gases between them is reflected in changes of sea surface temperature. Hence, regular monitoring of sea surface temperature is a fundamental component of climate variability assessment. Also, sea surface temperature is identified as an essential ocean variable in weather prediction and atmospheric model simulation, and it has a profound role in the study of marine ecosystems, ocean dynamics, and ocean health (Centurioni et al., 2019). Global targets of political ambitions are aligned along the global climate indicator of Earth surface temperature (UN, 2015) from which the ocean surface constitutes the major fraction covering nearly 70 % of the Earth's surface. The most recent assessment of available scientific knowledge under the sixth assessment cycle of the IPCC has reported that each of the last 4 decades has been successively warmer than any decade that preceded it since 1850. Global surface temperature was 1.09 [0.95 to 1.20] °C higher in 2011–2020 than 1850–1900, with larger increases over land (1.59 [1.34 to 1.83] °C) than over the ocean (0.88 [0.68 to 1.01] °C), IPCC, 2021). While the global mean sea surface temperature is increasing, there is variability around this average, with different regions and locations experiencing different responses, both in terms of trend and variance on different timescales and which are linked to climate modes (such as the El Niño–Southern Oscillation) and/or ocean dynamics.
In 2023, the global mean temperature was the highest on record (Fig. 1). Since 1982, global mean surface temperature has risen at a rate of 0.13 ± 0.01 °C. Superposed on the long-term trend, the global mean sea surface temperature also shows large variations around the average, which is known to be dominated by internal variations from the El Niño–Southern Oscillation (ENSO; Fig. 1, red and blue shading). Except for the area poleward of about 50° S, the eastern tropical Pacific where upwelling takes place, the central subtropical South Atlantic, and the area of the so-called “cold blob” in the subtropical North Atlantic (Fan et al., 2023; Sanders et al., 2022), which show no statistically significant trend, the rest of the ocean surface is warming. The spatial pattern of the global SST trend also evidences that nearly 14 % of the ocean surface is warming more slowly compared to the global mean surface warming rate (Fig. 2b, Table 1), and 40 % of the ocean surface is even observed to warm at a rate equal to or exceeding 2 times or more (12 %) the global mean surface warming (Fig. 2b, Table 1). Higher warming rates characterize the Northern Hemisphere in all ocean basins, particularly north of 30° N.
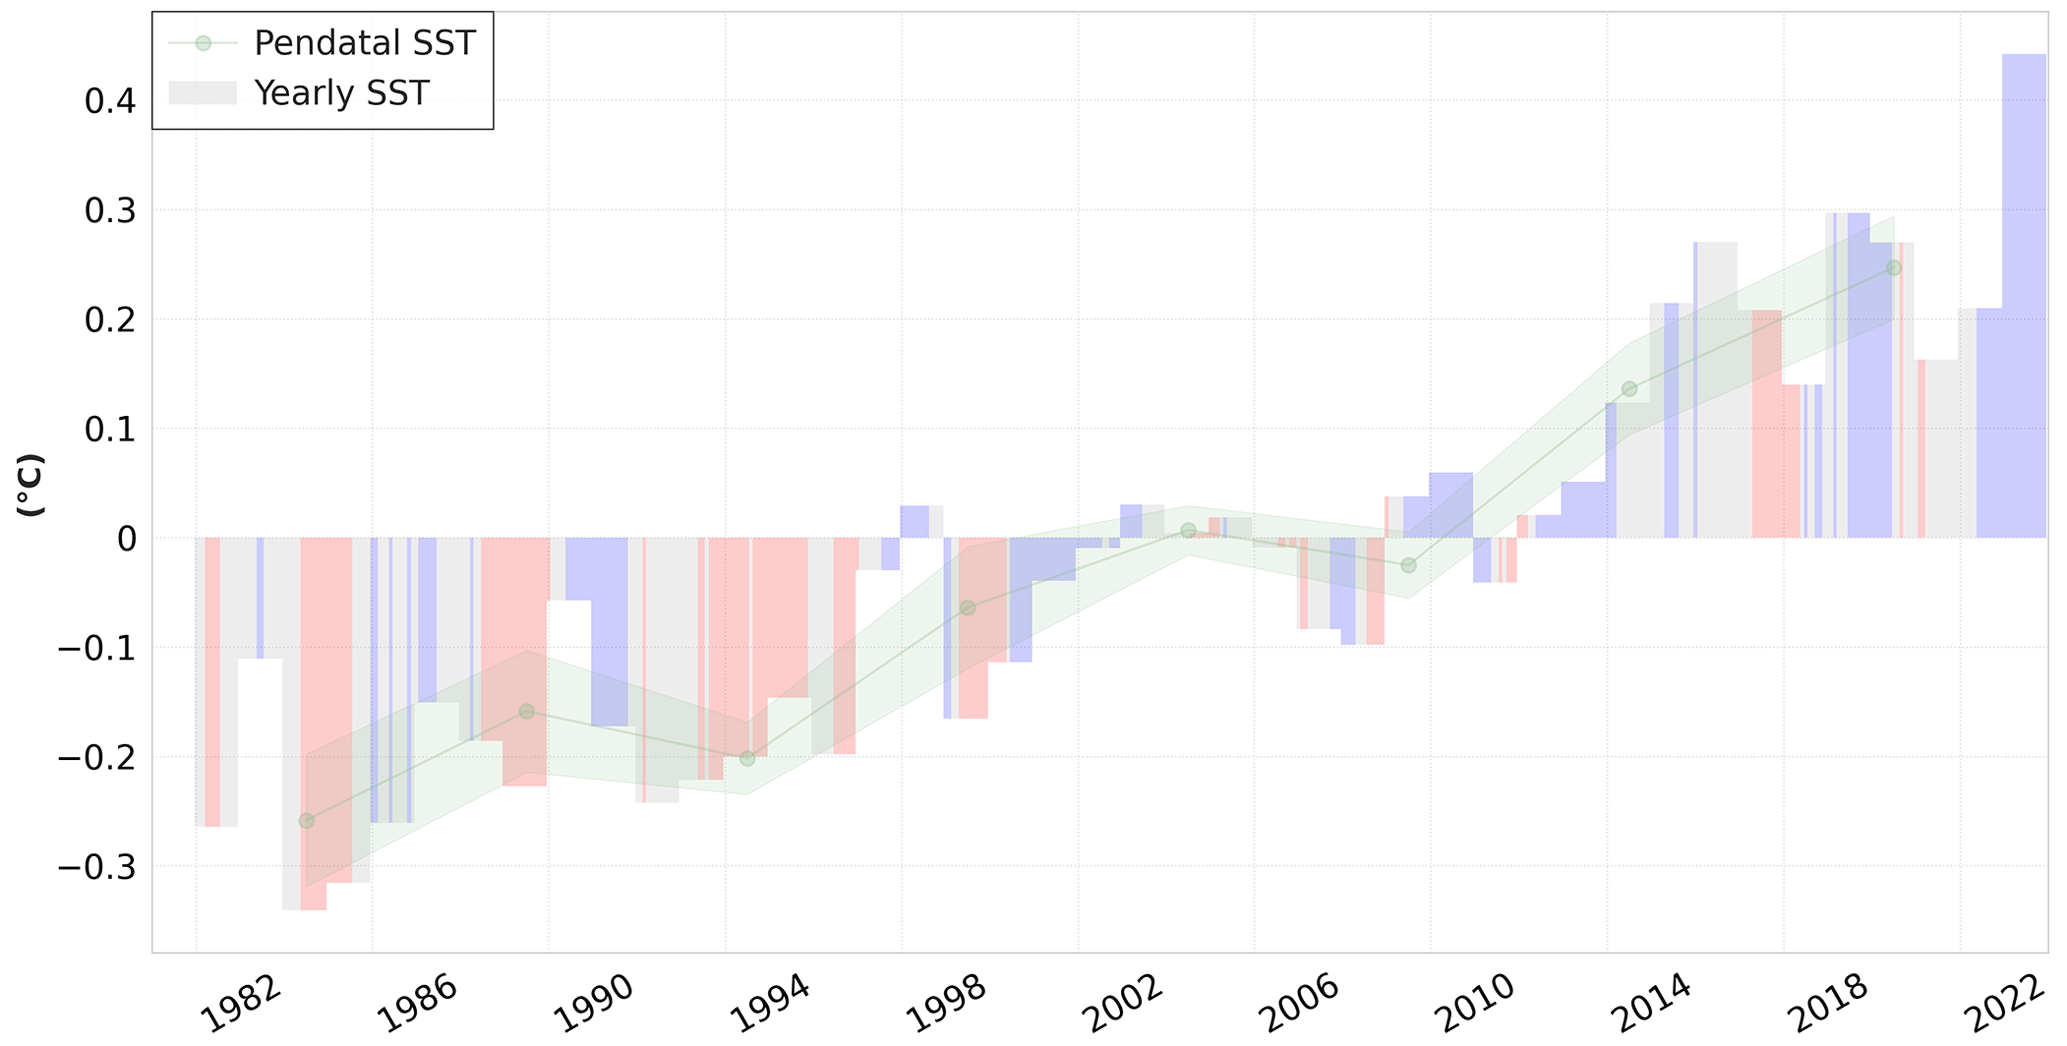
Figure 1Annual global (90° N–90° S) mean sea surface temperature (bars) anomalies (relative to the 1991–2020 baseline) together with pentadal (green line) values over the satellite record as derived from product ref. SST.3 in the Supplement over the period 1982–2023. The green shaded envelope represents the 2σ ensemble spread of pentadal values for three products (product ref. SST.1–SST.4). Colours on bars indicate the positive (red, El Niño), negative (blue, La Niña), and neutral (grey) phases of the multivariate ENSO index (product ref. SST.5).
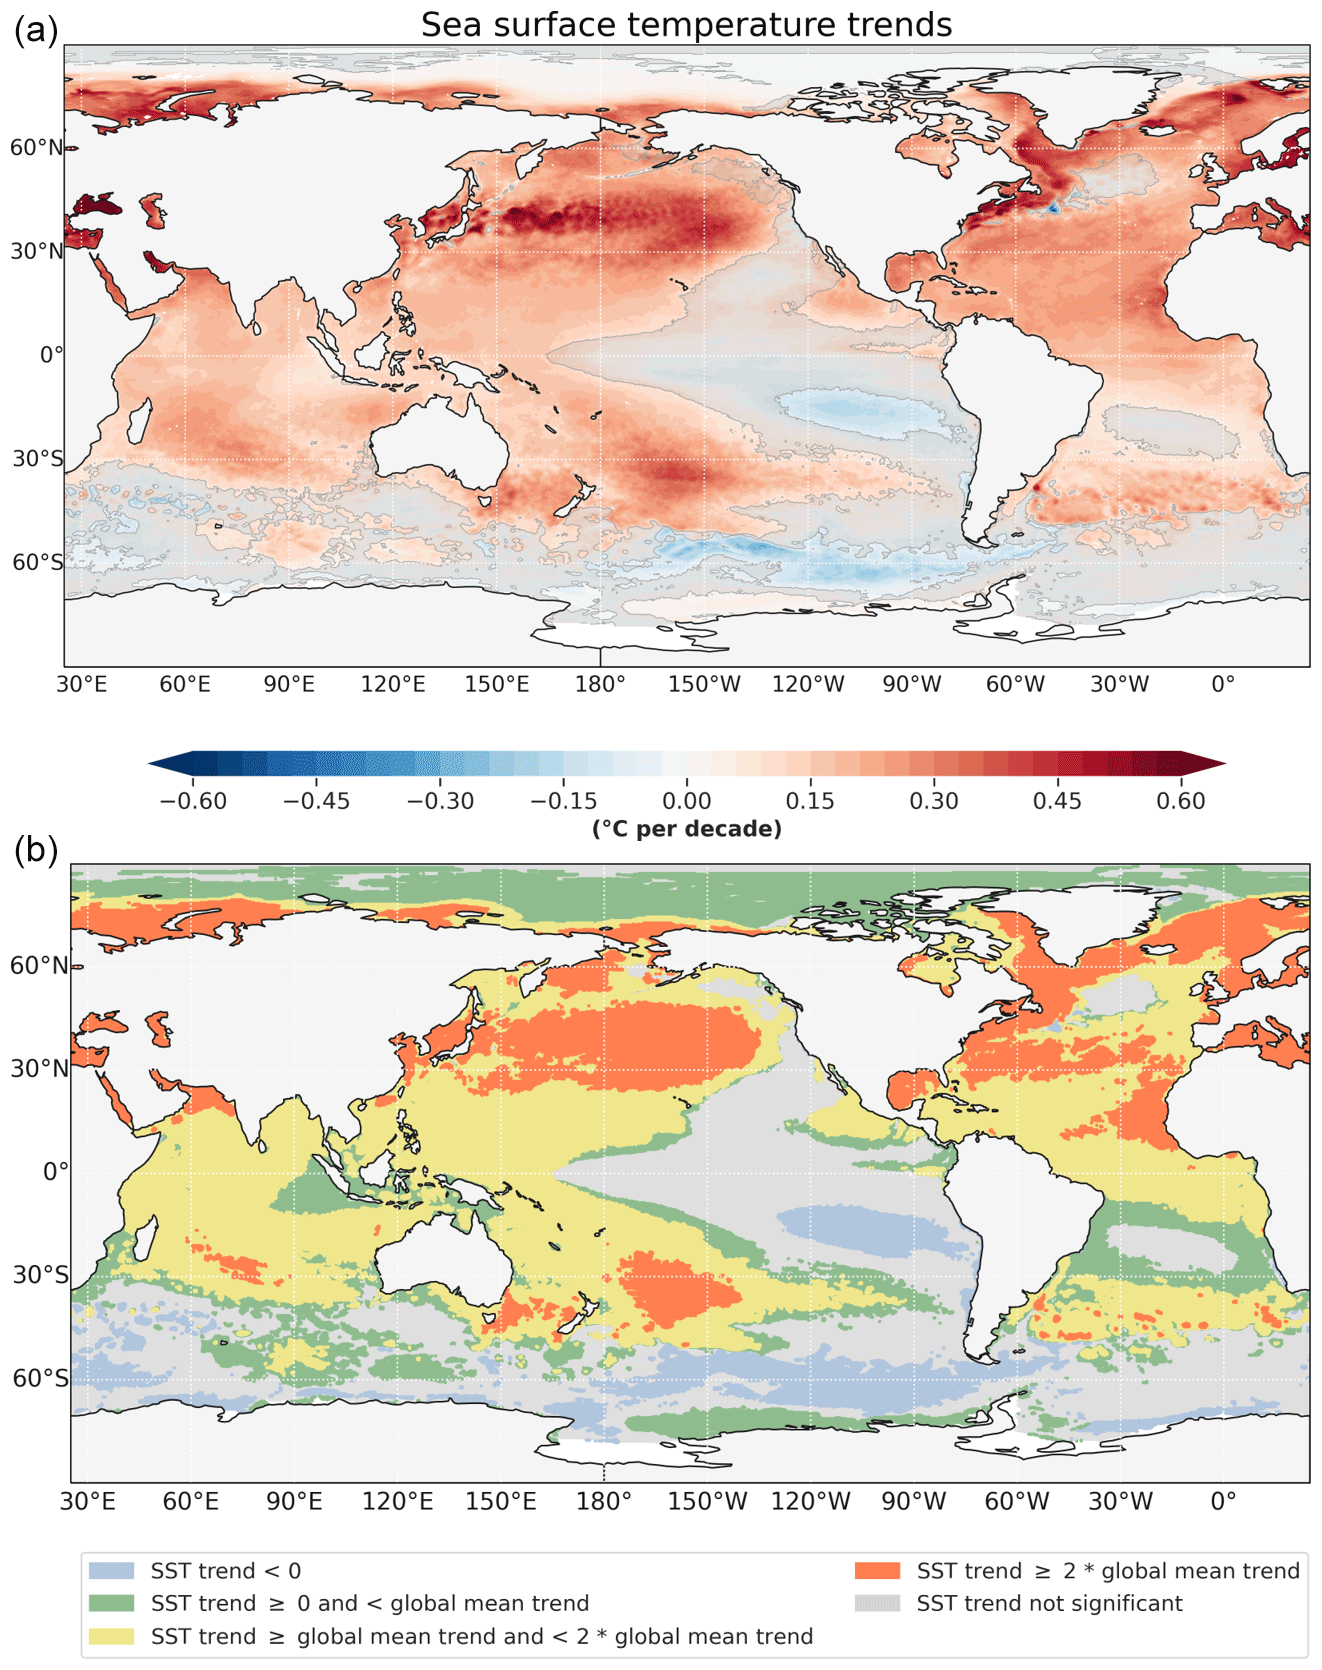
Figure 2(a) Regional trend of sea surface temperature anomalies (rel. to the 1991–2020 baseline) over the period 1982–2023 as derived from product ref. SST.3. (b) Same as (a) but representing areas where the regional trend is negative (blue), positive and lower (green) than the global mean sea surface warming trend, equal to or exceeding up to 2 times (yellow) or exceeding 2 times the global mean sea surface warming trend (see Fig. 1). The grey shading represents areas where the trend is statistically not significant.
Table 1Percentage of ocean surface affected by different sea surface temperature trends, for the whole considered areas, and when considering only the shallow waters (depth between 0 and 200 m) in the regions.
1.2 Ocean heat content
The global ocean is warming, and this human-driven warming is irreversible over centuries to millennia (IPCC, 2021). The ocean is warming because today the Earth is out of energy balance with anthropogenic climate forcing (Forster et al., 2021; Hansen et al., 2011; von Schuckmann et al., 2016). This Earth energy imbalance leads to an accumulation of heat in the Earth system, from which the majority – about 90 % – is stored in the global ocean. The rest is warming the continents, melting the ice in the frozen parts of the world, and warming the atmosphere (von Schuckmann et al., 2020). In other words: the ocean is our sentinel for monitoring the current state and future perspectives of planetary warming and is hence the fundamental indicator of high policy relevance (Cheng et al., 2024; von Schuckmann et al., 2023). In accordance with climate models, this indicator also reveals that Earth system heating is accelerating (Minière et al., 2023; Storto and Yang, 2024; Cheng et al., 2024).
Ocean warming has wide-reaching implications (Cheng et al., 2022). For example, ocean warming contributes to about 40 % of the observed global mean sea level rise and alters ocean currents (Gulev et al., 2021). It also indirectly alters storm tracks (IPCC, 2018), increases ocean stratification (Li et al., 2022), and can lead to changes in marine ecosystems (Bindoff et al., 2019). Particularly, and together with ocean acidification and deoxygenation, ocean warming can lead to dramatic changes in ecosystem assemblages, biodiversity impacts, population extinction, coral bleaching, infectious diseases, and changes in animal behaviour (including reproduction), as well as the redistribution of habitats (Garcia Molinos et al., 2015; Gattuso et al., 2015; Ramírez et al., 2017).
Different research groups have developed products for evaluating ocean heat content, which rely on different data processing methods and bias corrections (Gulev et al., 2021; Cheng et al., 2022). Albeit these different approaches, those estimates agree on the fact that the global ocean has been warming since about 1960 onwards (Fig. 3a). The rate of ocean warming for the period 1960–2023 amounts to 0.58 ± 0.1 W m−2 (Fig. 3a). For the most recent 2 decades (2005–2023), the global mean ocean warming rate has increased as compared to the long-term change (1.05 ± 0.2 W m−2, Fig. 3a). This doubling of the global ocean warming rate has been discussed in the recent literature (Cheng et al., 2022; Loeb et al., 2021; von Schuckmann et al., 2023), also in the light of ocean warming acceleration (Minière et al., 2023). The steady increase in ocean warming rates is consistent for different types of products, including direct estimates from ocean in situ observations, indirect estimates from remote sensing, the direct estimate of net flux at the top of the atmosphere from satellite data, and CMIP6 climate models (Cheng et al., 2024). Different drivers of this change are discussed in the literature, including an attribution to a change in anthropogenic climate forcing (Hansen et al., 2023; Kramer et al., 2021; Raghuraman et al., 2021), or natural variability (Loeb et al., 2021).
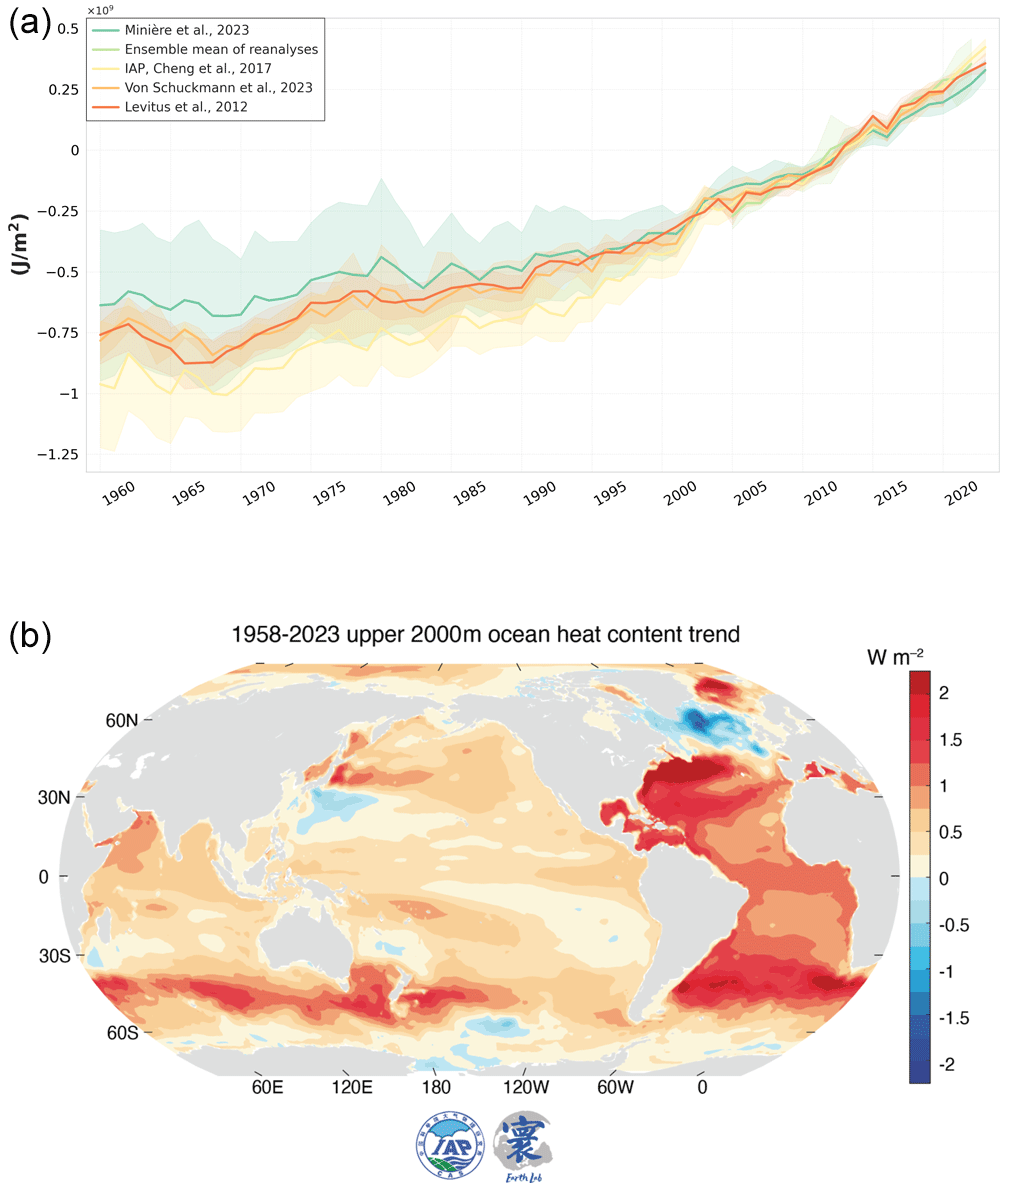
Figure 3(a) Global mean ocean heat content (60° S–60° N) integrated from the surface down to 2000 m depth based on different products, i.e. IAP (Cheng et al., 2017 (product ref. OHC.1); Levitus et al., 2012 (product ref. OHC.2); Minière et al., 2023 (product ref. OHC.5), GCOS (von Schuckmann et al., 2023) product ref. OHC.6) and the Copernicus Marine Ocean Monitoring Indicators (product ref. OHC.7 ensemble mean of reanalyses based on product ref. OHC.8). Shaded areas indicate the uncertainty for each method respectively. The trend is estimated from product ref. 1–8 using a locally weighted scatterplot smoothing approach and amounts to 0.58 ± 0.13 W m−2 over the period 1960–2023 and 1.05 ± 0.17 W m−2 over the period 2005–2023. (b) Regional trend over 1960–2023 for ocean heat content in the upper 2000 m depth, in W m−2. Data updated from Cheng et al. (2017), product ref. OHC.1.
Although ocean heat content (OHC) has increased dramatically at the surface, at depth, and over the entire water column, the pattern of ocean warming has been non-uniform (Cheng et al., 2022). The strongest upper 2000 m ocean warming occurs in the Southern Ocean (60–35° S), North Atlantic (20–50° N), and South Atlantic (60° S–0°) (Fig. 3b). The Southern Ocean domain (78–35° S) has been the largest heat reservoir since 1960, accounting for ∼ 36 % of the global upper 2000 m OHC increase. This strong warming is associated with the absorption of anthropogenic heat by the cold upwelling waters, which is then exported to the northern flank of the Antarctic Circumpolar Current (ACC) by the background overturning circulation. While the Atlantic Ocean (35° S–64° N), Pacific Ocean (35° S–60° N), Indian Ocean (35° S–30° N), and Arctic Ocean (65° N–90° N) account for ∼ 33 %, ∼ 20 %, ∼ 9 %, and ∼ 2.5 % of the global 0–2000 m OHC increase, respectively, the percentages change with time and ocean area. If considering the difference of ocean area, area-averaged warming is larger in the Southern Ocean, Atlantic Ocean, and Mediterranean Sea (ranging from 1.11–1.42 × 10⁹ J m−2) compared to the other basins (0.49–0.70 × 10⁹ J m−2), indicating very intensive warming mainly associated with the ocean circulations. Some regions are cooling, in particular the subpolar Atlantic Ocean extending from the near surface down to >800 m depth (Fig. 3b). The contrasting pattern of cooling (∼ 50–70° N) and warming (20–50° N) in the North Atlantic has been associated with both circulation changes and local air–sea interactions (Cheng et al., 2022). Other cooling regions include the northwest Pacific, southwest Pacific, and southwest Indian oceans (Fig. 3b).
1.3 Sea level
Sea level is a global climate indicator of major interest (GCOS/WMO) as its long-term change encompasses different components of the Earth climate system in response to anthropogenic and natural forcing (Cazenave and Moreira, 2022). According to IPCC (2019), global mean sea level is rising, with acceleration in recent decades due to increasing rates of ice loss from the Greenland and Antarctic ice sheets, as well as continued glacier mass loss and ocean thermal expansion. Global mean sea level increased by 0.20 m between 1901 and 2018, with an increasing rate of rise for which human influence has very likely been the main driver since at least 1971 (IPCC, 2023).
The rise in sea levels has increased the adverse effects of coastal floods, storms, and tropical cyclones and, hence, the consequent losses and damages, increasing inhabitants' and infrastructure vulnerability and food security risk, in particular in low-lying areas and island states (IPCC, 2022a). Adaptation and mitigation measures, such as the restoration of mangroves and coastal wetlands, reduce the risks from sea level rise (IPCC, 2022b). Part of the present-day global mean sea level rise is driven by human-induced global warming, which impacts oceans' mass and volume. The ocean mass change (also known as barystatic sea level change) refers to the sea level change due to water mass redistribution between the ocean and land due to Greenland and Antarctica ice sheets' mass loss, the melting of glaciers and ice caps, and changes in terrestrial water storage (Oppenheimer et al., 2019). Change in ocean volume or density (also known as steric sea level change) is due to temperature and salinity changes regionally and, at global scale, to thermal expansion of the ocean in response to warming (Oppenheimer et al., 2019).
Assessment of the global mean sea level budget is key to disentangling the causes of sea level change. The sea level budget between 1993 and 2016 was been reported to have been closed within uncertainties (e.g., WCRP Global Sea Level Budget Group, 2018). Horwath et al. (2022) estimated the closure of the sea level budget over two periods 1993–2016 and 2003–2016. For the period 1993–2016, the thermal expansion contributes with 38 % and the ocean mass component with 57 % to the global mean sea level trend. During the second period, 2003–2016, ocean mass contributions increased, mostly due to the contribution from the Greenland ice sheet, accounting now for 66 % of global mean sea level rise. The recent literature has reported the non-closure of the sea level budget since 2016 (Chen et al., 2020); however, efforts have been made to identify the reasons. Barnoud et al. (2021) identified that errors in Argo salinity measurements are responsible for about 40 % of the non-closure; however, part of the non-closure remains unexplained.
Since the early 1990s, sea level has been routinely monitored by precision radar altimeters on board the still-growing satellite constellation. Historically, sea level has also been monitored by tide gauges installed along coastlines that measure relative sea level, which is the height of the water relative to the height of the land. Relative sea level change as measured by tide gauges describes the variation in ocean height in relation to the land at a specific location. Absolute sea level as measured by satellites change refers to the variation in the ocean's height relative to the Earth's centre, irrespective of any changes in the adjacent land's elevation.
The Copernicus Marine Service altimetry-based global mean sea level (GMSL) has been rising at a rate of 3.4 mm yr−1 with an uncertainty that amounts to ±0.3 mm yr−1 with a confidence level of 90 % (Guérou et al., 2023) over the last 30 years (Fig. 4). The Copernicus Marine Service sea level data have been adjusted for the modelled glacial isostatic adjustment from Spada and Melini (2019), with a global mean correction on the order of −0.3 mm yr−1. The altimetry-based sea level data are affected by the TOPEX-A instrumental drift over the period 1993–1998 (e.g., WCRP Global Sea Level Budget Group, 2018). The correction applied is based on Ablain et al. (2017). This empirical correction is based on a comparison with tide gauges, and it led to a drift correction of about −1.0 mm yr−1 between January 1993 and July 1995 and +3.0 mm yr−1 between August 1995 and February 1999, with an uncertainty of 1.0 mm yr−1 (WCRP Global Sea Level Budget Group, 2018). Even though this correction was initially intended for the GMSL, Legeais et al. (2020) stated that the anomaly of the onboard calibration correction is not expected to have any spatial signature on the regional sea level trends since it affects all measurements equally; as a consequence, here we correct the regional sea level data.
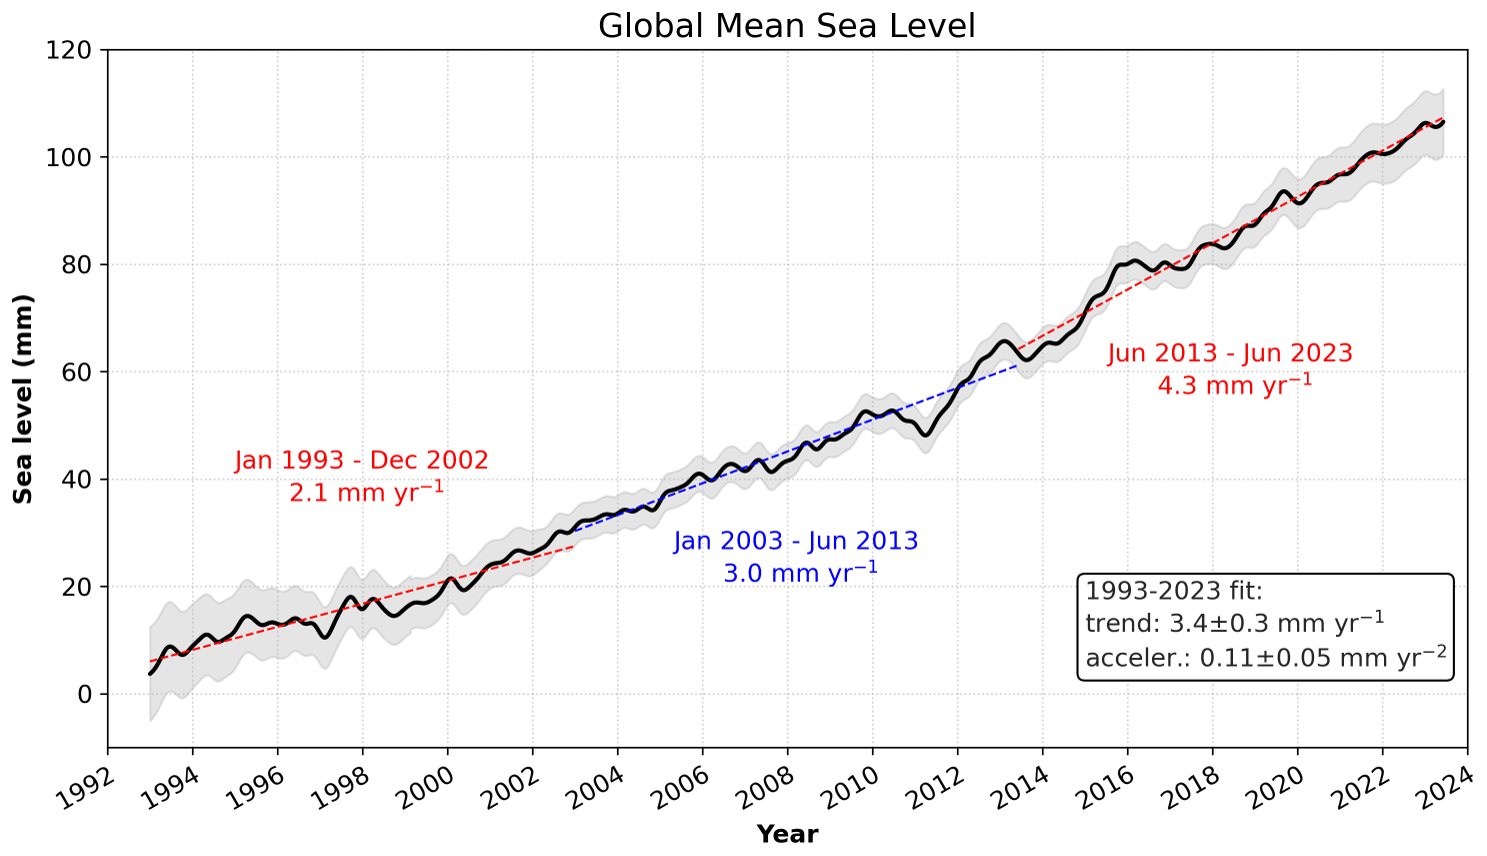
Figure 4Global mean sea level (product ref. SL.1) time series from January 1993 to June 2023 (black curve) and its uncertainty envelope (shaded). The seasonal cycle has been removed, and the data are low-pass-filtered (175 d cut-off) and adjusted for global GIA correction of −0.3 mm yr−1 (Spada and Melini, 2019) and TOPEX-A instrumental drift (1993–1998, Ablain et al., 2017). The trend and acceleration estimates for the whole altimetry era (1993–2023) are presented in the black box, trends for the first decade (1993–2002) and last decade (June 2013–June 2023) in red, and trends for the middle period (2003–June 2013) in blue.
Over 1993–2023, the GMSL has increased by more than 10 cm (Fig. 4). The rate of rise for the first 10 years (1993–2002) of the altimetry era is estimated to be 2.1 mm yr−1, whereas the rate of rise for the last 10 years (2013–2023) is estimated to be 4.3 mm yr−1, indicating an acceleration that is broadly reported in the recent literature (e.g., Hamlington et al., 2020). The acceleration is estimated to have been 0.11 ± 0.06 mm yr−2 over the last 30 years (e.g., Guérou et al., 2023).
At regional scale, the sea level rise is not uniform. Whereas a positive trend is observed in most regions, spots of negative trends can also be observed (Fasullo and Nerem, 2018). As shown in Fig. 5, 49 % of the altimetry-based observed ocean is rising at a faster rate as compared to the global average rate (3.4 mm yr−1 over 1993–2023). This is the case in the Indian Ocean and in some regions of the Pacific and Atlantic Ocean (yellow areas in Fig. 5b). A total of 23 % of the ocean level has been rising faster than the rate over the last 10 years (4.3 mm yr−1 over mid-2013 to mid-2023), as for instance in the eddy-rich regions in the North Atlantic and North Pacific Ocean basins, in the western Pacific Ocean and Pacific islands, and also in the Gulf of Mexico and some areas in the South Atlantic and Indian Ocean basins (orange regions in Fig. 5). Overall, most regions display positive trends over the period 1993–2023 except in the eastern Pacific Ocean and, for some spots, near the major Northern Hemisphere western boundary currents (e.g. the Kuroshio current) (green areas in Fig. 5b). In any case, internal variability has a significant impact on global and regional sea level trend estimates (e.g., Moreira et al., 2021; Hamlington et al., 2019), and hence, these spatial patterns are affected by the natural variability, for example, the El Niño–Southern Oscillation (ENSO).
Regionally, the mechanisms responsible for the variations in sea level trends are dominated by ocean temperature and salinity changes linked to steric effects and other processes such as ocean mass redistribution by the ocean circulation, atmospheric loading and changes in Earth gravity, Earth rotation, and viscoelastic solid-Earth deformation (GRD; Stammer et al., 2012). The latter is due to ongoing changes in the solid Earth caused by past changes in land ice (glacial isostatic adjustment, GIA) and by contemporary changes in the mass of water stored on land as ice sheets, glaciers, and land water storage (GRD sea level fingerprints) (Gregory et al., 2019). While at regional scale, sea level trends are still dominated by steric changes (Stammer et al., 2012), theoretical studies predict that with accelerated land ice melt, GRD fingerprints will become detectable (Tamisiea, 2011). An example of sea level fingerprint is the area encircling the Greenland ice sheet, which shows negative trends observed quite well for the period 2002–2019, as a consequence of ice mass melting (Coulson et al., 2022). Over 1993–2019, Prandi et al. (2021) estimated the average local sea level trend uncertainty to be 0.83 mm yr−1, with values ranging from 0.78 to 1.22 mm yr−1.
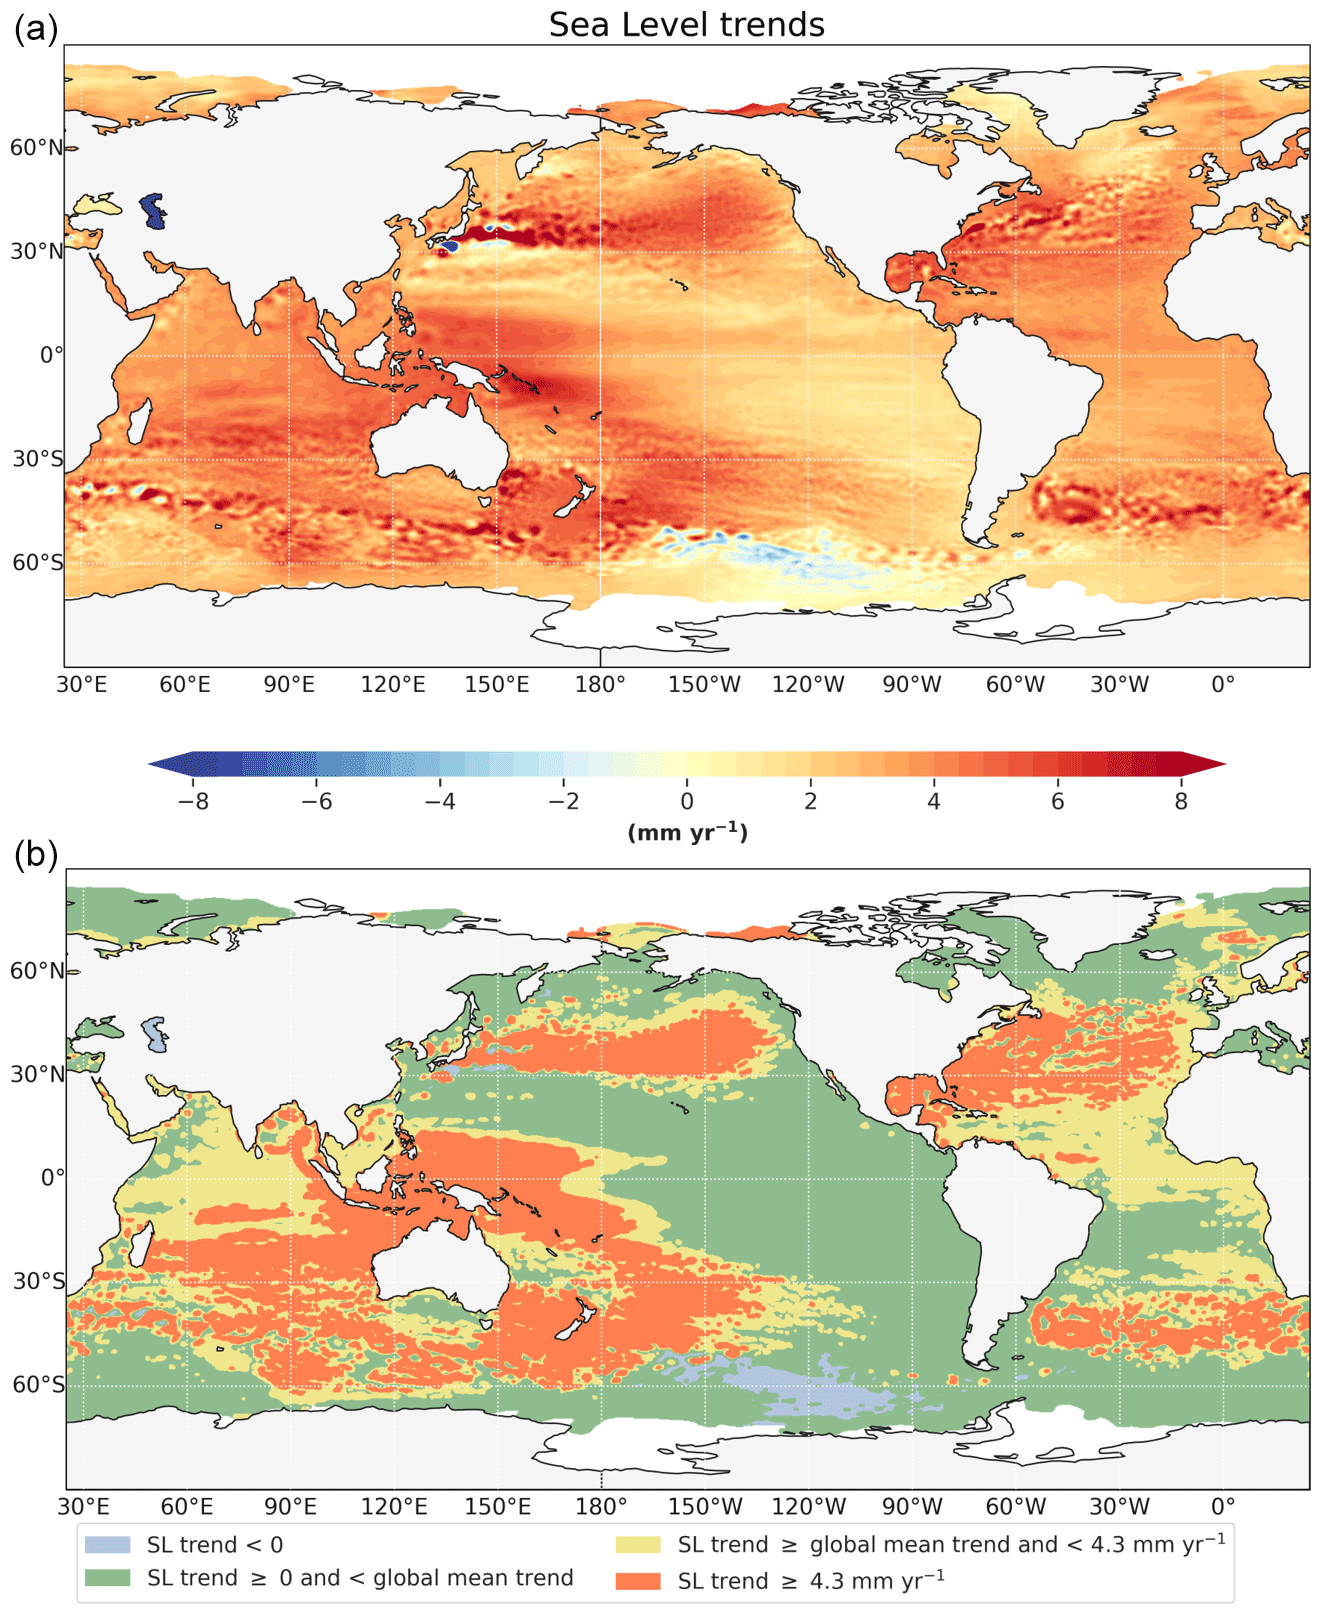
Figure 5(a) Regional sea level trends from January 1993 to June 2023 (product ref. SL.2). (b) Shading map indicating the magnitude of the rates of sea level rise, where blue depicts regions with negative sea level trends, green indicates areas where sea level is rising more slowly than the altimetry-era global mean sea level rate of rise of 3.4 mm yr−1, yellow indicates locations where sea level is increasing at a range between the global mean trend and 4.3 mm yr−1, and orange indicates regions where sea level is rising at a rate faster than 4.3 mm yr−1, which is the global mean sea level trend estimate over the last 10 years (June 2013–June 2023). The data used are corrected for GIA (Spada and Melini, 2019) and TOPEX-A drift (Ablain et al., 2017).
1.4 The ocean in the cryosphere
The cryosphere (that is the frozen parts of the world) and ocean are tightly interlinked, such as through major Earth system global cycles (energy, water, carbon), sea level change, or climate feedback processes (IPCC, 2019). For example, evaporation from the ocean contributes to snowfall that builds and sustains ice sheets and glaciers (Abram et al., 2019). A major fraction of global sea level rise is driven by the mass loss from melting land ice (WCRP Global Sea Level Budget Group, 2018), and ice sheets in Antarctica and Greenland currently hold about 66 m of potential global sea level rise (Fretwell et al., 2013). Ocean warming affects sea ice, ice sheet, glacier, and ice-shelf stability in areas of direct contact (Cai et al., 2023; Harrison et al., 2022; Naughten et al., 2022; Turney et al., 2020; Ciracì et al., 2023; de Steur et al., 2023; Wood et al., 2021). The injection of less dense water into the ocean from melting processes in turn affects ocean processes, hydrography, and circulation (Armitage et al., 2020; Gunn et al., 2023; Rahmstorf et al., 2015; Golledge et al., 2019). Also, ocean productivity in the polar areas is triggered – amongst others – through biogeochemical processes, such as through seasonal nutrient exchange from sea ice and glaciers' melt (Arrigo et al., 2017; Tagliabue et al., 2017).
A major player for the ocean–cryosphere nexus is sea ice, which is a thin and active system that triggers fluxes of heat, water, and carbon and is hence a fundamental actor in physical and biogeochemical processes (IPCC, 2019). Besides its role in affecting ocean circulation and processes (e.g., stratification) as mentioned above, sea ice plays a prominent role within the so called “ice–ocean–albedo feedback”, which is a central process controlling high-latitude climate change: as ice cover melts from unusual warming, the underlying ocean is exposed to increasing absorption of shortwave radiation, which results in amplified ocean warming (Jenkins and Dai, 2022, 2021; Kashiwase et al., 2017; Goosse et al., 2018). Together with biogeochemical tracers, sea ice also harbours various species at the base of the food chain, which plays a central role in the biological carbon pump and supports key foraging species such as Arctic cod (Lannuzel et al., 2020). Since about the 1980s, Arctic Sea ice area has decreased by about 40 % (10 %) in September (March) from anthropogenic warming, and in 2011–2020, annual average Arctic sea ice area reached its lowest level since at least 1850 (IPCC, 2021). The Arctic is likely to be practically sea ice-free in September at least once before 2050 under all scenarios considered in the recent IPCC report (IPCC, 2021), with sea ice losses projected to begin in the European Arctic and proceed to the Pacific and western Arctic and then the central Arctic (Jahn et al., 2024).
Sea ice is frozen seawater that floats on the ocean surface. The sea ice extent indicator is defined as the area where at least 15 % of the surface area is frozen (Fig. 6). Knowing how the sea ice cover is changing is essential for monitoring Arctic climate and has critical relevance for ecosystem health; Arctic communities; and economy such as fisheries, tourism, and transport (Meredith et al., 2019).
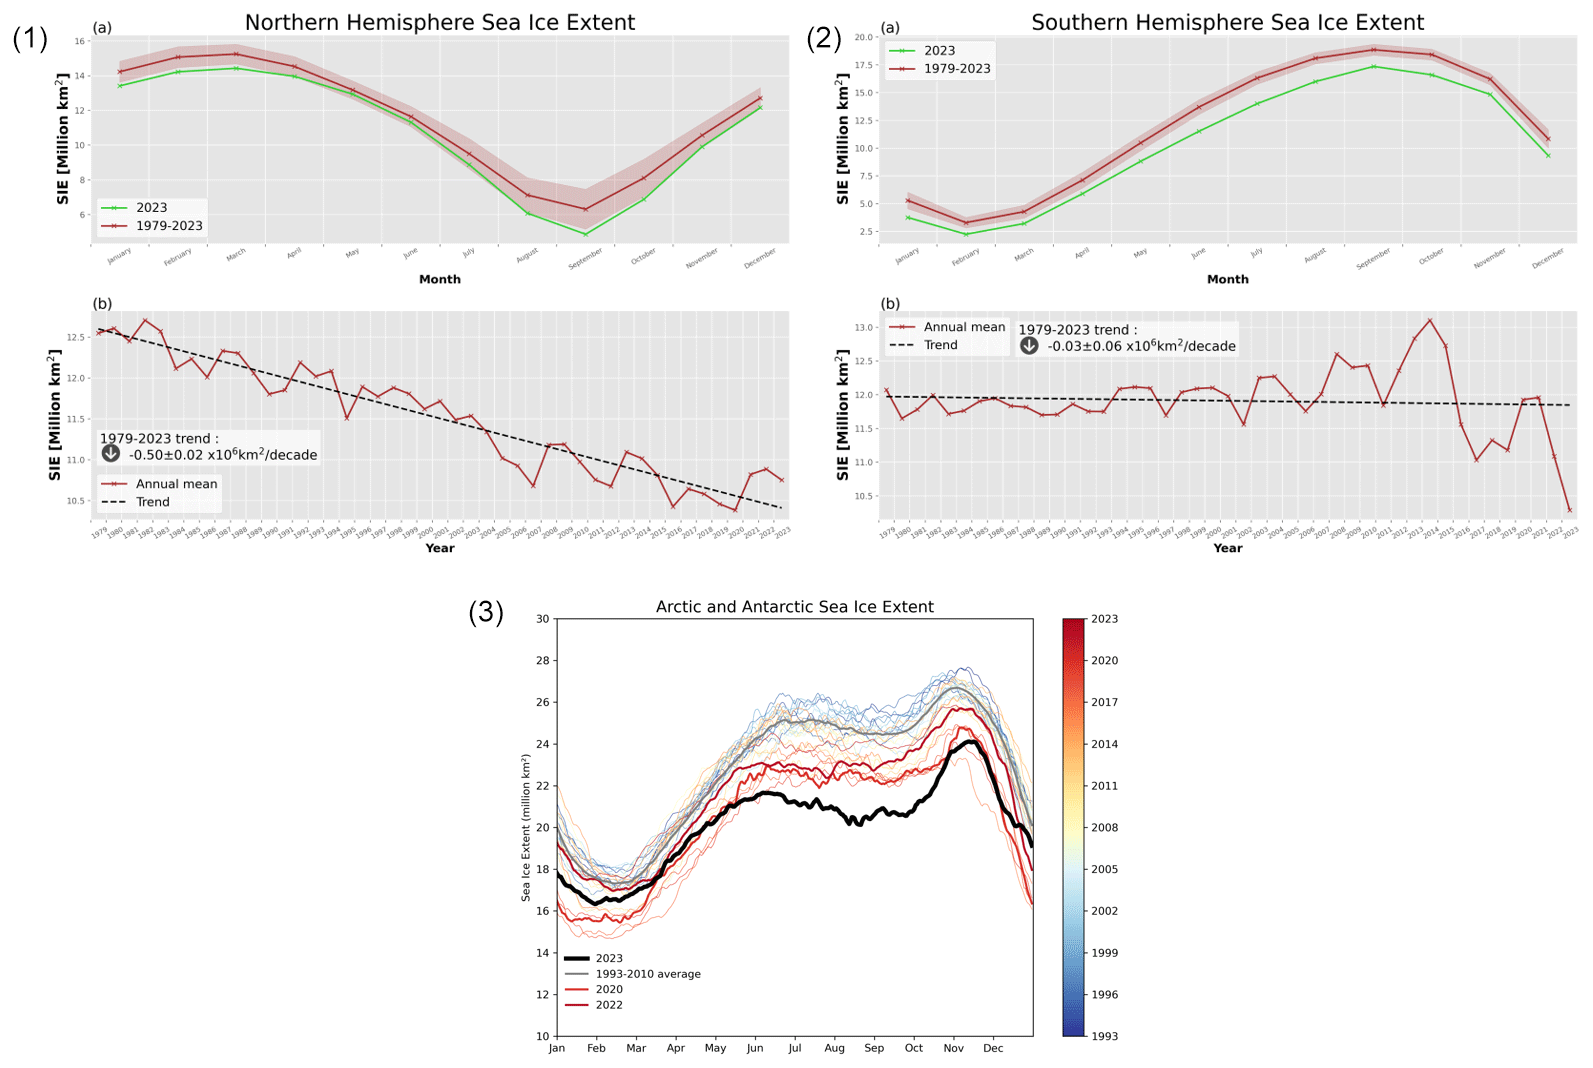
Figure 6Panel (1): (a) Seasonal Northern Hemisphere sea ice extent expressed in millions of square kilometres averaged over the period 1979–2023 (red), shown together for the seasonal cycle in the year 2023 (green), and (b) time series of yearly average Northern Hemisphere Sea ice extent. The change of sea ice extent over the period 1979–2023 is expressed as a trend in millions of square kilometres per decade and is plotted with a dashed line in panel (b). Time series are based on satellite observations (SMMR, SSM/I, SSMIS) by EUMETSAT OSI SAF with R&D input from ESA CCI (product ref. SI.1). Panel (2): (a) Seasonal Southern Hemisphere sea ice extent expressed in millions of square kilometres averaged over the period 1979–2023 (red), shown together for the seasonal cycle in the year 2023 (green), and (b) time series of yearly averaged Southern Hemisphere sea ice extent. The change of sea ice extent over the period 1979–2023 is expressed as a trend in millions of square kilometres per decade and is plotted with a dashed line in panel (b). Time series are based on satellite observations SMMR, SSM/I, SSMIS by EUMETSAT OSI SAF with R&D input from ESA CCI (product ref. SI.2). Panel (3): Arctic and Antarctic sea ice extent between 1993 to 2023. The black line represents the year 2023. Time series estimated using GLORYS12V1 and GLO12 (product ref. SI.3–4).
Since 1979, the Northern Hemisphere sea ice extent has decreased at an annual rate of −0.50 ± 0.02 × 10⁶ km2 per decade (−4.33 % per decade) (Fig. 6). Loss of sea ice extent during summer exceeds the loss observed during winter periods: summer (September) sea ice extent loss amounts to −0.80 ± 0.06 × 10⁶ km2 per decade (−12.64 % per decade), and winter (March) sea ice extent loss amounts to −0.39 ± 0.03 × 10⁶ km2 per decade (−2.55 % per decade). These values agree with those assessed in the IPCC Special Report on the Ocean and Cryosphere in a Changing Climate (SROCC) (Meredith et al., 2019). Sea ice extent in September 2012 saw to date a record minimum Northern Hemisphere value since the beginning of the satellite record, followed by September 2020. January and February 2023 had the third-lowest values on record for these months, and September 2023 had the fifth-lowest values.
Sea surface temperature and sea ice surface temperatures play a crucial role in the heat exchange between the ocean and atmosphere and the sea ice growth and melt processes in the Arctic and are important for forecast and predictions (Meredith et al., 2019; Rasmussen et al., 2018). Combining sea surface temperature and sea ice surface temperature is identified as the most appropriate method for determining the surface temperature of the Arctic while challenged by the presence of complex interactions between water and sea ice at different space scales and timescales (Minnett et al., 2020; Nielsen-Englyst et al., 2023) (Fig. 7). Over the period 1982–2023, the cumulative trends exceed 2 °C for the greatest part of the Arctic Ocean, with the largest trends to occur in the northern Barents Sea, Kara Sea, Beaufort Sea, and the Eurasian part of the Arctic Ocean (Fig. 7b). Zero to slightly negative trends are found in the North Atlantic part of the Arctic Ocean. The combined sea and sea ice surface temperature trend is 0.104 ± 0.005 °C yr−1, which corresponds to an increase of around 4.37 °C between 1982 and 2023.
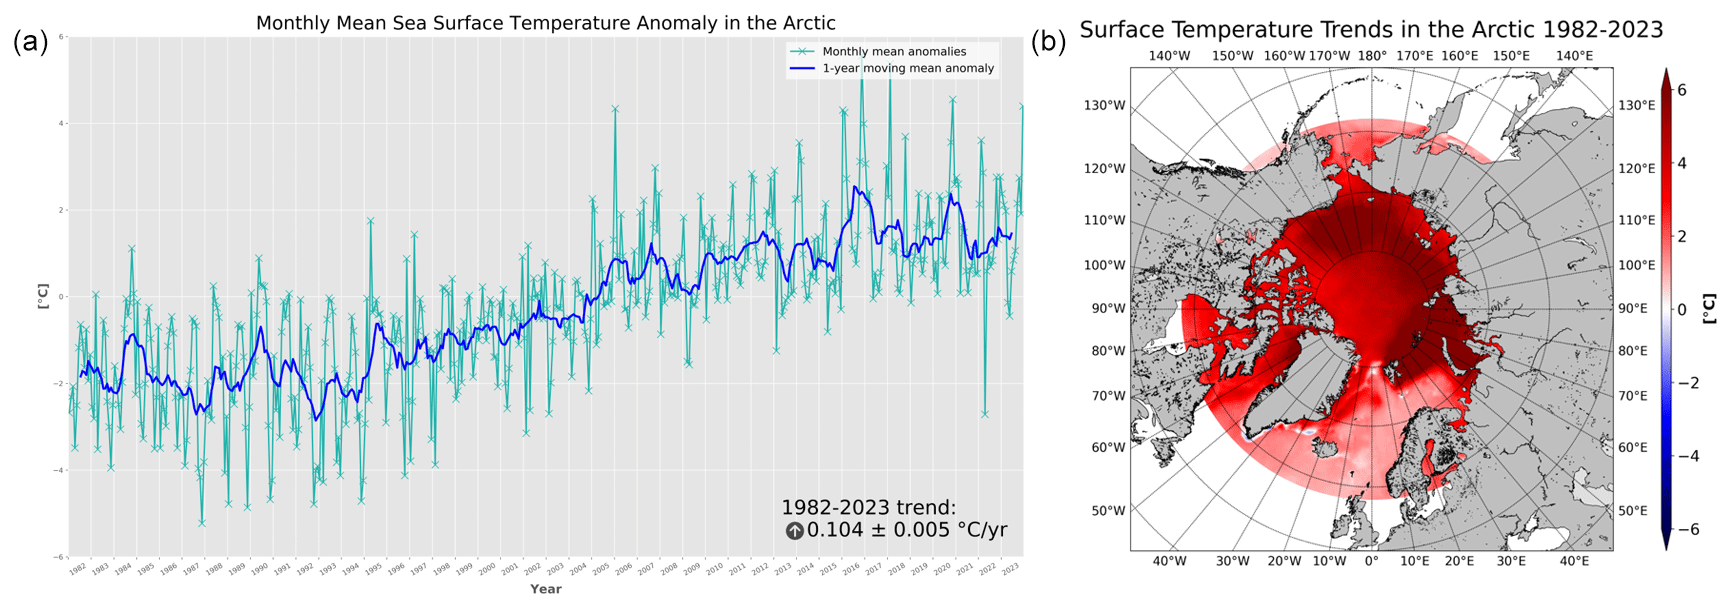
Figure 7(a) Time series of monthly mean (turquoise line) and annual mean (blue line) of sea and sea ice surface temperature anomalies for January 1982 to December 2023, relative to the 1991–2020 mean (product ref. SI.5). (b) Cumulative trends (i.e. the rate of change, °C yr−1, scaled by the number of years, 42 years) in combined sea and sea ice surface temperature anomalies calculated from 1982 to 2023 for the Arctic Ocean (product ref. SI.6).
For many years, i.e. from the beginning of the record up to the year 2016, Antarctic sea ice increased (Parkinson, 2019) (Fig. 6), despite continued global warming (IPCC, 2021) and the projected decline by climate models (Fox-Kemper et al., 2021). This overall increase in Antarctic sea ice could be allocated to increasing regional sea ice concentrations in the Ross and Weddell seas, which are on average only partly compensated for by a decrease in ice concentrations in the Bellingshausen Sea (Parkinson and Cavalieri, 2012; Lecomte et al., 2017). These regional patterns of sea ice increase over the period 1979–2016 have been linked to air–sea interactions (i.e. wind, precipitation) (Holland and Kwok, 2012; Haumann et al., 2014; Purich et al., 2016; Marsland and Wolff, 2001; Liu et al., 2004; Liu and Curry, 2010), sea ice advection or other internal ice–ocean processes (Haumann et al., 2016; Abernathey et al., 2016; Polvani and Smith, 2013; Zunz et al., 2013; Meehl et al., 2016), and the influence of freshwater discharge from Antarctic meltwater at the ocean and cryosphere nexus (Bintanja et al., 2013a; Pauling et al., 2017; Bintanja et al., 2013b; Swart and Fyfe, 2013). In autumn 2016, however, Antarctic sea ice experienced an unprecedented rapid loss, and since then, it has remained in a state of low sea ice, reaching record low levels in the years 2022 and 2023 (Gilbert and Holmes, 2024) (Fig. 6). Recent studies highlight that ocean warming has played a role in pushing Antarctic sea ice into this new low-extent state (Zhang et al., 2023; Purich and Doddridge, 2023). Values in 2023 are the lowest on record and amount to more than 1.5 × 10⁶ km2 below the pre-2000 levels (Fig. 6).
Monitoring change in sea ice extent globally allows for identifying changes in Earth's albedo sea ice feedback. The Earth's albedo, or its ability to reflect sunlight, is heavily influenced by the extent of ice cover on the planet's surface. And ice, with its high reflectivity, has a significant cooling effect on the Earth's climate by bouncing a substantial portion of incoming solar radiation back into space. As global ice cover decreases due to climate change, more sunlight is absorbed by darker surfaces like water and land, potentially leading to increased warming and altered weather patterns and exacerbating global climate change (Abram et al., 2019). Global sea ice extent in the polar regions – considering both the Arctic and Antarctic areas together – was on average at its lowest point in 2023 (Fig. 6), well below the 2020 and 2022 values. The drastic drop in global mean sea ice extent in 2023 is caused by a combination of strong Arctic sea ice melting during the Northern Hemisphere spring and the concurrent lack of Antarctic sea ice growth during the Southern Hemisphere autumn. This global historical low sea ice extent started in May and lasted until end of October, with total sea ice cover between 20 and 22×106 km2 over the entire period.
1.5 Ocean acidification
The ocean plays a major role in the global carbon cycle, and it is an important sink for anthropogenic CO2, moderating climate change (Gruber et al., 2019). According to the recent IPCC report, the ocean has taken up between 20 %–30 % of total anthropogenic carbon dioxide emissions since the 1980s (IPCC, 2019). Every year, the ocean absorbs about 25 % of the carbon dioxide released to the atmosphere (Canadell et al., 2021) by fossil fuel consumption, cement manufacturing, and land use change. The ongoing uptake of CO2 alters the ocean carbonate system (i.e. lowers ocean pH) and threatens marine ecosystems, as well as reliant human communities (Doney et al., 2020). The decrease in ocean pH is referred to as ocean acidification (e.g., Canadell et al., 2021).
Ocean acidification is one of the 10 targets of the Sustainable Development Goal 14: Life Below Water (SG14.3 – minimize and address the impacts of ocean acidification, including through enhanced scientific cooperation at all levels) of the United Nation's 2030 Agenda for Sustainable Development (UN, 2015). The Intergovernmental Oceanographic Commission (IOC) of UNESCO is the custodian agency of SDG 14 Target 3, gathering together average marine acidity (pH) measured at an agreed suite of representative sampling stations. It provides guidance on how to establish the monitoring of ocean acidification by detailing which measurements to take. The methodology follows the best practices established by the scientific community. It supports the design of the most appropriate sampling strategy for a particular location and presents tools for the collection, quality control, and reporting of the data (UN, 2023).
IPCC (2019) states that open-ocean surface pH has declined by a very likely range of 0.017 to 0.027 pH units per decade since the late 1980s, with the decline in surface ocean pH very likely to have already emerged from background natural variability for more than 95 % of the ocean surface area. Ocean acidification has spread deeper in the ocean, surpassing 2000 m depth in the northern North Atlantic and in the Southern Ocean (Canadell et al., 2021). At regional scale, ocean acidification is not increasing uniformly: 47 % of the sampled ocean is getting more acidic at a rate faster than the global average, particularly in the Indian Ocean, the Southern Ocean, the eastern equatorial and northern tropical Pacific Ocean, and some regions in the Atlantic Ocean (Fig. 8). At global scales, the trends have shown a decrease of about 0.06 pH units (from 8.11 to 8.05) since 1985, corresponding to an approximately 30 % increase in acidity (Fig. 9), a rate of −0.017 ± 0.002 pH units per decade.
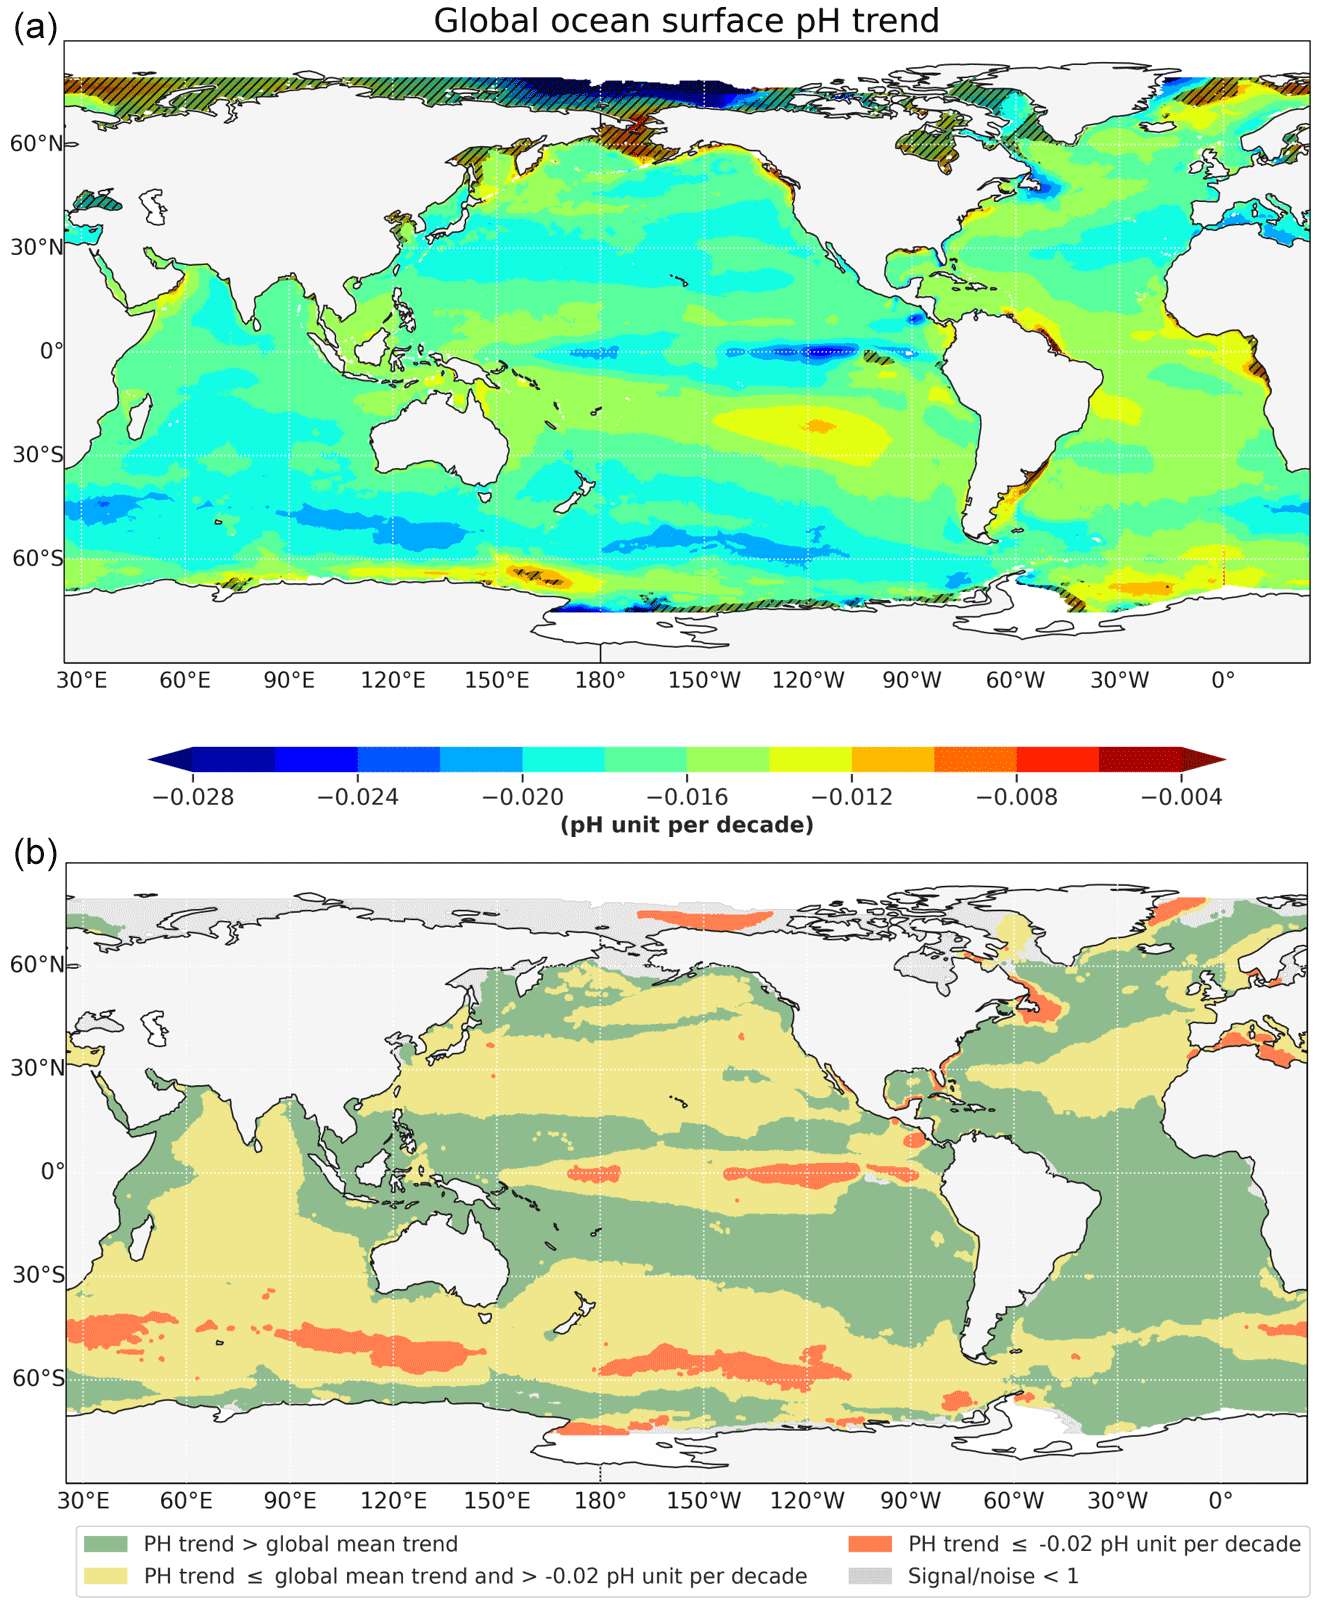
Figure 8(a) Global ocean surface pH trend (in pH unit per decade) computed over the period 1985–2022 (product ref. OA.1). Black hatching shows the regions where pH trends are associated with the highest uncertainty estimates σ (σ>10 % | μ|, i.e. σ-to-μ ratio greater than 10 %). The 10 % threshold is chosen at the 90th confidence level of all ratio values computed across the global ocean. (b) Shading map indicating the magnitude of the pH decrease rates from product ref. OA.1, where green indicates areas where pH is decreasing more slowly than the global mean pH trend of −0.017 pH unit per decade, yellow indicates locations where pH is decreasing at a rate between the global mean trend and −0.02 pH unit per decade, and orange indicates regions where pH is decreasing at rate faster than −0.02 pH unit per decade.
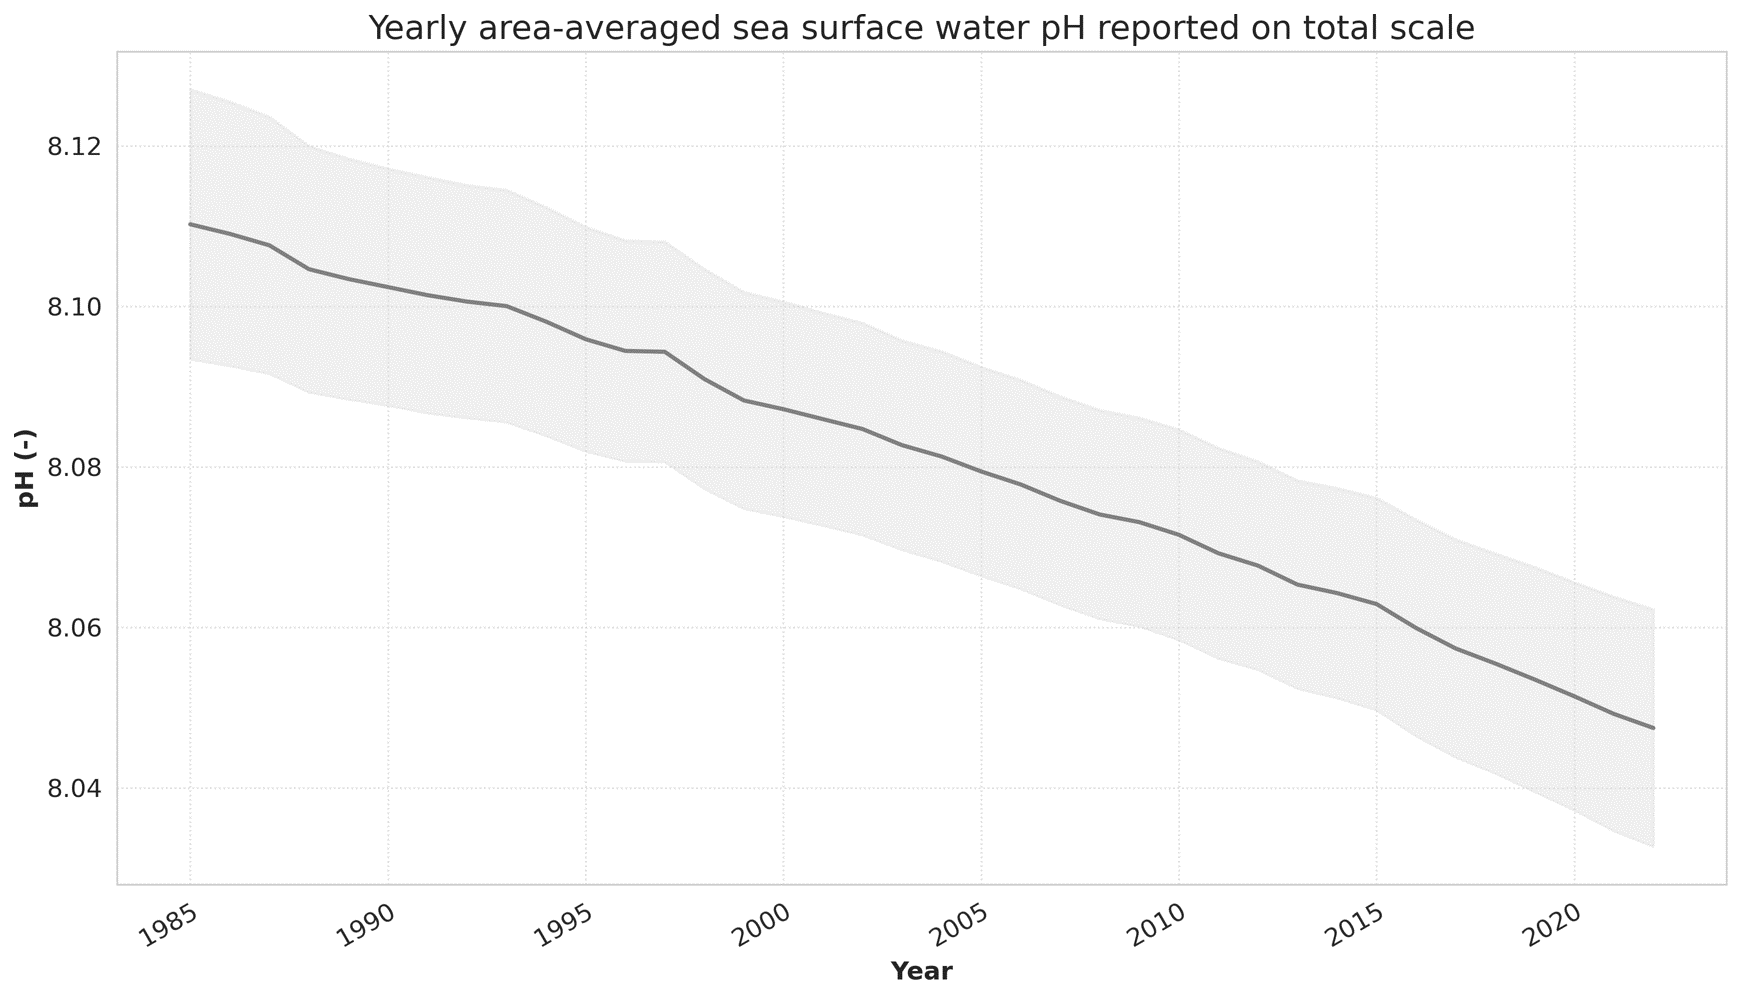
Figure 9Time series of annual global mean surface sea water pH reported on a total scale over the period 1985–2022 and associated uncertainties (range). Product ref. OA.2.
2.1 El Niño–Southern Oscillation
The El Niño–Southern Oscillation (ENSO) is one of the most important and well-studied natural climate variability phenomena, originating from coupled ocean atmosphere interactions in the Pacific Ocean and impacting Earth's climate globally through complex interaction between oceanic and atmospheric processes (McPhaden et al., 2006; Timmermann et al., 2018). ENSO is the dominant source of climate on seasonal to multi-year timescales that originates in the tropical Pacific Ocean, with alternating warming and cooling phases – El Niño and La Niña, as well as neutral conditions. It has major worldwide social and economic consequences through its global-scale effects on atmospheric and oceanic circulation, marine and terrestrial ecosystems, and other natural systems (McPhaden et al., 2020). For example, ENSO-driven ocean temperature extremes, including marine heatwaves, have been shown to result in coral bleaching, loss of kelp forests, mass mortality of marine invertebrates, and geographical shifts of species due to heat stress (Holbrook et al., 2020; Oliver et al., 2017, 2018; Cavole et al., 2016; Garrabou et al., 2009). The recent IPCC assessment has concluded that since the late 19th century, major modes of climate variability such as ENSO have shown no sustained trends (Gulev et al., 2021), as the detectability of a projected increase of ENSO variability by climate models is hampered by the strong influence of internal variability (Cai et al., 2021).
Several indices are used to monitor the state of ENSO variability in the tropical Pacific. For instance, the Niño 3.4 index (Trenberth and Stepaniak, 2001) measures sea surface temperature anomalies averaged in the east-central tropical Pacific (5° N–5° S, 170–120° W). An El Niño (La Niña) event is declared when Niño 3.4 SST remains above +0.4 °C (below −0.4 °C) for several months, while the tropical Pacific also exhibits commonly associated atmospheric change (Houghton and Wilson, 2020; Trenberth, 1997). Since 1998, five out of six La Niña events lasted 2 to 3 years (Wang et al., 2023) (Fig. 10). Recently, multi-year La Niña conditions persisted during 3 consecutive years, 2020, 2021 and 2022 (Fig. 10). This cold phase of ENSO reverted in 2023, transitioning to neutral conditions during boreal spring 2023 and then to El Niño conditions in boreal summer 2023 (WMO, 2023) (Fig. 10). During the year 2023, intense ocean surface warming was also observed along the coasts of Ecuador and Peru. Sea surface temperature anomalies averaged in the coastal region Niño 1 + 2 (10–0° S, 90–80° W) remained above +2 °C for most of the year (https://www.mercator-ocean.eu/actualites/record-high-sea-surface-temperatures-north-atlantic-drop-in-phytoplankton-el-nino-costal-el-nino/, last access: 11 September 2024). Such coastal warming is referred to as a “coastal El Niño” that usually overlaps with El Niño but can sometimes occur independently (Hu et al., 2019; Gasparin et al., 2019). The 2023 coastal El Niño surface warming in fact started a few months before the start of the 2023 El Niño.
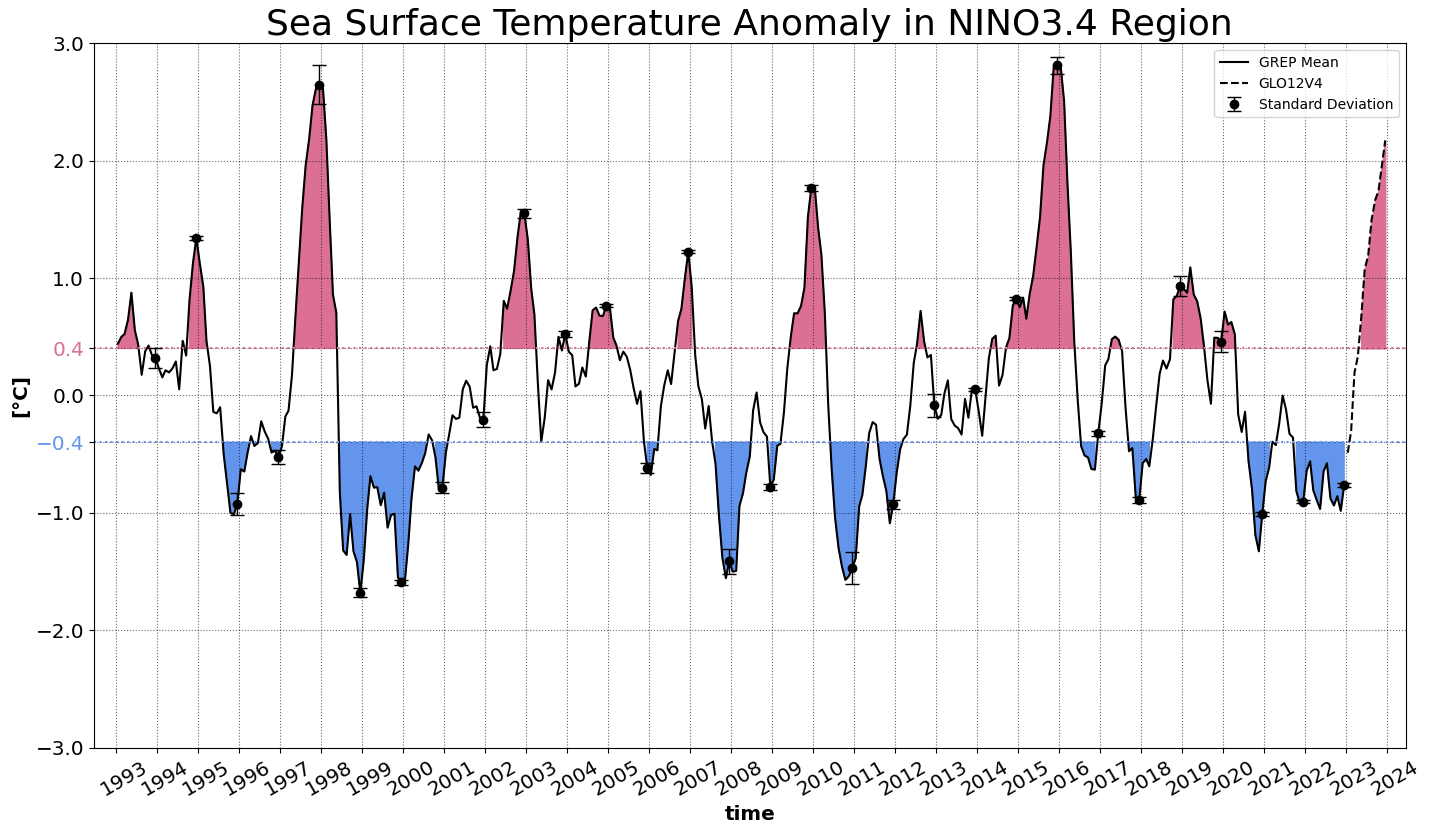
Figure 10Monthly ensemble mean (solid line) and spread (bars) of sea surface temperature anomalies (relative to the 1993–2014 climatology) averaged over the NINO box 3.4 (5° S–5° N, 170–120° W). Product ref. OV.1 based on product ref. OHC.8 for the period 1993–2022 and extended up to December 2023 using product ref. SI.4 (using GLORYS2V4 (product ref. OHC.8) 1993–2014 as climatology).
2.2 Atlantic Meridional Overturning Circulation
The Meridional Overturning Circulation (MOC) plays a central role in Earth's climate because it ultimately transports heat, freshwater, carbon, oxygen, and nutrients around the globe. The MOC is driven by a complex interplay of ocean currents, driven by the wind and water density differences, by surface buoyancy and momentum (wind) fluxes, and by interior ocean mixing (Rhein et al., 2011). The upper and lower branches of the MOC are connected via intense water mass transformation processes through air–sea exchange mainly in the subpolar and polar oceans. The recent literature has presented significant changes in the Southern Ocean since the mid-1970s, with a broadening and strengthening of the upper overturning cell and a contraction and weakening of the lower cell (Lee et al., 2023).
The Atlantic Meridional Overturning Circulation (AMOC) is a major circulation system in the Atlantic Ocean and plays a key role for the North Atlantic and global climate (Volkov et al., 2023; Jackson et al., 2015). The northward flow of high-salinity waters in the upper North Atlantic Ocean and heat loss to the atmosphere are essential for the formation of deep, dense waters at high latitudes (Holliday et al., 2020). In the Northern Hemisphere the northward transport is mainly via the Gulf Stream and North Atlantic Current system, while the southward transport of cold and dense water is via the Deep Western Boundary Current System. The AMOC components are monitored at a number of latitudes across the Atlantic (Frajka-Williams et al., 2019), with basin-wide arrays being the South Atlantic Meridional Overturning Circulation (SAMOC) array at 34.5° S (subtropical South Atlantic), which ran in a pilot phase from 2009 to 2010 and has routinely been run since 2013; the RAPID array (McCarthy et al., 2015; Smeed et al., 2014) at 26.5° N (subtropical North Atlantic), in operation since 2004; and the OSNAP array (OSNAP, 2023; Lozier et al., 2019) at nominal 60° N (subpolar North Atlantic) and operational since 2014. The AMOC estimates from the arrays make use of moored instruments, ship and float data, and data from satellites. Variability in the AMOC influences global ocean heat content (OHC) and heat/freshwater transport, global ocean carbon uptake, nutrient redistribution, and sea level change (Fox-Kemper et al., 2021).
The 2014–2020 OSNAP observational period in the subpolar North Atlantic reveals robust seasonal variability driven by the wintertime formation and export of dense water and by the seasonally varying Ekman transport amplified by the positive phase of the North Atlantic Oscillation (Fu et al., 2023). While combining records from ocean reanalyses (Jackson et al., 2018; Baker et al., 2022, 2023) and direct observations from the RAPID array (Moat et al., 2023) monitoring of the AMOC can be established from 1993 onwards (Fig. 11). The results clearly visualize the challenge of detecting any long-term change of AMOC as discussed in Box 1, as records show large uncertainties and are dominated by large interannual to decadal-scale variations over a period that is too short to capture any eventual slowdown in the AMOC strength.
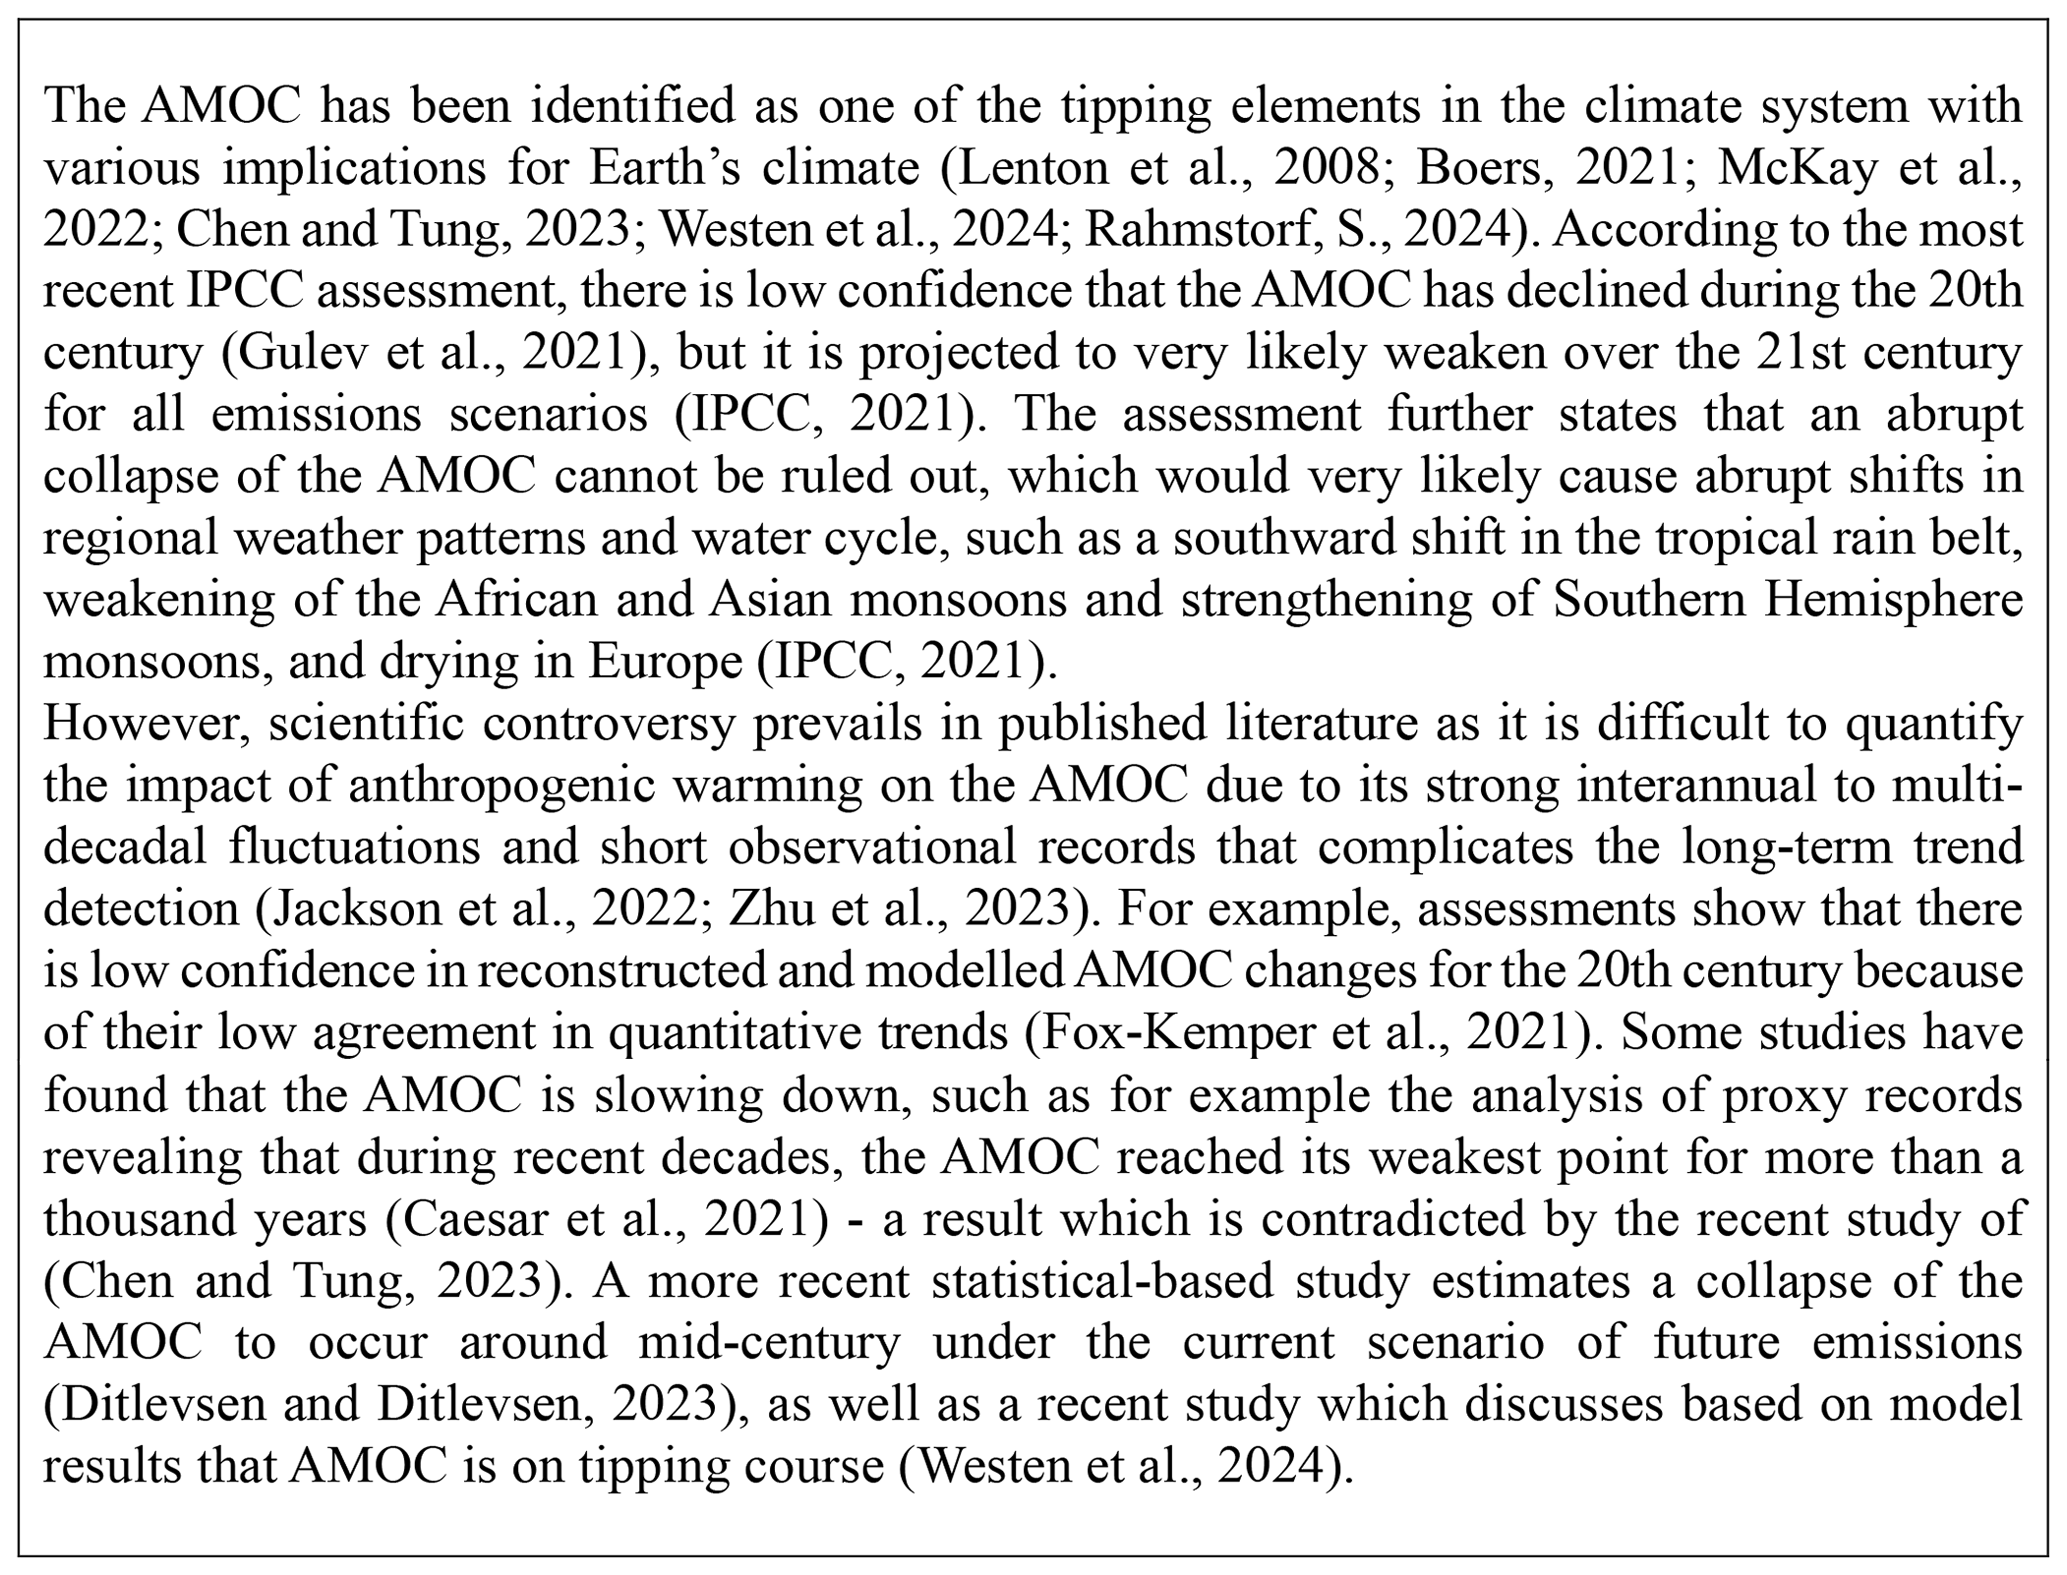
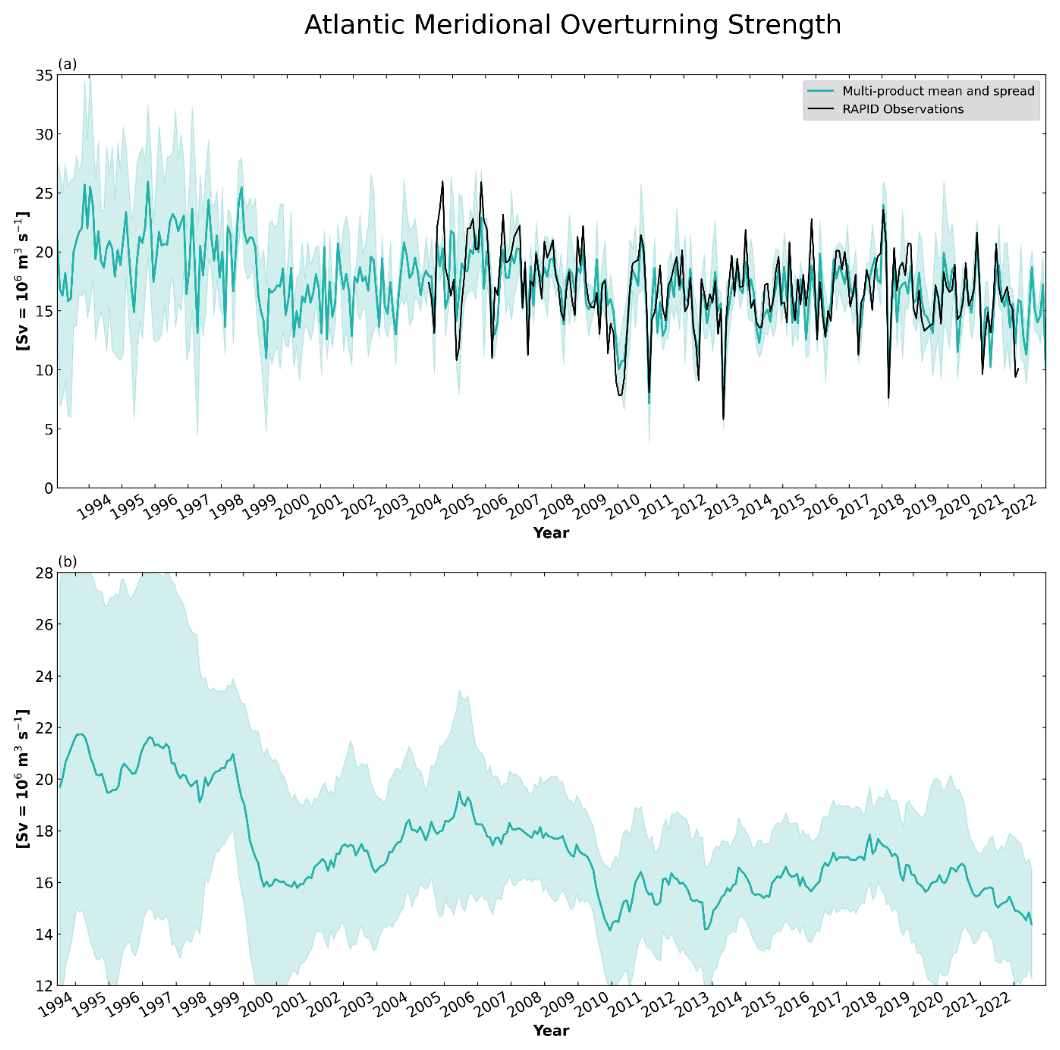
Figure 11Temporal evolution of the Atlantic Meridional Overturning Circulation (AMOC) strength at 26.5° N obtained by integrating the meridional transport at 26.5° N across the Atlantic basin (zonally) and then cumulatively integrating over depth. Its maximum value in depth is then taken as the strength in Sverdrups (Sv = 1×10⁶ m3 s−1). The green line and shading (2 times the standard deviation) are based on product ref. OV.2 computed from product ref. OHC.8. The black line shows the observational record from the RAPID array (Moat et al., 2023). Panel (a) shows monthly mean values, and panel (b) shows interannual variations by applying a 12-month running mean.
3.1 Marine heatwaves
A marine heatwave (MHW) is commonly defined as a period of at least 5 consecutive days of anomalously warm sea surface temperatures exceeding the 90th climatological percentile threshold (Hobday et al., 2016). In other words, it is seen as an extreme event during which a given region heats way past its regular range of temperature variations. The regular range of variations is defined in practice over a reference period (here 1993–2016), which is discussed as a sensible choice (Amaya et al., 2023). Marine heatwaves are globally observed and are emerging as important stressors to marine ecosystems at the individual, collective, and community levels, also including coral reefs and seagrass beds (Welch et al., 2023; Smith et al., 2023; Wakelin et al., 2021; Marba and Duarte, 2010). They can trigger the migration of species and mass extinctions and lead to significant economic losses in fisheries and aquaculture (Garrabou et al., 2022; Smith et al., 2023; Oliver et al., 2019; Holbrook et al., 2022).
The frequency, duration, and intensity of marine heatwaves have increased over the past decades under global warming (Peal et al., 2023; Yao et al., 2022; Oliver et al., 2019; IPCC, 2021). The fraction of the global ocean surface that did not experience any MHW event over the year has increased from about 50 % in the 1980s to about 80 % in the most recent years (Fig. 12). The ocean surface fraction affected by strong MHW events has doubled since 2008, from about 20 % to 40 % in recent years, and severe and extreme marine heatwave events also show positive trends in terms of surface extent over the same period. However, the positive trend of extreme marine heatwave events is dampened when excluding sea-ice-covered regions from the computation (Fig. 12), while the impact on other marine heatwave categories is minor (not shown). In these regions, the marine heatwave detections may be less optimal and may require further scientific evaluations and refinements both in terms of sea surface temperature data (Vazquez-Cuervo et al., 2022; Castro et al., 2023) and marine heatwave detection methodology (Hu et al., 2020; Huang et al., 2021). The yearly averaged maximum duration of marine heatwave events doubled between 2008 and 2023 (from 20 to about 40 d), while it was relatively stable from 1982 to the mid-2000s (Fig. 12). The global ocean surface fraction affected by marine heatwave events lasting more than 1 month experienced a 5-fold increase between the mid-2000s (about 12 %) and 2023 (55 %). Similar results are obtained for the marine heatwave durations when excluding the sea-ice-covered regions.
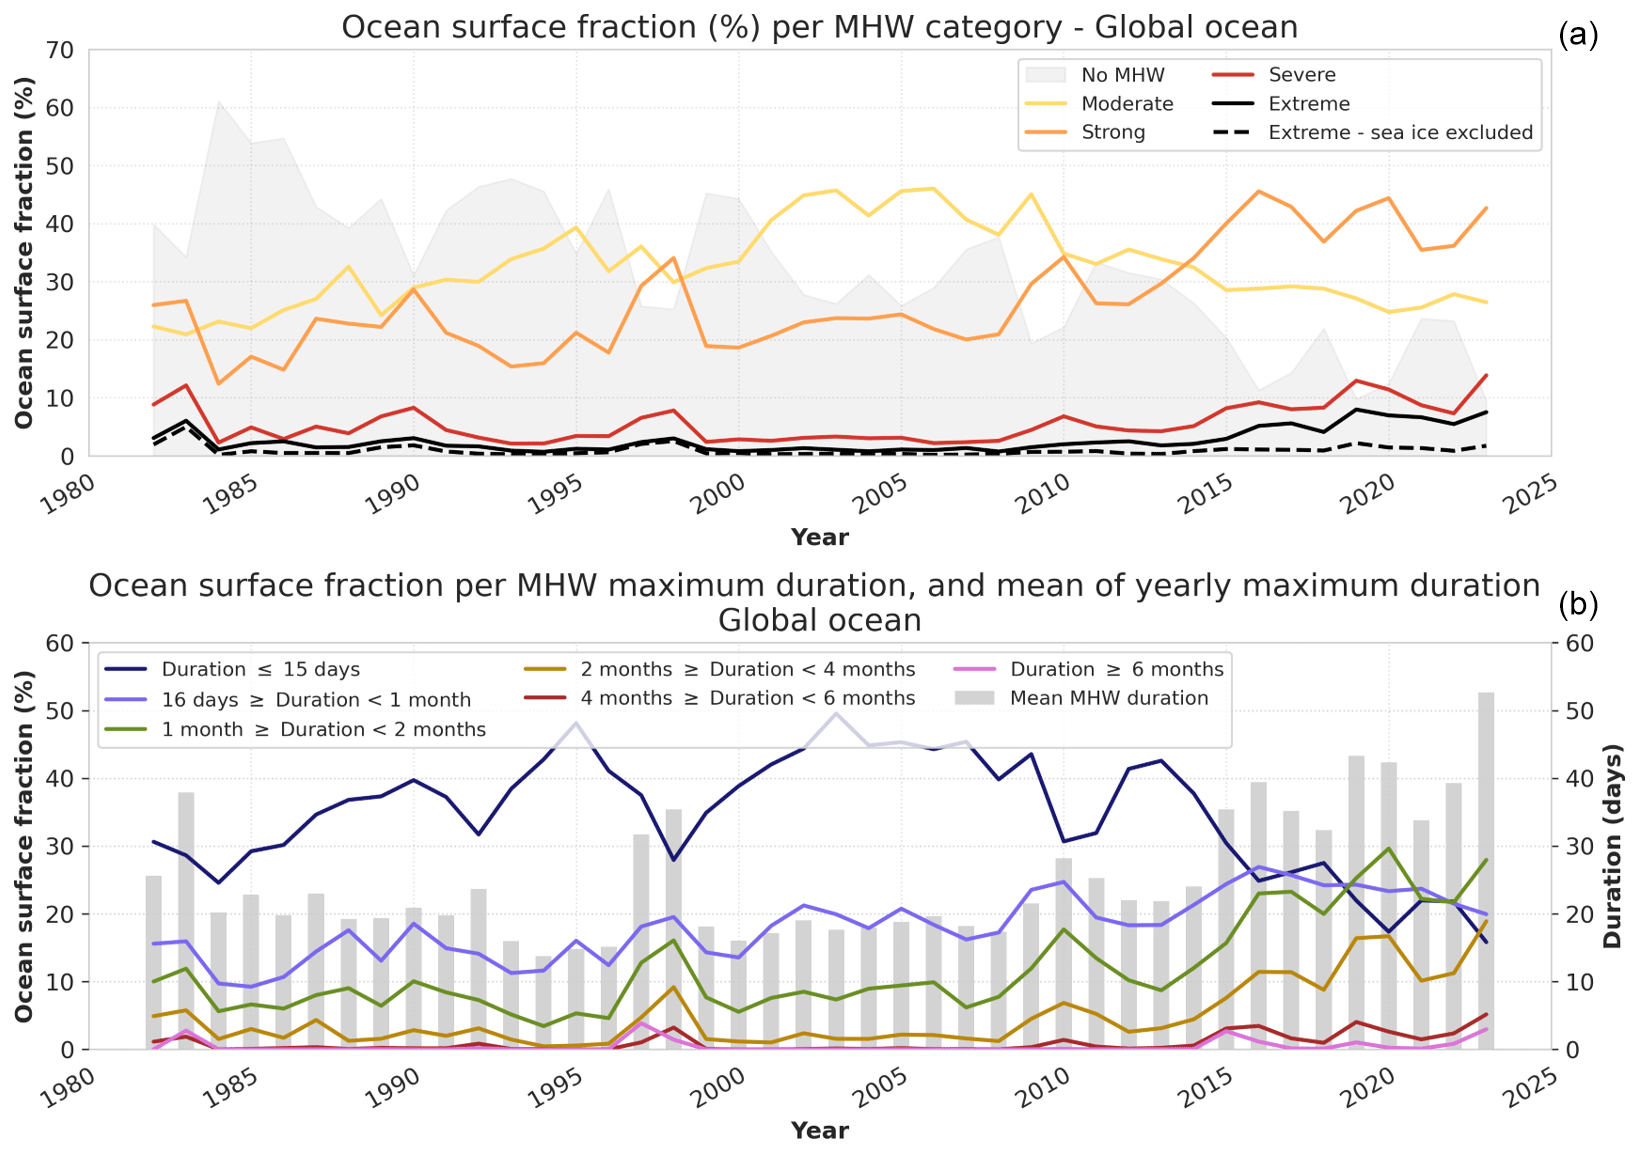
Figure 12(a) Percentage of global ocean surface where the maximum MHW category detected was moderate, strong, severe, or extreme (Hobday et al., 2016), or there was no MHW. The dashed black line shows the same information for extreme categories when excluding sea ice regions from the computation (see Fig. 14 for sea ice mask applied, minor impact for the other categories). These ocean fraction estimates are done following the same method as Hobday et al. (2018). (b) Percentage of global ocean surface where the maximum MHW duration was within a given period (lines) and yearly mean of maximum MHW durations (bars). The method of Hobday et al. (2016) is used and is derived from the products ref. SST.1 and SST.2.
These results also highlight the interannual variability of marine heatwave events and the major role of climate drivers such as ENSO, as larger fractions of the global ocean tend to experience marine heatwave events during El Niño years and smaller regions during La Niña periods (Oliver et al., 2019) (Fig. 13). Larger fractions of the ocean were affected by strong and severe marine heatwave events during the strong El Niño years (1982–1983, 1997–1998, 2010, 2015–2016), and the yearly averaged maximum marine heatwave duration was also larger for these years (Fig. 12).
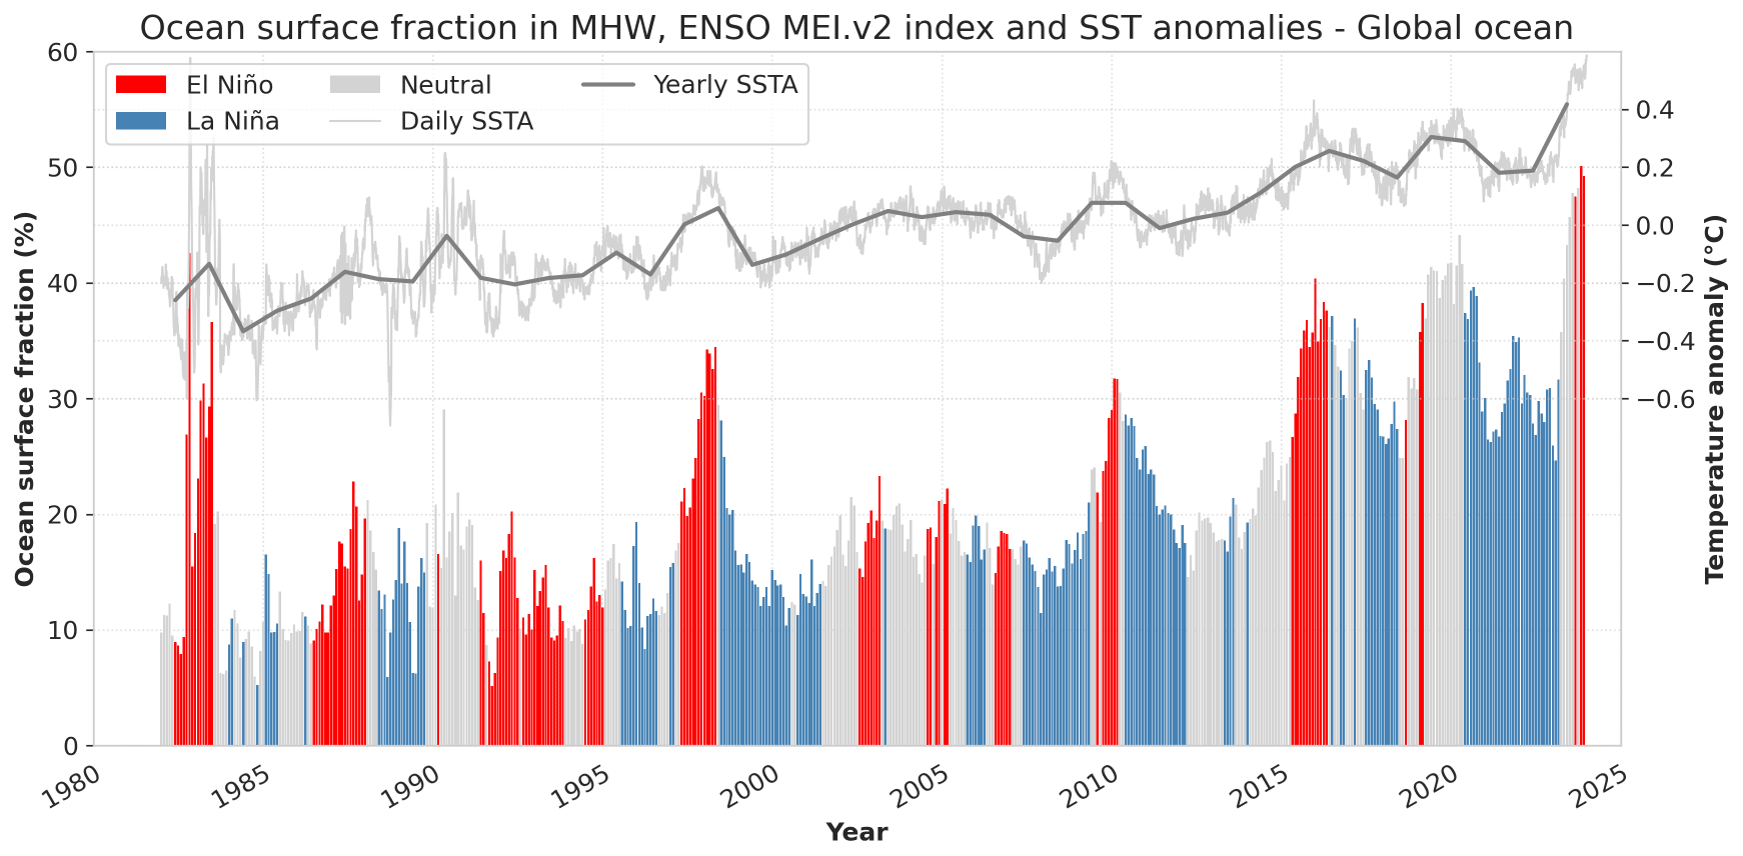
Figure 13Upper plot: globally averaged daily (light line) and annual (bold line) SST anomalies (reference period 1993–2016) from products ref. SST.1 and SST.2. Bottom plot: the amplitude of the bars shows the percentage of global ocean surface where MHW were detected. The colours of the bars correspond to the ENSO MEI.v2 (multivariate) index values (red for El Niño conditions when MEI ≥0.5, blue for La Niña conditions when MEI , and grey for neutral conditions when MEI is between −0.5 and 0.5 (product ref. SST.5)). The evaluation of this MHW indicator is done following the method of Hobday et al. (2016) and is derived from the products ref. SST.1 and SST.2.
In 2022, 74 % of the global ocean experienced a marine heatwave, whatever its category, and large areas were affected by strong (34 %) or even severe (7 %) and extreme (5 %) marine heatwaves (Table 2). For 28 % of the ocean surface, the maximum marine heatwave category detected in 2022 was moderate. These numbers are on the order of those obtained by Peal et al. (2023). The most persistent and most prominent feature for marine heatwaves, lasting over a period of 6 months and longer, temporarily related to severe and extreme categories, occurred in the Coral Sea, also affecting waters off northeast Australia and the Melanesian Pacific island states (Fig. 14). Marine heatwaves lasting more than 4 months in 2022 and reaching up to severe and extreme categories are reported for the central subtropical Pacific, the South Atlantic, and the western Mediterranean Sea.
Table 2Percentage of global ocean surface hit by a MHW event in 2022 and 2023, depending on the category. The second column provides the same information but considering the global ocean without the sea-ice-covered regions (see Fig. 14 for sea ice mask applied). These ocean fraction estimates are done following the same method as Hobday et al. (2018).
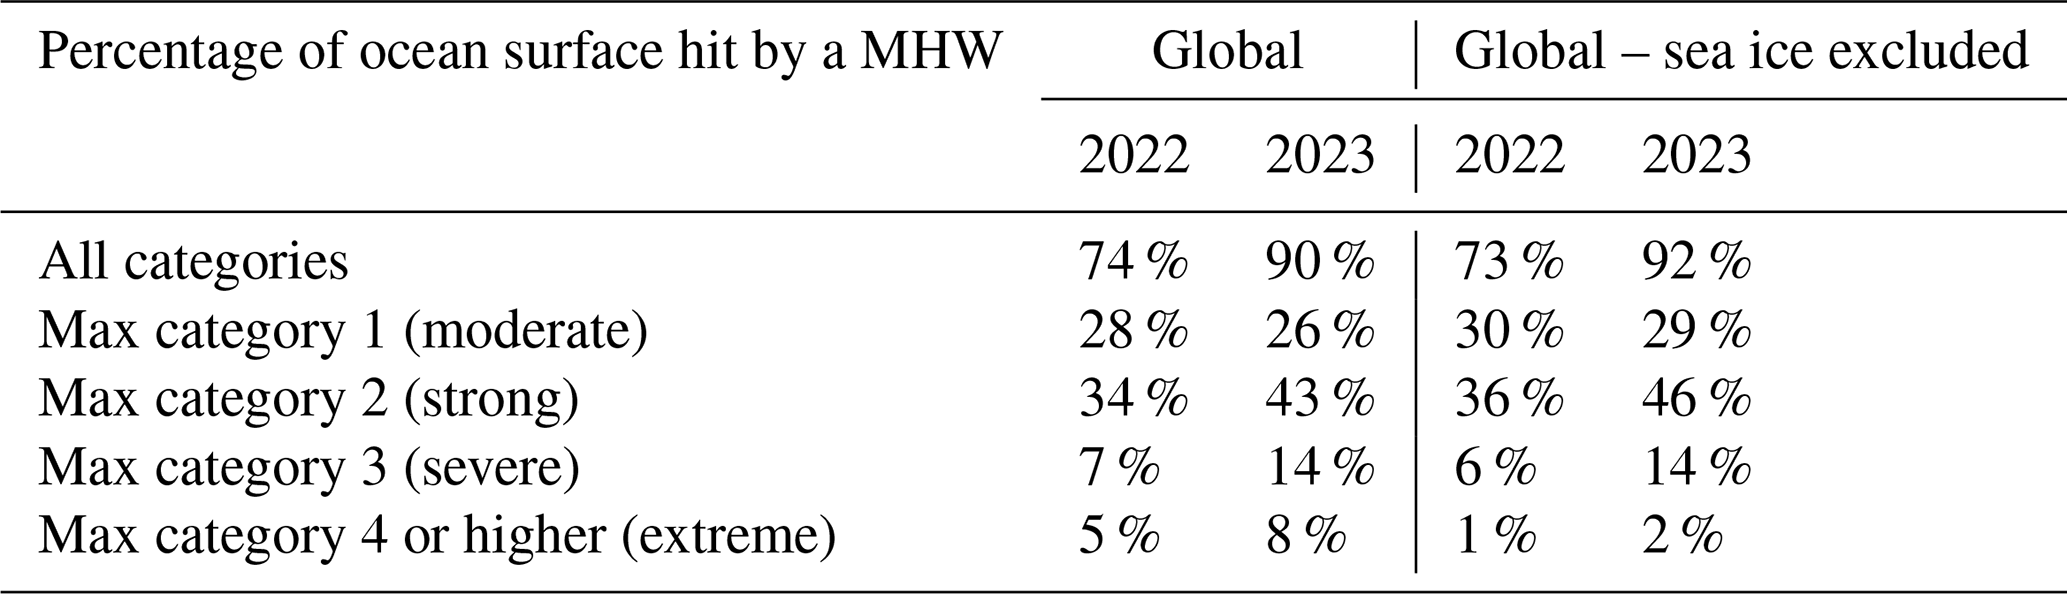
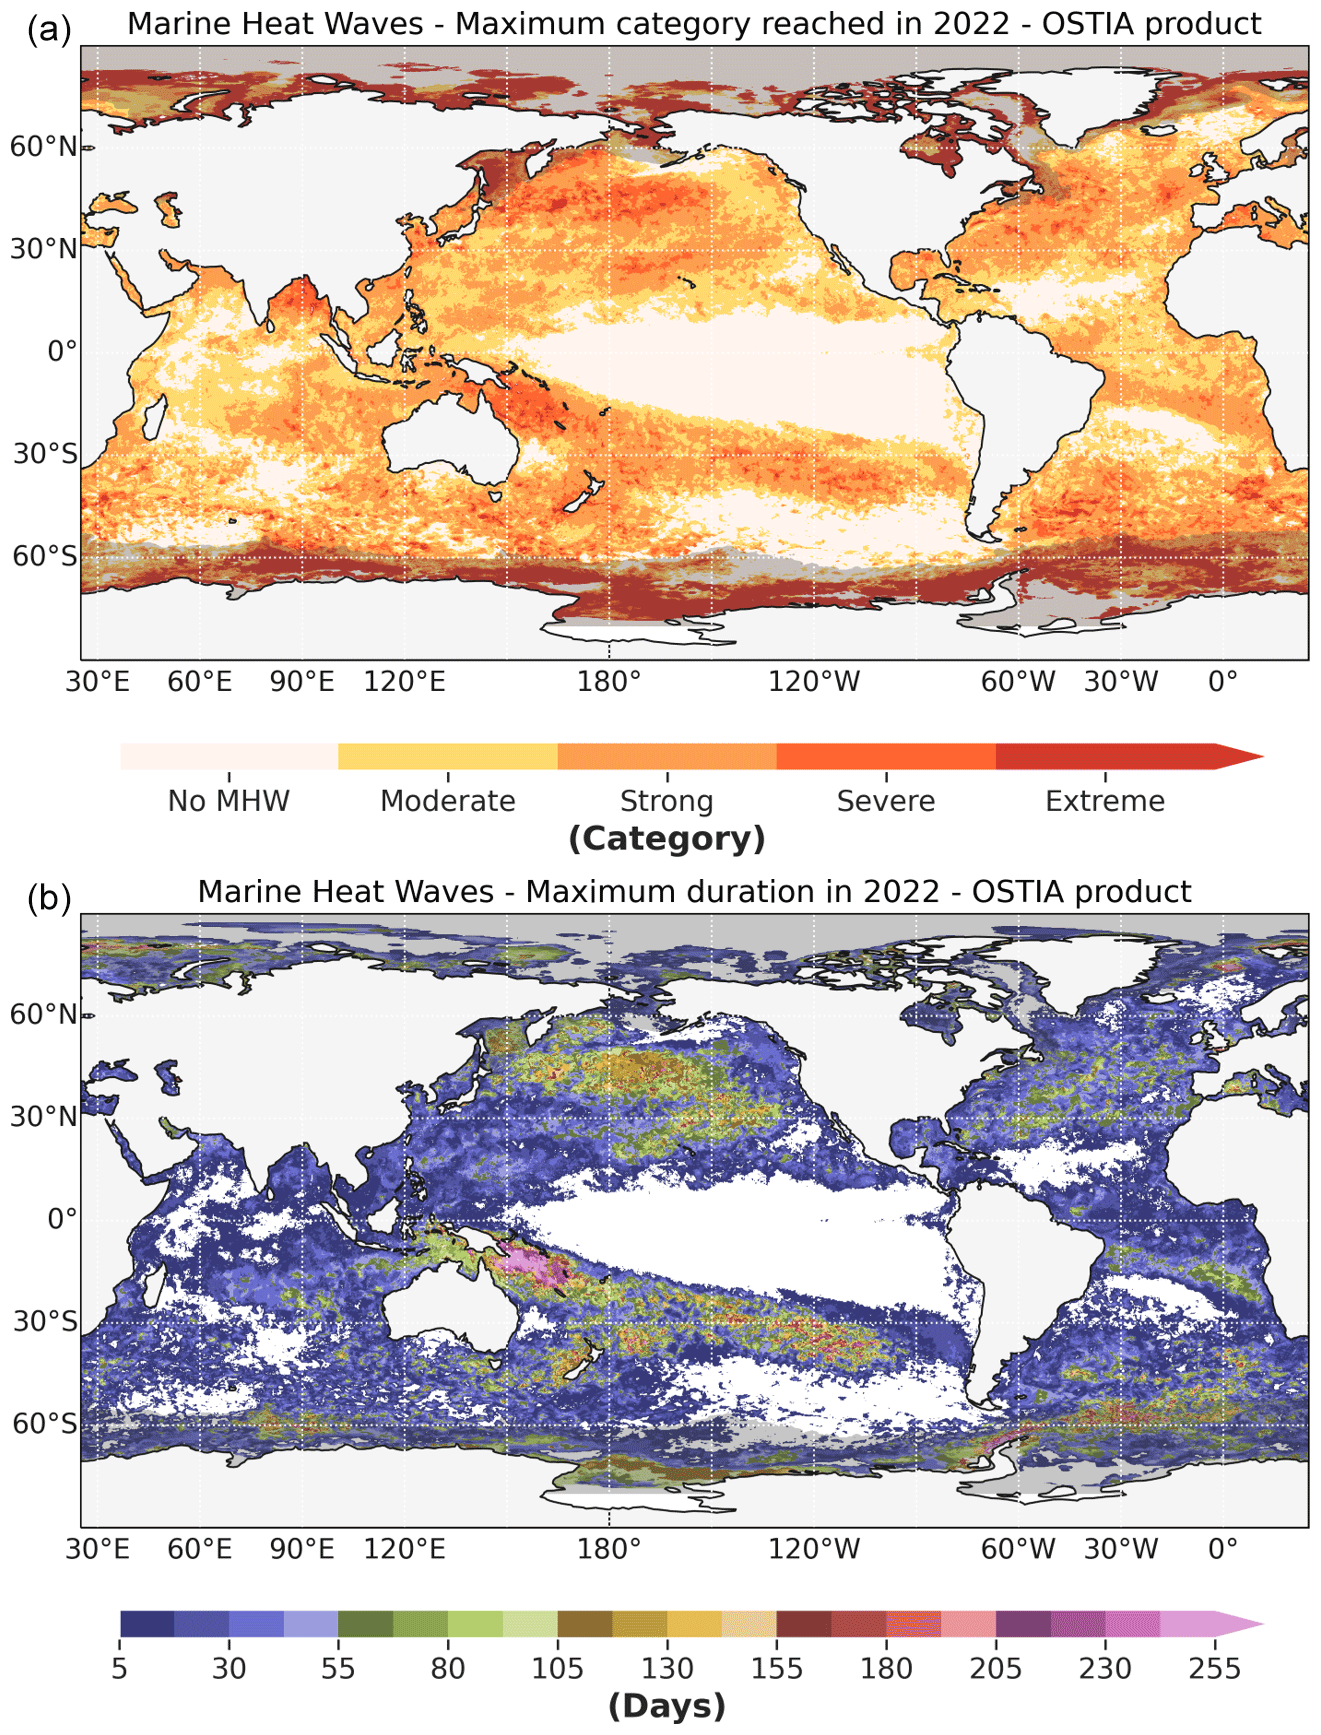
Figure 14(a) Maximum category of marine heatwave reached in 2022 and (b) maximum duration of marine heatwave events in 2022. The evaluation of this indicator is done following the method of Hobday et al. (2016) and is derived from the products ref. SST.1 and SST.2. The areas shaded in grey correspond to regions where there was at least 1 d of sea ice (sea ice concentration larger than 0.15 in the product ref. SST.1) during the climatological reference period (1993–2016), implying potentially less accurate marine heatwave detections (see text for more details).
In 2023, 90 % of the global ocean surface was hit by at least one marine heatwave event. This increase compared to 2022 is mainly due to evolving El Niño conditions in winter 2023 and to particularly warm surface waters in the North Atlantic Ocean. For 26 % of the ocean surface, the maximum marine heatwave category detected was moderate. Larger areas were affected by strong (43 %), severe (14 %), and extreme (8 %) marine heatwaves. The regions that experienced the most prominent marine heatwave events in 2023, lasting more than 6 months and reaching up to severe and extreme categories, include (Fig. 15) the following:
-
the tropical Pacific, driven by the emerging 2023–2024 El Niño event;
-
off the coast of Peru and linked to the so-called “coastal El Niño”;
-
the northern tropical Atlantic Ocean;
-
the Southern Ocean poleward of 40° S, with large areas of extreme category in the Atlantic and Pacific.
Areas where most prominent marine heatwaves lasted 3 to 6 months and reached up to extreme and severe categories include the following:
-
the southern tropical Indian Ocean;
-
the northern tropical Atlantic up to the coast of Europe and central America;
-
the central northern subpolar Pacific;
-
the Arctic Ocean, particularly in the Kara, Beaufort, Lincoln, and East Siberian seas.
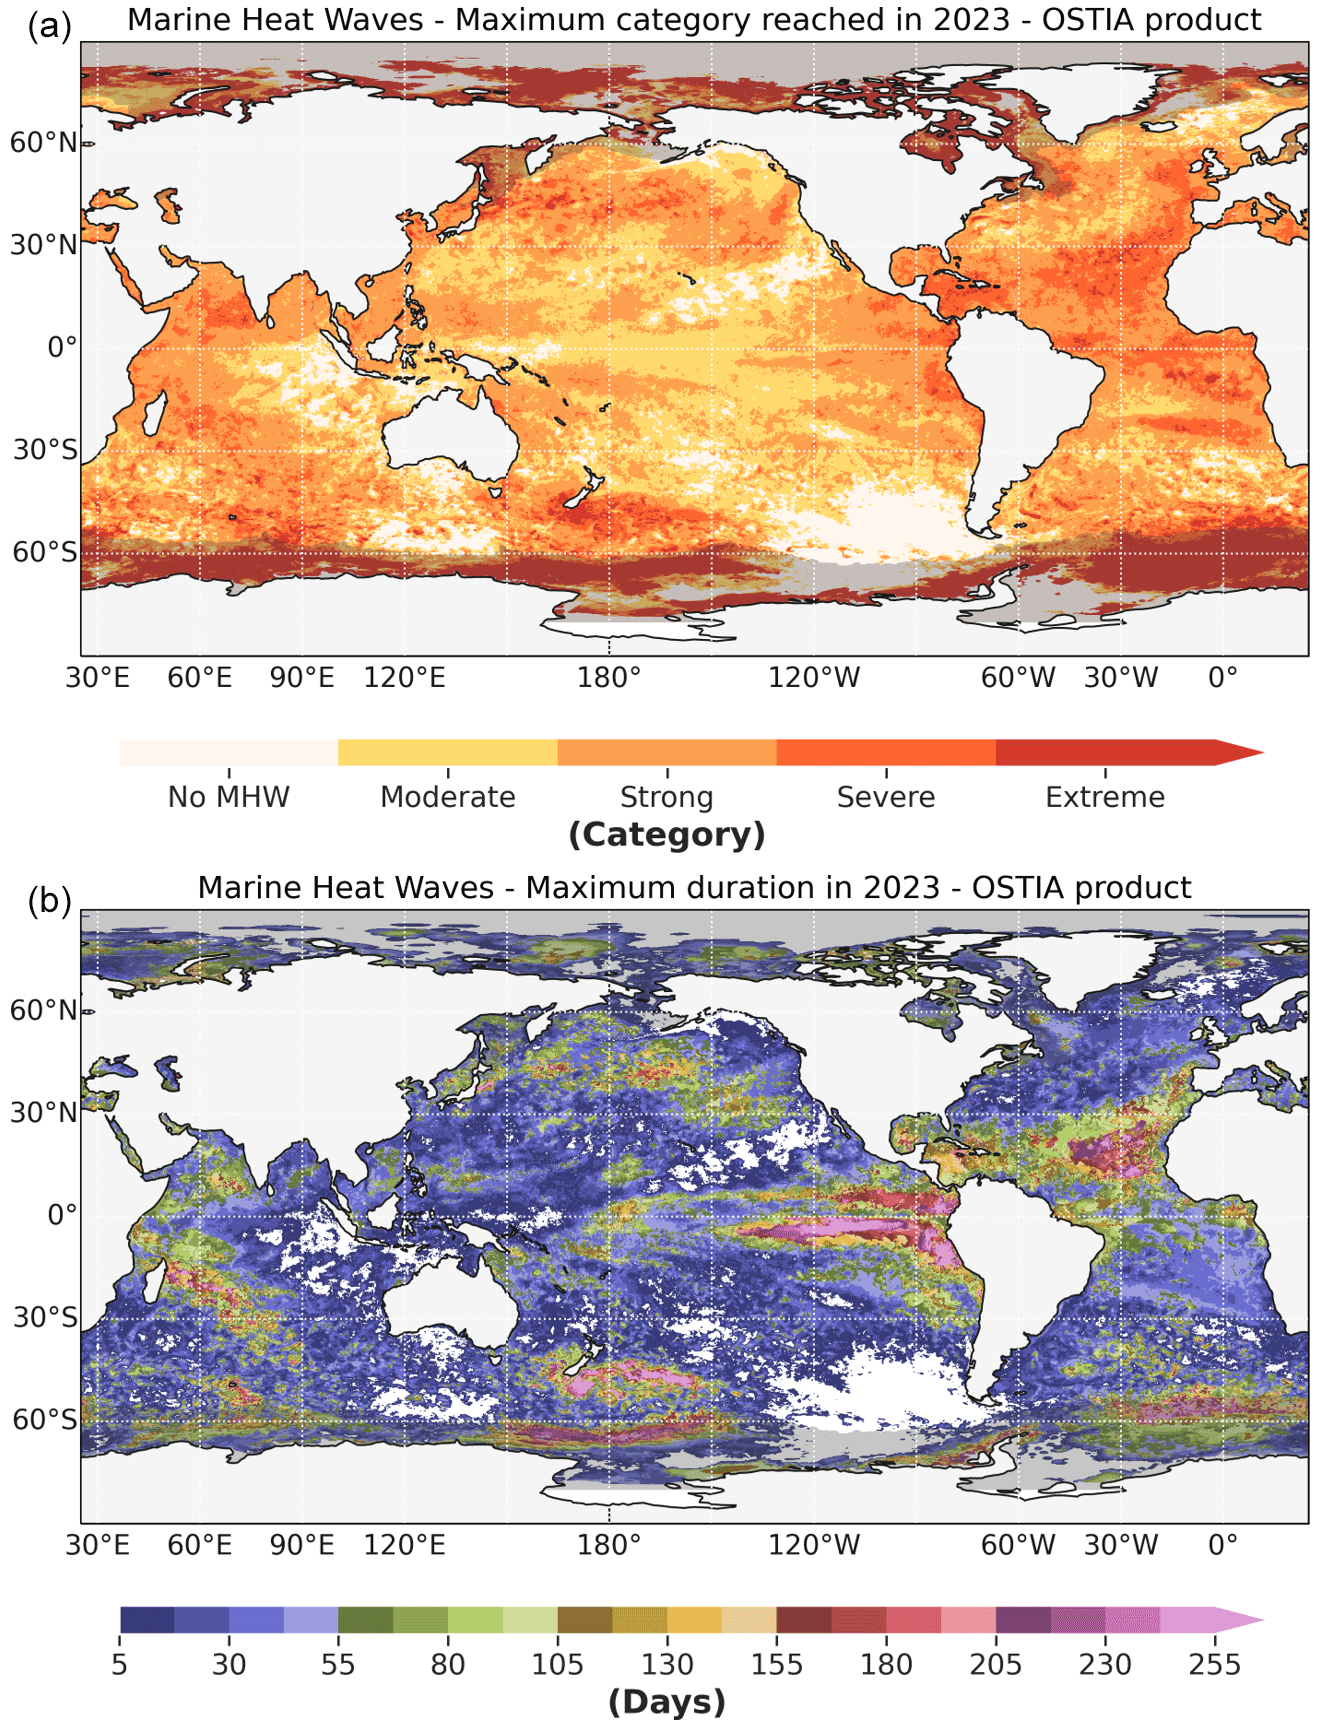
Figure 15Same as Fig. 14 but for the year 2023.
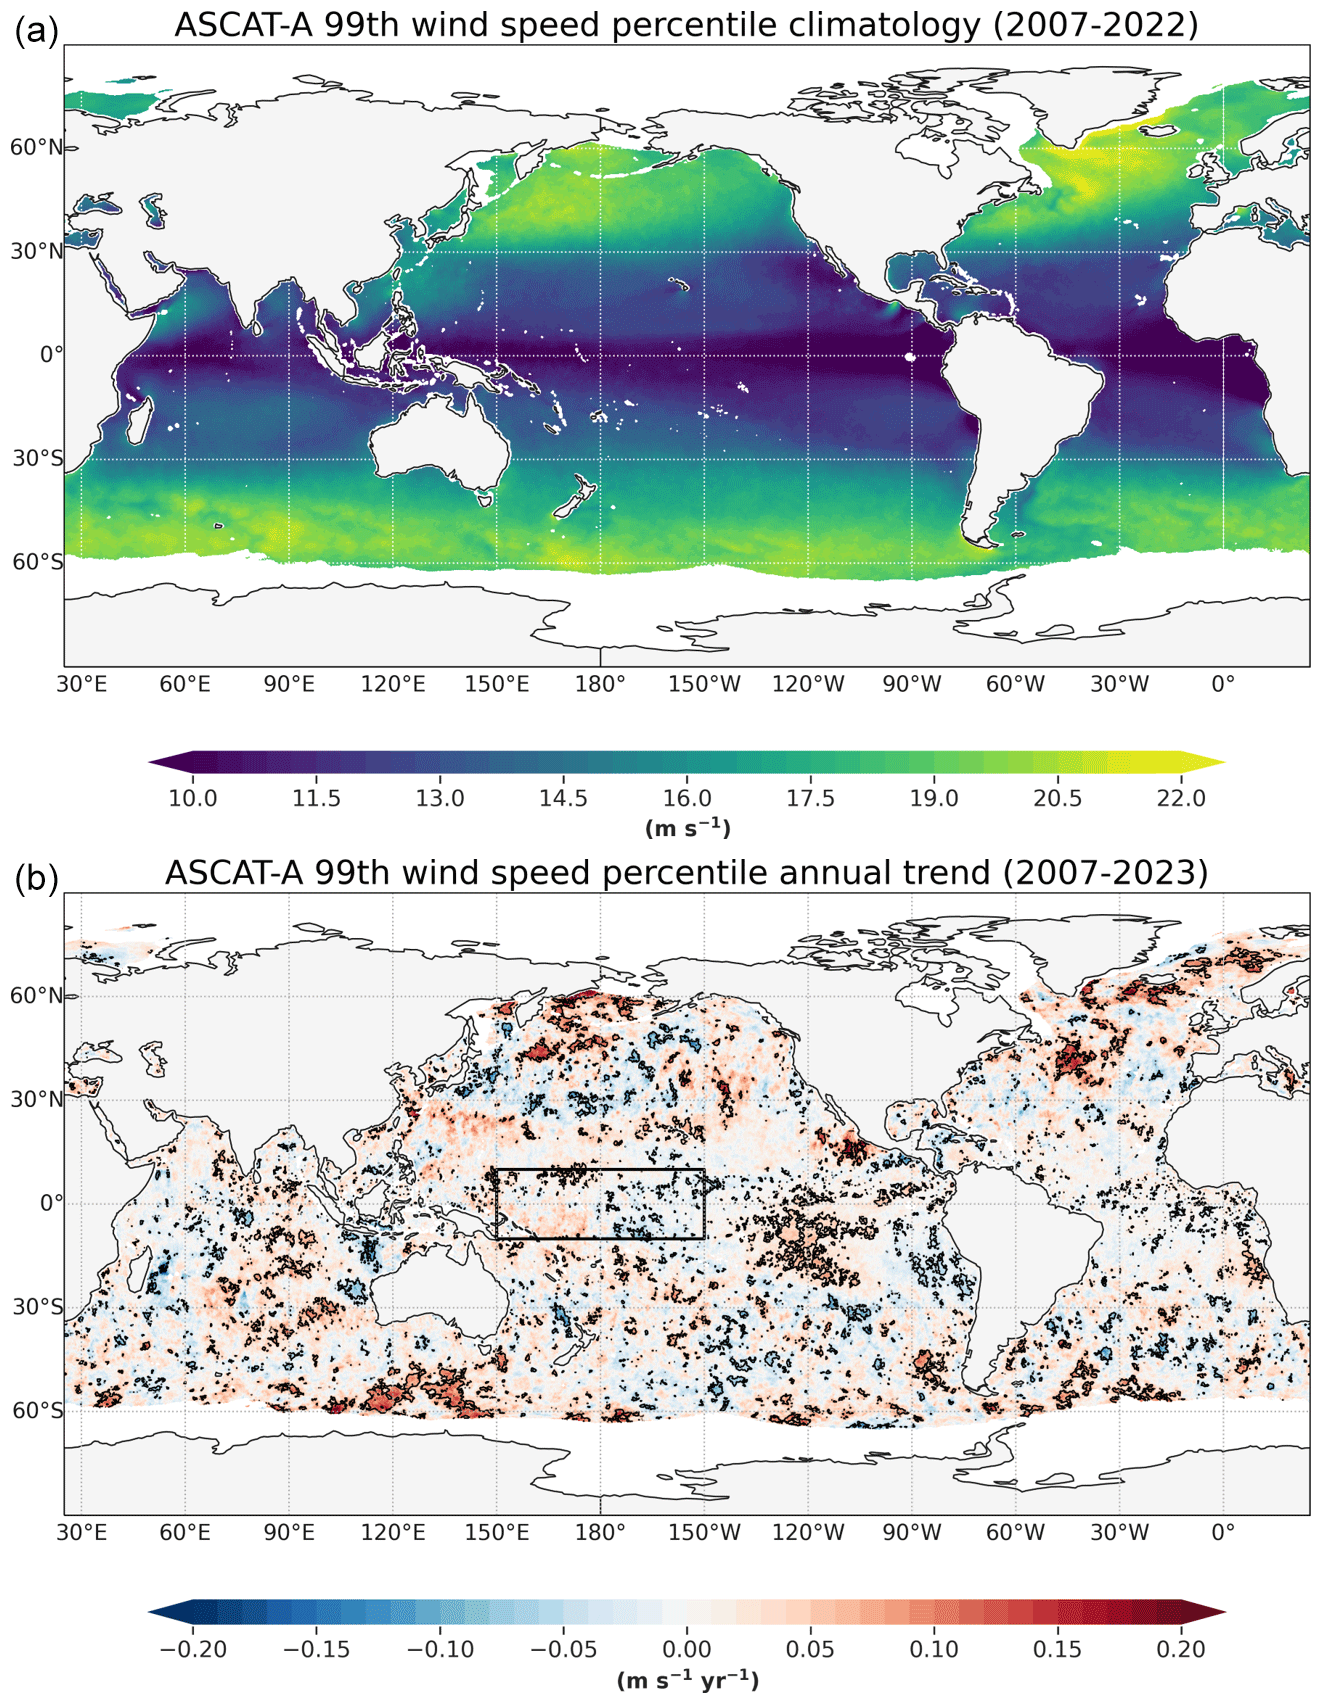
Figure 16The 99th wind speed percentile. (a) Climatology (2007–2022) and (b) annual trend (2007–2023). Areas with trends significant above the 90 % confidence level are outlined in black. Computation at 0.25° resolution from product ref. Wind.1 (ASCAT-A) following the method of Giesen and Stoffelen (2022). The black box shows the region used in Fig. 17.
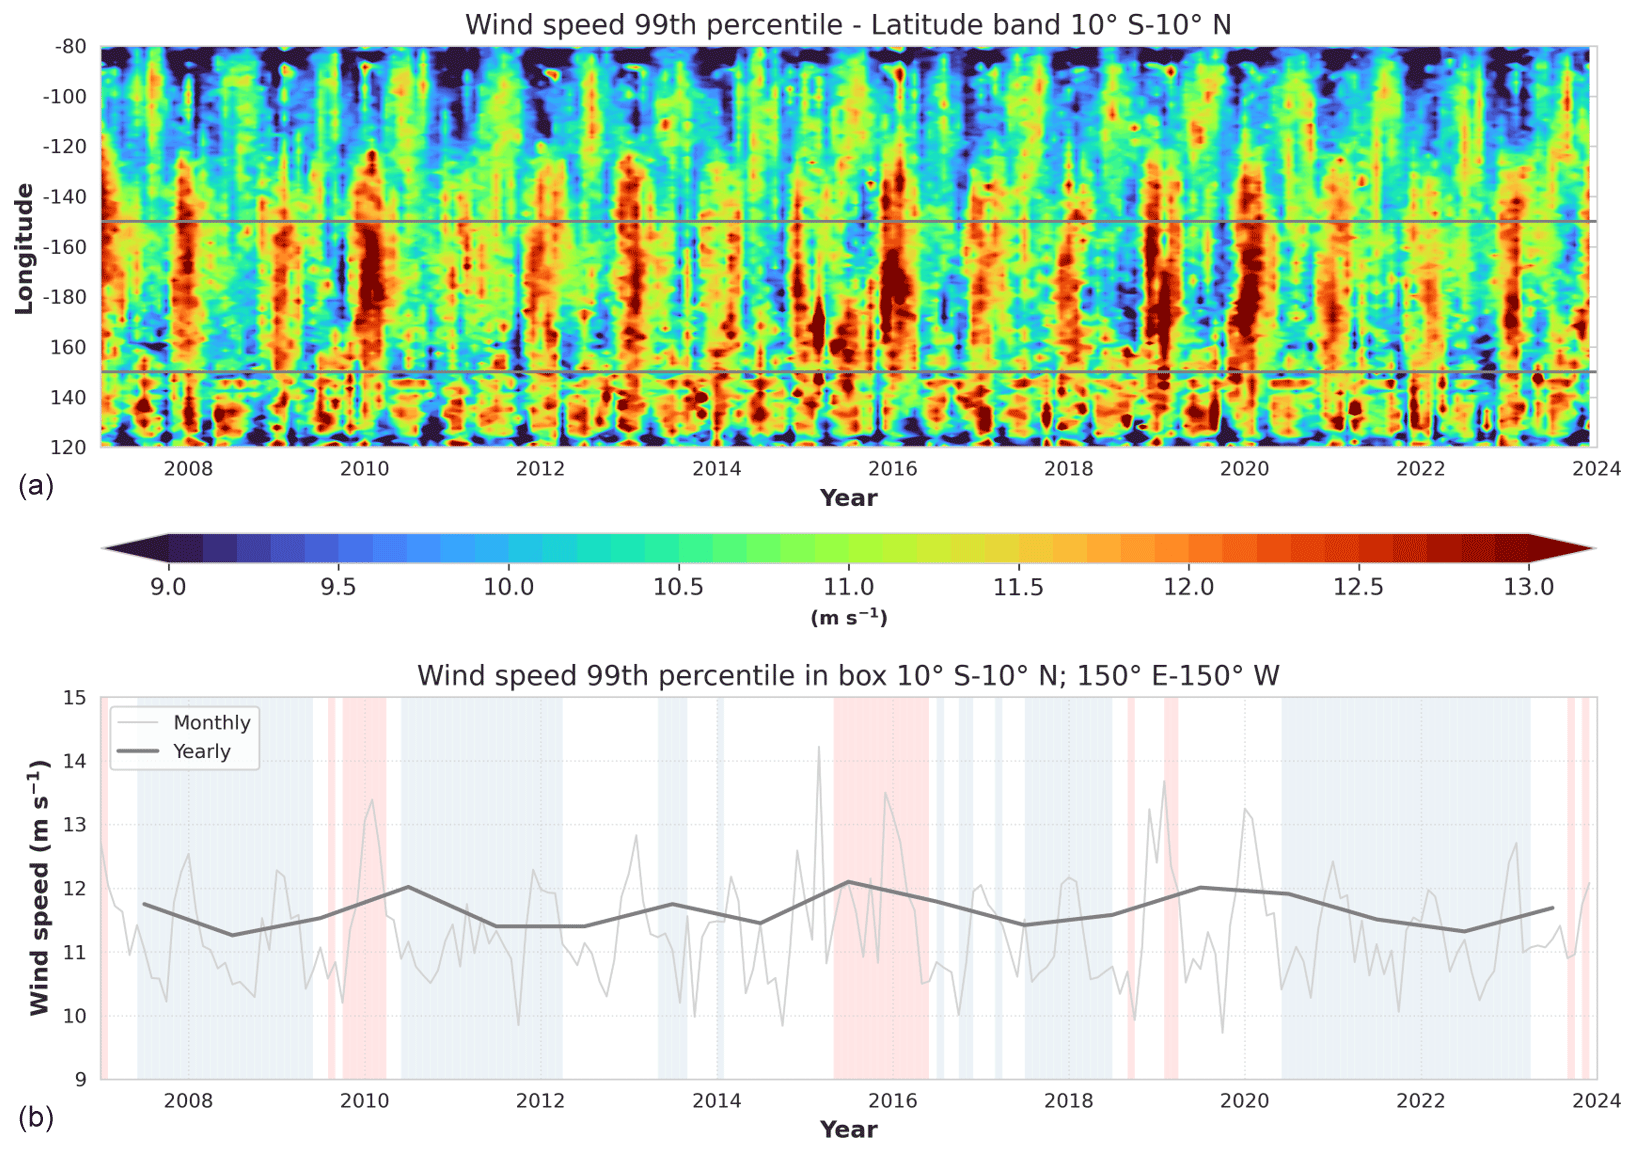
Figure 17(a) Monthly wind speed 99th percentile from product ref. Wind.1 (ASCAT-A) between latitudes 10° S and 10° N in the western tropical Ocean (see box in Fig. 16), presented as a function of longitude and time. The horizontal grey lines show the longitudes 150° E and 150° W. (b) Time series of monthly and yearly wind speed 99th percentile from product ref. Wind.1 (ASCAT-A) for the box shown in Fig. 16. The shading corresponds to the ENSO MEI.v2 index values: red for El Niño conditions when MEI ≥0.5, blue for La Niña conditions when MEI , and white for neutral conditions (product ref. SST.5).
3.2 Wind extremes over the ocean
Extreme wind speeds over the ocean surface and associated stormy weather and rough surface ocean conditions are particularly destructive natural hazards. In coastal regions, the combination of high waves and storm surges can lead to flooding, coastline erosion, coastal water quality degradation, and ecosystem destructions (Sopkin et al., 2014; Harley et al., 2017; Amores et al., 2020; Wetz and Yoskowitz, 2013; González-De Zayas et al., 2021; Bonnington et al., 2023; Patrick et al., 2022; Alvarez-Fanjul et al., 2022; Giesen et al., 2021). Massive rainfall associated with storms can result in inundation and landslides (Negri et al., 2005). The increasing demographic pressure in coastal regions can increase the risks and vulnerability of populations if disaster risk mitigation and reduction practices (e.g. shelters, early-warning systems) are not adopted (Peduzzi et al., 2012; Alvarez-Fanjul et al., 2022; She and Nielsen, 2019; de Alfonso et al., 2020; Giesen et al., 2021). Many economic sectors such as tourism, ports, and fishing can be impacted by extreme coastal events (Verschuur et al., 2023; Kunze, 2021; de Alfonso et al., 2020). In the open ocean, storms and associated high winds and waves can affect offshore infrastructures as well as marine traffic (Mattu et al., 2022; Lam and Lassa, 2016; Staneva et al., 2020).
Regions that have been affected by the most extreme ocean surface wind speeds (>22 m s−1) over the 2007–2022 period (Fig. 16) (Sampe and Xie, 2007; Giesen and Stoffelen, 2022) include the central and subpolar parts of the North Atlantic Ocean, especially the southern tip and eastern coast of Greenland. It should be noted that the values given here are representative of the 1 % highest ocean surface wind speeds (i.e. reported at 99th percentiles). The North Pacific Ocean and the Southern Ocean are the other regions with the strongest extreme wind speeds (>20 m s−1) in the long-term climatology. Extreme wind speeds reach about 13 m s−1 in the tropical bands (10–30° of latitude), while they are low (around or below 10 m s−1) in the equatorial band (0–10° of latitude).
Typically, tropical cyclones are too short-lived and small to be reflected in these numbers. Further analyses are required to address the role of tropical cyclones in affecting the climatological extreme wind speeds, particularly with respect to the percentile method used, and the sensitivity to the spatial resolution of the wind products. Local patterns of extreme wind speeds can also be noted, such as in the Gulf of Tehuantepec, off Mexico in the Pacific Ocean (e.g., Zamudio et al., 2006; Romero-Centeno et al., 2003).
Results from the recent IPCC sixth assessment report reflect the challenge of attributing long-term change in wind extremes explained by the interplay with natural variability, the length of the time series, and uncertainties in the estimates. For example, past changes of maximum wind speeds and other measures of dynamical intensity of extratropical cyclones have been assessed with low confidence (Seneviratne et al., 2021). The report also assessed that tropical and extra-tropical cyclone tracks tend to migrate poleward as the tropical climate zones expand with global warming. However, while none of the observed changes of Category 3–5 tropical cyclone instances can be explained by natural variability alone, their observed increase is assessed as likely. With respect to future evolution, there is high confidence that the proportion of intense tropical cyclones, average peak tropical cyclones wind speeds, and peak wind speeds of the most intense tropical cyclones will increase on the global scale with increasing global warming (Seneviratne et al., 2021).
Due to their spatial and temporal abundance, satellite instruments excel in the monitoring of long-term trends in ocean surface wind extremes (Fig. 16). Analysing long-term trends of extreme wind speeds has revealed several areas of significant increase in extreme wind speeds over the past 16 years (2007–2023) (Fig. 16). However, results are identified to be highly sensitive to methodological approaches and trend periods, challenging the attribution of long-term change and the interplay of natural variability (Giesen and Stoffelen, 2022). The main regions where positive trend features remain stable when addressing different timescales (2007–2020 versus 2007–2023) are the central North Atlantic Ocean Gulf Stream region (30–35° N, 30–50° W), the subpolar Atlantic region between Greenland and south of Iceland, the Bering Sea and the northwest Pacific Ocean, the subtropical Indian Ocean, and the sector of Southern Ocean located south of Australia (Fig. 16b). Decreases in wind speed extremes are also stable in the Tasman Front. However, further analysis, specific detection, and attribution studies, as well as longer time series, are needed in the future for the identification of long-term trends in observed extreme wind speeds.
In some areas, interannual variability such as large-scale climate-mode teleconnections (El Niño–Southern Oscillation/ENSO, North Atlantic Oscillation, Pacific Decadal Oscillation, Indian Ocean Dipole, etc.) are known to affect extreme winds and storminess regimes (Krueger et al., 2019; Roose et al., 2023; Yuan and Cao, 2013; and Lin et al., 2020), as well as their consecutive impacts on the ocean (waves, storm surges) (Holbrook et al., 2020). For example, wind speed extremes in the western tropical Pacific are closely correlated with the ENSO index (Fig. 17), with more extreme wind speeds and longer-lived tropical cyclones during El Niño years (Hu et al., 2017; Eusebi Borzelli and Carniel, 2023; Camargo and Sobel, 2005). A positive trend is detected in this region for the period 2007–2020 in Giesen and Stoffelen (2022) because ENSO was negative (La Niña) in the early years (2007-2008) and positive (El Niño) in 2015–2016 and 2019 (Fig. 17). La Niña conditions in 2020–2022 almost entirely dampened the positive trend in the region when adding the years 2021–2023 to the extreme wind speed trend estimation (Fig. 16b).
In summary, our results indicate that extreme wind speeds over the ocean show regional patterns but likewise are highly variable in space and time. Satellite-based wind observations are the major source for analysis and statistics of extreme wind events over the ocean. In particular, for extreme winds, however, the satellite-based estimates are questionable, and, hence, regular and state-of-the-art in situ monitoring of winds is and will be essential to inform national meteorological and oceanographic services and feed their early-warning systems with accurate and robust information (see for example the WMO Regional Climate Centers: CSIS, 2024).
All codes are available upon request.
All data used are available, and their sources are listed in the Supplement.
The supplement related to this article is available online at: https://doi.org/10.5194/sp-4-osr8-1-2024-supplement.
KvS, LM, MC, FG: conceptualization, methodology, writing (original draft), investigation, supervision, and formal analysis. All authors: writing (review and editing) and data curation.
At least one of the (co-)authors is a member of the editorial board of State of the Planet. The peer-review process was guided by an independent editor, and the authors also have no other competing interests to declare.
Please note that this article has undergone editorial review only.
Publisher's note: Copernicus Publications remains neutral with regard to jurisdictional claims made in the text, published maps, institutional affiliations, or any other geographical representation in this paper. While Copernicus Publications makes every effort to include appropriate place names, the final responsibility lies with the authors.
Abernathey, R. P., Cerovecki, I., Holland, P. R., Newsom, E., Mazloff, M., and Talley, L. D.: Water-mass transformation by sea ice in the upper branch of the Southern Ocean overturning, Nat. Geosci., 9, 596–601, https://doi.org/10.1038/ngeo2749, 2016.
Ablain, M., Jugier, R., Zawadki, L., Taburet, N., Cazenave, A., and Meyssignac, B.: The TOPEX-A drift and impacts on GMSL time series, AVISO Website, https://meetings.aviso.altimetry.fr/fileadmin/user_upload/tx_ausyclsseminar/files/Poster_OSTST17_GMSL_Drift_TOPEX-A.pdf (last access: 11 September 2024), 2017.
Abram, N., Gattuso, J.-P., Prakash, A., Cheng, L., Chidichimo, M. P., Crate, S., Enomoto, H., Garschagen, M., Gruber, N., Harper, S., Holland, E., Kudela, R. M., Rice, J., Steffen, K., and von Schuckmann, K.: Framing and Context of the Report, in: IPCC Special Report on the Ocean and Cryosphere in a Changing Climate, edited by: Pörtner, H.-O., Roberts, D. C., Masson-Delmotte, V., Zhai, P., Tignor, M., Poloczanska, E., Mintenbeck, K., Alegria, A., Nicolai, M., Okem, A., Petzold, J., Rama, B., and Weyer, N. M., Cambridge University Press, Cambridge, UK and New York, NY, USA, 73–129, https://doi.org/10.1017/9781009157964.003, 2019.
Alvarez-Fanjul, E., Pérez Gomez, B., de Alfonso Alonso-Muñoyerro, M., Lorente, P., Garcia Sotillo, M., Lin-Ye, J., Aznar Lecocq, R., Ruiz Gil de la Serna, M., Perez Rubio, S., Clementi, E., Coppini, G., Garcia-Leon, M., Fernandes, M., Garcia Valdecasas, J., Garcia Valdecasas, J. M., Santos Muñoz, D., Luna Rico, M. Y., Mestres, M., Molina, R., Tintoré, J., Mourre, B., Masina, S., Mosso, C., Reyes, E., and Santana, A.: Western Mediterranean record-breaking storm Gloria: An integrated assessment based on models and observations, in: Copernicus Ocean State Report, Issue 6, J. Oper. Oceanogr., 15, s151–s159, https://doi.org/10.1080/1755876X.2022.2095169, 2022.
Amaya, D., Jacox, M. G., Fewings, M. R., Saba, V. S., Stuecker, M. F., Rykaczewski, R. R., Ross, A. C., Stock, C. A., Capotondi, A., Petrik, C. M., Bograd, S. J., Alexander, M. A., Cheng, W., Hermann, A. J., Kearney, K. A., and Powell, B. S.: Marine heatwaves need clear definitions so coastal communities can adapt, Nature, 616, 29–32, https://doi.org/10.1038/d41586-023-00924-2, 2023.
Amores, A., Marcos, M., Carrió, D. S., and Gómez-Pujol, L.: Coastal impacts of Storm Gloria (January 2020) over the north-western Mediterranean, Nat. Hazards Earth Syst. Sci., 20, 1955–1968, https://doi.org/10.5194/nhess-20-1955-2020, 2020.
Armitage, T. W. K., Manucharyan, G. E., Petty, A. A., Kwok, R., and Thompson, A. F.: Enhanced eddy activity in the Beaufort Gyre in response to sea ice loss, Nat. Commun., 11, 761, https://doi.org/10.1038/s41467-020-14449-z, 2020.
Arrigo, K. R., van Dijken, G. L., Castelao, R. M., Luo, H., Rennermalm, Å. K., Tedesco, M., Mote, T. L., Oliver, H., and Yager, P. L.: Melting glaciers stimulate large summer phytoplankton blooms in southwest Greenland waters, Geophys. Res. Lett., 44, 6278–6285, https://doi.org/10.1002/2017GL073583, 2017.
Baker, J., Renshaw, R., Jackson, L., Dubois, C., Iovino, D., and Zuo, H.: Overturning variations in the subpolar North Atlantic in an ocean reanalyses ensemble, in: Copernicus Ocean State Report, Issue 6, J. Oper. Oceanogr., 15, s16–s20, https://doi.org/10.1080/1755876X.2022.2095169, 2022.
Baker, J. A., Renshaw, R., Jackson, L. C., Dubois, C., Iovino, D., Zuo, H., Perez, R. C., Dong, S., Kersalé, M., Mayer, M., Mayer, J., Speich, S., and Lamont, T.: South Atlantic overturning and heat transport variations in ocean reanalyses and observation-based estimates, in: 7th edition of the Copernicus Ocean State Report (OSR7), edited by: von Schuckmann, K., Moreira, L., Le Traon, P.-Y., Grégoire, M., Marcos, M., Staneva, J., Brasseur, P., Garric, G., Lionello, P., Karstensen, J., and Neukermans, G., Copernicus Publications, State Planet, 1-osr7, 4, https://doi.org/10.5194/sp-1-osr7-4-2023, 2023.
Barnoud, A., Pfeffer, J., Guérou, A., Frery, M. L., Siméon, M., Cazenave, A., Chen, J., Llovel, W., Thierry, V., Legeais, J. F., and Ablain, M.: Contributions of Altimetry and Argo to Non-Closure of the Global Mean Sea Level Budget Since 2016, Geophys. Res. Lett., 48, e2021GL092824, https://doi.org/10.1029/2021GL092824, 2021.
Bindoff, N. L., Cheung, W. W. L., Kairo, J. G., Aristegui, J., Guinder, V. A., Hallberg, R., Hilmi, N., Jiao, N., Karim, M. S., Levin, L., O'Donoghue, S., Purca Cuicapusa, S. R., Rinkevich, B., Suga, T., Tagliabue, A., and Williamson, P.: Changing Ocean, Marine Ecosystems, and Dependent Communities, in: IPCC Special Report on the Ocean and Cryosphere in a Changing Climate, edited by: Pörtner, H.-O., Roberts, D. C., Masson-Delmotte, V., Zhai, P., Tignor, M., Poloczanska, E., Mintenbeck, K., Alegria, A., Nicolai, M., Okem, A., Petzold, J., Rama, B., and Weyer, N. M., Cambridge University Press, Cambridge, UK and New York, NY, USA, 447–587, https://doi.org/10.1017/9781009157964.007, 2019.
Bintanja, R., Van Oldenborgh, G. J., Drijfhout, S. S., Wouters, B., and Katsman, C. A.: Important role for ocean warming and increased ice-shelf melt in Antarctic sea-ice expansion, Nat. Geosci., 6, 376–379, https://doi.org/10.1038/ngeo1767, 2013a.
Bintanja, R., Van Oldenborgh, G. J., Drijfhout, S. S., Wouters, B., and Katsman, C. A.: Important role for ocean warming and increased ice-shelf melt in Antarctic sea-ice expansion, Nat. Geosci., 6, 376–379, https://doi.org/10.1038/ngeo1767, 2013b.
Boers, N.: Observation-based early-warning signals for a collapse of the Atlantic Meridional Overturning Circulation, Nat. Clim. Change, 11, 680–688, https://doi.org/10.1038/s41558-021-01097-4, 2021.
Bonnington, A. C., Jamieson, R. C., Smith, K. A., Oliver, A., Johnston, L. H., LeRoux, N. K., Somers, L. D., and Kurylyk, B. L.: Impacts of Extratropical Cyclone Fiona on a sensitive coastal lagoon ecosystem, Limnol. Oceanogr., 68, 2703–2715, https://doi.org/10.1002/LNO.12452, 2023.
Caesar, L., McCarthy, G. D., Thornalley, D. J. R., Cahill, N., and Rahmstorf, S.: Current Atlantic Meridional Overturning Circulation weakest in last millennium, Nat. Geosci., 14, 118–120, https://doi.org/10.1038/s41561-021-00699-z, 2021.
Cai, W., Santoso, A., Collins, M., Dewitte, B., Karamperidou, C., Kug, J. S., Lengaigne, M., McPhaden, M. J., Stuecker, M. F., Taschetto, A. S., Timmermann, A., Wu, L., Yeh, S. W., Wang, G., Ng, B., Jia, F., Yang, Y., Ying, J., Zheng, X. T., Bayr, T., Brown, J. R., Capotondi, A., Cobb, K. M., Gan, B., Geng, T., Ham, Y. G., Jin, F. F., Jo, H. S., Li, X., Lin, X., McGregor, S., Park, J. H., Stein, K., Yang, K., Zhang, L., and Zhong, W.: Changing El Niño–Southern Oscillation in a warming climate, Nat. Rev. Earth Environ.,, 2, 628–644, https://doi.org/10.1038/s43017-021-00199-z, 2021.
Cai, W., Gao, L., Luo, Y., Li, X., Zheng, X., Zhang, X., Cheng, X., Jia, F., Purich, A., Santoso, A., Du, Y., Holland, D. M., Shi, J. R., Xiang, B., and Xie, S. P.: Southern Ocean warming and its climatic impacts, Sci. Bull. (Beijing), 68, 946–960, https://doi.org/10.1016/J.SCIB.2023.03.049, 2023.
Camargo, S. J. and Sobel, A. H.: Western North Pacific Tropical Cyclone Intensity and ENSO, J. Climate, 18, 2996–3006, https://doi.org/10.1175/JCLI3457.1, 2005.
Canadell, J. G., Monteiro, P. M. S., Costa, M. H., da Cunha, L., Cox, P. M., Eliseev, A. V, Henson, S., Ishii, M., Jaccard, S., Koven, C., Lohila, A., Patra, P. K., Piao, S., Rogelj, J., Syampungani, S., Zaehle, S., and Zickfeld, K.: Global Carbon and other Biogeochemical Cycles and Feedbacks, in: Climate Change 2021: The Physical Science Basis. Contribution of Working Group I to the Sixth Assessment Report of the Intergovernmental Panel on Climate Change, edited by: Masson-Delmotte, V., Zhai, P., Pirani, A., Connors, S. L., Péan, C., Berger, S., Caud, N., Chen, Y., Goldfarb, L., Gomis, M. I., Huang, M., Leitzell, K., Lonnoy, E., Matthews, J. B. R., Maycock, T. K., Waterfield, T., Yelekçi, O., Yu, R., and Zhou, B., Cambridge University Press, Cambridge, United Kingdom and New York, NY, USA, 673–816, https://doi.org/10.1017/9781009157896.007, 2021.
Castro, S. L., Wick, G. A., Eastwood, S., Steele, M. A., and Tonboe, R. T.: Examining the Consistency of Sea Surface Temperature and Sea Ice Concentration in Arctic Satellite Products, Remote Sensing, 15, 2908, https://doi.org/10.3390/RS15112908, 2023.
Cavole, L. M., Demko, A. M., Diner, R. E., Giddings, A., Koester, I., Pagniello, C. M. L. S., Paulsen, M. L., Ramirez-Valdez, A., Schwenck, S. M., Yen, N. K., Zill, M. E., and Franks, P. J. S.: Biological impacts of the 2013–2015 warm-water anomaly in the northeast Pacific: Winners, Losers, and the Future, Oceanography, 29, 273–285, https://doi.org/10.5670/OCEANOG.2016.32, 2016.
Cazenave, A. and Moreira, L.: Contemporary sea-level changes from global to local scales: A review, P. Roy. Soc. A-Math. Phy., 478, 20220049, https://doi.org/10.1098/RSPA.2022.0049, 2022.
Centurioni, L. R., Turton, J. D., Lumpkin, R., Braasch, L., Brassington, G., Chao, Y., Charpentier, E., Chen, Z., Corlett, G., Dohan, K., Donlon, C., Gallage, C., Hormann, V., Ignatov, A., Ingleby, B., Jensen, R., Kelly-Gerreyn, B. A., Koszalka, I. M., Lin, X., Lindstrom, E., Maximenko, N., Merchant, C. J., Minnett, P., O'Carroll, A. G., Paluszkiewicz, T., Poli, P., Poulain, P., Reverdin, G., Sun, X., Swail, V., Thurston, S., Wu, L., Yu, L., Wang, B., and Zhang, D.: Global in-situ observations of essential climate and ocean variables at the air-sea interface, Front. Mar. Sci., 6, 433760, https://doi.org/10.3389/FMARS.2019.00419, 2019.
Chen, J., Tapley, B., Wilson, C., Cazenave, A., Seo, K. W., and Kim, J. S.: Global Ocean Mass Change From GRACE and GRACE Follow-On and Altimeter and Argo Measurements, Geophys. Res. Lett., 47, e2020GL090656, https://doi.org/10.1029/2020GL090656, 2020.
Chen, X. and Tung, K. K.: Evidence lacking for a pending collapse of the Atlantic Meridional Overturning Circulation, Nat. Clim. Change, 14, 40–42, https://doi.org/10.1038/s41558-023-01877-0, 2023.
Cheng, L., Trenberth, K. E., Fasullo, J., Boyer, T., Abraham, J., and Zhu, J.: Improved estimates of ocean heat content from 1960 to 2015, Sci. Adv., 3, e1601545, https://doi.org/10.1126/SCIADV.1601545, 2017.
Cheng, L., von Schuckmann, K., Abraham, J. P., Trenberth, K. E., Mann, M. E., Zanna, L., England, M. H., Zika, J. D., Fasullo, J. T., Yu, Y., Pan, Y., Zhu, J., Newsom, E. R., Bronselaer, B., and Lin, X.: Past and future ocean warming, Nat. Rev. Earth Environ., 3, 776–794, https://doi.org/10.1038/s43017-022-00345-1, 2022.
Cheng, L., von Schuckmann, K., Miniére, A., Hakuba, M. Z., Purkey, S., Schmidt, G. A., and Pan, Y.: Ocean heat content in 2023, Nat. Rev. Earth Environ., 5, 232–234, https://doi.org/10.1038/s43017-024-00539-9, 2024.
Ciracì, E., Rignot, E., Scheuchl, B., Tolpekin, V., Wollersheim, M., An, L., Milillo, P., Bueso-Bello, J. L., Rizzoli, P., and Dini, L.: Melt rates in the kilometer-size grounding zone of Petermann Glacier, Greenland, before and during a retreat, P. Natl. Acad. Sci. USA, 120, e2220924120, https://doi.org/10.1073/PNAS.2220924120, 2023.
Coulson, S., Dangendorf, S., Mitrovica, J. X., Tamisiea, M. E., Pan, L., and Sandwell, D. T.: A detection of the sea level fingerprint of Greenland Ice Sheet melt, Science, 377, 1550–1554, https://doi.org/10.1126/SCIENCE.ABO0926, 2022.
CSIS: Climate Services Information System, https://wmo.int/activities/climate-services-information-system, last access: 25 March 2024.
de Alfonso, M., Garcia-Valdecasas, J. M., Aznar, R., Perez-Gomez, B., Rodriguez, P., de los Santos, F. J., and Alvarez-Fanjul, E.: Record wave storm in the Gulf of Cadiz over the past 20 years and its impact on harbours, in: Copernicus Marine Service Ocean State Report, Issue 4, J. Oper. Oceanogr., 13, s137–s144, https://doi.org/10.1080/1755876X.2020.1785097, 2020.
de Steur, L., Sumata, H., Divine, D. V., Granskog, M. A., and Pavlova, O.: Upper ocean warming and sea ice reduction in the East Greenland Current from 2003 to 2019, Communications Earth & Environment, 4, 261, https://doi.org/10.1038/s43247-023-00913-3, 2023.
Ditlevsen, P. and Ditlevsen, S.: Warning of a forthcoming collapse of the Atlantic meridional overturning circulation, Nat. Commun., 14, 4254, https://doi.org/10.1038/s41467-023-39810-w, 2023.
Doney, S. C., Busch, D. S., Cooley, S. R., and Kroeker, K. J.: The Impacts of Ocean Acidification on Marine Ecosystems and Reliant Human Communities, Annual Review of Environment and Resources, 45, 83–112, https://doi.org/10.1146/ANNUREV-ENVIRON-012320-083019, 2020.
Eusebi Borzelli, G. L. and Carniel, S.: Where the winds clash: what is really triggering El Niño initiation?, npj Climate and Atmospheric Science, 6, 119, https://doi.org/10.1038/s41612-023-00445-9, 2023.
Fan, Y., Liu, W., Zhang, P., Chen, R., and Li, L.: North Atlantic Oscillation contributes to the subpolar North Atlantic cooling in the past century, Clim. Dynam., 61, 5199–5215, https://doi.org/10.1007/S00382-023-06847-Y, 2023.
Fasullo, J. T. and Nerem, R. S.: Altimeter-era emergence of the patterns of forced sea-level rise in climate models and implications for the future, P. Natl. Acad. Sci. USA, 115, 12944–12949. https://doi.org/10.1073/pnas.1813233115, 2018.
Forster, P., Storelvmo, T., Armour, K., Collins, W., Dufresne, J.-L., Frame, D., Lunt, D. J., Mauritsen, T., Palmer, M. D., Watanabe, M., Wild, M., and Zhang, H.: The Earth's Energy Budget, Climate Feedbacks and Climate Sensitivity, in: Climate Change 2021: The Physical Science Basis. Contribution of Working Group I to the Sixth Assessment Report of the Intergovernmental Panel on Climate Change, edited by: Masson-Delmotte, V., Zhai, P., Pirani, A., Connors, S. L., Péan, C., Berger, S., Caud, N., Chen, Y., Goldfarb, L., Gomis, M. I., Huang, M., Leitzell, K., Lonnoy, E., Matthews, J. B. R., Maycock, T. K., Waterfield, T., Yelekçi, O., Yu, R., and Zhou, B., Cambridge University Press, Cambridge, United Kingdom and New York, NY, USA, Cambridge, United Kingdom and New York, NY, USA, 923–1054, https://doi.org/10.1017/9781009157896.009, 2021.
Fox-Kemper, B., Hewitt, H. T., Xiao, C., Aðalgeirsdóttir, G., Drijfhout, S. S., Edwards, T. L., Golledge, N. R., Hemer, M., Kopp, R. E., Krinner, G., Mix, A., Notz, D., Nowicki, S., Nurhati, I. S., Ruiz, L., Sallée, J.-B., Slangen, A. B. A., and Yu, Y.: Ocean, Cryosphere and Sea Level Change, in: Climate Change 2021: The Physical Science Basis. Contribution of Working Group I to the Sixth Assessment Report of the Intergovernmental Panel on Climate Change, edited by: Masson-Delmotte, V., Zhai, P., Pirani, A., Connors, S. L., Péan, C., Berger, S., Caud, N., Chen, Y., Goldfarb, L., Gomis, M. I., Huang, M., Leitzell, K., Lonnoy, E., Matthews, J. B. R., Maycock, T. K., Waterfield, T., Yelekçi, O., Yu, R., and Zhou, B., Cambridge University Press, Cambridge, United Kingdom and New York, NY, USA, 1211–1362, https://doi.org/10.1017/9781009157896.011, 2021.
Frajka-Williams, E., Ansorge, I. J., Baehr, J., Bryden, H. L., Chidichimo, M. P., Cunningham, S. A., Danabasoglu, G., Dong, S., Donohue, K. A., Elipot, S., Heimbach, P., Holliday, N. P., Hummels, R., Jackson, L. C., Karstensen, J., Lankhorst, M., Le Bras, I. A., Susan Lozier, M., McDonagh, E. L., Meinen, C. S., Mercier, H., Moat, B. I., Perez, R. C., Piecuch, C. G., Rhein, M., Srokosz, M. A., Trenberth, K. E., Bacon, S., Forget, G., Goni, G., Kieke, D., Koelling, J., Lamont, T., McCarthy, G. D., Mertens, C., Send, U., Smeed, D. A., Speich, S., van den Berg, M., Volkov, D., and Wilson, C.: Atlantic meridional overturning circulation: Observed transport and variability, Front. Mar. Sci., 6, 436930, https://doi.org/10.3389/FMARS.2019.00260, 2019.
Fretwell, P., Pritchard, H. D., Vaughan, D. G., Bamber, J. L., Barrand, N. E., Bell, R., Bianchi, C., Bingham, R. G., Blankenship, D. D., Casassa, G., Catania, G., Callens, D., Conway, H., Cook, A. J., Corr, H. F. J., Damaske, D., Damm, V., Ferraccioli, F., Forsberg, R., Fujita, S., Gim, Y., Gogineni, P., Griggs, J. A., Hindmarsh, R. C. A., Holmlund, P., Holt, J. W., Jacobel, R. W., Jenkins, A., Jokat, W., Jordan, T., King, E. C., Kohler, J., Krabill, W., Riger-Kusk, M., Langley, K. A., Leitchenkov, G., Leuschen, C., Luyendyk, B. P., Matsuoka, K., Mouginot, J., Nitsche, F. O., Nogi, Y., Nost, O. A., Popov, S. V., Rignot, E., Rippin, D. M., Rivera, A., Roberts, J., Ross, N., Siegert, M. J., Smith, A. M., Steinhage, D., Studinger, M., Sun, B., Tinto, B. K., Welch, B. C., Wilson, D., Young, D. A., Xiangbin, C., and Zirizzotti, A.: Bedmap2: improved ice bed, surface and thickness datasets for Antarctica, The Cryosphere, 7, 375–393, https://doi.org/10.5194/tc-7-375-2013, 2013.
Fu, Y., Lozier, M. S., Biló, T. C., Bower, A. S., Cunningham, S. A., Cyr, F., de Jong, M. F., deYoung, B., Drysdale, L., Fraser, N., Fried, N., Furey, H. H., Han, G., Handmann, P., Holliday, N. P., Holte, J., Inall, M. E., Johns, W. E., Jones, S., Karstensen, J., Li, F., Pacini, A., Pickart, R. S., Rayner, D., Straneo, F., and Yashayaev, I.: Seasonality of the Meridional Overturning Circulation in the subpolar North Atlantic, Communications Earth & Environment, 4, 181, https://doi.org/10.1038/s43247-023-00848-9, 2023.
Garcia Molinos, J., Halpern, B. S., Schoeman, D. S., Brown, C. J., Kiessling, W., Moore, P. J., Pandolfi, J. M., Poloczanska, E. S., Richardson, A. J., and Burrows, M. T.: Climate velocity and the future global redistribution of marine biodiversity, Nat. Clim. Change, 6, 83–88, https://doi.org/10.1038/nclimate2769, 2015.
Garrabou, J., Coma, R., Bensoussan, N., Bally, M., Chevaldonné, P., Cigliano, M., Diaz, D., Harmelin, J. G., Gambi, M. C., Kersting, D. K., Ledoux, J. B., Lejeusne, C., Linares, C., Marschal, C., Pérez, T., Ribes, M., Romano, J. C., Serrano, E., Teixido, N., Torrents, O., Zabala, M., Zuberer, F., and Cerrano, C.: Mass mortality in Northwestern Mediterranean rocky benthic communities: effects of the 2003 heat wave, Glob. Change Biol., 15, 1090–1103, https://doi.org/10.1111/j.1365-2486.2008.01823.x, 2009.
Garrabou, J., Gómez-Gras, D., Medrano, A., Cerrano, C., Ponti, M., Schlegel, R., Bensoussan, N., Turicchia, E., Sini, M., Gerovasileiou, V., Teixido, N., Mirasole, A., Tamburello, L., Cebrian, E., Rilov, G., Ledoux, J. B., Souissi, J. Ben, Khamassi, F., Ghanem, R., Benabdi, M., Grimes, S., Ocaña, O., Bazairi, H., Hereu, B., Linares, C., Kersting, D. K., la Rovira, G., Ortega, J., Casals, D., Pagès-Escolà, M., Margarit, N., Capdevila, P., Verdura, J., Ramos, A., Izquierdo, A., Barbera, C., Rubio-Portillo, E., Anton, I., López-Sendino, P., Díaz, D., Vázquez-Luis, M., Duarte, C., Marbà, N., Aspillaga, E., Espinosa, F., Grech, D., Guala, I., Azzurro, E., Farina, S., Cristina Gambi, M., Chimienti, G., Montefalcone, M., Azzola, A., Mantas, T. P., Fraschetti, S., Ceccherelli, G., Kipson, S., Bakran-Petricioli, T., Petricioli, D., Jimenez, C., Katsanevakis, S., Kizilkaya, I. T., Kizilkaya, Z., Sartoretto, S., Elodie, R., Ruitton, S., Comeau, S., Gattuso, J. P., and Harmelin, J. G.: Marine heatwaves drive recurrent mass mortalities in the Mediterranean Sea, Glob. Change Biol., 28, 5708–5725, https://doi.org/10.1111/GCB.16301, 2022.
Gasparin, F., Echevin, V., Mignot, A., Perruche, C., and Drévillon, M.: The 2017 coastal El Niño, in: Copernicus MarineService Ocean State Report, Issue 3, J. Oper. Oceanogr., 12, s117–s119, https://doi.org/10.1080/1755876X.2019.1633075, 2019.
Gattuso, J. P., Magnan, A., Billé, R., Cheung, W. W. L., Howes, E. L., Joos, F., Allemand, D., Bopp, L., Cooley, S. R., Eakin, C. M., Hoegh-Guldberg, O., Kelly, R. P., Pörtner, H. O., Rogers, A. D., Baxter, J. M., Laffoley, D., Osborn, D., Rankovic, A., Rochette, J., Sumaila, U. R., Treyer, S., and Turley, C.: Contrasting futures for ocean and society from different anthropogenic CO2 emissions scenarios, Science, 349, aac4722, https://doi.org/10.1126/SCIENCE.AAC4722, 2015.
Giesen, R. and Stoffelen, A.: Changes in extreme wind speeds over the global ocean, in: Copernicus Ocean State Report, Issue 6, J. Oper. Oceanogr., 15, s8–s15, https://doi.org/10.1080/1755876X.2022.2095169, 2022.
Giesen, R., Clementi, E., Bajo, M., Federico, I., Stoffelen, A., and Santoreli, R.: The November 2019 record high water levels in Venice, Italy, in: Copernicus Marine Service Ocean State Report, Issue 5, J. Oper. Oceanogr., 14, s156–s162, https://doi.org/10.1080/1755876X.2021.1946240, 2021.
Gilbert, E. and Holmes, C.: 2023's Antarctic sea ice extent is the lowest on record, Weather, 79, 46–51, https://doi.org/10.1002/WEA.4518, 2024.
Golledge, N. R., Keller, E. D., Gomez, N., Naughten, K. A., Bernales, J., Trusel, L. D., and Edwards, T. L.: Global environmental consequences of twenty-first-century ice-sheet melt, Nature,, 566, 65–72, https://doi.org/10.1038/s41586-019-0889-9, 2019.
González-De Zayas, R., Merino-Ibarra, M., Lestayo González, J. A., Chaviano-Fernández, Y., Alatorre Mendieta, M. A., Pupo, F. M., and Castillo-Sandoval, F. S.: Biogeochemical responses of a highly polluted tropical coastal lagoon after the passage of a strong hurricane (Hurricane Irma), J. Water Clim. Change, 13, 1089–1105, https://doi.org/10.2166/wcc.2021.178, 2021.
Goosse, H., Kay, J. E., Armour, K. C., Bodas-Salcedo, A., Chepfer, H., Docquier, D., Jonko, A., Kushner, P. J., Lecomte, O., Massonnet, F., Park, H. S., Pithan, F., Svensson, G., and Vancoppenolle, M.: Quantifying climate feedbacks in polar regions, Nat. Commun., 9, 1919, https://doi.org/10.1038/s41467-018-04173-0, 2018.
Gregory, J. M., Griffies, S. M., Hughes, C. W., Lowe, J. A., Church, J. A., Fukimori, I., Gomez, N., Kopp, R. E., Landerer, F., Cozannet, G. Le, Ponte, R. M., Stammer, D., Tamisiea, M. E., and van de Wal, R. S. W.: Concepts and Terminology for Sea Level: Mean, Variability and Change, Both Local and Global, Surv. Geophys., 40, 1251–1289, https://doi.org/10.1007/S10712-019-09525-Z, 2019.
Gruber, N., Clement, D., Carter, B. R., Feely, R. A., van Heuven, S., Hoppema, M., Ishii, M., Key, R. M., Kozyr, A., Lauvset, S. K., Monaco, C. Lo, Mathis, J. T., Murata, A., Olsen, A., Perez, F. F., Sabine, C. L., Tanhua, T., and Wanninkhof, R.: The oceanic sink for anthropogenic CO2 from 1994 to 2007, Science, 363, 1193–1199, https://doi.org/10.1126/SCIENCE.AAU5153, 2019.
Guérou, A., Meyssignac, B., Prandi, P., Ablain, M., Ribes, A., and Bignalet-Cazalet, F.: Current observed global mean sea level rise and acceleration estimated from satellite altimetry and the associated measurement uncertainty, Ocean Sci., 19, 431–451, https://doi.org/10.5194/os-19-431-2023, 2023.
Gulev, S. K., Thorne, P. W., Ahn, J., Dentener, F. J., Domingues, C. M., Gerland, S., Gong, D., Kaufman, D. S., Nnamchi, H. C., Quaas, J., Rivera, J. A., Sathyendranath, S., Smith, S. L., Trewin, B., von Schuckmann, K., and Vose, R. S.: Changing State of the Climate System, in: Climate Change 2021: The Physical Science Basis. Contribution of Working Group I to the Sixth Assessment Report of the Intergovernmental Panel on Climate Change, edited by: Masson-Delmotte, V., Zhai, P., Pirani, A., Connors, S. L., Péan, C., Berger, S., Caud, N., Chen, Y., Goldfarb, L., Gomis, M. I., Huang, M., Leitzell, K., Lonnoy, E., Matthews, J. B. R., Maycock, T. K., Waterfield, T., Yelekçi, O., Yu, R., and Zhou, B., Cambridge University Press, Cambridge, United Kingdom and New York, NY, USA, 287–422, https://doi.org/10.1017/9781009157896.004, 2021.
Gunn, K. L., Rintoul, S. R., England, M. H., and Bowen, M. M.: Recent reduced abyssal overturning and ventilation in the Australian Antarctic Basin, Nat. Clim. Change, 13, 537–544, https://doi.org/10.1038/s41558-023-01667-8, 2023.
Hamlington, B. D., Cheon, S. H., Piecuch, C. G., Karnauskas, K. B., Thompson, P. R., Kim, K. Y., Reager, J. T., Landerer, F. W., and Frederikse, T.: The Dominant Global Modes of Recent Internal Sea Level Variability, J. Geophys. Res.-Oceans, 124, 2750–2768, https://doi.org/10.1029/2018JC014635, 2019.
Hamlington, B. D., Frederikse, T., Nerem, R. S., Fasullo, J. T., and Adhikari, S.: Investigating the Acceleration of Regional Sea Level Rise During the Satellite Altimeter Era, Geophys. Res. Lett., 47, e2019GL086528, https://doi.org/10.1029/2019GL086528, 2020.
Hansen, J., Sato, M., Kharecha, P., and von Schuckmann, K.: Earth's energy imbalance and implications, Atmos. Chem. Phys., 11, 13421–13449, https://doi.org/10.5194/acp-11-13421-2011, 2011.
Hansen, J. E., Sato, M., Simons, L., Nazarenko, L. S., Sangha, I., Kharecha, P., Zachos, J. C., von Schuckmann, K., Loeb, N. G., Osman, M. B., Jin, Q., Tselioudis, G., Jeong, E., Lacis, A., Ruedy, R., Russell, G., Cao, J., and Li, J.: Global warming in the pipeline, Oxford Open Climate Change, 3, kgad008, https://doi.org/10.1093/OXFCLM/KGAD008, 2023.
Harley, M. D., Turner, I. L., Kinsela, M. A., Middleton, J. H., Mumford, P. J., Splinter, K. D., Phillips, M. S., Simmons, J. A., Hanslow, D. J., and Short, A. D.: Extreme coastal erosion enhanced by anomalous extratropical storm wave direction, Scientific Reports, 7, 6033, https://doi.org/10.1038/s41598-017-05792-1, 2017.
Harrison, L. C., Holland, P. R., Heywood, K. J., Nicholls, K. W., and Brisbourne, A. M.: Sensitivity of Melting, Freezing and Marine Ice Beneath Larsen C Ice Shelf to Changes in Ocean Forcing, Geophys. Res. Lett., 49, e2021GL096914, https://doi.org/10.1029/2021GL096914, 2022.
Haumann, F. A., Notz, D., Schmidt, H., Haumann, F. A., Notz, D., and Schmidt, H.: Anthropogenic influence on recent circulation-driven Antarctic sea ice changes, Geophys. Res. Lett., 41, 8429–8437, https://doi.org/10.1002/2014GL061659, 2014.
Haumann, F. A., Gruber, N., Münnich, M., Frenger, I., and Kern, S.: Sea-ice transport driving Southern Ocean salinity and its recent trends, Nature, 537, 89–92, https://doi.org/10.1038/nature19101, 2016.
Hobday, A. J., Alexander, L. V., Perkins, S. E., Smale, D. A., Straub, S. C., Oliver, E. C. J., Benthuysen, J. A., Burrows, M. T., Donat, M. G., Feng, M., Holbrook, N. J., Moore, P. J., Scannell, H. A., Sen Gupta, A., and Wernberg, T.: A hierarchical approach to defining marine heatwaves, Prog. Oceanogr., 141, 227–238, https://doi.org/10.1016/J.POCEAN.2015.12.014, 2016.
Hobday, A. J., Oliver, E. C. J., Gupta, A. Sen, Benthuysen, J. A., Burrows, M. T., Donat, M. G., Holbrook, N. J., Moore, P. J., Thomsen, M. S., Wernberg, T., and Smale, D. A.: Categorizing and naming marine heatwaves, Oceanography, 31, 162–173, https://doi.org/10.5670/OCEANOG.2018.205, 2018.
Holbrook, N. J., Claar, D. C., Hobday, A. J., McInnes, K. L., Oliver, E. C. J., Gupta, A. Sen, Widlansky, M. J., and Zhang, X.: ENSO-Driven Ocean Extremes and Their Ecosystem Impacts, Geoph. Monog. Series, 253, 409–428, https://doi.org/10.1002/9781119548164.CH18, 2020.
Holbrook, N. J., Hernaman, V., Koshiba, S., Lako, J., Kajtar, J. B., Amosa, P., and Singh, A.: Impacts of marine heatwaves on tropical western and central Pacific Island nations and their communities, Glob. Planet. Change, 208, 103680, https://doi.org/10.1016/J.GLOPLACHA.2021.103680, 2022.
Holland, P. R. and Kwok, R.: Wind-driven trends in Antarctic sea-ice drift, Nat. Geosci., 5, 872–875, https://doi.org/10.1038/ngeo1627, 2012.
Holliday, N. P., Bersch, M., Berx, B., Chafik, L., Cunningham, S., Florindo-López, C., Hátún, H., Johns, W., Josey, S. A., Larsen, K. M. H., Mulet, S., Oltmanns, M., Reverdin, G., Rossby, T., Thierry, V., Valdimarsson, H., and Yashayaev, I.: Ocean circulation causes the largest freshening event for 120 years in eastern subpolar North Atlantic, Nat. Commun., 11, 585, https://doi.org/10.1038/s41467-020-14474-y, 2020.
Horwath, M., Gutknecht, B. D., Cazenave, A., Palanisamy, H. K., Marti, F., Marzeion, B., Paul, F., Le Bris, R., Hogg, A. E., Otosaka, I., Shepherd, A., Döll, P., Cáceres, D., Müller Schmied, H., Johannessen, J. A., Nilsen, J. E. Ø., Raj, R. P., Forsberg, R., Sandberg Sørensen, L., Barletta, V. R., Simonsen, S. B., Knudsen, P., Andersen, O. B., Ranndal, H., Rose, S. K., Merchant, C. J., Macintosh, C. R., von Schuckmann, K., Novotny, K., Groh, A., Restano, M., and Benveniste, J.: Global sea-level budget and ocean-mass budget, with a focus on advanced data products and uncertainty characterisation, Earth Syst. Sci. Data, 14, 411–447, https://doi.org/10.5194/essd-14-411-2022, 2022.
Houghton, I. A. and Wilson, J. D.: El Niño Detection Via Unsupervised Clustering of Argo Temperature Profiles, J. Geophys. Res.-Oceans, 125, e2019JC015947, https://doi.org/10.1029/2019JC015947, 2020.
Hu, S., Hu, D., Guan, C., Xing, N., Li, J., and Feng, J.: Variability of the western Pacific warm pool structure associated with El Niño, Clim. Dynam., 49, 2431–2449, https://doi.org/10.1007/S00382-016-3459-Y, 2017.
Hu, S., Zhang, L., and Qian, S.: Marine Heatwaves in the Arctic Region: Variation in Different Ice Covers, Geophys. Res. Lett., 47, e2020GL089329, https://doi.org/10.1029/2020GL089329, 2020.
Hu, Z. Z., Huang, B., Zhu, J., Kumar, A., and McPhaden, M. J.: On the variety of coastal El Niño events, Clim. Dynam., 52, 7537–7552, https://doi.org/10.1007/S00382-018-4290-4, 2019.
Huang, B., Wang, Z., Yin, X., Arguez, A., Graham, G., Liu, C., Smith, T., and Zhang, H. M.: Prolonged Marine Heatwaves in the Arctic: 1982–2020, Geophys. Res. Lett., 48, e2021GL095590, https://doi.org/10.1029/2021GL095590, 2021.
IPCC: Global Warming of 1.5 °C. An IPCC Special Report on the impacts of global warming of 1.5 °C above pre-industrial levels and related global greenhouse gas emission pathways, in the context of strengthening the global response to the threat of climate change, sustainable development, and efforts to eradicate poverty, edited by: Masson-Delmotte, V., Zhai, P., Pörtner, H.-O., Roberts, D., Skea, J., Shukla, P. R., Pirani, A., Moufouma-Okia, W., Péan, C., Pidcock, R., Connors, S., Matthews, J. B. R., Chen, Y., Zhou, X., Gomis, M. I., Lonnoy, E., Maycock, T., Tignor, M., and Waterfield, T., Cambridge University Press, Cambridge, UK and New York, NY, USA, 616 pp., https://doi.org/10.1017/9781009157940, 2018.
IPCC: Summary for Policymakers, in: IPCC Special Report on the Ocean and Cryosphere in a Changing Climate, edited by: Pörtner, H.-O., Roberts, D. C., Masson-Delmotte, V., Zhai, P., Tignor, M., Poloczanska, E., Mintenbeck, K., Alegría, A., Nicolai, M., Okem, A., Petzold, J., Rama, B., and Weyer, N. M., Cambridge University Press, 755 pp., https://doi.org/10.1017/9781009157964, 2019
IPCC: Climate Change 2021: The Physical Science Basis. Contribution of Working Group I to the Sixth Assessment Report of the Intergovernmental Panel on Climate Change, Cambridge University Press, Cambridge, United Kingdom and New York, NY, USA, https://doi.org/10.1017/9781009157896, 2021.
IPCC: Summary for Policymakers, in: Climate Change 2022: Impacts, Adaptation, and Vulnerability. Contribution of Working Group II to the Sixth Assessment Report of the Intergovernmental Panel on Climate Change, edited by: Pörtner, H.-O., Roberts, D. C., Tignor, M., Poloczanska, E. S., Mintenbeck, K., Alegria, A., Craig, M., Langsdorf, S., Löschke, S., Möller, V., Okem, A., and Rama, B., Cambridge University Press, Cambridge, UK and New York, NY, USA, 3–33, https://doi.org/10.1017/9781009325844.001, 2022a.
IPCC: Summary for Policymakers [P.R. Shukla, J. Skea, A. Reisinger, R. Slade, R. Fradera, M. Pathak, A. Al Khourdajie, M. Belkacemi, R. van Diemen, A. Hasija, G. Lisboa, S. Luz, J. Malley, D. McCollum, S. Some, P. Vyas, (eds.)], in: Climate Change 2022: Mitigation of Climate Change. Contribution of Working Group III to the Sixth Assessment Report of the Intergovernmental Panel on Climate Change, edited by: Shuka, P. R., Skea, J., Slade, R., Al Khourdajie, A., van Diemen, R., McCollum, D., Pathak, M., Some, S., Vyas, P., Fradera, R., Belkacemo, M., Hasija, A., Lisboa, G., Luz, S., and Malley, J., Cambridge University Press, Cambridge, UK and New York, NY, USA, 3–48, https://doi.org/10.1017/9781009157926.001, 2022b.
IPCC: Summary for Policymakers, in: Climate Change 2023: Synthesis Report. Contribution of Working Groups I, II and III to the Sixth Assessment Report of the Intergovernmental Panel on Climate Change, edited by: Core Writing Team, Lee, H., and Romero, J., IPCC, Geneva, Switzerland, 1–34, https://doi.org/10.59327/IPCC/AR6-9789291691647.001, 2023.
Jackson, L. C., Kahana, R., Graham, T., Ringer, M. A., Woollings, T., Mecking, J. V., and Wood, R. A.: Global and European climate impacts of a slowdown of the AMOC in a high resolution GCM, Clim. Dynam., 45, 3299–3316, https://doi.org/10.1007/S00382-015-2540-2, 2015.
Jackson, L., Dubois, C., Masina, S., Storto, A., and Zuo, H.: Atlantic Meridional Overturning Circulation, in: Copernicus Marine Service Ocean State Report, Issue 2, J. Oper. Oceanogr., 11, s65–s66, https://doi.org/10.1080/1755876X.2018.1489208, 2018.
Jackson, L. C., Biastoch, A., Buckley, M. W., Desbruyères, D. G., Frajka-Williams, E., Moat, B., and Robson, J.: The evolution of the North Atlantic Meridional Overturning Circulation since 1980, Nat. Rev. Earth Environ., 3, 241–254, https://doi.org/10.1038/s43017-022-00263-2, 2022.
Jahn, A., Holland, M. M., and Kay, J. E.: Projections of an ice-free Arctic Ocean, Nat. Rev. Earth Environ., 5, 164–176, https://doi.org/10.1038/s43017-023-00515-9, 2024.
Jenkins, M. and Dai, A.: The Impact of Sea-Ice Loss on Arctic Climate Feedbacks and Their Role for Arctic Amplification, Geophys. Res. Lett., 48, e2021GL094599, https://doi.org/10.1029/2021GL094599, 2021.
Jenkins, M. T. and Dai, A.: Arctic Climate Feedbacks in ERA5 Reanalysis: Seasonal and Spatial Variations and the Impact of Sea-Ice Loss, Geophys. Res. Lett., 49, e2022GL099263, https://doi.org/10.1029/2022GL099263, 2022.
Kashiwase, H., Ohshima, K. I., Nihashi, S., and Eicken, H.: Evidence for ice-ocean albedo feedback in the Arctic Ocean shifting to a seasonal ice zone, Scientific Reports, 7, 8170, https://doi.org/10.1038/s41598-017-08467-z, 2017.
Kramer, R. J., He, H., Soden, B. J., Oreopoulos, L., Myhre, G., Forster, P. M., and Smith, C. J.: Observational Evidence of Increasing Global Radiative Forcing, Geophys. Res. Lett., 48, e2020GL091585, https://doi.org/10.1029/2020GL091585, 2021.
Krueger, O., Feser, F., and Weisse, R.: Northeast Atlantic Storm Activity and Its Uncertainty from the Late Nineteenth to the Twenty-First Century, J. Climate, 32, 1919–1931, https://doi.org/10.1175/JCLI-D-18-0505.1, 2019.
Kunze, S.: Unraveling the Effects of Tropical Cyclones on Economic Sectors Worldwide: Direct and Indirect Impacts, Environ. Resour. Econ., 78, 545–569, https://doi.org/10.1007/S10640-021-00541-5, 2021.
Lam, J. S. L. and Lassa, J. A.: Risk assessment framework for exposure of cargo and ports to natural hazards and climate extremes, Marit. Policy Manag., 44, 1–15, https://doi.org/10.1080/03088839.2016.1245877, 2016.
Lannuzel, D., Tedesco, L., van Leeuwe, M., Campbell, K., Flores, H., Delille, B., Miller, L., Stefels, J., Assmy, P., Bowman, J., Brown, K., Castellani, G., Chierici, M., Crabeck, O., Damm, E., Else, B., Fransson, A., Fripiat, F., Geilfus, N. X., Jacques, C., Jones, E., Kaartokallio, H., Kotovitch, M., Meiners, K., Moreau, S., Nomura, D., Peeken, I., Rintala, J. M., Steiner, N., Tison, J. L., Vancoppenolle, M., Van der Linden, F., Vichi, M., and Wongpan, P.: The future of Arctic sea-ice biogeochemistry and ice-associated ecosystems, Nat. Clim. Change, 10, 983–992, https://doi.org/10.1038/s41558-020-00940-4, 2020.
Lecomte, O., Goosse, H., Fichefet, T., De Lavergne, C., Barthélemy, A., and Zunz, V.: Vertical ocean heat redistribution sustaining sea-ice concentration trends in the Ross Sea, Nat. Commun., 8, 258, https://doi.org/10.1038/s41467-017-00347-4, 2017.
Lee, S.-K., Lumpkin, R., Gomez, F., Yeager, S., Lopez, H., Takglis, F., Dong, S., Aguiar, W., Kim, D., and Baringer, M.: Human-induced changes in the global meridional overturning circulation are emerging from the Southern Ocean, Commun. Earth Environ., 4, 69, https://doi.org/10.1038/s43247-023-00727-3, 2023.
Legeais, J.-F., Llovel, W., Melet, A., and Meyssignac, B.: Evidence of the TOPEX-A Altimeter Instrumental Anomaly and Acceleration of the Global Mean Sea Level, in: Copernicus Marine Service Ocean State Report, Issue 4, J. Oper. Oceanogr., s77–s82, https://doi.org/10.1080/1755876X.2020.1785097, 2020.
Lenton, T. M., Held, H., Kriegler, E., Hall, J. W., Lucht, W., Rahmstorf, S., and Schellnhuber, H. J.: Tipping elements in the Earth's climate system, P. Natl. Acad. Sci. USA, 105, 1786–1793, https://doi.org/10.1073/PNAS.0705414105, 2008.
Levitus, S., Antonov, J. I., Boyer, T. P., Baranova, O. K., Garcia, H. E., Locarnini, R. A., Mishonov, A. V., Reagan, J. R., Seidov, D., Yarosh, E. S., and Zweng, M. M.: World ocean heat content and thermosteric sea level change (0–2000 m), 1955–2010, Geophys. Res. Lett., 39, 10603, https://doi.org/10.1029/2012GL051106, 2012.
Li, L., Lozier, M. S., and Li, F.: Century-long cooling trend in subpolar North Atlantic forced by atmosphere: an alternative explanation, Clim. Dynam., 58, 2249–2267, https://doi.org/10.1007/S00382-021-06003-4, 2022.
Lin, I. I., Camargo, S. J., Patricola, C. M., Boucharel, J., Chand, S., Klotzbach, P., Chan, J. C. L., Wang, B., Chang, P., Li, T., and Jin, F. F.: ENSO and Tropical Cyclones, Geoph. Monog. Series, 253, 377–408, https://doi.org/10.1002/9781119548164.CH17, 2020.
Liu, J. and Curry, J. A.: Accelerated warming of the Southern Ocean and its impacts on the hydrological cycle and sea ice, P. Natl. Acad. Sci. USA, 107, 14987–14992, https://doi.org/10.1073/PNAS.1003336107, 2010.
Liu, J., Curry, J. A., and Martinson, D. G.: Interpretation of recent Antarctic sea ice variability, Geophys. Res. Lett., 31, 2205, https://doi.org/10.1029/2003GL018732, 2004.
Loeb, N. G., Johnson, G. C., Thorsen, T. J., Lyman, J. M., Rose, F. G., and Kato, S.: Satellite and Ocean Data Reveal Marked Increase in Earth's Heating Rate, Geophys. Res. Lett., 48, e2021GL093047, https://doi.org/10.1029/2021GL093047, 2021.
Lozier, M. S., Li, F., Bacon, S., Bahr, F., Bower, A. S., Cunningham, S. A., de Jong, M. F., de Steur, L., deYoung, B., Fischer, J., Gary, S. F., Greenan, B. J. W., Holliday, N. P., Houk, A., Houpert, L., Inall, M. E., Johns, W. E., Johnson, H. L., Johnson, C., Karstensen, J., Koman, G., Le Bras, I. A., Lin, X., Mackay, N., Marshall, D. P., Mercier, H., Oltmanns, M., Pickart, R. S., Ramsey, A. L., Rayner, D., Straneo, F., Thierry, V., Torres, D. J., Williams, R. G., Wilson, C., Yang, J., Yashayaev, I., and Zhao, J.: A sea change in our view of overturning in the subpolar North Atlantic, Science, 363, 516–521, https://doi.org/10.1126/science.aau6592, 2019.
Marbà, N. and Duarte, C.M.: Mediterranean warming triggers seagrass (Posidonia oceanica) shoot mortality, Glob. Change Biol., 16, 2366–2375, https://doi.org/10.1111/j.1365-2486.2009.02130.x, 2010.
Marsland, S. J. and Wolff, J. O.: On the sensitivity of Southern Ocean sea ice to the surface freshwater flux: A model study, J. Geophys. Res.-Oceans, 106, 2723–2741, https://doi.org/10.1029/2000JC900086, 2001.
Mattu, K. L., Bloomfield, H. C., Thomas, S., Martínez-Alvarado, O., and Rodríguez-Hernández, O.: The impact of tropical cyclones on potential offshore wind farms, Energy Sustain. Dev., 68, 29–39, https://doi.org/10.1016/J.ESD.2022.02.005, 2022.
McCarthy, G. D., Smeed, D. A., Johns, W. E., Frajka-Williams, E., Moat, B. I., Rayner, D., Baringer, M. O., Meinen, C. S., Collins, J., and Bryden, H. L.: Measuring the Atlantic Meridional Overturning Circulation at 26° N, Prog. Oceanogr., 130, 91–111, https://doi.org/10.1016/j.pocean.2014.10.006, 2015.
McKay, D. I. A., Staal, A., Abrams, J. F., Winkelmann, R., Sakschewski, B., Loriani, S., Fetzer, I., Cornell, S. E., Rockström, J., and Lenton, T. M.: Exceeding 1.5 °C global warming could trigger multiple climate tipping points, Science, 377, eabn7950, https://doi.org/10.1126/SCIENCE.ABN7950, 2022.
McPhaden, M. J., Zebiak, S. E., and Glantz, M. H.: ENSO as an Integrating Concept in Earth Science, Science, 314, 1740–1745, https://doi.org/10.1126/SCIENCE.1132588, 2006.
McPhaden, M. J., Santoso, A., and Cai, W.: Introduction to El Niño Southern Oscillation in a Changing Climate, Geoph. Monog. Series, 253, 1–19, https://doi.org/10.1002/9781119548164.CH1, 2020.
Meehl, G. A., Arblaster, J. M., Bitz, C. M., Chung, C. T. Y., and Teng, H.: Antarctic sea-ice expansion between 2000 and 2014 driven by tropical Pacific decadal climate variability, Nat. Geosci., 9, 590–595, https://doi.org/10.1038/ngeo2751, 2016.
Meredith, M., Sommerkorn, M., Cassotta, S., Derksen, C., Ekaykin, A., Hollowed, A., Kofinas, G., Mackintosh, A., Melbourne-Thomas, J., Muelbert, M. M. C., Ottersen, G., Pritchard, H., and Schuur, E. A. G.: Polar Regions Supplementary Material, in: IPCC Special Report on the Ocean and Cryosphere in a Changing Climate, edited by: Pörtner, H.-O., Roberts, D. C., Masson-Delmotte, V., Zhai, P., Tignor, M., Poloczanska, E., Mintenbeck, K., Alegria, A., Nicolai, M., Okem, A., Petzold, J., Rama, B., and Weyer, N. M., https://www.ipcc.ch/srocc/ (last access: 11 September 2024), 2019.
Minière, A., von Schuckmann, K., Sallée, J. B., and Vogt, L.: Robust acceleration of Earth system heating observed over the past six decades, Scientific Reports, 13, 22975, https://doi.org/10.1038/s41598-023-49353-1, 2023.
Minnett, P. J., Kilpatrick, K. A., Podestá, G. P., Evans, R. H., Szczodrak, M. D., Izaguirre, M. A., Williams, E. J., Walsh, S., Reynolds, R. M., Bailey, S. W., Armstrong, E. M., and Vazquez-cuervo, J.: Skin Sea-Surface Temperature from VIIRS on Suomi-NPP–NASA Continuity Retrievals, Remote Sensing, 12, 3369, https://doi.org/10.3390/RS12203369, 2020.
Moat, B. I., Smeed, D. A., Rayner, D., Johns, W. E., Smith, R., Volkov, D., Baringer, M. O., and Collins, J.: Atlantic meridional overturning circulation observed by the RAPID-MOCHA-WBTS (RAPID-Meridional Overturning Circulation and Heatflux Array-Western Boundary Time Series) array at 26N from 2004 to 2022 (v2022.1), British Oceanographic Data Centre – Natural Environment Research Council, UK [data set], https://doi.org/10.5285/04c79ece-3186-349a-e063-6c86abc0158c, 2023.
Moreira, L., Cazenave, A., and Palanisamy, H.: Influence of interannual variability in estimating the rate and acceleration of present-day global mean sea level, Global Planet. Change, 199, 103450, https://doi.org/10.1016/J.GLOPLACHA.2021.103450, 2021.
Naughten, K. A., Holland, P. R., Dutrieux, P., Kimura, S., Bett, D. T., and Jenkins, A.: Simulated Twentieth-Century Ocean Warming in the Amundsen Sea, West Antarctica, Geophys. Res. Lett., 49, e2021GL094566, https://doi.org/10.1029/2021GL094566, 2022.
Negri, A. J., Burkardt, N., Golden, J. H., Halverson, J. B., Huffman, G. J., Larsen, M. C., McGinley, J. A., Updike, R. G., Verdin, J. P., and Wieczorek, G. F.: The Hurricane–Flood–Landslide Continuum, B. Am. Meteorol. Soc., 86, 1241–1247, 2005.
Nielsen-Englyst, P., Høyer, J. L., Kolbe, W. M., Dybkjær, G., Lavergne, T., Tonboe, R. T., Skarpalezos, S., and Karagali, I.: A combined sea and sea-ice surface temperature climate dataset of the Arctic, 1982–2021, Remote Sens. Environ., 284, 113331, https://doi.org/10.1016/J.RSE.2022.113331, 2023.
Oliver, E. C. J., Benthuysen, J. A., Bindoff, N. L., Hobday, A. J., Holbrook, N. J., Mundy, C. N., and Perkins-Kirkpatrick, S. E.: The unprecedented 2015/16 Tasman Sea marine heatwave, Nat. Commun., 8, 16101, https://doi.org/10.1038/ncomms16101, 2017.
Oliver, E. C. J., Donat, M. G., Burrows, M. T., Moore, P. J., Smale, D. A., Alexander, L. V., Benthuysen, J. A., Feng, M., Sen Gupta, A., Hobday, A. J., Holbrook, N. J., Perkins-Kirkpatrick, S. E., Scannell, H. A., Straub, S. C., and Wernberg, T.: Longer and more frequent marine heatwaves over the past century, Nat. Commun., 9, 1324, https://doi.org/10.1038/s41467-018-03732-9, 2018.
Oliver, E. C. J., Burrows, M. T., Donat, M. G., Sen Gupta, A., Alexander, L. V., Perkins-Kirkpatrick, S. E., Benthuysen, J. A., Hobday, A. J., Holbrook, N. J., Moore, P. J., Thomsen, M. S., Wernberg, T., and Smale, D. A.: Projected Marine Heatwaves in the 21st Century and the Potential for Ecological Impact, Front. Mar. Sci., 6, 481127, https://doi.org/10.3389/FMARS.2019.00734, 2019.
Oppenheimer, M., Glavovic, B., Hinkel, J., Roderik, van, Magnan, A., Abd-Elgawad, A., Rongshu, C., Cifuentes, M., Robert, D., Ghosh, T., Hay, J., Ben, M., Meyssignac, B., Sebesvari, Z., A.J., S., Dangendorf, S., and Frederikse, T.: Sea Level Rise and Implications for Low Lying Islands, Coasts and Communities, in: IPCC Special Report on the Ocean and Cryosphere in a Changing Climate, edited by: Pörtner, H.-O., Roberts, D. C., Masson-Delmotte, V., Zhai, P., Tignor, M., Poloczanska, E., Mintenbeck, K., Alegria, A., Nicolai, M., Okem, A., Petzold, J., Rama, B., and Weyer, N. M., Cambridge University Press, Cambridge, UK and New York, NY, USA, 321–445, https://doi.org/10.1017/9781009157964.006, 2019.
OSNAP | Overturning in the Subpolar North Atlantic Program: A Subpolar Measure of the Atlantic Meridional Overturning Circulation, https://www.o-snap.org/, last access: 21 December 2023.
Parkinson, C. L.: A 40-y record reveals gradual Antarctic sea ice increases followed by decreases at rates far exceeding the rates seen in the Arctic, P. Natl. Acad. Sci. USA, 116, 14414–14423, https://doi.org/10.1073/PNAS.1906556116, 2019.
Parkinson, C. L. and Cavalieri, D. J.: Antarctic sea ice variability and trends, 1979–2010, The Cryosphere, 6, 871–880, https://doi.org/10.5194/tc-6-871-2012, 2012.
Patrick, C. J., Kominoski, J. S., McDowell, W. H., Branoff, B., Lagomasino, D., Leon, M., Hensel, E., Hensel, M. J. S., Strickland, B. A., Aide, T. M., Armitage, A., Campos-Cerqueira, M., Congdon, V. M., Crowl, T. A., Devlin, D. J., Douglas, S., Erisman, B. E., Feagin, R. A., Geist, S. J., Hall, N. S., Hardison, A. K., Heithaus, M. R., Hogan, J. A., Hogan, J. D., Kinard, S., Kiszka, J. J., Lin, T. C., Lu, K., Madden, C. J., Montagna, P. A., O'Connell, C. S., Proffitt, C. E., Reese, B. K., Reustle, J. W., Robinson, K. L., Rush, S. A., Santos, R. O., Schnetzer, A., Smee, D. L., Smith, R. S., Starr, G., Stauffer, B. A., Walker, L. M., Weaver, C. A., Wetz, M. S., Whitman, E. R., Wilson, S. S., Xue, J., and Zou, X.: A general pattern of trade-offs between ecosystem resistance and resilience to tropical cyclones, Sci. Adv., 8, 9155, https://doi.org/10.1126/SCIADV.ABL9155, 2022.
Pauling, A. G., Smith, I. J., Langhorne, P. J., and Bitz, C. M.: Time-Dependent Freshwater Input From Ice Shelves: Impacts on Antarctic Sea Ice and the Southern Ocean in an Earth System Model, Geophys. Res. Lett., 44, 10454–10461, https://doi.org/10.1002/2017GL075017, 2017.
Peal, R., Worsfold, M., and Good, S.: Comparing global trends in marine cold spells and marine heatwaves using reprocessed satellite data, in: 7th edition of the Copernicus Ocean State Report (OSR7), edited by: von Schuckmann, K., Moreira, L., Le Traon, P.-Y., Grégoire, M., Marcos, M., Staneva, J., Brasseur, P., Garric, G., Lionello, P., Karstensen, J., and Neukermans, G., Copernicus Publications, State Planet, 1-osr7, 3, https://doi.org/10.5194/sp-1-osr7-3-2023, 2023.
Peduzzi, P., Chatenoux, B., Dao, H., De Bono, A., Herold, C., Kossin, J., Mouton, F., and Nordbeck, O.: Global trends in tropical cyclone risk, Nat. Clim. Change, 2, 289–294, https://doi.org/10.1038/nclimate1410, 2012.
Polvani, L. M. and Smith, K. L.: Can natural variability explain observed Antarctic sea ice trends? New modeling evidence from CMIP5, Geophys. Res. Lett., 40, 3195–3199, https://doi.org/10.1002/GRL.50578, 2013.
Prandi, P., Meyssignac, B., Ablain, M., Spada, G., Ribes, A., and Benveniste, J.: Local sea level trends, accelerations and uncertainties over 1993–2019, Scientific Data, 8, 1, https://doi.org/10.1038/s41597-020-00786-7, 2021.
Purich, A. and Doddridge, E. W.: Record low Antarctic sea ice coverage indicates a new sea ice state, Communications Earth & Environment, 4, 314, https://doi.org/10.1038/s43247-023-00961-9, 2023.
Purich, A., Cai, W., England, M. H., and Cowan, T.: Evidence for link between modelled trends in Antarctic sea ice and underestimated westerly wind changes, Nat. Commun., 7, 10409, https://doi.org/10.1038/ncomms10409, 2016.
Raghuraman, S. P., Paynter, D., and Ramaswamy, V.: Anthropogenic forcing and response yield observed positive trend in Earth's energy imbalance, Nat. Commun., 12, 4577, https://doi.org/10.1038/s41467-021-24544-4, 2021.
Rahmstorf, S.: Is the Atlantic overturning circulation approaching a tipping point?, Oceanography, 37, https://doi.org/10.5670/oceanog.2024.501, 2024.
Rahmstorf, S., Box, J. E., Feulner, G., Mann, M. E., Robinson, A., Rutherford, S., and Schaffernicht, E. J.: Exceptional twentieth-century slowdown in Atlantic Ocean overturning circulation, Nat. Clim. Change, 5, 475–480, https://doi.org/10.1038/nclimate2554, 2015.
Ramírez, F., Afán, I., Davis, L. S., and Chiaradia, A.: Climate impacts on global hot spots of marine biodiversity, Sci. Adv., 3, e1601198, https://doi.org/10.1126/SCIADV.1601198, 2017.
Rasmussen, T. A. S., Høyer, J. L., Ghent, D., Bulgin, C. E., Dybkjær, G., Ribergaard, M. H., Nielsen-Englyst, P., and Madsen, K. S.: Impact of Assimilation of Sea-Ice Surface Temperatures on a Coupled Ocean and Sea-Ice Model, J. Geophys. Res.-Oceans, 123, 2440–2460, https://doi.org/10.1002/2017JC013481, 2018.
Rhein, M., Kieke, D., Hüttl-Kabus, S., Roessler, A., Mertens, C., Meissner, R., Klein, B., Böning, C. W., and Yashayaev, I.: Deep water formation, the subpolar gyre, and the meridional overturning circulation in the subpolar North Atlantic, Deep-Sea Res. Pt. II, 58, 1819–1832, https://doi.org/10.1016/J.DSR2.2010.10.061, 2011.
Romero-Centeno, R., Zavala-Hidalgo, J., Gallegos, A., and O'Brien, J. J.: Isthmus of Tehuantepec Wind Climatology and ENSO Signal, J. Climate, 16, 2628–2639, https://doi.org/10.1175/1520-0442(2003)016<2628:IOTWCA>2.0.CO;2, 2003.
Roose, S., Ajayamohan, R. S., Ray, P., Xie, S. P., Sabeerali, C. T., Mohapatra, M., Taraphdar, S., Mohanakumar, K., and Rajeevan, M.: Pacific decadal oscillation causes fewer near-equatorial cyclones in the North Indian Ocean, Nat. Commun., 14, 5099, https://doi.org/10.1038/s41467-023-40642-x, 2023.
Sampe, T., and Xie, S.: Mapping High Sea Winds from Space: A Global Climatology, B. Am. Meteorol. Soc., 88, 1965–1978, https://doi.org/10.1175/BAMS-88-12-1965, 2007.
Sanders, R. N. C., Jones, D. C., Josey, S. A., Sinha, B., and Forget, G.: Causes of the 2015 North Atlantic cold anomaly in a global state estimate, Ocean Sci., 18, 953–978, https://doi.org/10.5194/os-18-953-2022, 2022.
Seneviratne, S. I., Zhang, X., Adnan, M., Badi, W., Dereczynski, C., Di Luca, A., Ghosh, S., Iskandar, I., Kossin, J., Lewis, S., Otto, F., Pinto, I., Satoh, M., Vicente-Serrano, S. M., Wehner, M., and Zhou, B.: Weather and Climate Extreme Events in a Changing Climate, in: Climate Change 2021: The Physical Science Basis. Contribution of Working Group I to the Sixth Assessment Report of the Intergovernmental Panel on Climate Change, edited by: Masson-Delmotte, V., Zhai, P., Pirani, A., Connors, S. L., Péan, C., Berger, S., Caud, N., Chen, Y., Goldfarb, L., Gomis, M. I., Huang, M., Leitzell, K., Lonnoy, E., Matthews, J. B. R., Maycock, T. K., Waterfield, T., Yelekçi, O., Yu, R., and Zhou, B., Cambridge University Press, Cambridge, United Kingdom and New York, NY, USA, 1513–1766, https://doi.org/10.1017/9781009157896.013, 2021.
She, J. and Nielsen, J. W.: “Silent” storm surge extremes in the western Baltic Sea on 4 January 2017, in: Copernicus Marine Service Ocean State Report, Issue3, J. Oper. Oceanogr., 12, s111–s117, https://doi.org/10.1080/1755876X.2019.1633075, 2019.
Smeed, D. A., McCarthy, G. D., Cunningham, S. A., Frajka-Williams, E., Rayner, D., Johns, W. E., Meinen, C. S., Baringer, M. O., Moat, B. I., Duchez, A., and Bryden, H. L.: Observed decline of the Atlantic meridional overturning circulation 2004–2012, Ocean Sci., 10, 29–38, https://doi.org/10.5194/os-10-29-2014, 2014.
Smith, K. E., Burrows, M. T., Hobday, A. J., King, N. G., Moore, P. J., Sen Gupta, A., Thomsen, M. S., Wernberg, T., and Smale, D. A.: Biological Impacts of Marine Heatwaves, Annu. Rev. Mar. Sci., 15, 119–145, https://doi.org/10.1146/annurev-marine-032122-121437, 15, 119–145, 2023.
Sopkin, K. L., Stockdon, H. F., Doran, K. S., Plant, N. G., Morgan, K. L. M., Guy, K. K., and Smith, K. E. L.: Hurricane Sandy: observations and analysis of coastal change, U.S. Geological Survey Open-File Report, 54, https://doi.org/10.3133/OFR20141088, 2014.
Spada, G. and Melini, D.: SELEN4 (SELEN version 4.0): a Fortran program for solving the gravitationally and topographically self-consistent sea-level equation in glacial isostatic adjustment modeling, Geosci. Model Dev., 12, 5055–5075, https://doi.org/10.5194/gmd-12-5055-2019, 2019.
Stammer, D., Cazenave, A., Ponte, R. M., and Tamisiea, M. E.: Causes for Contemporary Regional Sea Level Changes, Annu. Rev. Mar. Sci., 5, 21–46, https://doi.org/10.1146/annurev-marine-121211-172406, 2012
Staneva, J., Behrens, A., and Gayer, G.: Predictability of large wave heights in the western Black Sea during the 2018 winter storms, in: Copernicus Marine Service Ocean State Report, Issue 4, J. Oper. Oceanogr., 13, s144–s149, https://doi.org/10.1080/1755876X.2020.1785097, 2020.
Storto, A. and Yang, C.: Acceleration of the ocean warming from 1961 to 2022 unveiled by large-ensemble reanalyses, Nat. Commun., 15, 545, https://doi.org/10.1038/s41467-024-44749-7, 2024.
Swart, N. C. and Fyfe, J. C.: The influence of recent Antarctic ice sheet retreat on simulated sea ice area trends, Geophys. Res. Lett., 40, 4328–4332, https://doi.org/10.1002/GRL.50820, 2013.
Tagliabue, A., Bowie, A. R., Boyd, P. W., Buck, K. N., Johnson, K. S., and Saito, M. A.: The integral role of iron in ocean biogeochemistry, Nature, 543, 51–59, https://doi.org/10.1038/NATURE21058, 2017.
Tamisiea, M. E.: Ongoing glacial isostatic contributions to observations of sea level change, Geophys. J. Int., 186, 1036–1044, https://doi.org/10.1111/J.1365-246X.2011.05116.X, 2011.
Timmermann, A., An, S. Il, Kug, J. S., Jin, F. F., Cai, W., Capotondi, A., Cobb, K., Lengaigne, M., McPhaden, M. J., Stuecker, M. F., Stein, K., Wittenberg, A. T., Yun, K. S., Bayr, T., Chen, H. C., Chikamoto, Y., Dewitte, B., Dommenget, D., Grothe, P., Guilyardi, E., Ham, Y. G., Hayashi, M., Ineson, S., Kang, D., Kim, S., Kim, W. M., Lee, J. Y., Li, T., Luo, J. J., McGregor, S., Planton, Y., Power, S., Rashid, H., Ren, H. L., Santoso, A., Takahashi, K., Todd, A., Wang, G., Wang, G., Xie, R., Yang, W. H., Yeh, S. W., Yoon, J., Zeller, E., and Zhang, X.: El Niño–Southern Oscillation complexity, Nature, 559, 535–545, https://doi.org/10.1038/s41586-018-0252-6, 2018.
Trenberth, K. E.: The Definition of El Niño, B. Am. Meteorol. Soc., 78, 2771–2778, https://doi.org/10.1175/1520-0477(1997)078<2771:TDOENO>2.0.CO;2, 1997.
Trenberth, K. E. and Stepaniak, D. P.: Indices of El Niño Evolution, J. Climate, 14, 1697–1701, https://doi.org/10.1175/1520-0442(2001)014<1697:LIOENO>2.0.CO;2, 2001.
Turney, C. S. M., Fogwill, C. J., Golledge, N. R., McKay, N. P., van Sebille, E., Jones, R. T., Etheridge, D., Rubino, M., Thornton, D. P., Davies, S. M., Ramsey, C. B., Thomas, Z. A., Bird, M. I., Munksgaard, N. C., Kohno, M., Woodward, J., Winter, K., Weyrich, L. S., Rootes, C. M., Millman, H., Albert, P. G., Rivera, A., van Ommen, T., Curran, M., Moy, A., Rahmstorf, S., Kawamura, K., Hillenbrand, C. D., Weber, M. E., Manning, C. J., Young, J., and Cooper, A.: Early Last Interglacial ocean warming drove substantial ice mass loss from Antarctica, P. Natl. Acad. Sci. USA, 117, 3996–4006, https://doi.org/10.1073/PNAS.1902469117, 2020.
UN: United Nations Environment Programme (12/1), Paris Agreement, https://wedocs.unep.org/20.500.11822/20830 (last access: 11 September 2024), 2015.
UN: Measure and Report Ocean Acidification – Sustainable Development Goal 14.3.1 Indicator Methodology, Department of Economic and Social Affairs: https://sdgs.un.org/partnerships/measure-and-report-ocean-acidification-sustainable-development-goal-1431-indicator, last access: 27 November 2023.
Vazquez-Cuervo, J., Castro, S. L., Steele, M., Gentemann, C., Gomez-Valdes, J., and Tang, W.: Comparison of GHRSST SST Analysis in the Arctic Ocean and Alaskan Coastal Waters Using Saildrones, Remote Sensing, 14, 692, https://doi.org/10.3390/RS14030692, 2022.
Verschuur, J., Koks, E. E., Li, S., and Hall, J. W.: Multi-hazard risk to global port infrastructure and resulting trade and logistics losses, Communications Earth & Environment, 4, 5, https://doi.org/10.1038/s43247-022-00656-7, 2023.
Volkov, D. L., Zhang, K., Johns, W. E., Willis, J. K., Hobbs, W., Goes, M., Zhang, H., and Menemenlis, D.: Atlantic meridional overturning circulation increases flood risk along the United States southeast coast, Nat. Commun., 14, 5095, https://doi.org/10.1038/s41467-023-40848-z, 2023.
von Schuckmann, K., Palmer, M. D., Trenberth, K. E., Cazenave, A., Chambers, D., Champollion, N., Hansen, J., Josey, S. A., Loeb, N., Mathieu, P. P., Meyssignac, B., and Wild, M.: An imperative to monitor Earth's energy imbalance, Nat. Clim. Change, 6, 138–144, https://doi.org/10.1038/nclimate2876, 2016.
von Schuckmann, K., Cheng, L., Palmer, M. D., Hansen, J., Tassone, C., Aich, V., Adusumilli, S., Beltrami, H., Boyer, T., Cuesta-Valero, F. J., Desbruyères, D., Domingues, C., García-García, A., Gentine, P., Gilson, J., Gorfer, M., Haimberger, L., Ishii, M., Johnson, G. C., Killick, R., King, B. A., Kirchengast, G., Kolodziejczyk, N., Lyman, J., Marzeion, B., Mayer, M., Monier, M., Monselesan, D. P., Purkey, S., Roemmich, D., Schweiger, A., Seneviratne, S. I., Shepherd, A., Slater, D. A., Steiner, A. K., Straneo, F., Timmermans, M.-L., and Wijffels, S. E.: Heat stored in the Earth system: where does the energy go?, Earth Syst. Sci. Data, 12, 2013–2041, https://doi.org/10.5194/essd-12-2013-2020, 2020.
von Schuckmann, K., Minière, A., Gues, F., Cuesta-Valero, F. J., Kirchengast, G., Adusumilli, S., Straneo, F., Ablain, M., Allan, R. P., Barker, P. M., Beltrami, H., Blazquez, A., Boyer, T., Cheng, L., Church, J., Desbruyeres, D., Dolman, H., Domingues, C. M., García-García, A., Giglio, D., Gilson, J. E., Gorfer, M., Haimberger, L., Hakuba, M. Z., Hendricks, S., Hosoda, S., Johnson, G. C., Killick, R., King, B., Kolodziejczyk, N., Korosov, A., Krinner, G., Kuusela, M., Landerer, F. W., Langer, M., Lavergne, T., Lawrence, I., Li, Y., Lyman, J., Marti, F., Marzeion, B., Mayer, M., MacDougall, A. H., McDougall, T., Monselesan, D. P., Nitzbon, J., Otosaka, I., Peng, J., Purkey, S., Roemmich, D., Sato, K., Sato, K., Savita, A., Schweiger, A., Shepherd, A., Seneviratne, S. I., Simons, L., Slater, D. A., Slater, T., Steiner, A. K., Suga, T., Szekely, T., Thiery, W., Timmermans, M.-L., Vanderkelen, I., Wjiffels, S. E., Wu, T., and Zemp, M.: Heat stored in the Earth system 1960–2020: where does the energy go?, Earth Syst. Sci. Data, 15, 1675–1709, https://doi.org/10.5194/essd-15-1675-2023, 2023.
Wakelin, S., Townhill, B., Engelhard, G., Holt, J., and Renshaw, R.: Marine heatwaves and cold-spells, and their impact on fisheries in the North Sea, in: Copernicus Marine Service Ocean State Report, Issue 5, J. Oper. Oceanogr., 14, s91–s96, https://doi.org/10.1080/1755876X.2021.1946240, 2021.
Wang, B., Sun, W., Jin, C., Luo, X., Yang, Y. M., Li, T., Xiang, B., McPhaden, M. J., Cane, M. A., Jin, F., Liu, F., and Liu, J.: Understanding the recent increase in multiyear La Niñas, Nat. Clim. Change, 13, 1075–1081, https://doi.org/10.1038/s41558-023-01801-6, 2023.
WCRP Global Sea Level Budget Group: Global sea-level budget 1993–present, Earth Syst. Sci. Data, 10, 1551–1590, https://doi.org/10.5194/essd-10-1551-2018, 2018.
Welch, H., Savoca, M. S., Brodie, S., Jacox, M. G., Muhling, B. A., Clay, T. A., Cimino, M. A., Benson, S. R., Block, B. A., Conners, M. G., Costa, D. P., Jordan, F. D., Leising, A. W., Mikles, C. S., Palacios, D. M., Shaffer, S. A., Thorne, L. H., Watson, J. T., Holser, R. R., Dewitt, L., Bograd, S. J., and Hazen, E. L.: Impacts of marine heatwaves on top predator distributions are variable but predictable, Nat. Commun., 14, 5188, https://doi.org/10.1038/s41467-023-40849-y, 2023.
Westen, R. M. van, Kliphuis, M., and Dijkstra, H. A.: Physics-based early warning signal shows that AMOC is on tipping course, Sci. Adv., 10, 1189, https://doi.org/10.1126/SCIADV.ADK1189, 2024.
Wetz, M. S. and Yoskowitz, D. W.: An “extreme” future for estuaries? Effects of extreme climatic events on estuarine water quality and ecology, Mar. Pollut. Bull., 69, 7–18, https://doi.org/10.1016/J.MARPOLBUL.2013.01.020, 2013.
WMO: WMO El Niño/La Niña Updates, World Meteorological Organization, https://community.wmo.int/en/activity-areas/climate/wmo-el-ninola-nina-updates, last access: 21 December 2023.
Wood, M., Rignot, E., Fenty, I., An, L., Bjørk, A., van den Broeke, M., Cai, C., Kane, E., Menemenlis, D., Millan, R., Morlighem, M., Mouginot, J., Noël, B., Scheuchl, B., Velicogna, I., Willis, J. K., and Zhang, H.: Ocean forcing drives glacier retreat in Greenland, Sci. Adv., 7, eaba7282, https://doi.org/10.1126/SCIADV.ABA7282, 2021.
Yao, Y., Wang, C., and Fu, Y.: Global Marine Heatwaves and Cold-Spells in Present Climate to Future Projections, Earth's Future, 10, e2022EF002787, https://doi.org/10.1029/2022EF002787, 2022.
Yuan, J. P. and Cao, J.: North Indian Ocean tropical cyclone activities influenced by the Indian Ocean Dipole mode, Sci. China Earth Sci., 56, 855–865, https://doi.org/10.1007/S11430-012-4559-0, 2013.
Zamudio, L., Hurlburt, H. E., Metzger, E. J., Morey, S. L., O'brien, J. J., Tilburg, C., Zavala-Hidalgo, J., Zamudio, C. :, Hurlburt, H. E., Metzger, E. J., Morey, S. L., O'brien, J. J., Tilburg, C. E., and Zavala-Hidalgo, J.: Interannual variability of Tehuantepec eddies, J. Geophys. Res.-Oceans, 111, C05001, https://doi.org/10.1029/2005JC003182, 2006.
Zhang, L., Delworth, T. L., Yang, X., Zeng, F., Lu, F., Morioka, Y., and Bushuk, M.: The relative role of the subsurface Southern Ocean in driving negative Antarctic Sea ice extent anomalies in 2016–2021, Communications Earth & Environment, 3, 302, https://doi.org/10.1038/s43247-022-00624-1, 2023.
Zhu, C., Liu, Z., Zhang, S., and Wu, L.: Likely accelerated weakening of Atlantic overturning circulation emerges in optimal salinity fingerprint, Nat. Commun., 14, 1245, https://doi.org/10.1038/s41467-023-36288-4, 2023.
Zunz, V., Goosse, H., and Massonnet, F.: How does internal variability influence the ability of CMIP5 models to reproduce the recent trend in Southern Ocean sea ice extent?, The Cryosphere, 7, 451–468, https://doi.org/10.5194/tc-7-451-2013, 2013.