the Creative Commons Attribution 4.0 License.
the Creative Commons Attribution 4.0 License.
 | 30 Sep 2025 | OSR9 | Chapter 3.1
Relationship between variations in sea bottom temperature and American lobster catch rate off southwestern Nova Scotia during 2008–2023
Adam M. Cook
Youyu Lu
Xianmin Hu
David Brickman
David Hebert
Chantelle Layton
Gilles Garric
American lobsters (Homarus americanus) are an iconic species and are the socioeconomic and cultural mainstay for many communities across Nova Scotia. Describing the changes in population biomass and providing annual stock assessment advice for this species are required for sustainable fisheries. In many areas the best information available for providing this advice comes from commercial fishery data. Often there is an assumed relationship between fishery performance (catch per unit effort; CPUE) and available biomass; however several studies indicate that this relationship can be affected by external factors such as sea bottom temperature. Including bottom temperature when developing a standardized CPUE index will potentially address these concerns; however it has proven difficult in the past due to the lack of readily available (near-real-time) and unbiased bottom temperature data at the spatial and temporal scales required. Here we explore a global ocean reanalysis product of the European Union Copernicus Marine Service with an application to the fishery catch data from Lobster Fishing Area 33 during 2008–2023. A comparison with observational data shows that this reanalysis product provides realistic variations in sea bottom temperatures in this region. Next, a hierarchical generalized linear modelling approach is applied to evaluate the relationship between within-season changes in lobster CPUE and sea bottom temperature. Positive relationships between the rates of change of two model parameters, during the first 60 d of the fishing season (from mid-November to mid-January), are found in the majority of the 10 subregions. A standardized CPUE index with the influence of bottom temperature included, compared to the index without such influence, explains a high percentage of the deviance of CPUE data and hence is more consistent with available stock biomass. The outcomes of the model evaluation and relationship analysis encourage further applications of multi-decadal ocean reanalysis products to understand past changes, as well as the development of ocean forecasts for predicting future changes in marine ecosystems and fisheries, a product with wide-reaching socioeconomic value.
- Article
(3848 KB) - Full-text XML
- BibTeX
- EndNote


The Scotian Shelf (SS) is one of the regions of Atlantic Canada possessing highly valuable fishery resources. The fish population and fishery yields vary in both space and time, owing to multiple factors including changes in ocean conditions, which are known to affect fish bioenergetics and behaviour. For example, in the fishing areas of the snow crab (Chionoecetes opilio) on the western SS, Zisserson and Cook (2017) identified the adverse impacts of a significant positive anomaly of sea bottom temperature in 2011/2012 on the local population of some life stages of snow crabs, with juvenile stages being the most affected as they are less likely to migrate out of suboptimal conditions. Similar studies have also been carried out for American lobster (Homarus americanus), another commercially important crustacean species in the region. The American lobster is an iconic species and is the socioeconomic and cultural mainstay for many communities across Nova Scotia. Describing the changes in American lobster population biomass and providing annual stock assessment advice are required for sustainable fisheries. In many areas the best information available for providing this advice comes from commercial fishery data, in particular fishery performance (catch per unit effort; CPUE; Cook et al., 2020). When relying on CPUE to provide stock advice, there is an assumed relationship with available biomass; however several studies have shown that this relationship can be affected by external factors such as the sea bottom temperature (Wright and Liu, 2024; Crossin et al., 1998) and improvements in vessel technology (bottom mapping, global positioning systems; Wiber and Barnett, 2023). Lobster fishery CPUE is affected by bottom temperature through the interaction of the passive trap-based fishery and lobster behaviour as lobster activity and digestion rates are influenced by temperature (McLeese, 1956; McLeese and Wilder, 1958). In warmer waters, lobsters are more active and digest faster thereby making them more susceptible to baited traps, leading to potentially higher CPUE independent of available biomass. In order to develop informative stock assessment advice incorporating bottom temperature two criteria must be met: (1) the bottom temperature information (from models or observations) should be available at appropriate spatial and temporal scales, unbiased (or able to be bias-corrected), and available in real time (or approximately real time) and (2) the relationship between bottom temperature and CPUE should be evaluated outside the stock assessment model and follow expected trends.
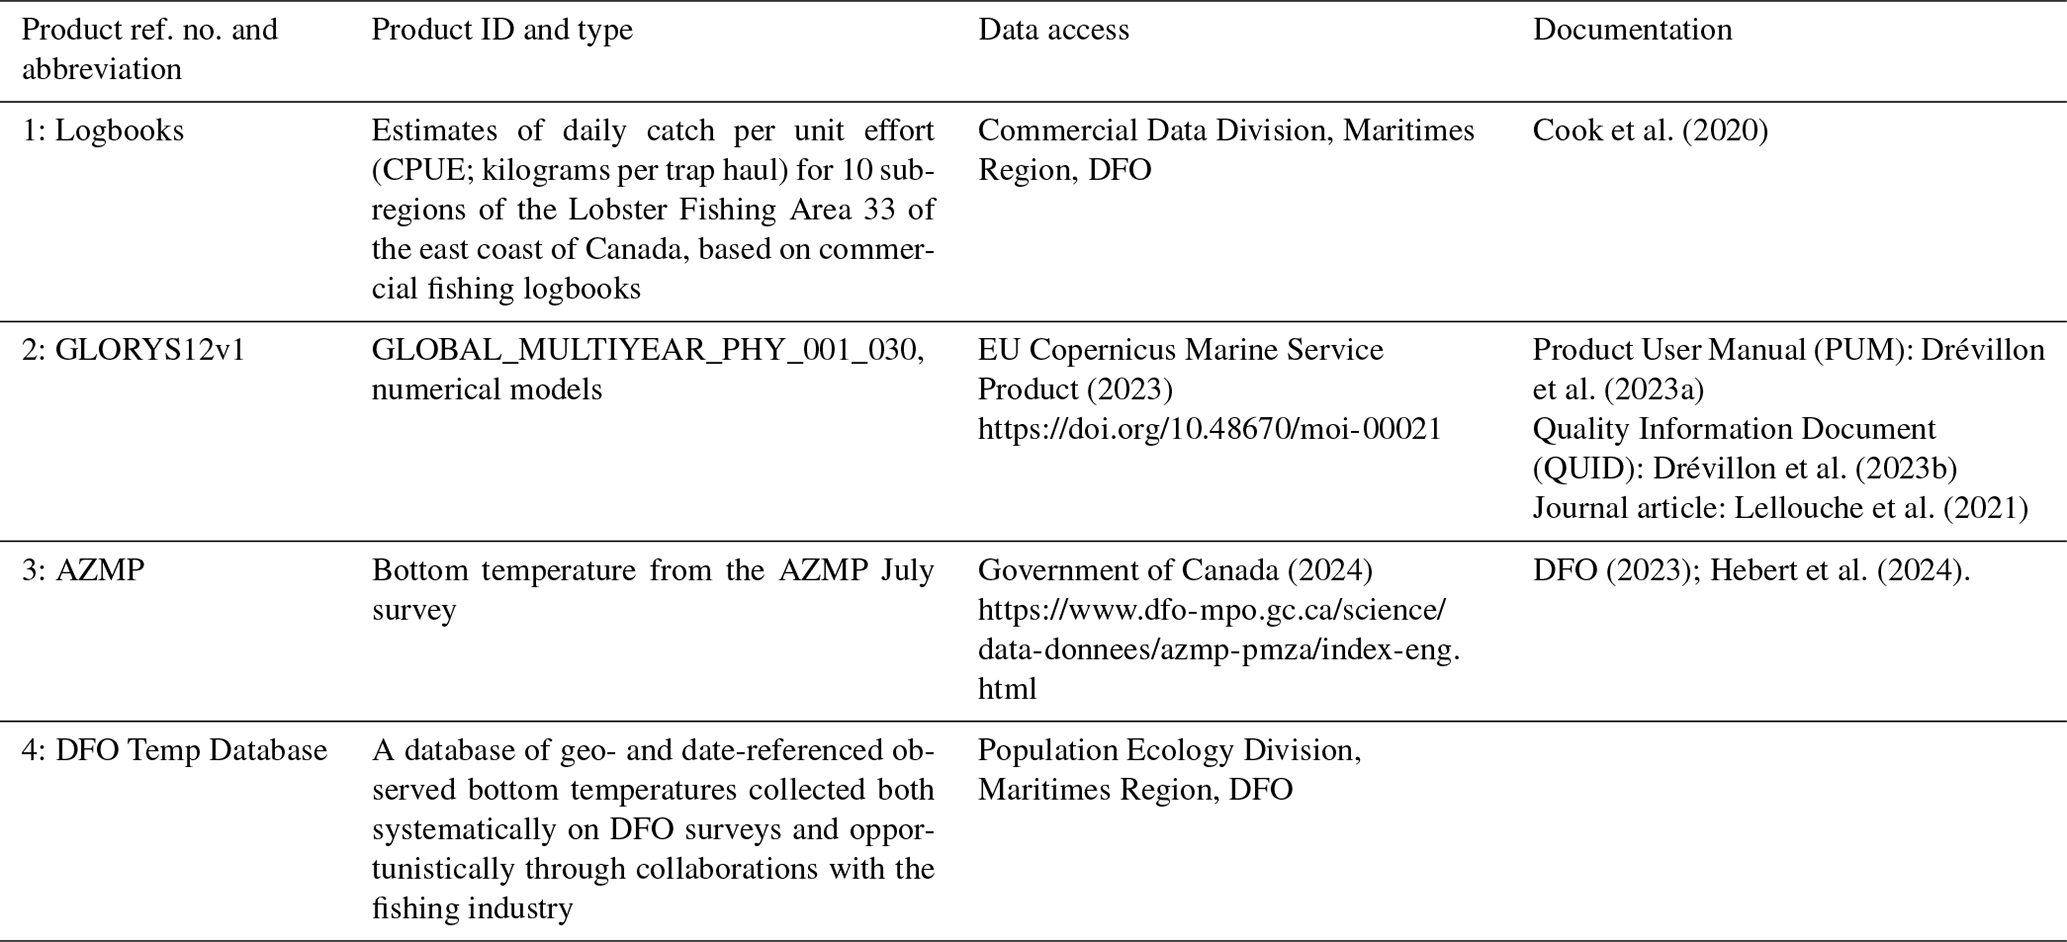
In previous studies on the relationship between the fishery performance and ocean conditions, sea bottom temperatures from both observation and numerical ocean models have been used. Ocean observations and models both possess strengths and weakness in depicting the complicated space–time variations in oceanic conditions of the SS, which are influenced by the strong multi-scale variability in atmospheric forcing at the surface and laterally from the Gulf of St. Lawrence, the Newfoundland Shelf, the Gulf Stream and the Labrador Current (e.g., Loder et al., 1998; Brickman et al., 2018). Observational data provide “ground-truthing” of ocean variations and are very valuable for model evaluation and bias correction but are often limited by sparseness in space and time. For example, the Atlantic Zonal Monitoring Program (AZMP) of Fisheries and Oceans Canada (DFO) conducts SS-wide surveys, but these were mainly in July with some complementary seasonal surveys along specific sections (e.g., DFO, 2023; Hebert et al., 2024). The results of high-resolution ocean models fill gaps in observational data but usually contain biases that need to be quantified and corrected. One systematic approach to reduce the model biases is the assimilation of observational data. This led to the creation of data-assimilative ocean reanalysis products, such as product reference number 2 (product ref. no. 2; Table 1). Due to the open-ocean nature of most observational data used for assimilation, the accuracy of the reanalysis products for shelf and coastal seas needs to be evaluated using available shelf and coastal observational data.
We explore a global ocean reanalysis product of the European Union Copernicus Marine Service to (1) examine the relationship between lobster CPUE and sea bottom temperature on the SS and (2) develop a temperature-corrected standardized index of CPUE including seasonal and interannual changes in bottom temperature. The analysis focuses on Lobster Fishing Area 33 (LFA33; Fig. 1a) due to the availability of lobster CPUE data from different subregions in this area during 2008–2023. The sea bottom temperature is taken from product ref. no. 2 because of its high resolution and continuous coverage in space and time. This allows for examining the variations in the relationship among different subregions not previously detailed in studies. As discussed above, prior to delving into this analysis, the accuracy of product ref. no. 2 needs to be first evaluated with available observational data. Positive outcomes of the model evaluation and analysis could encourage further applications of multi-decadal ocean reanalysis products to reveal more linkages between variations in ocean conditions and marine ecosystems and fisheries. This could further encourage the development and improvement of ocean forecasts for predicting future changes in marine ecosystems and fisheries, a product with wide-reaching socioeconomic value.
A number of datasets were used in this study. Commercial fishing logbooks (hereafter “Logbooks”) provide the most detailed accounting of the spatial and temporal extent of effort and landings for commercial lobster fishing currently available. These logbooks are completed daily and submitted monthly to dockside monitoring companies for data entry and transmission to the Commercial Data Division of DFO. Logbooks contain fishing information including date fished, vessel registration number, fishing licence number and reporting grid number(s). For each day fished, grid number, effort (number of traps hauled) and estimated landings are provided. Based on the data in logbooks, we derive product ref. no. 1 (Table 1), which is the estimates of daily CPUE (kilograms per trap haul) for 10 different subregions of LFA33 (Fig. 1a).
Daily sea bottom temperature data on the Scotian Shelf from 1 January 1993 to 31 December 2023 are obtained from product ref. no. 2, which is a global ocean reanalysis available on a horizontal grid of ° in longitude and latitude and with 50 vertical levels. Major ocean observational datasets are being assimilated to generate this data product (hereafter GLORYS12v1).
The observed bottom temperature is obtained from two products. Product ref. no. 3 is the July AZMP survey. Product ref. no. 4 is a geo- and date-referenced dataset of observed bottom temperatures collected both systematically on DFO surveys and opportunistically through collaborations with the fishing industry (Fig. 1a; solid red circles; hereafter “DFO Temp Database”).
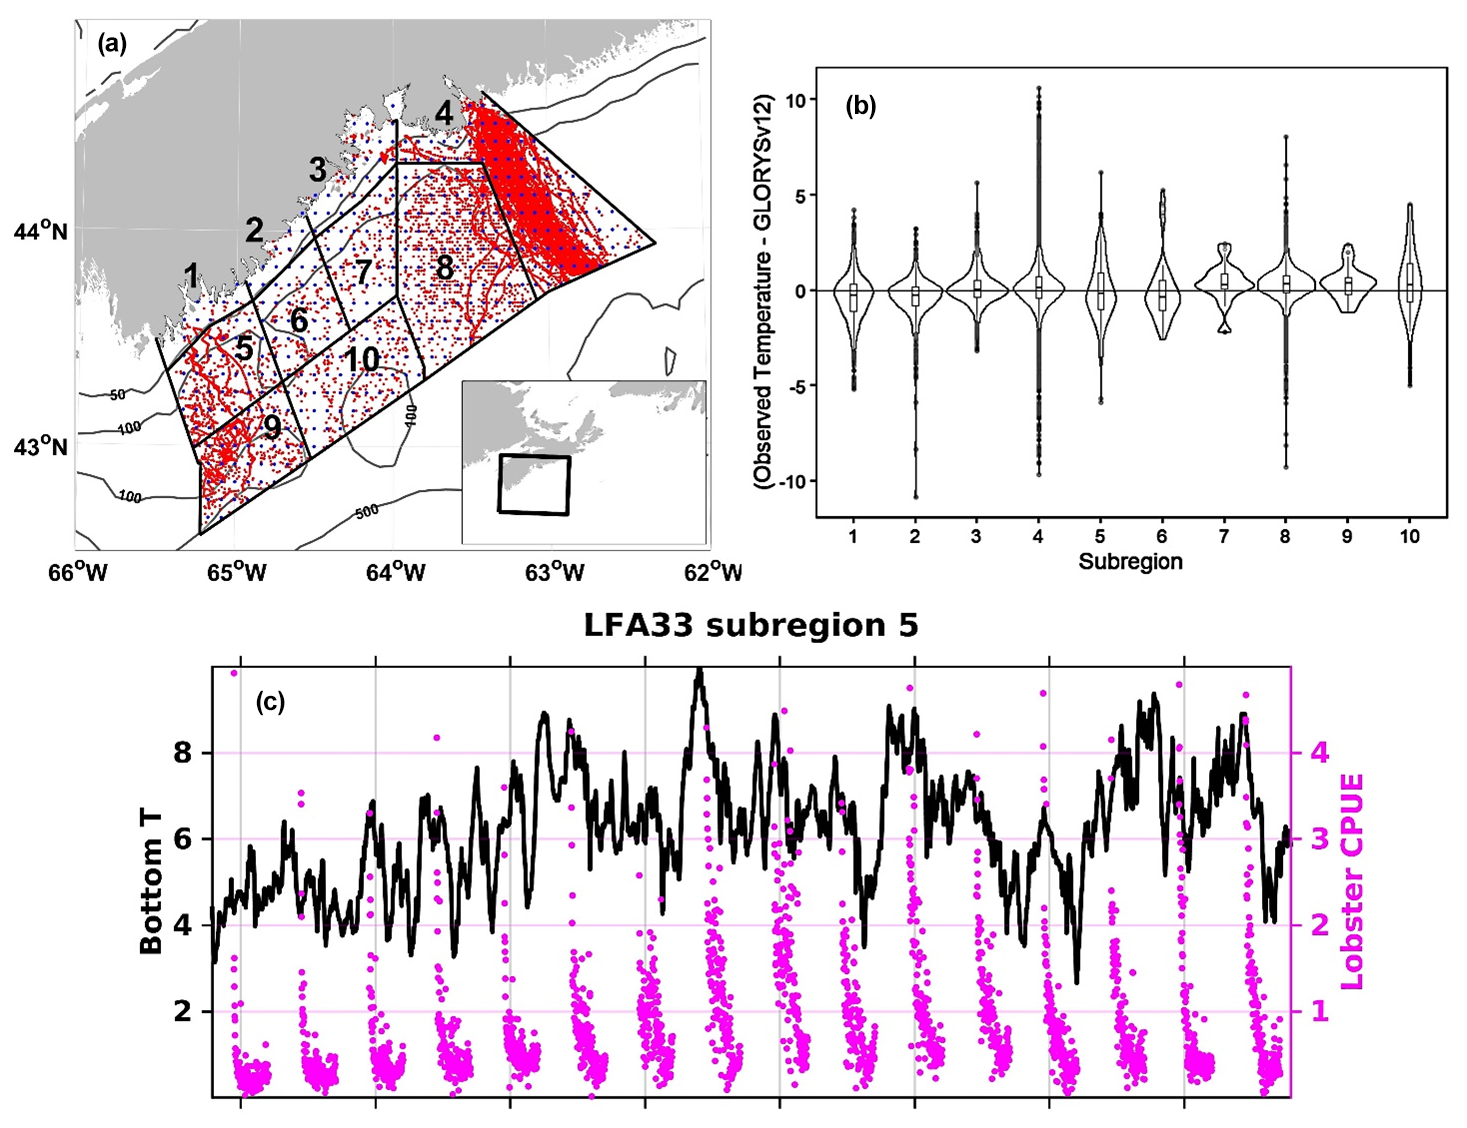
Figure 1(a) The division of 10 subregions of LFA33 off southwestern Nova Scotia; the locations of observed bottom temperatures during the lobster fishing seasons of 2008–2023 (solid red circles); and the bathymetry contours of 50, 100 and 500 m. (b) Violin plots of observed bottom temperature during the commercial lobster fishing season (product ref. no 4) minus that extracted from reanalysis (product ref. no. 2) at matching times and grid points nearest to the observations for subregions 1 to 10. (c) Daily time series of bottom temperature from product ref. no. 2 (black curve) and the lobster CPUE (product ref. no. 1, solid magenta circles) during the lobster seasons of 2008–2023 in subregion 5.
3.1 Evaluation of modelled bottom temperature with observational data
Figure 2 presents the spatial distribution of bottom temperature anomalies in July from the AZMP survey (product ref. no. 3, with a certain level of horizontal interpolation being applied) and GLORYS12v1 reanalysis (product ref. no. 2), for the 5 selected years of 2008, 2012, 2015, 2022 and 2023. Focusing on the SS (east of 66° W), the spatial patterns and the magnitudes of anomalies during these years agree well. Among the 5 years, 2008 shows cold anomalies from the central deep basin (Emerald Basin) to the offshore bank (Western/Emerald Banks) and near the shelf break, with near-normal conditions along the coast. In 2012, significant warm anomalies occurred along the coast and the western part of the SS (up to 3 °C) and over the offshore bank, as well as near-normal conditions in the central basin. In 2015 and 2022, strong warm anomalies occurred in the eastern and western SS, respectively. In 2023, observations suggest moderate warm anomalies (about 1 °C) over two large areas in the eastern and western SS, while the reanalysis overestimated the magnitudes of temperature anomalies in the eastern SS. On the SS, similar patterns are found for other years during 1993–2023 (figures not shown).
The ocean model used to create the reanalysis does not include tides, so the agreement between the observational and reanalysis data on SS is possibly due to the generally weak tidal mixing in the region. In the Bay of Fundy (west of the SS) tides and tidal mixing are strong and the reanalysis data show larger discrepancy from observations, e.g., in 2022 and 2023. The differences in the impacts of tidal mixing on ocean temperatures, between the SS and Bay of Fundy, have been quantified using model sensitivity experiments by Wang et al. (2020).
Figure 3 presents the monthly time series of bottom temperature during 1993–2023 from the GLORYS12v1 reanalysis and the July values from AZMP observations during 1993–2023 for the 10 subregions for LFA33. Note that in regions 1–3 the observation are very limited and the observed July values are heavily influenced by the spatial interpolation. Based on reanalysis data, the seasonal variations are strong in subregions 1, 2 and 3 – along the coast with a maximum water depth of about 50 m. In these three subregions, depth–time sections of water temperature (figures not shown) demonstrate that (1) for January–March the whole water column is well-mixed and the impacts of surface cooling reach the bottom, resulting in a minimum bottom temperature near 0 °C; (2) in April–August the impacts of surface warming penetrate downward due to vertical diffusion, leading to a steady increase in bottom temperature; and (3) in September–October the ocean's surface heat loss results in strong mixing (convection) of the heat in upper layer through the whole water column, resulting in a maximum bottom temperature of about 10 °C. The seasonal variations in bottom temperature are relatively weak in subregions 4–10 with water depths reaching ∼ 200 m. In these regions, depth–time sections of water temperature (figures not shown) show that in winter the impacts of surface cooling do not reach the bottom, and in summer and fall there exists a “cold intermediate layer” at depths of 50–100 m. This results in a weak fluctuation in monthly bottom temperature of around 5 °C throughout the year.
For all the 10 subregions, the reanalysis data show interannual variation in bottom temperature, accompanied by stronger or weaker seasonal variations. The interannual variations in July bottom temperatures, from the GLORYS12v1 reanalysis and AZMP observations, show high correlations (0.68–0.92) in subregions 4–10 with weaker seasonal variations. In subregions 1–3 with stronger seasonal variations, the correlation values (0.53–0.67) are relatively low but are still statistically significant. It is also notable that the reanalysis overestimates the observed July bottom temperature in subregions 1–3, while it slightly underestimates or obtains similar values as the observations in subregions 4–10.
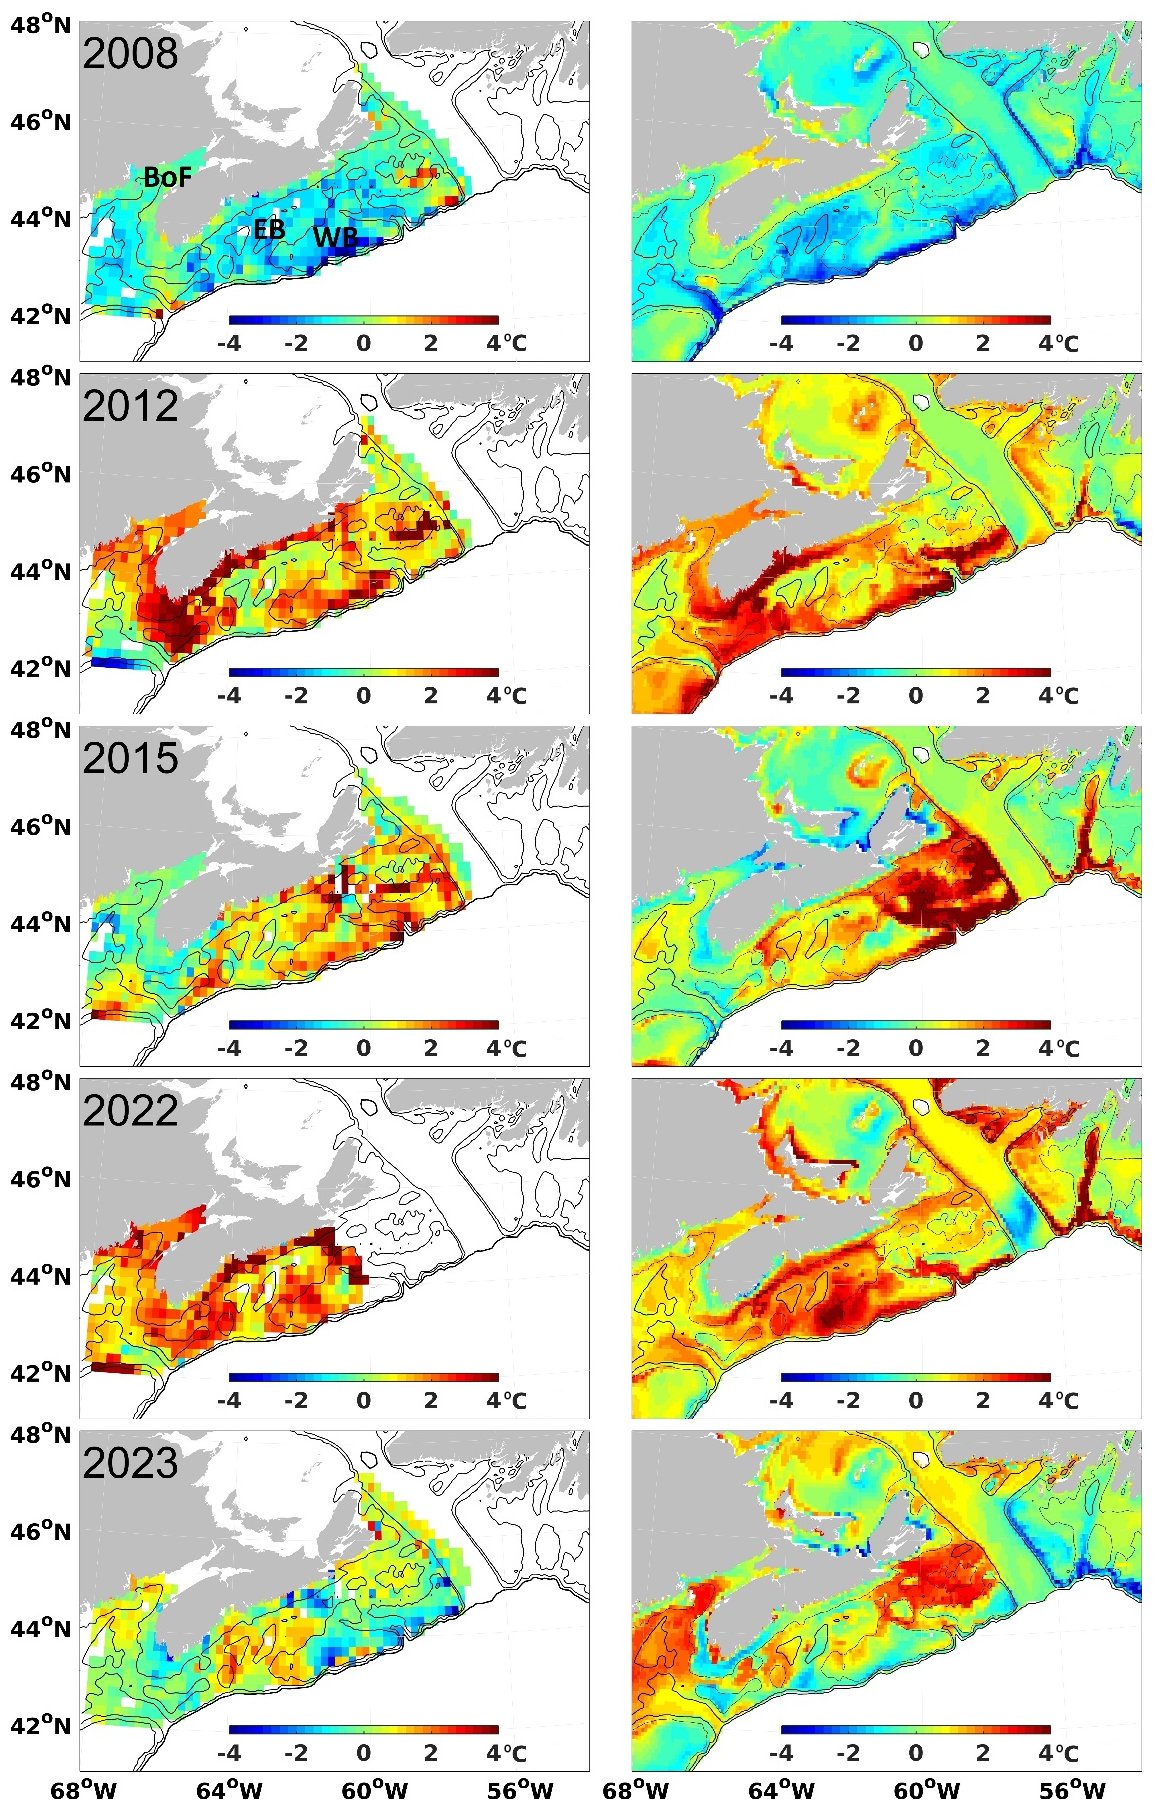
Figure 2Spatial distributions of bottom temperature anomalies (°C) in July of 2008, 2012, 2015, 2022 and 2023 from (left) AZMP observations (product ref. no. 3) and (right) GLORYS12v1 reanalysis (product ref. no. 2) for regions with water depth less than 500 m. Bathymetry contours of 131 and 500 m are overlaid. “BoF”, “EB” and “WB” in the top-left panel denote the locations of the Bay of Fundy, Emerald Basin and the Western/Emerald Banks, respectively. The temperature anomalies are referenced to the July average during 1991–2020 and 1993–2020 for data shown in the left and right columns, respectively.
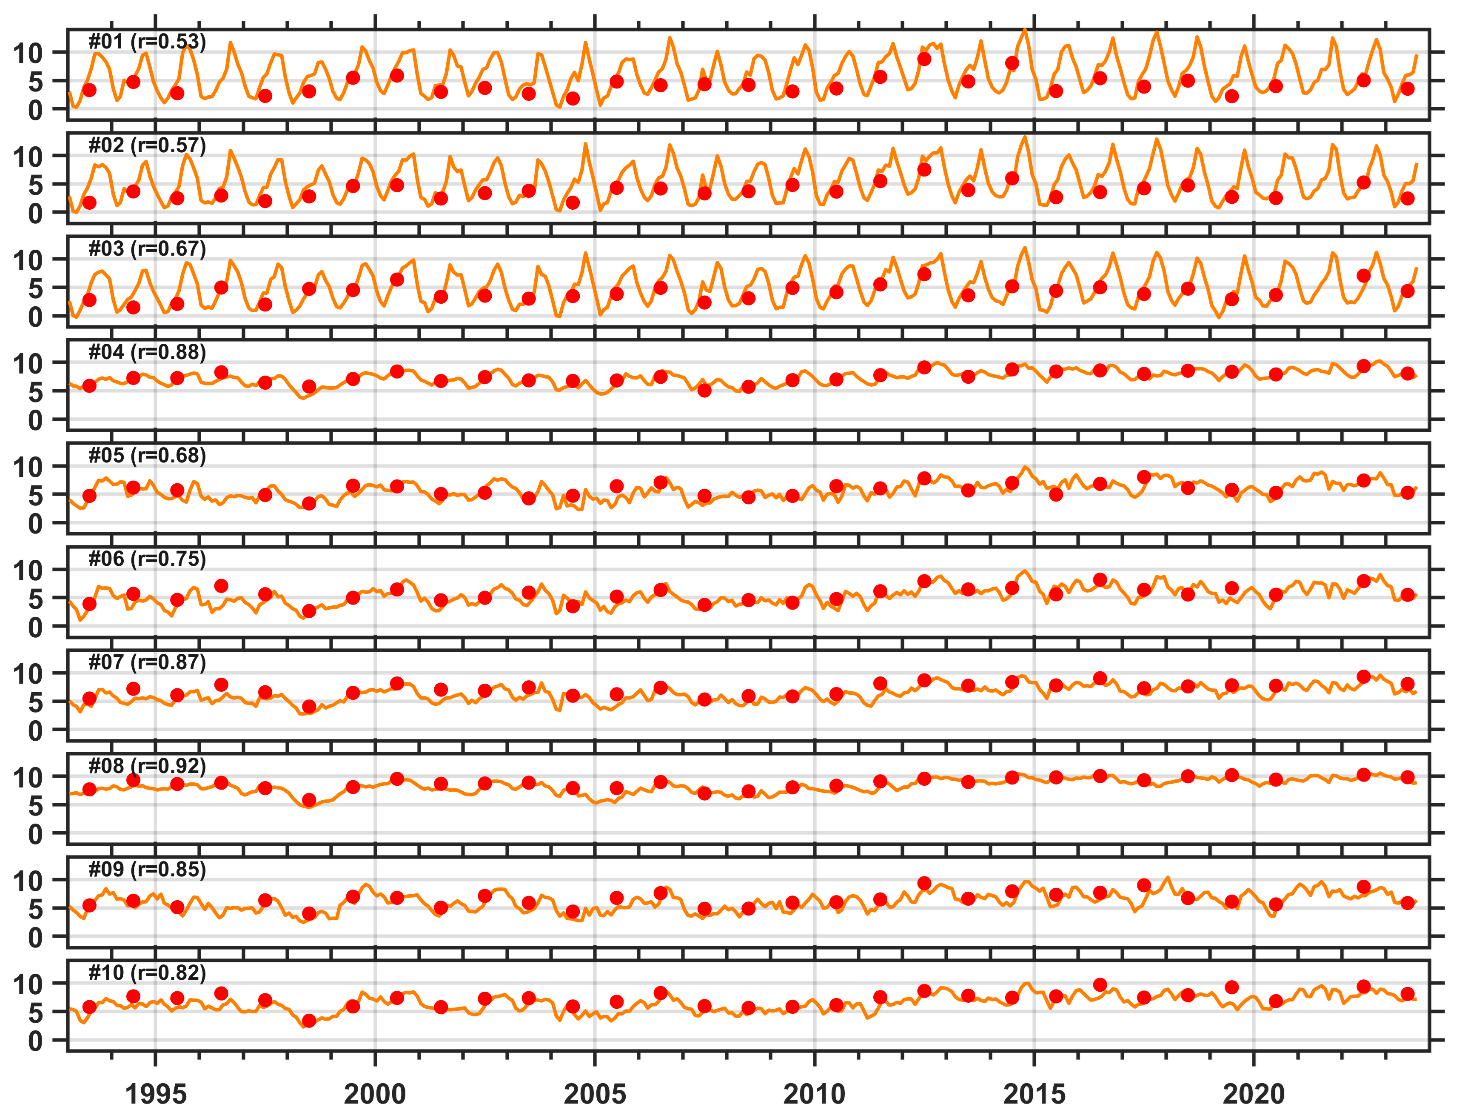
Figure 3Bottom temperatures averaged for each of the 10 subregions of LFA33: (red curves) monthly time from reanalysis (product ref. no. 2) and (solid red circle) July values from observations (product ref. no. 3). The correlation coefficients between the modelled and observed July values are indicated by the r values in each panel.
Figure 1b compares the observed bottom temperature during the lobster fishing season (product ref. no. 4) and the corresponding values from the GLORYS12v1 reanalysis in the form of “violin plots”. The observations are matched to the GLORYS12v1 data values by date and nearest-neighbour distances across each of the subregions within LFA33 during the lobster fishing season (December–May). The matching requires the distance between an observation location and reanalysis grid to be less than 5 km. The overall median difference between observations (n=28 794) and the reanalysis is 0.13 °C. Bottom temperatures in the westernmost, inshore and mid-shore subregions (1, 2, 5 and 6) are lower in the observational data than the reanalysis (median difference −0.26 °C), whereas in the offshore and eastern subregions (3, 4, 7, 8, 9 and 10) the observational data are higher (median difference 0.18 °C). Although the median differences are quite low, point differences ranged between ±10 °C.
In summary, evaluations with available observational data suggest that space–time variations in bottom temperatures from GLORYS12v1 on the SS are quite realistic and are hence used to analyze the relationship between variations in bottom temperature and lobster CPUE in LFA33.
3.2 Relationship between variations in bottom temperature and lobster catch rate off southwestern Nova Scotia
Separate analyses are performed to explore (1) the relationship between the temperature changes within the fishing season and lobster CPUE and (2) the development of standardized CPUE indices with and without annual and seasonal bottom temperature corrections on the overall catch rate trends.
The first analysis focuses on the first 60 d of the fishing season (from mid-November to mid-January). As lobsters moult and grow during summer months, the lobster fishery in this area is considered a recruitment fishery (i.e., a large component of the fishery catch are lobsters having reached minimum legal size that year). As an example, Fig. 1c shows the time series of the lobster CPUE and bottom temperature in subregion 5 during 2008–2023. Prior to the fishing season the fishable biomass can be considered an unfished state and sea bottom temperatures remain high (from seasonal increases in spring and summer); hence the CPUE is maximized at the start of each fishing season. The CPUE rapidly decreases over the course of the first half of the fishing season (till mid-January) due to depletion (cumulative removal of individuals through harvesting) and the cooling of bottom water.
The decreasing rates of both CPUE and bottom temperature have interannual variations. The rate of CPUE change is assumed to be independent of the initial size of the harvestable lobster stock. Its relationship with the bottom temperature, if identified, indicates the impacts the interannual variations in bottom temperature on the fishery performance. Here we adopt a hierarchical generalized linear modelling (HGLM; Lee and Nelder, 1996) approach to explore such a relationship. In our analysis, different quantifications of the bottom temperature, e.g., the mean, median and rates of changes, have been tried. The highest correlation is found between the rates of change in bottom temperature and CPUE, and the HGLM analysis between them is formulated as follows.
For each subregion (j) and each year (i), the rates of changes in CPUE and bottom temperature are denoted as Ci and STi, respectively. The HGLM describes their relationship in each subregion and takes account of the random spatial effects on both the intercept β0 and the slope β1, denoted as αj[i] and γj[i], which are specified as a normal distribution (N) with mean 0 and variance and respectively.
The daily values of bottom temperature from GLORYS12v1, averaged for each subregion, are obtained, and then the rate of change (STi) is estimated through linear regression. For the CPUE, the logbook data can be variable in both the number of observations and the scale of fishing with time and in different subregions. Hence, in each subregion the rate of change in CPUE (Ci) over the first 60 d of each fishing season is estimated using weighted robust linear regression, with the total trap hauls being used as the weighting variable.
Positive relationships between Ci and STi are found in the majority of the subregions of LFA33 (Fig. 4). The annual values of Ci and STi are within confidence intervals of the HGLM-derived relationship obtained in subregions 1, 2, 3 and 6. This positive relationship is less evident in subregions 4 and 8, where the fishery is likely occurring in smaller areas of the subregions.
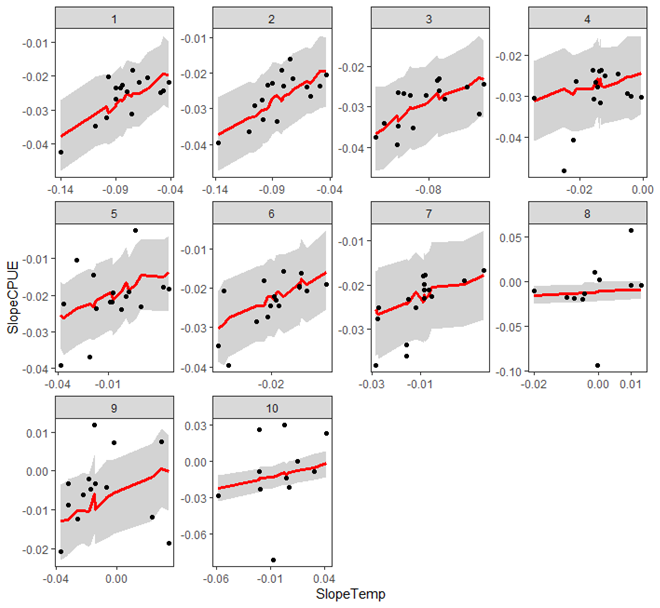
Figure 4The slope of lobster CPUE (CPUE per day, y axis) versus slope of bottom temperature from GLORYS12v1 (°C d−1, x axis) during the first 60 d of the fishing season in subregions 1–10 of LFA33. Dots represent data from different years, and the red lines are the relationship obtained by applying the HGLM approach, with the shading denoting the confidence intervals.
In the second analysis, two generalized additive models (GAMs; Wood, 2017) for standardizing lobster CPUE are developed, one as the “base-line” model without incorporating bottom temperature and the other as the “temperature-corrected” model, denoted as CM and CMT respectively. GAMs are chosen as they do not force a functional shape to the relationships (i.e., linear, quadratic) between dependent and independent variables; they rather use penalized splines (denoted as s) to allow flexible relationships. The CM model is
and the CMT model is
where subscripts i and j represent the year and sub-region, and k represents the day of fishing season. In the above equations, Dijk denotes the date corresponding to the day of the fishing season which varies with i,j and k; Yij represents the year variable that varies with i and j only; εijk represents a random error term; and Tijk is the bottom temperature included in the CMT model. We focus on the conditional predictions from both models for a fixed day 10 of the fishing season (when CPUE is the highest). For CMT, Tijk is replaced by the catch-adjusted mean temperature across all years and all subregions on day 10 of the fishing season, calculated as
where Cij10 is the CPUE for day 10. The catch-adjusted mean temperature is used to account for the uneven distribution of the fishing effort and catch and thus to ensure that the predictions from CMT with the impacts of bottom temperature included can be meaningfully compared with the predictions of CM.
Figure 5 compares the annual time series of the standardized CPUE indices from CM and CMT on day 10 of the fishing season averaged for all the 10 subregions of LFA33. The deviance of CPUE data explained by CMT is 59.6 %, 5.8 % higher than 53.8 % by CM. Evident differences between the CM and CMT annual CPUE indices result from differences in bottom temperature: CPUE estimates from CM are higher than those from CMT in years when bottom temperatures are higher. Essentially, the temperature standardization accounts for the effects of warmer or cooler waters on the catch rates and thus improves the relationship between CPUE and fishable biomass.
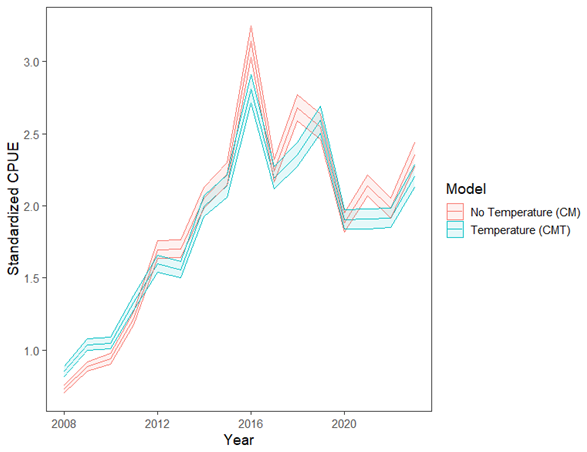
Figure 5Modelled index of annual lobster CPUE for LFA33 with (blue) and without (red) bottom temperature as a predictor variable. The solid line represents mean effect, whereas shaded polygons represent the 95 % confidence bounds.
The state-of-the-art ocean reanalysis (product ref. no. 2) is seen to provide the information required to develop better models describing changes in fishable biomass for American lobster stocks which will reduce uncertainty in fishery advice and potentially lead to more sustainable fisheries. This reanalysis product meets the criteria of being unbiased, being available in near-real time, and having sufficient spatial and temporal resolution. Due to complex regional oceanographic processes under the influence of various forcing factors, observational data are insufficient to fully quantify the space–time variations in ocean conditions on the Scotian Shelf and are even more sparse during the lobster fishing season from late autumn to early spring. In this study, evaluation shows that this data-assimilative reanalysis is able to reproduce the features of variations derived from available observations during 1993–2023 on the Scotian Shelf, where the influences of tidal mixing are relatively weak. The agreement is less satisfactory in the adjacent Bay of Fundy where tidal mixing is strong, while the ocean model used to generate the reanalysis does not include tidal mixing.
The evaluation results encourage the application of the reanalysis product to explore the relationship between the variations in sea bottom temperature and lobster catch rate within LFA33. Both lobster CPUE and bottom temperatures have strong seasonal variations, and the rapid decrease in CPUE during the first half of the season (mid-November to mid-January) can be partially described by the decreasing bottom temperature. Focusing on the CPUE changes during the initial 60 d of the fishing season (independent of stock size), a hierarchical generalized linear modelling approach (accounting for random spatial effects) is applied to explore the relationship between the rate changes in the CPUE and the rate of changes in the bottom temperature in the 10 subregions. Clear positive relationships between the two rates are found in the majority of the subregions. This relationship is consistent with the previous understanding that cold bottom temperature anomalies reduce the movement of lobsters and hence the catch rate. The relationship is strong in subregions 1, 2, 3 and 6 but is less tight in subregions 4 and 8, which can partially be attributed to the smaller spatial extent of fishing within those subregions. This result is congruent with previous reports which indicate that sea temperatures can play a role in fishery performance (e.g., Wright and Liu, 2024). Factors other than bottom temperatures (such as increases in fishing efficiency through advances in technology) also affect the relationship between CPUE and biomass. Though estimated values of CPUE indices will decrease during warm events and increase during cooling events, these other factors are more difficult to quantify and are likely unidirectional as the fishing industry strives to increase CPUE whenever possible. That said, the incorporation of bottom temperature effects on CPUE represents a valuable contribution to the development of stock assessment advice and an improved understanding of the dynamics of lobster populations.
Other quantitative measures of the lobster CPUE data (i.e., in different stages of the lobster fishing season) and their relationship with variations in sea bottom temperature will be further explored in ongoing studies. The outcomes of this model evaluation and relationship analysis encourage further applications of multi-decadal ocean reanalysis products to study changes in the marine ecosystems and fisheries. Furthermore, this also encourages the ongoing development and improvement of ocean forecasts for potentially predicting future changes in marine ecosystems and fisheries, a product with wide-reaching socioeconomic value.
The data used in this study are available as described in Table 1. The code used in this study can be accessed via a GitLab repository upon request via email to the corresponding author.
AMC and YL led the conceptualization of the study and the writing of the manuscript. AMC contributed to the collection and compiling of lobster data and bottom temperature data during the lobster fishing season, the analysis on relationship between the lobster catch rate and bottom temperature, and the writing of the above aspects. XH carried out the evaluation of GLORYS12v1 with the AZMP survey data. DH and CL provided the AZMP data. All authors contributed to the conceptualization of the study and editing and reviewing the manuscript.
At least one of the (co-)authors is a member of the editorial board of State of the Planet. The peer-review process was guided by an independent editor, and the authors also have no other competing interests to declare.
The Copernicus Marine Service offering is regularly updated to ensure it remains at the forefront of user requirements. In this process, some products may undergo replacement or renaming, leading to the removal of certain product IDs from our catalogue. If you have any questions or require assistance regarding these modifications, please feel free to reach out to our user support team for further guidance. They will be able to provide you with the necessary information to address your concerns and find suitable alternatives, maintaining our commitment to delivering top-quality services.
Publisher’s note: Copernicus Publications remains neutral with regard to jurisdictional claims made in the text, published maps, institutional affiliations, or any other geographical representation in this paper. While Copernicus Publications makes every effort to include appropriate place names, the final responsibility lies with the authors.
We appreciate DFO and Mercator Ocean International for supporting the scientific exchanges and collaboration between the staff of both organizations – in recent years under a collaborative agreement. Karina Von Schuckmann provided insightful comments and advice on developing the manuscript, and Nancy Soontiens and Ben Zisserson served as internal reviewers for the manuscript. Comments and suggestions from anonymous reviewers improved the quality and readability of the manuscript.
This paper was edited by Pierre-Marie Poulain and reviewed by two anonymous referees.
Brickman, D., Hebert, D., and Wang, Z.: Mechanism for the recent ocean warming events on the Scotian Shelf of eastern Canada, Cont. Shelf Res., 156, 11–22, https://doi.org/10.1016/j.csr.2018.01.001, 2018.
Cook, A. M., Hubley, P. B., Denton, C., and Howse, V.: 2018 Framework Assessment of American Lobster (Homarus americanus) in LFA 27–33. DFO Can. Sci. Advis. Sec. Res. Doc. 2020/017, vi + 251 pp., https://waves-vagues.dfo-mpo.gc.ca/library-bibliotheque/40946204.pdf (last access: 21 August 2024), 2020.
Crossin, G. T., Al-Ayoub, S. H. Jury, S. H., Howell, W. H., and Watson, W. H.: Behavioral Thermoregulation in the American Lobster Homarus Americanus, J. Exp. Biol., 201, 365–374, https://doi.org/10.1242/jeb.201.3.365, 1998.
DFO: Oceanographic Conditions in the Atlantic Zone in 2022, DFO Can. Sci. Advis. Sec. Sci. Advis. Rep. 2023/019, https://waves-vagues.dfo-mpo.gc.ca/library-bibliotheque/41188792.pdf (last access: 15 August 2024), 2023.
Drévillon, M., Fernandez, E., and Lellouche, J. M.: EU Copernicus Marine Service Product User Manual for the Global Ocean Physics Reanalysis, GLOBAL_MULTIYEAR_PHY_001_030, Issue 1.5, Mercator Ocean International, https://catalogue.marine.copernicus.eu/documents/PUM/CMEMS-GLO-PUM-001-030.pdf (last access: 19 March 2024), 2023a.
Drévillon, M., Lellouche, J. M., Régnier, C., Garric, G., Bricaud, C., Hernandez, O., and Bourdallé-Badie, R.: EU Copernicus Marine Service Quality Information Document for the Global Ocean Physics Reanalysis, GLOBAL_MULTIYEAR_PHY_001_030, Issue 1.6, Mercator Ocean International, https://catalogue.marine.copernicus.eu/documents/QUID/CMEMS-GLO-QUID-001-030.pdf (last access: 19 March 2024), 2023b.
EU Copernicus Marine Service Product: Global Ocean Physics Reanalysis, Mercator Ocean International [data set], https://doi.org/10.48670/moi-00021, 2023.
Government of Canada: Atlantic Zone Monitoring Program (AZMP), Government of Canada [data set], https://www.dfo-mpo.gc.ca/science/data-donnees/azmp-pmza/index-eng.html, last access: 18 August 2024.
Hebert, D., Layton, C., Brickman, D., and Galbraith, P. S.: Physical Oceanographic Conditions on the Scotian Shelf and in the Gulf of Maine during 2023, Can. Tech. Rep. Hydrogr. Ocean Sci. 380, vi + 71 pp., https://publications.gc.ca/collections/collection_2024/mpo-dfo/Fs97-18-380-eng.pdf (last access: 18 August 2024.
Lee, Y. and Nelder, J. A.: Hierarchical Generalized Linear Models, J. Roy. Stat. Soc. B Met., 58, 619–56, https://doi.org/10.1111/j.2517-6161.1996.tb02105.x, 1996.
Lellouche, J. M., Greiner, E., Bourdallé-Badie, R., Garric, G., Melet. A., Drévillon, M., Bricaud, C., Hamon, M., le Galloudec, O., Regnier, C., Candela, T., Testut, C.-E., Gasparin, F., Ruggiero, G., Benkiran, M., Drillet, Y., and Le Traon, P.-Y.: The Copernicus Global ° Oceanic and Sea Ice GLORYS12 Reanalysis, Front. Earth Sci. 9, 698876, https://doi.org/10.3389/feart.2021.698876, 2021.
Loder, J. W., Petrie, B., and Gawarkiewicz, G.: The coastal ocean off north- eastern North America: A large-scale view, in: The Sea, edited by: Robinson, A. R. and Brink, K. H., 11, Wiley, New York, 105–133, ISBN-13 978-0674017412, 1998.
McLeese, D. W.: Effects of Temperature, Salinity and Oxygen on the Survival of the American Lobster, J. Fish. Res. Board Can., 13, 247–72, https://doi.org/10.1139/f56-016, 1956.
McLeese, D. W. and Wilder, D. G.: The Activity and Catchability of the Lobster (Homarus americanus) in Relation to Temperature, J. Fish. Res. Board Can., 15, 1345–1354, https://doi.org/10.1139/f58-073, 1958.
Wang, Y., Sheng, J., and Lu, Y.: Examining tidal impacts on seasonal circulation and hydrography variability over the eastern Canadian shelf using a coupled circulation-ice regional model, Prog. Oceanogr., 189, 102448, https://doi.org/10.1016/j.pocean.2020.102448, 2020.
Wiber, M. G. and Barnett, A.: (Re)Assembling Marine Space: Lobster Fishing Areas under Conditions of Technological and Legal Change in Atlantic Canada, Sci. Technol. Hum. Val., 48, 500–524, https://doi.org/10.1177/01622439211042416, 2023.
Wood, S. N.: Generalized Additive Models: An Introduction with R, 2nd edn., Chapman & Hall/CRC, https://doi.org/10.1201/9781315370279, 2017.
Wright, D. and Liu, Y.: Assessing the Impact of Environmental Variability on Harvest in a Heterogeneous Fishery: A Case Study of the Canadian Lobster Fishery, Journal of Environmental Economics and Policy, 13, 55–69, https://doi.org/10.1080/21606544.2023.2207535, 2024.
Zisserson, B. and Cook, A.: Impact of bottom water temperature change on the southernmost snow crab fishery in the Atlantic Ocean, Fisheries Res., 195, 12–18, https://doi.org/10.1016/j.fishres.2017.06.009, 2017.