the Creative Commons Attribution 4.0 License.
the Creative Commons Attribution 4.0 License.
 | 30 Sep 2024 | OSR8 | Chapter 4.7
Monitoring the record-breaking wave event in Melilla harbour (SW Mediterranean Sea)
Pablo Lorente
Marta de Alfonso
Pilar Gil
Fernando Manzano
Anna Magdalena Matulka
Begoña Pérez-Gómez
Susana Pérez-Rubio
M. Isabel Ruiz
During 4–5 April 2022, a record-breaking wave storm hit Melilla harbour (SW Mediterranean Sea) with the violent overtopping of breakwaters. This unprecedented episode was compared against the six most extreme events previously registered by the Melilla coastal buoy during 2011–2022 to disentangle their common atmospheric driving mechanisms. A dipole-like sea level pressure (SLP) pattern, characterised by two adjacent (northwestern) high- and (southeastern) low-pressure systems, induced intense easterly winds and high waves over the entire SW Mediterranean Sea. The record-breaking 2022 event differed from the rest in the much stronger SLP gradient (2 Pa km−1) and northeasterly winds (above 20 m s−1), which concurrently gave rise to a maximum significant wave height (SWHo) and mean period (Tm) of 7.32 m and 9.42 s, respectively, beating previous historical records. The associated return period decreased from 53 to 25 years, which must be considered for updated security protocols and the sound design of future port facilities. Hourly observations from the Melilla tide gauge covering the 2011–2022 period were used to investigate the relationship between offshore energetic waves penetrating into the harbour and the sea state inside. The harbour agitation, which also reached a record-breaking value (1.41 m) during the storm, was proved to be modulated by both the offshore SWHo (correlation coefficient of 0.87) and Tm. The highest values of agitation (above 1 m) were registered for incident high waves coming from the angular sector between 50 and 70° (clockwise from true north) with Tm and peak period (Tp) values above 7 and 10 s, respectively. By contrast, the astronomical tide and the storm surge had negligible effects on harbour agitation during the seven extreme wave events. Infragravity waves, with periods between 30 and 300 s and maximum values up to 0.58 m during the 2022 storm, were also detected within the harbour basins and exceeded previously reported peaks. The energy in the infragravity band (IGE) was significantly correlated (0.96) with an offshore forcing parameter proportional to SWH ⋅ Tp, evidencing that energetic swell was responsible for the highest IGE values (above 2000 m2 s). Furthermore, a 30-year (1993–2022) regional wave reanalysis was used to characterise the intra-annual variability in the 99th percentile of SWHm over the Alborán Sea on a monthly timescale and identify the existence of trends. Results revealed that the intensity of extreme wave events impacting Melilla harbour and surrounding areas increased for April, while observed trends indicate a significant decrease of the 99th percentile of SWHm for June and October. Finally, outcomes from this work could be useful for implementing a multi-hazard early warning system and ad hoc mitigation plans within the harbour territory.
- Article
(5836 KB) - Full-text XML
- BibTeX
- EndNote


Over recent decades, climate change and extreme weather events have attracted growing public concern and political attention due to their widespread detrimental impact on the marine environment and human well-being (Konisky et al., 2015). While the global ocean is already experiencing anthropogenically driven variations such as gradual warming, acidification, and sea level rise (IPCC, 2022), sustained pressure from climate change is even more significant in semi-enclosed basins like the Mediterranean Sea (Chiggiato et al., 2023; Juza and Tintoré, 2021) and also in exposed sectors like harbour systems (Verschuur et al., 2023; Izaguirre et al., 2021).
Table 1Products from the Copernicus Marine Service and other complementary datasets used in this study, including the Product User Manual (PUM) and Quality Information Document (QUID). For complementary datasets, the links to the product description, data access, and scientific references are provided. Last access for all web pages cited in this table: 11 January 2024.
The Mediterranean Sea has long been recognised as a vulnerable climate change hot spot (Tuel and Eltahir, 2020), seriously jeopardised by marine pollution episodes or litter accumulation (Soussi et al., 2020; Ramirez-Llodra et al., 2013). This region is often affected by marine heat waves, mass mortality events, and violent hazards, ranging from storm surges and flash floods to rogue waves and medicanes (Dayan et al., 2023; Clementi et al., 2022; Garrabou et al., 2022; Milglietta and Rotunno, 2019; Wolff et al., 2018; Cavaleri et al., 2012). To serve as examples, Medicane Zorbas (2018) and Storm Gloria (2020) caused several casualties and multi-million-euro damage in susceptible coastal areas (Lorente et al., 2021; de Alfonso et al., 2021; Pérez-Gómez et al., 2021; Sotillo et al., 2021; Scicchitano et al., 2021).
Consequently, there is an increasing awareness not only of the potential anthropogenic influence on the intensity of these extreme weather episodes (Eyring et al., 2021) but also of the unavoidable need to gain deeper insight into the underlying physical processes, already identified as one of the World Climate Research Programme's Grand Challenges (WCRP website, 2024). The accurate monitoring of extreme events is crucial for implementing adaptation policies and adopting prevention strategies that should eventually result in the enhancement of coastal communities' resilience (Linnenluecke et al., 2012). In response to this requisite, successive editions of the Copernicus Ocean State Report initiative have traditionally placed special emphasis on the multi-parameter analysis of severe sea states previously occurring in the Mediterranean Basin (Álvarez-Fanjul et al., 2022; Clementi et al., 2022; Giesen et al., 2021; de Alfonso et al., 2020; Berta et al., 2020; Bensoussan et al., 2019; Notarstefano et al., 2019; Kokkini and Notarstefano, 2018).
Recent initiatives like ECCLIPSE (assEssment of CLImate change in Ports of Southwest Europe) Interreg Sudoe project (ECCLIPSE website, 2024) have focused on analysing the impact of climate change on seaports. Although this topic has historically received less consideration than the corresponding impact for beach systems (Sánchez-Arcilla et al., 2016a), the central role of ports in countries' growth and a globalised economy have motivated a plethora of new studies (Portillo Juan et al., 2022; Izaguirre et al., 2021), some of them devoted to the Mediterranean Sea (Sierra et al., 2015 and 2017; Sánchez-Arcilla et al., 2016b). In this sense, one of the main objectives of ECCLIPSE was to establish the fundamentals of a climate change observatory for Spanish ports, aimed at monitoring essential ocean variables and gaining a holistic understanding of violent weather from its physical drivers to its impact on port operability and infrastructure. Climate-driven extreme coastal hazards have been acknowledged as imposing heavy socio-economic tolls, as port downtime leads to a reduction in safety levels and wide trade losses due to the interruption of both the maritime transport and global supply-chain networks (Verschuur et al., 2022).
Following in the footprints of ECCLIPSE, this work attempts to characterise the record-breaking storm that hit the Alborán Sea (SW Mediterranean Sea; Fig. 1a) with wave heights above 7 m during 4–5 April 2022 and evaluate the energetic response of Melilla harbour basins (Fig. 1b) under the penetrating wave action. Port operations were disrupted as a precaution due to the prevailing harsh weather conditions and the violent overtopping of breakwaters. While one ship was evacuated from its berth and later sheltered at the lee of the Ras Taksefi cape (Fig. 1b), structural damages were reported in the seawall tip and in several boats and marina pontoons.
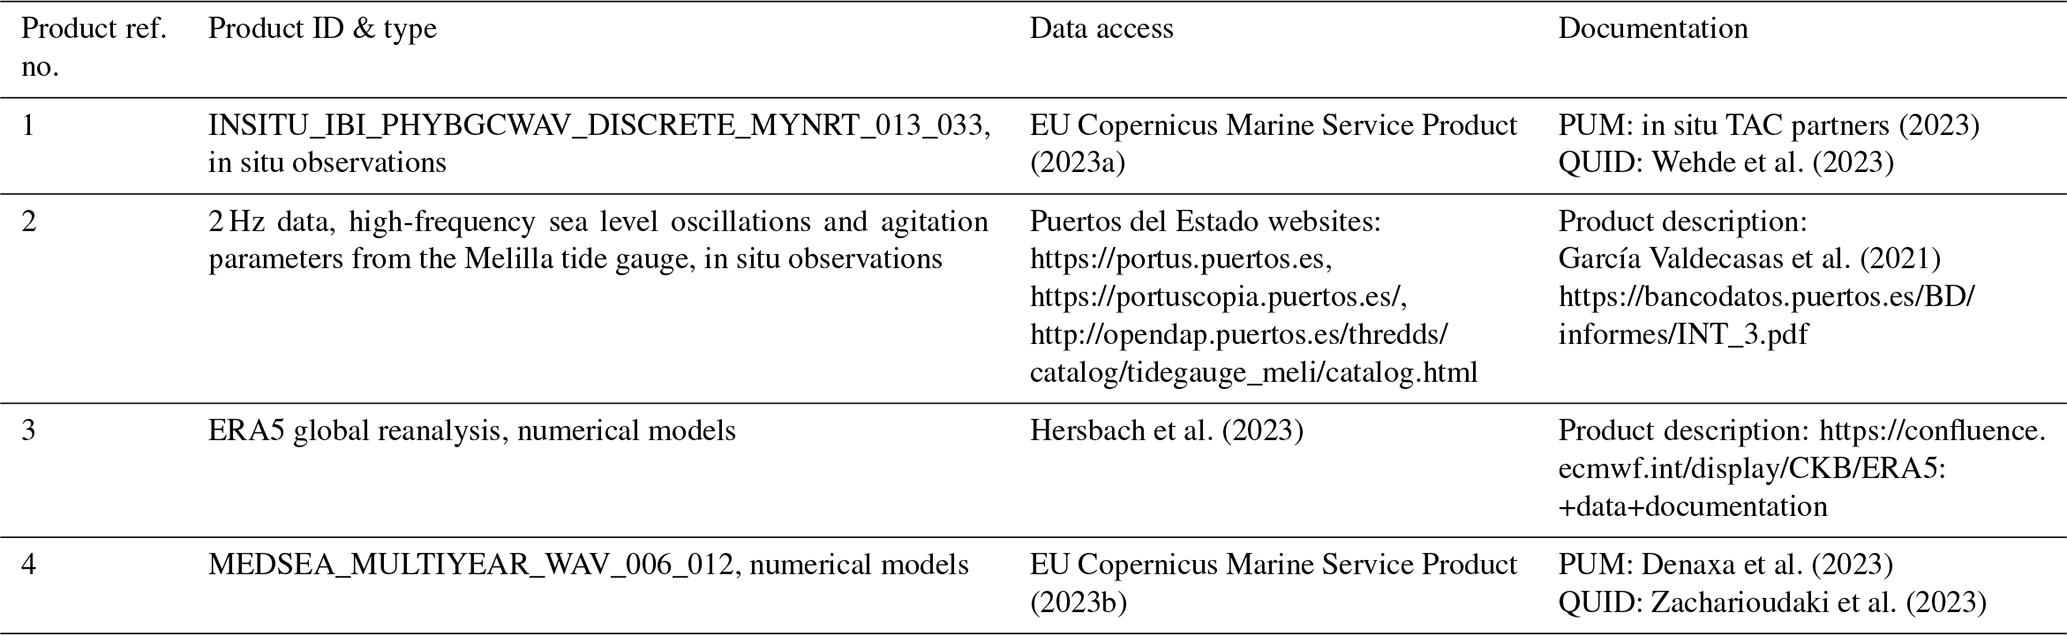
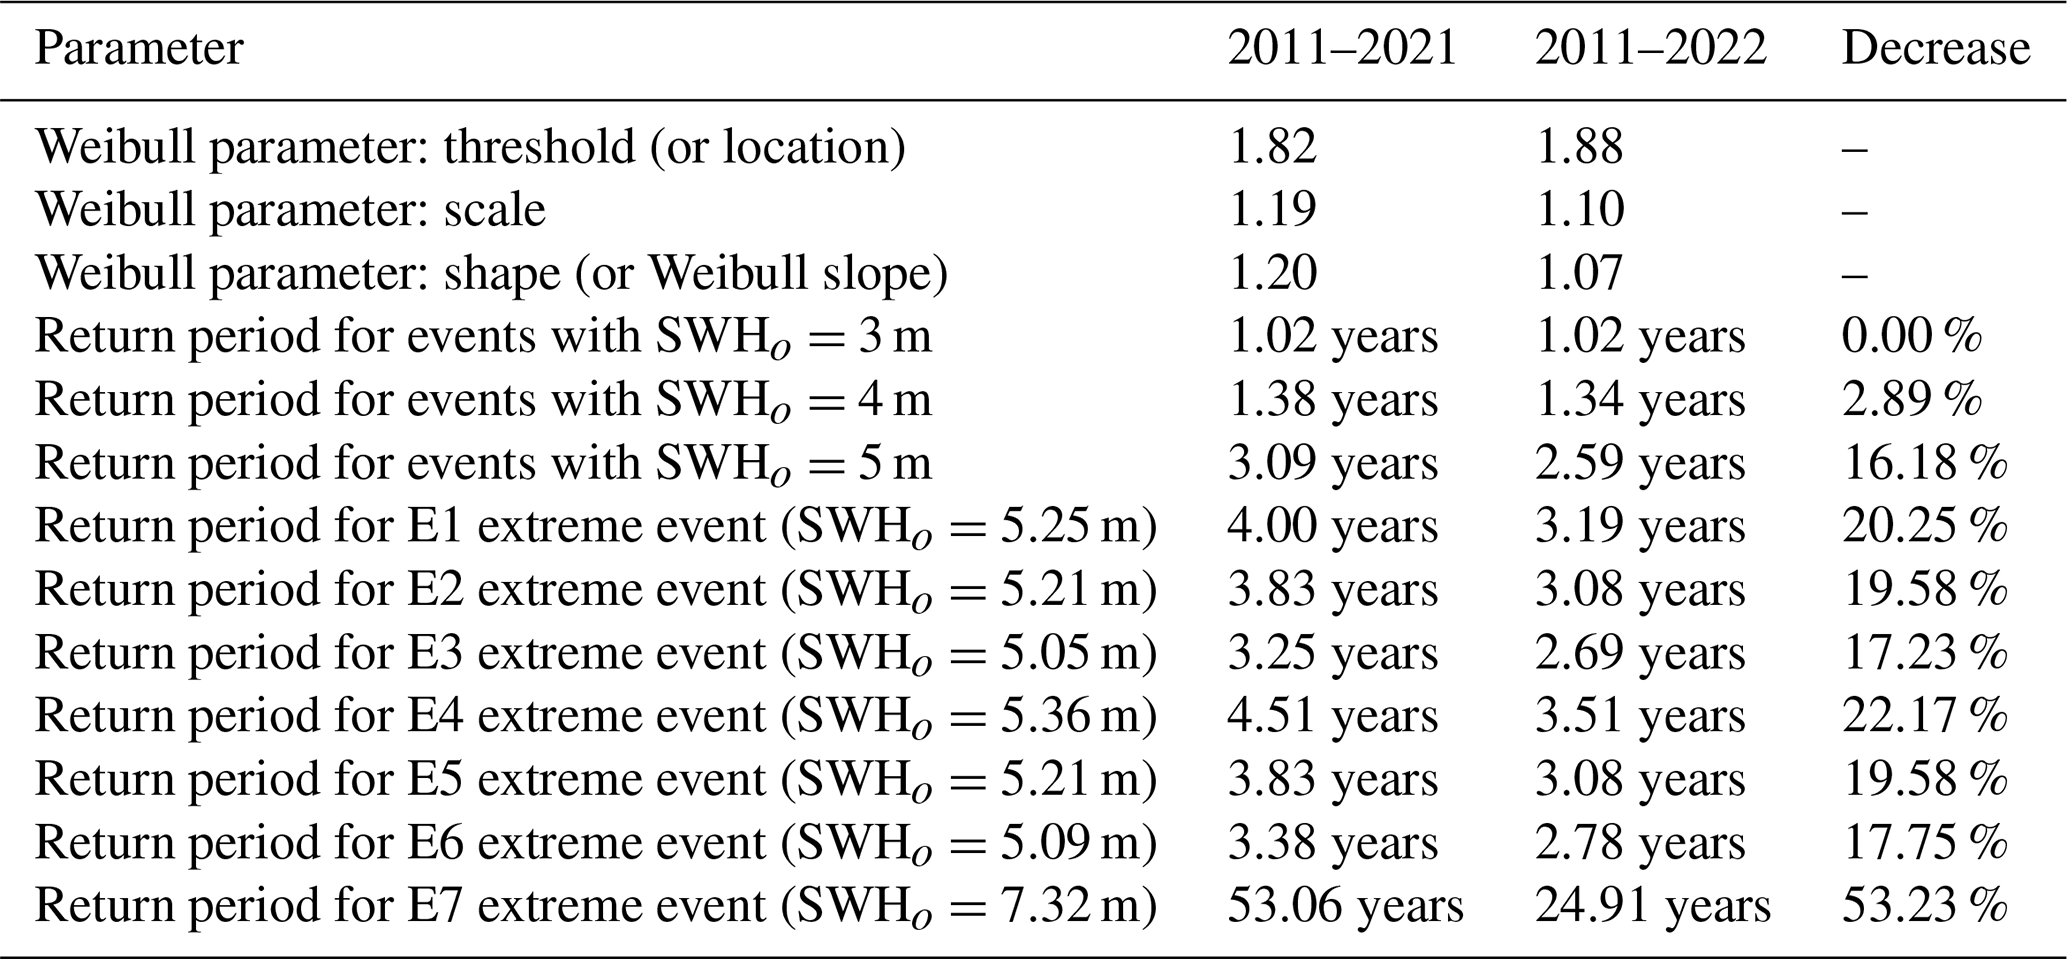
Figure 1Wave storm in the SW Mediterranean Sea. (a) Hourly map (4 April 2022, 21:00 local time) of SWHm on a synoptic scale during the peak storm as derived from ERA5 reanalysis (product ref. no. 3 in Table 1). (b) Hourly map of SWHm and MWDm on a coastal scale during the peak storm as derived from MED reanalysis (product ref. no. 4 in Table 1). Isobath depths are labelled every 50 m. The magenta dot and the magenta square represent the Melilla tide gauge and coastal buoy location, respectively. The green triangle and the green square indicate the location of the Ras Taksefi cape and the grid point of MED reanalysis closest to the Melilla coastal buoy, respectively. In the lower-left corner is the Melilla harbour configuration: map by © ArcgGis. (c) Hourly time series of SWHo and MWHo recorded at the Melilla coastal buoy for 2011–2022 (product ref. no. 1 in Table 1). Black dots and stars indicate the seven extreme events examined, labelled from E1 to E7. The 99.9th (P99.9), 99th (P99), and 95th (P95) percentiles are represented by horizontal dotted black lines. (d) Hourly time series of Tm and Tp for 2011–2022 (product ref. no. 1 in Table 1). (e) Wave rose illustrating the main incoming directions (MWDo) during 2011–2022 – product ref. no. 1 (Table 1). (f) Wave rose showing the MWDo associated with SWHo values above P99 (3.01 m) during 2011–2022.
A retrospective comparison of the present study case to extreme wave events previously registered at the Melilla coastal buoy (Fig. 1b) during 2011–2022 was conducted not only to put the former into a broader historical context but also to disentangle their common driving mechanisms (i.e. the predominant atmospheric conditions on a synoptic scale). The return period associated with these extreme wave episodes, which is defined as the average time interval between two consecutive events exceeding a specific wave height value, was also calculated. This concept is often used in marine engineering for the design of port facilities and the identification of dangerous events, providing a means for rational decision-making and risk assessment (Salvadori et al., 2013). For instance, harbour breakwaters are commonly designed to withstand 100-year-return-period metocean conditions without significant damage while having service lifetimes of similar durations (Todd et al., 2012; Gutiérrez-Serret et al., 2009).
Additionally, following the approach of Pérez-Gómez et al. (2021) for Storm Gloria (2020), high-frequency (2 Hz) sea level data and agitation observations provided by the Melilla tide gauge (Fig. 1b) during 2011–2022 were used to investigate the relationship between offshore energetic conditions and the sea state within the harbour. Precise estimations of agitation (i.e. oscillations within the port due to wind waves) are essential for downtime analysis and efficient port management (Romano-Moreno et al., 2022). Equally, infragravity (IG) waves with periods between 30 and 300 s (Bellafont, 2019; Elgar et al., 1992; Munk, 1950) were examined, since their presence in semi-closed ports of small to intermediate size (where the surface water area and depth are about 1–10 km2 and 5–10 m, respectively) may cause excessive ship motions at berth and unacceptable forces on mooring lines and fenders that could result in ship collisions and significant damage to vessels and port facilities (Costas et al., 2022; Bellotti and Franco, 2011). Under adverse circumstances, IG waves can be highly amplified by the basin geometry due to resonant processes (commonly referred to as seiches), resulting in large water level fluctuations and strong horizontal currents that disturb port operations (unsafe and inefficient cargo activities) and negatively impact cost–time efficiency (López and Iglesias, 2014; Okihiro et al., 1993).
Finally, a 30-year (1993–2022) regional wave reanalysis product developed in the framework of the Copernicus Marine Service for the Mediterranean Sea was analysed to characterise the spatiotemporal variability in the long-term extreme wave climate along the Alborán Sea. The intra-annual variability in the 99th percentile (P99 hereinafter) for the significant wave height was examined over this subregion on a monthly timescale to identify potential trends, thereby complementing similar studies previously focused on the intra-seasonal (Barbariol el al., 2021) or the inter-annual (Zacharioudaki et al., 2022; Morales-Márquez et al., 2020) climate variability in extreme waves in the entire Mediterranean Basin.
This work is structured as follows: Sect. 2 outlines the observational and modelled data sources. Section 3 describes the methodology adopted. Results are presented and discussed in Sect. 4. Finally, principal conclusions are drawn in Sect. 5.
All the observational and modelled datasets used in this study are briefly described below. Complementary information about them is gathered in Tables 1 and 2.
Table 2Complementary information about the data sources used in this study.
2.1 In situ observational data
Although the two in situ instruments used in this work were deployed before 2009, the time span for the observational datasets was standardised to 2011–2022 for consistency reasons, as the collection of directional wave data started on April 2010 (Table 2).
2.1.1 Melilla coastal buoy
A Datawell scalar buoy was moored at 15 m depth in April 2008, close to Melilla harbour (Fig. 1b). It was replaced in April 2010 by a TRIAXYS buoy able to provide directional information. This in situ device, operated by Puertos del Estado, collects hourly averaged estimations of diverse wave parameters (product ref. no. 1 in Table 1), encompassing the significant wave height (SWHo), maximum wave height (MWHo), mean period (Tm), peak period (Tp), and incoming mean wave direction (MWDo). The quality control applied to data time series, defined by the Copernicus Marine In situ Team (Copernicus Marine In Situ Team, 2020), consisted of a battery of automatic checks performed to flag and filter inconsistent values. For the Mediterranean Sea, the spike test was based on the difference between sequential measurements of SWHo, Tm, and Tp so they were discarded, respectively, when the difference exceeded 3 m, 4 s, and 10 s. Occasional gaps (not larger than 6 h) were linearly interpolated to ensure the continuity of the records.
2.1.2 Melilla port tide gauge
A radar tide gauge, manufactured by Miros and operated by Puertos del Estado as part of its REDMAR network (Pérez-Gómez et al., 2008 and 2014), was deployed inside of Melilla harbour in October 2007 (Fig. 1b). Quality-controlled 2 Hz sea level data (product ref. no. 2 in Table 1) contain information on sea level oscillations with periods above 1 s, capturing all sea surface height variability including waves, high-frequency sea level oscillations (HFSLOs), and tides. Sea level oscillations with periods over 1 h were extracted using a 10th-order Chebyshev low-pass filter with a cut frequency of , whereas wave agitation (with periods below 30 s) was obtained using an 8th-order Butterworth high-pass digital filter with a cut frequency of . HFSLOs (with periods between 30 s and 1 h) were obtained by subtracting the two previous time series from the raw 2 Hz data signal. Then, a simplified four-band energy spectrum was also calculated to facilitate the understanding of the energy distribution in the HFSLO band: (i) the period between 30 s and 5 min (IG waves), (ii) the period between 5 and 15 min, (iii) the period between 15 and 30 min, and (iv) the period between 30 min and 1 h. For further details about the frequency domain analysis (used to describe how energy is distributed among all frequencies and to determine the most energetic frequency on an hourly basis) and time domain analysis (used to determine the hourly amplitudes of the HFSLO, where the maximum is denoted by HFSLOmax and the average of the highest-third heights is denoted by HFSLO13), the reader is referred to García-Valdecasas et al. (2021). Finally, 20 min estimations of HFSLOmax, HFSLO13, IG wave energy (IGE), and agitation were subsampled at hourly intervals (Table 2) and examined to assess the impact of extreme wave storms inside the harbour. Likewise, hourly estimations of total water fluctuations, astronomical tides, and storm surge component were qualitatively analysed to infer any potential sea level rise that could take place simultaneously (or in close sequence) with the extreme wave storms.
2.2 Modelled data
The time span for the modelled datasets was standardised to 1993–2022 for consistency reasons (Table 2).
2.2.1 ERA5 reanalysis
ERA5 reanalysis (product ref. no. 3 in Table 1), which is generated by the European Centre for Medium-Range Weather Forecasts (ECMWF), provides hourly estimates from 1940 onwards for a large number of atmospheric and oceanic parameters which are regridded, respectively, to a 0.25 and 0.5° regular grid. In this work, hourly maps of modelled sea level pressure (SLP), wind at 10 m height (W10), and significant wave height (SWHm) were analysed on a synoptic scale (26–56° N, 19° W–5° E) for the 1993–2022 period (Table 2) in order to disentangle the common atmospheric configurations that drove the most extreme wave events registered by the Melilla buoy.
2.2.2 Multi-year wave product
The multi-year wave product of the Mediterranean Sea Waves forecasting system (product ref. no. 4 in Table 1) is based on a Wave Model (WAM) suite that predicts hourly wave parameters at a ° horizontal grid resolution. The atmospheric wind forcing used in WAM consists of hourly 0.25° horizontal-resolution ERA5 reanalysis from the ECMWF. The multi-year product consists of a reanalysis dataset (MED reanalysis hereinafter), which spans 1 January 1993 to 31 December 2022, and an interim dataset covering the period after the reanalysis until 1 month before the present. In the present work, only the MED reanalysis was used: hourly SWHm estimations were examined for the selected 30-year period (Table 2) to characterise the spatiotemporal variability in the long-term extreme wave climate affecting the Alborán Sea in general and specifically the Melilla harbour area. Equally, hourly maps of propagation direction (MWDm) were depicted to assess the prevalent wave directionality during the extreme events.
As not all extreme metocean hazards necessarily have destructive impacts on coastal areas, there is not a worldwide consensus on the protocol for their categorisation (Radovic and Iglesias, 2018). In this work, the 99.9th percentile (P99.9 hereinafter) of SWHo for the 12-year time series (2011–2022) provided by the Melilla coastal buoy was used as a threshold to select and chronologically tag a manageable number of extreme wave events that previously occurred. Once shortlisted, these episodes were characterised in terms of intensity (magnitude of diverse wave parameters) and duration (hours above the P99 of SWHo), placing the focus on the joint occurrence of interconnected extremes that might exacerbate the coastal impact compared to individual hazards occurring in isolation. Complementarily, hourly maps of SWHm were depicted to explore if the extreme wave events shared similar synoptic features in terms of severity and spatial distribution.
In order to elucidate the potential existence of a common driving mechanism, the predominant atmospheric conditions (in terms of SLP and W10) on a synoptic scale that led to the record-breaking storm were retrospectively compared to those giving rise to previous extreme wave events. Additionally, the temporal distribution of extreme hourly wave data (above P99) affecting the Melilla area was derived from the 12-year observational time series of SWHo and Tm to elucidate if they showed a relevant preference for a specific stage of the year. The annual cycle was split into six evenly spaced 50 d intervals and a longer 65 d summertime interval that did not negatively impact the consistency of the percentages of occurrence obtained, as extreme wave events during summer remained marginal regardless of the interval length selected.
The return period associated with these extreme wave episodes was derived from hourly time series of SWHo for two different periods: 2011–2021 (before the record-breaking storm) and 2011–2022 (including the storm). For this purpose, we assumed the following:
- i.
An exceedance threshold based on the 95th percentile (P95) value of the dataset following the approach proposed by Harley (2017) and Fanti et al. (2023) for coastal storm analysis.
- ii.
A distance of 5 d between two independent storms. Although there is some subjectivity in how a time series is partitioned into separate storms, the broadly accepted criteria state that the independence between consecutive events is achieved by imposing the separation of storm peaks by a time period longer than 3 d, which is the average lifetime of extra-tropical cyclones (Trigo et al., 1999). For instance, the most intense activity period of Storm Gloria in the western Mediterranean Sea was between 20 and 23 January 2020 (Amores et al., 2020; Lorente et al., 2021). Since adjacent peaks separated by 5 d will correspond to waves generated from different low-pressure systems, meteorologically independent events were identified by applying a moving time window of 5 d length between consecutive storms, in accordance with Mackay and Johanning (2018a and b).
The long-term extreme sea state was characterised by using the Peaks-Over-Threshold (POT) method (Goda, 1988) with the fitting of a three-parameter Weibull probability distribution to the SWHo observations. The POT method is based on extracting, from the recorded time series, those individual storms which surpass the aforementioned exceedance threshold of SWHo at the peak of the storm and are not dependent upon another one due to their proximity in time. The three-parameter Weibull distribution was computed following the approach proposed by de Alfonso et al. (2021) to obtain the return period for the maximum SWHo registered during the selected extreme wave events.
Furthermore, the relationship between offshore sea states and IG waves within Melilla harbour was investigated. Here we focused on the most common type of IG waves: those induced by the non-linear interactions between incident wind short waves (Belloti and Franco, 2011). While IG waves tend to elude human perception in deep waters (heights of the order of a few centimetres), they can abruptly increase near the coastline and even exceed 1 m (Aucan and Ardhuin, 2013), contributing significantly to nearshore processes (beach erosion) and affecting coastal structures (Okihiro et al., 1993). Significant efforts have previously been devoted to analysing the connection between offshore wave parameters and IGE, either at the shore (in the form of run-up) or in the nearshore area (surf zone). While Guza and Thornton (1982) found that the IG component of wave run-up increased linearly with increasing offshore SWHo, Stockdon et al. (2006) concluded that the IG component scaled better with SWHo ⋅ L (where L represents the deep-water wavelength) and was actually independent of the foreshore slope. In the same vein, Senechal et al. (2011) reported that IG wave run-up during extreme storm conditions was significantly less scattered when correlated with SWHo ⋅ L than with SWHo only. By contrast, Inch et al. (2017) reported that nearshore IG waves were best predicted using an offshore forcing parameter that is proportional to SWH ⋅ Tp. These contradictory findings reveal that further research on the subject is required and suggest that nearshore IGE is unlikely to be a function of any single environmental factor (Lashley et al., 2020).
While the four aforementioned field studies focused on low-sloping to mildly sloping sandy beaches, the present work attempts to relate IGE measured within a harbour with offshore wave parameters. To this aim, a rough approximation approach (based on three simplifications) was adopted:
- i.
Local slope effects were not included, similarly to Stockdon et al. (2006).
- ii.
IGE registered at the Melilla tide gauge was scaled with SWH, SWHo ⋅ L, and SWH ⋅ Tp despite the fact that IGE is affected by wave–structure interaction processes (diffraction and reflection, to name the main ones) which are not so relevant on open sandy beaches.
- iii.
Although the Melilla coastal buoy is moored at 15 m depth (d), the deep-water approximation is broadly accepted since the relative depth (defined as ) is above 0.5 for 78 % of the time during 2011–2022 (not shown). Therefore, the wavelength can be defined as , where the gravity acceleration g is 9.8 m s−2. As a consequence, we can derive from point (ii) that IGE was scaled with SWH, SWHo ⋅ , and SWH ⋅ Tp.
Additionally, HFSLO (with periods between 30 s and 1 h) and harbour agitation (with periods below 30 s) data recorded by the Melilla tide gauge during 2011–2022 were thoroughly examined. On the one hand, HFSLO heights observed during the selected extreme events were categorised based on specific IG wave thresholds which are universally common to all locations (McComb et al., 2020; McComb, 2011). This approach is valid since spectra of the 2 Hz data (not shown), generated to identify energetic sea level variability inside the port, were dominated by energy in the IG band during these storms. On the other hand, total seawater levels were examined to disentangle if they exerted a relevant role in the sharp increase in harbour agitation during the extreme wave events and if astronomical tides were thereby enhanced by storm surge effects. In this context, connected extremes are of particular concern for harbour operability, as their individual effects may interact synergistically and cause more damage in port structures than isolated extreme events do (Velpuri et al., 2023).
Finally, potential long-term changes in the extreme sea state climate during the 30-year period analysed (1993–2022) were assessed over the Alborán Sea. As a preliminary step, the accuracy of MED reanalysis was evaluated at the grid point 35.354° N, 2.916° W (denoted by a green rectangle in Fig. 1b) closest to the Melilla coastal buoy and located at a distance of 3450 m. Concurrent estimations of hourly SWHo and SWHm were compared for the period 2011–2022, and the best linear fit of the scatter plot was computed. The statistical metrics used in the present study to compare two datasets included the mean, the standard deviation, and the Pearson correlation coefficient (Emery and Thompson, 2001). Afterwards, maps of linear trend for the P99 of SWHm were obtained over the entire Alborán Sea on a monthly timescale. The attention was particularly focused on the intra-annual variability in order to complement prior research dealing with intra-seasonal and inter-annual variability in extreme waves in the entire Mediterranean Basin (Amarouche et al., 2022a; Barbariol el al., 2021; Zacharioudaki et al., 2022; Morales-Márquez et al., 2020). The presence of temporal trends in the P99 of SWHm time series was evaluated with two well-known non-parametric tests, which have been recently documented as the most used for trend detection in the Mediterranean Sea (De Leo et al., 2023).
- i.
Trends were calculated using the Sen's slope estimator of P99 because it is not subject to the influence of extreme values (outliers); therefore, it is more consistent than simple linear regression methods (Sen, 1968). Although P95 is also commonly used (Fanti et al., 2023), P99 was selected as the reference percentile for the most extreme wave events affecting the Melilla area, in agreement with previous approaches reported in the literature (Zacharioudaki et al., 2022; Barbariol et al., 2021).
- ii.
The statistical significance at the 90 % confidence interval was assessed at each grid point with the Mann–Kendall test (Mann, 1945; Kendall, 1962), in accordance with similar works previously published (Caloiero and Aristodemo, 2021; Barbariol et al., 2021). Afterwards, a specific subdomain (35.02–35.48° N, 2.70–3.00° W) in the vicinity of Melilla harbour was selected, and the statistical significance was spatially averaged to infer if this area is affected by meaningful trends.
4.1 Extreme events analysis
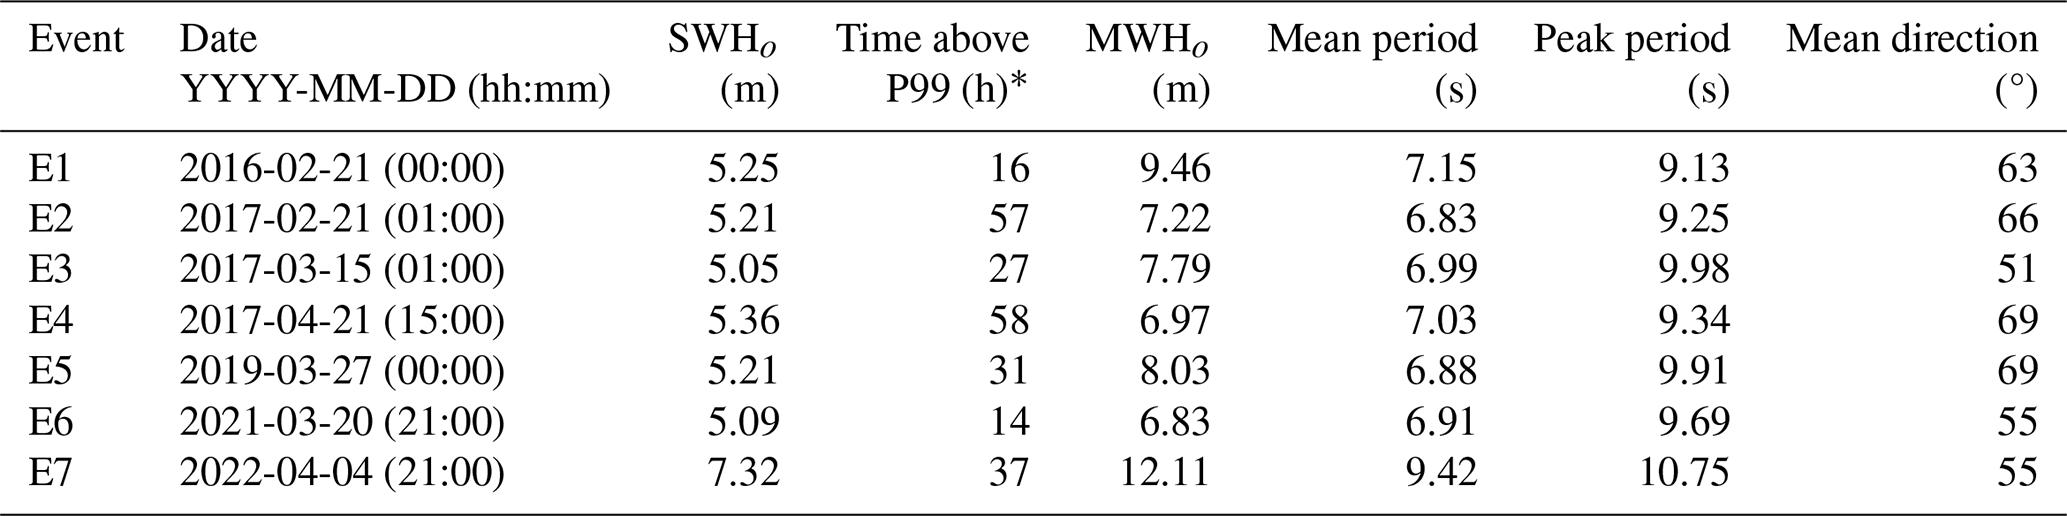
The P99.9 of SWHo (set to 4.45 m and derived from the 12-year time series provided by the Melilla coastal buoy) was used as a threshold to detect the most extreme wave events (Fig. 1c). A total of seven storms were identified and tagged chronologically from E1 to E7. They presented values ranging from 5.05 (E3) to 7.32 m (E7), as shown in Table 3. The associated Tm values, which ranged from 6.83 (E2) to 9.42 s (E7), surpassed the P99 (set to 6.25 s; Fig. 1d). The seven episodes also showed concurrent high values of MWHo and Tp, emerging in the ranges 6.83–12.11 m and 9.13–10.75 s, respectively (Table 3). The storm that hit Melilla harbour during 4–5 April 2022 (E7) exhibited unprecedented values for each wave parameter: the peak of SWHo (7.32 m) was coincident with the greatest values of MWHo (12.11 m) and Tm (9.42 s), jointly beating all previous historical records (Fig. 1c–d). In terms of storm duration (Table 3), defined as the number of consecutive hours above the P99 of SWHo (set to 3.01 m), E1 and E6 were significantly shorter (<20 h) than the long-lasting E2 and E4 events (>50 h). The duration of the E3 and E5 (27–31 h) events can be considered similar to E7 (37 h). From a directional perspective, the prevailing incoming wave directions during 2011–2022 were NE (41 %) and NE–E (43 %), with an overall associated mean value of 58° ± 37° (Fig. 1e). These are the most common origins of waves recorded at the Melilla coastal buoy due to its particular emplacement, sheltered to the east of the Ras Taksefi cape (Fig. 1b). As a result, the shadow effect of this coastal promontory prevents the angular spreading of the storms coming from the westernmost sector. For extreme wave events with SWHo above P99 (3.01 m), the predominant incoming wave direction was NE–E with 72 % of occurrence, whereas the remaining 28 % corresponded to the NE sector (Fig. 1f).
Table 3Characterisation of the seven most extreme wave events registered by the Melilla coastal buoy during the 12-year period analysed (2011–2022).
* Consecutive hours above the 99th percentile of SWHo.
Hourly maps of SWHm for E1–E6 events (Fig. A1) and E7 (Fig. 1a) shared common synoptic features such as the peak of SWHm (above 4.5 m) over the entire Alborán Sea. A secondary peak could be found over the Gulf of Cádiz for the E1, E2, E4, E5, and E7 episodes, while E3 barely showed it. In the case of the E6 event, the peak of SWHm over the easternmost part of the Alborán Sea was not so high (around 4 m) but affected broader areas of the SW Mediterranean Sea. The spatial patterns of SWHm and MWDm, zoomed in on the areas surrounding Melilla harbour (small maps in the lower-right corner of each panel in Fig. A1), revealed a similar visual resemblance for SWHm and a uniform MWDm field from the NE. The record-breaking E7 event stood out from the rest due to the severity of the storm, with SWHm above 5.5 m over the entire Alborán Sea (Fig. 1a) but also in the vicinity of Melilla harbour (Fig. 1b).
4.2 Return period analysis
For the period 2011–2021, the entire hourly time series of SWHo was fitted to a three-parameter Weibull distribution, leading to return periods of 3.25–4.51 years for the extreme wave events E1 to E6 (Table 4). However, the E7 event was associated with a 53-year return period which highlights the extraordinary magnitude of this twice-in-a-century high-impact episode. For the period 2011–2022, which already included the record-breaking E7 storm (April 2022), a new fitting of the three-parameter Weibull probability distribution to the SWHo observations was performed, and the associated Weibull parameters (threshold, scale, and shape) were updated (Table 4). Results revealed that the return period related to the E1 to E6 events decreased by 17 %–22 % to 2.69–3.51 years, while the updated E7 return period dropped by 53 % from 53 years to 25 years. These relevant outcomes should be applicable in the design and construction of new facilities at Melilla harbour and also integrated into the port operations planning and day-to-day logistics activities.
Table 4Return period computed for two different periods, as derived from hourly in situ observations from the Melilla coastal buoy. The long-term extreme sea state was characterised by using the POT method with the fitting of a three-parameter Weibull probability distribution to the observed significant wave height (SWHo).
4.3 Driving atmospheric conditions
The prevailing atmospheric conditions on a synoptic scale during the seven extreme wave storms were inferred from the ERA5 reanalysis of SLP and W10. The SLP map for the E7 event (Fig. 2a) exhibited the so-called hybrid Rex block (Sousa et al., 2021; Lupo, 2021; Rex, 1950), a large-scale blocking pattern characterised by two adjacent (northwestern) high- and (southeastern) low-pressure systems. This type of blocking is usual during the transition phase from an omega block (midlatitude high-pressure centre surrounded by two low-pressure systems on its western and eastern flanks) to a pure Rex shape (a north–south dipole pattern of SLP). Blocking episodes in Europe have long been acknowledged as persistent atmospheric disturbances that can lead to weather extremes (Kautz et al., 2022). As a consequence, this dipole was visible for the whole investigation period, whereas it followed a clockwise rotation. The derived pressure gradient (above 2 Pa km−1) gave rise to very strong northeasterly winds (above 20 m s−1) that affected broad areas of the SW Mediterranean and Alborán seas, while extremely intense easterlies were channelled through the Strait of Gibraltar due to its specific geometric configuration (Fig. 2b). In the Gulf of Cádiz (denoted in Fig. 1a), the wind field exhibited an anticlockwise rotation around the low-pressure core.
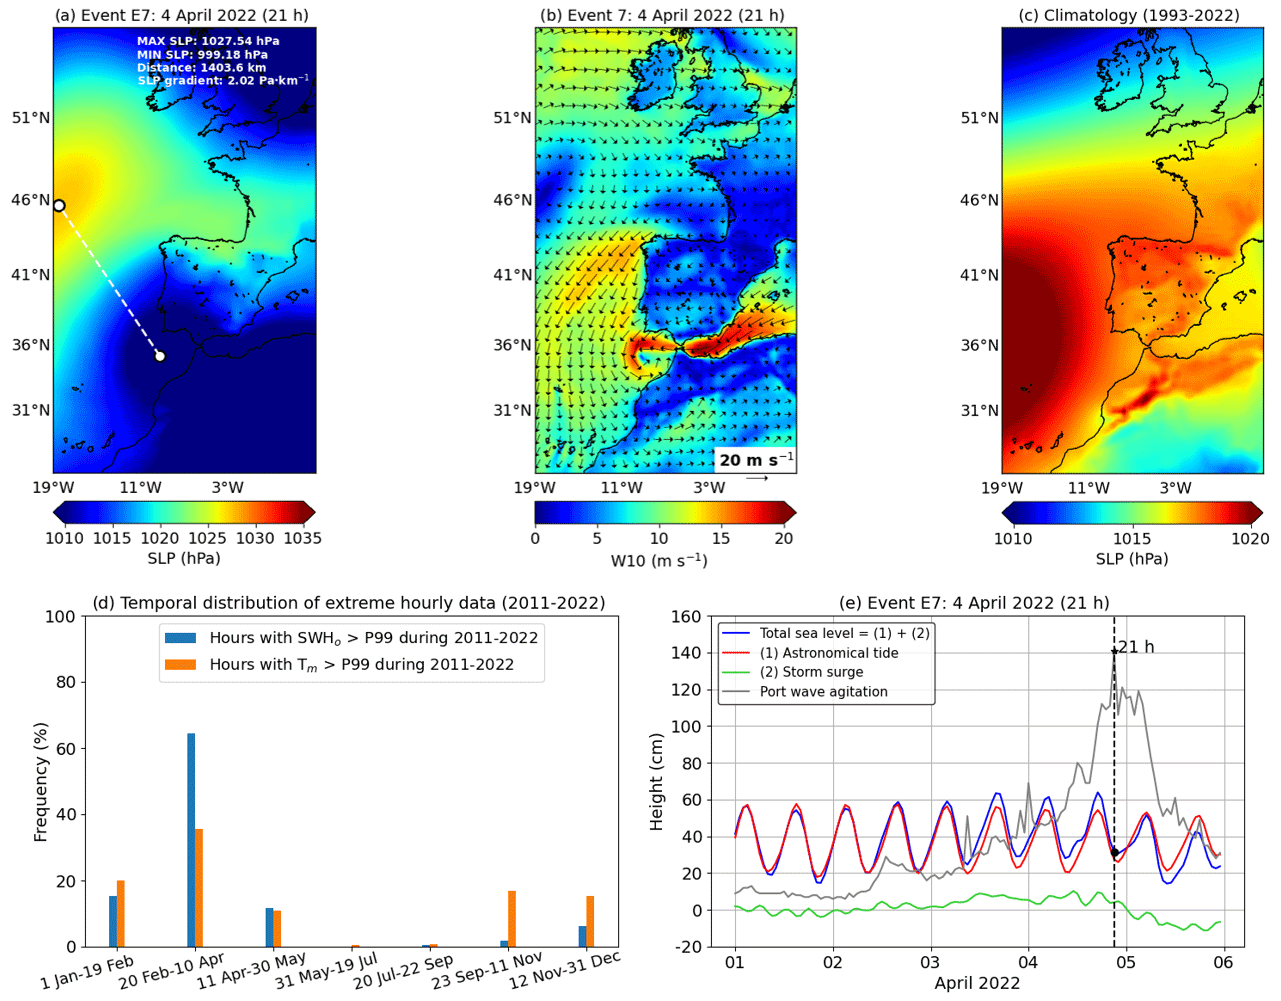
Figure 2(a–b) Hourly synoptic patterns of sea level pressure (SLP) and wind at 10 m height (W10) during the extreme event E7. (c) Climatology (1993–2022) of SLP. Maps derived from ERA5 reanalysis (product ref. no. 3 in Table 1). (d) Bar diagram with the temporal distribution of hourly data (significant wave height, SWHo, and mean wave period, Tm) above the 99th percentile (P99) derived from the 12-year time series (2011–2022) provided by the Melilla coastal buoy (product ref. no. 1 in Table 1). The annual time span was divided into seven 50 d periods, except period 5 (20 July–22 September), which is composed of 65 d. (e) Time series of total sea level height (blue line) and port agitation (black line) observations during the E7 extreme event as provided by the Melilla tide gauge (product ref. no. 2 in Table 1). Astronomical tides and storm surge component (meteorological residuals) are represented by the red and green lines, respectively. The vertical dashed black line indicates the peak of E7 wave storm.
The analysis of the six previous extreme events revealed that all of them shared very similar meteorological conditions: (i) a northwestern–southeastern hybrid Rex pattern of SLP anomalies (Fig. A2), in contrast to the climatological mean (Fig. 2c) that shows two well-known semi-permanent pressure systems (i.e. the Azores High at middle latitudes and the Icelandic Low at subpolar latitudes), and (ii) a peak of wind speed (>15 m s−1) over the entire Alborán Sea, where easterlies blew strongly along both sides of the Strait of Gibraltar (Fig. A3). Only the event E6 showed a slightly different structure (Fig. A3f), with moderately strong winds (13–15 m s−1) blowing from the NE and massively affecting the entire western Mediterranean Sea. In terms of persistence, intense winds steadily affected the study area for 1–2.5 d, except in the case of the E1 and E6 events where the duration was shorter (14–16 h), as derived indirectly from the time that the SWHo consecutively exceeded the P99 (Table 3).
The primary factors that jointly triggered the record-breaking E7 wave storm were the short distance (1400 km) between the two main pressure systems and the relatively deep (below 1000 hPa) system of low pressures over the Gulf of Cádiz (Fig. 2a). The resulting SLP gradient was anomalously powerful (above 2 Pa km−1), leading to very strong easterlies (up to 20 m s−1, as shown in Fig. 2b) that ultimately induced high (∼ 6 m) waves over the entire Alborán Sea (Fig. 1a).
The previous six episodes also presented intense (albeit 25 %–50 % weaker) SLP gradients, ranging from 1.01 Pa km−1 (E4; Fig. A2d) to 1.48 Pa km−1 (E6; Fig. A2f), due to the usually longer distances (ranging from 1900 to 3000 km) between the two pressure systems (Fig. A2). Although the E1 event exhibited SLP cores with similar separation (1438 km, shown in Fig. A2a), the low-pressure system was not so deep (1016 hPa), in contrast to the E7 event where minimum SLP values dropped below 1000 hPa (Fig. 2a).
Finally, it should be noted that the seven extreme episodes took place during the same stage of the year, a 50 d period between late February and early April (Fig. 2d and Table 3). Therefore, it might be deduced that large-scale atmospheric blocks leading to severe sea states (above the P99 of SWHo and Tm) in Melilla tend to be more probable during the winter-to-spring transition period, in agreement with previous blocking climatologies for the eastern North Atlantic (Kautz et al., 2022; Barriopedro et al., 2006).
4.4 Sea state within the port
An accurate estimation of the historical harbour wave agitation is fundamental for many practical applications such as port downtime analysis (Romano-Moreno et al., 2022). The analysis of hourly time series of agitation provided by the Melilla tide gauge revealed that there was a record-breaking value during the E7 event (1.41 m; Fig. 2e), while the six previous events also exceeded the P99.9 threshold (0.56 m; Fig. 3a). The agitation response is usually determined by wave penetration into the harbour arising from the combination of diverse parameters: SWHo, Tm, MWDo, astronomical tide, and storm surge outside the port (Camus et al., 2018). As shown in Figs. 2e and A4, the impact of the last two elements on harbour agitation during the seven extreme events was negligible due to a number of factors: (i) Melilla harbour waters are characterised by a maximum tidal range of 0.40 m; (ii) for each extreme event, the evolution of harbour agitation was independent from the tidal phase as the peak of agitation was not coincident with high tides; (iii) during E7, the low-pressure core (∼ 1000 hPa) was located in the Gulf of Cádiz (western side of the Strait of Gibraltar; Fig. 2a), so the storm surge affecting Melilla harbour was small (∼ 5 cm; Fig. 2e); and (iv) during the previous six extreme events (E1–E6), the meteorological residual was even negative (Fig. A4), ranging from −2 (E3) to −14 cm (E2).
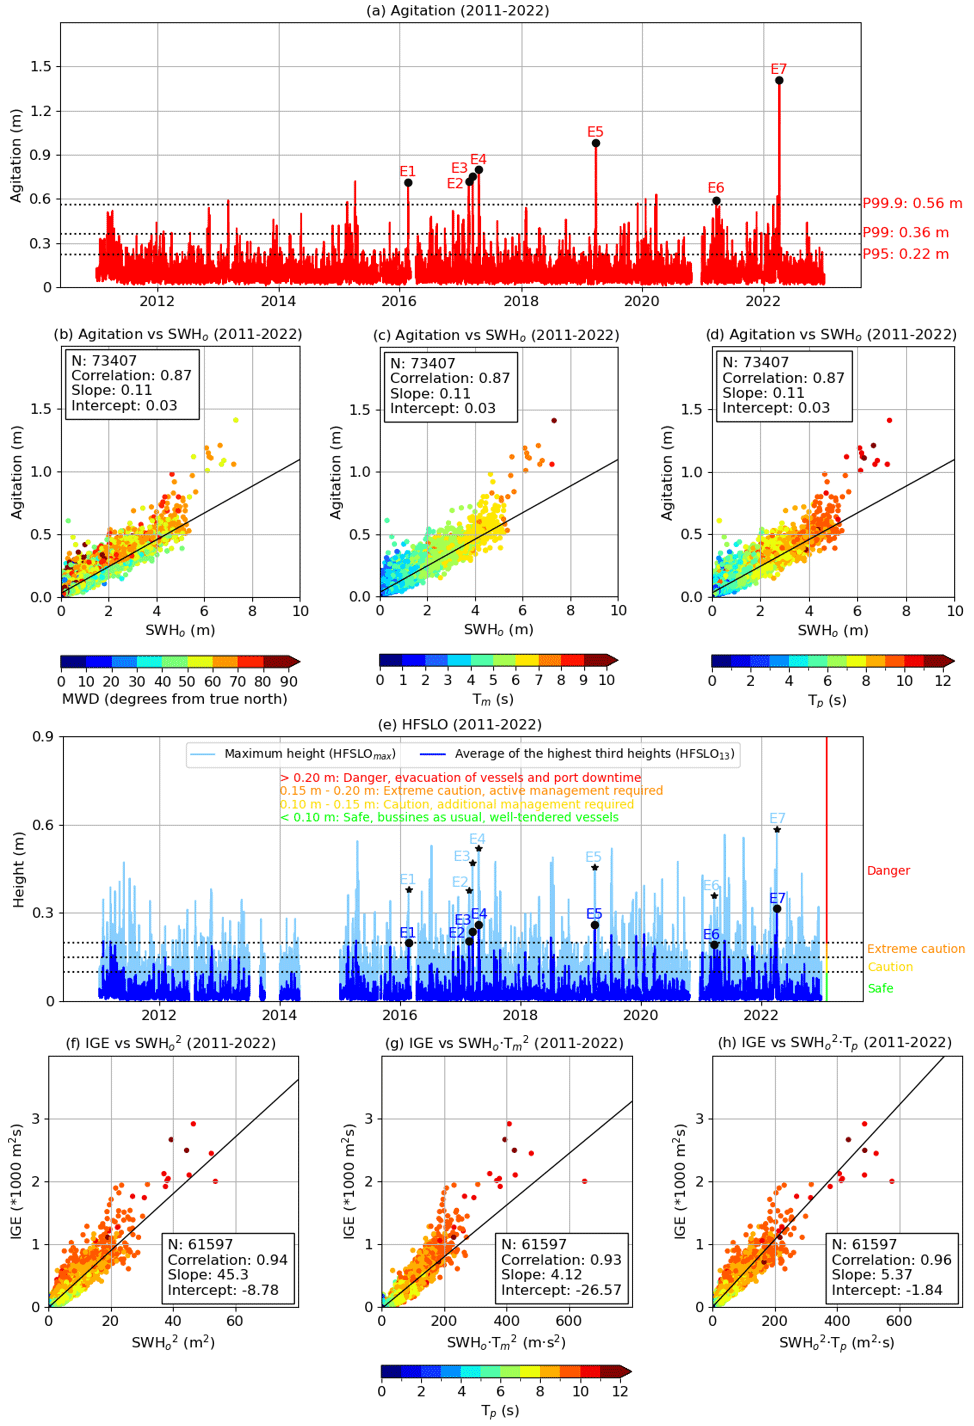
Figure 3(a) Hourly time series of agitation inside the harbour for the period 2011–2022 (product ref. no. 2 in Table 1) as provided by the Melilla tide gauge. (b–d) Best linear fit (solid black line) of scatter plots of the harbour agitation against SWHo observations provided by the Melilla coastal buoy. Statistical metrics are presented in the white box, where N represents the number of hourly observations. (e) Hourly time series of high-frequency sea level oscillations (HFSLO) with periods between 30 s and 1 h: maximum height (cyan line) and average of the highest-third heights (blue line) for the period 2011–2022 (product ref. no. 2 in Table 1), as registered by the Melilla tide gauge. The seven extreme events analysed in this work are denoted by black stars and dots. Thresholds for port management, which are universally common to all locations (McComb et al., 2020; McComb, 2011), are indicated with horizontal dotted lines. (f–h) Best linear fit (solid black line) of scatter plots of the energy in the IG band (IGE) against offshore wave observations from the Melilla coastal buoy.
Hourly scatter plots evidenced the strong relationship between the agitation inside the port and the wave conditions outside the port registered by the Melilla coastal buoy (Fig. 3b–d). The best linear fit of the scatter plot between the agitation and SWHo revealed a significantly high correlation coefficient (0.87). During the 12-year period analysed (2011–2022), there were 967 hourly agitation values above the P99 threshold (0.36 m): 89 % of them were associated with waves coming from the predominant sector between 50 and 70° (clockwise from true north), while 6 % of them were related to incoming waves with angles emerging from 70 to 90° (Fig. 3b). The remaining 5 % were assigned to waves with an angular spread ranging from 30 to 50°. Therefore, the overall agitation is direction-dependent due to the harbour orientation (Fig. 1b) and its inherent structural design (mouth width, port layout configuration, etc.). Additionally, harbour agitation was also importantly modulated by offshore period, as shown in Fig. 3c–d. Agitation values above the P99 were generally observed when Tm and Tp values were above 4 and 6 s, respectively. Equally, the highest values of agitation (above 1 m height) were associated with Tm and Tp values above 7 and 10 s, respectively. It seems reasonable to deduce that the record-breaking harbour agitation (1.41 m) registered during the E7 event was caused by the combined effect of unprecedented values of SWHo (7.32 m), MWHo (12.11 m), and Tm (9.42 s) in tandem with a very high value of Tp (10.75 s) and a MWDo (55°) within the predominant angular sector (50–70°) previously mentioned.
Operational thresholds in the IG band, which are common to all locations, have been historically proposed for safe conditions during port operations (McComb et al., 2020; McComb, 2011). Since the spectra of 2 Hz sea level oscillations measured inside the harbour by the Melilla tide gauge (not shown) revealed a high energy content in the IG band during the seven storms, HFSLO13 values registered during the seven extreme events (which contained not only the predominant contribution of oscillations in the IG band but also of oscillations with periods between 5 min–1 h) were categorised according to this methodology (Fig. 3e). The exploration of hourly time series of HFSLO13 showed that the E1 and E6 events surpassed the 0.15 m threshold (denoted as “extreme caution” in Fig. 3e), while the remaining five events also exceeded the “danger” threshold (0.20 m), with an unprecedented value of 0.31 m during the E7 episode. Likewise, hourly values of HFSLOmax clearly went beyond 0.35 m during the extreme episodes, reaching the record-breaking value of 0.58 m during the E7 event. Furthermore, IGE was scaled with SWH, SWHo ⋅ , and SWH ⋅ Tp (Fig. 3f–h). The best linear fit of each scatter plot showed very high correlations: 0.94, 0.93, and 0.96, respectively. Therefore, IGE was best predicted using an offshore forcing parameter that is proportional to SWH ⋅ Tp, in accordance with Inch et al. (2017). As expected, the highest IGE values (above 1500 m2 s) were observed for energetic swell waves with SWHo and Tp above 5 m and 10 s, respectively.
4.5 Trends in extreme wave climate
The evolution of the extreme wave conditions over the Alborán Sea during the 30-year period analysed (1993–2022) was assessed. As a preliminary step, SWHm estimations from MED reanalysis were compared with hourly in situ SWHo observations provided by the Melilla coastal buoy during the concurrent 12-year period (2011–2022). To this aim, the MED reanalysis grid point (35.354° N, 2.916° W) closest to the moored buoy (located at a distance of 3450 m) was selected, and both time series were compared. A significantly high correlation coefficient (0.96) for a set of 77 100 hourly data was derived from the best linear fit of the scatter plot (Fig. A5a). Equally, the slope and intercept values were close to 1 (0.85) and moderately low (0.15), respectively.
These results revealed that MED reanalysis, albeit accurate in the Melilla region, seems to underestimate SWHo, especially for extreme waves. Such systematic underestimation has been previously reported for the entire domain (Fanti et al., 2023; Zacharioudaki et al., 2022), since shallow water processes cannot properly be captured by global and regional reanalysis, because (i) the coastline and the bottom topography are not well resolved as the grid mesh is too coarse, (ii) there are fetch limitations, and (iii) there are inherent uncertainties in the wind field used to force the wave model. These limitations are even more pronounced in regions with complex coastal configurations (sheltered by islands, headlands, and reefs) and in port-approach areas where sharp topo-bathymetric gradients pose special difficulties for accurate local predictions (Sánchez-Arcilla et al., 2016a). Nevertheless, according to Zacharioudaki et al. (2022), the reanalysis skill can be considered robust and good enough to conduct further investigations into the wave climate affecting the Melilla area and the related intra-annual variability in the Alborán Sea.
Thus, the monthly P50 and P99 of SWHm were computed over the entire Alborán Sea for the 1993–2022 period (Fig. A5b–e). In particular, we selected only April and July as representative months of the stormy and calm seasons, respectively. According to homogeneous spatial patterns of P50, the mean wave climate is rather similar for April and July, only differing in the magnitude: while April is characterised by a P50 slightly above 1.1 m over Alborán open waters (Fig. A5b), P50 is around 0.7–0.8 m in July (Fig. A5c). By contrast, significant differences can be found in the most energetic sea states (Fig. A5d–e). In April, the P99 values around Melilla are up to 3 m, while they reach 4 m offshore (Fig. A5d). Peaks of 4.3 m are attained in the easternmost sub-basin, probably as a consequence of strong easterly winds. On the contrary, during July the largest P99 barely reaches 3 m in the central part of Alborán Sea, while the spatial distribution of P99 generally remains uniformly below 2 m in the rest of the spatial domain, including littoral areas and nearby regions of Melilla harbour (Fig. A5e).
The climate variability over the Alborán Sea was assessed by analysing the intra-annual variations in the extreme SWHm conditions (Fig. 4). Monthly trend maps of P99 were calculated for the period 1993–2022, revealing statistically significant changes in the vicinity of Melilla harbour for a few specific months: while an increase of 2 cm year−1 was observed for April (Fig. 4a), a downward P99 trend of 1.5–2 cm year−1 was detected for June (Fig. 4b) and October (Fig. 4c). The temporal trends for each month (Fig. 4d–f), computed over the subdomain surrounding Melilla harbour (black box in Fig. 4a–c), visually supported the previous statement: the trends were statistically significant at the 90 % confidence interval for April, June, and October. By contrast, during both the second part of summer (July–September) and the transitional season (November–February), monthly maps of P99 trends (not shown) did not exhibit statistically significant values over the entire Alborán Sea. The trend map of P99 for March and May (not shown) showed large areas with positive trends and negative trends, respectively, but delimited over the easternmost part (2–1° W) of the Alborán basin.
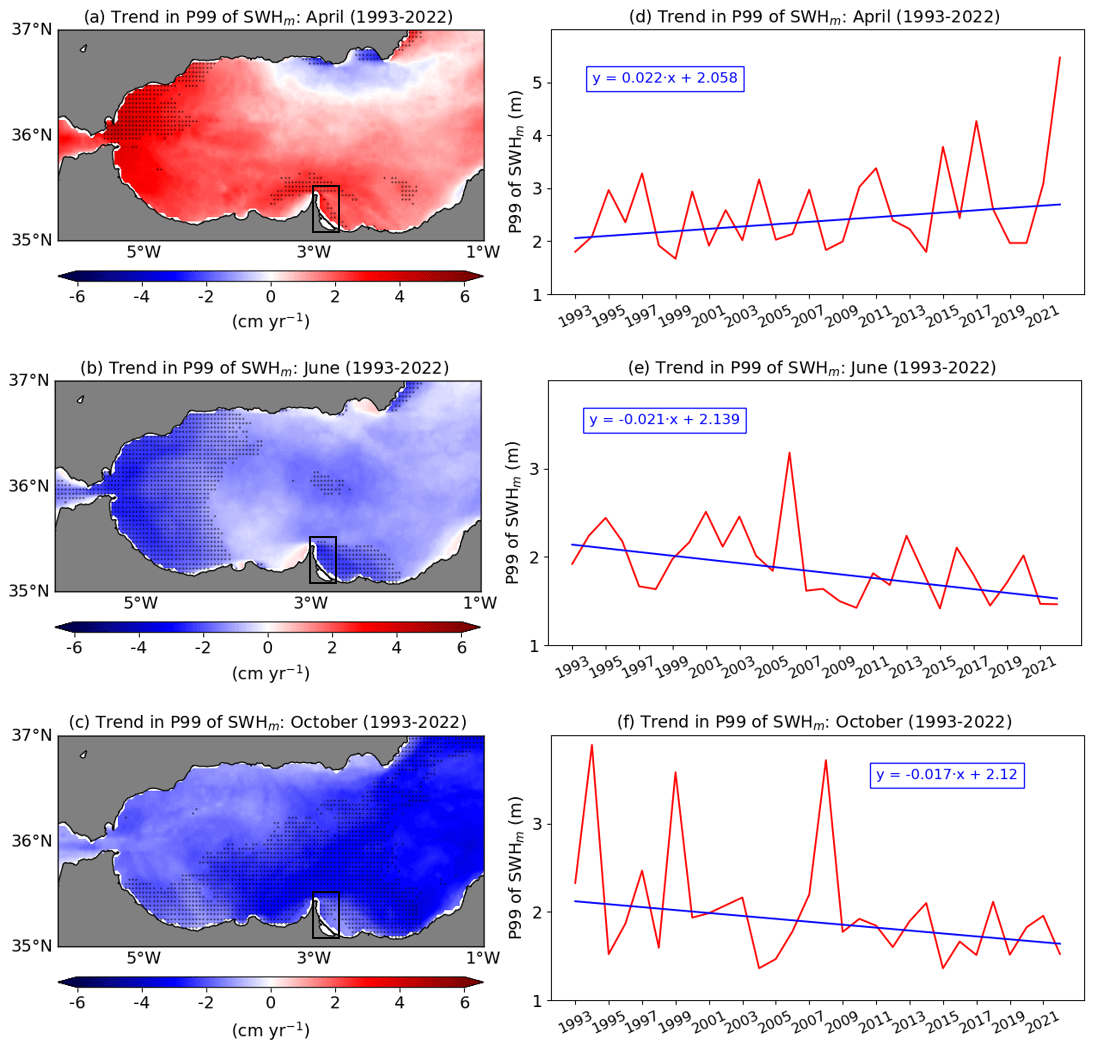
Figure 4(a, b, c) Monthly trend maps of the 99th percentile (P99) of significant wave height (SWHm) over the Alborán Sea for the 1993–2022 period as derived from MED reanalysis (product ref. no. 4 in Table 1). Areas with statistically significant trends at the 90 % confidence intervals are denoted by black dots. (d, e, f) Temporal trends computed over the Melilla subdomain (represented by a black box on the associated maps).
The long-term changes detected in the extreme wave climate over Melilla are, to a certain extent, comparable to those previously exposed by Barbariol et al. (2021). Although the wave reanalysis used and its associated temporal coverage (1980–2019) were different, this previous work reported both an upward trend for the P99 of SWHm (about 0.8–1.2 cm year−1) and a non-significant trend in the vicinity of Melilla harbour for the extended winter (defined as NDJFM) and for summer (defined as JJA), respectively. From a broader perspective focused on the entire western Mediterranean Sea, Barbariol et al. (2021) also documented a relevant positive trend (1.2 cm year−1) during winter in the Gulf of Lion (denoted in Fig. 1a) due to strong northwesterly mistral winds. By contrast, Amarouche et al. (2022b) examined a 41-year (1979–2020) hindcast database and determined that the west coast of the Gulf of Lion was affected by a significant upward trend for all seasons, with a considerable annual increase (4 cm year−1) in maximum values of SWHm. Complementarily, Amarouche et al. (2022a) demonstrated significant decadal increases in wave storm intensity and duration not only over the eastern part of the Alborán Sea but also in the Balearic basin. All these findings highlighted both the existence of an inter-seasonal variability in P99 of SWHm and the importance of multi-temporal scale analysis.
Gaining a deeper, holistic understanding of extreme weather events and the related driving mechanisms has been identified as one of the World Climate Research Programme's Grand Challenges (WCRP website, 2024) due to their detrimental impact on ecosystem health and societal assets (Hochman et al., 2022). Concerning the latter, climate-driven extreme coastal hazards have long been recognised as imposing heavy socio-economic tolls, particularly aggravated in vulnerable semi-enclosed regions like the Mediterranean Sea and in exposed sectors like harbour systems (Verschuur et al., 2023).
As port downtime leads to a reduction in safety levels and wide trade losses through maritime transport and global supply-chain networks (Verschuur et al., 2022), the accurate monitoring of violent weather-related episodes is a deciding factor in adopting prevention strategies (i.e. wise design of safe port infrastructures) and mitigation measures that should eventually result in the enhancement of coastal communities' resilience.
In the present work, the attention is focused on the unprecedented storm that hit Melilla harbour (Alborán Sea; Fig. 1a) during 4–5 April 2022 with heavy rainfall and strong easterly winds, which induced extremely high waves (above 7 m) with associated long mean periods (above 9 s) that simultaneously beat previous historical records (Fig. 1c–d). The return period associated with this extreme wave event decreased from 53 years to 25 years. These outcomes are essential for the safe design of future facilities at Melilla port (Naseef et al., 2019). Conversely, it is worth pointing out that the port is also subjected to a constant geometric modification (in the docks, basins, bathymetry, breakwaters, etc.) which in turn can induce additional variations in the port response to extreme wave events that should be further assessed.
The analysis of hourly time series of SWHo (2011–2022) revealed that there were seven episodes that exceeded the P99.9 threshold (4.45 m), denoted chronologically from E1 to E7 in Fig. 1c. The retrospective comparison of the record-breaking E7 event with six previous extreme wave episodes (E1 to E6) revealed that all of them were connected with similar large-scale atmospheric blocks: a dipole-like SLP pattern, characterised by two adjacent (northwestern) high- and (southeastern) low-pressure systems, induced strong easterly winds channelled over the entire Alborán Sea (Figs. 2a–b, A2, and A3). Furthermore, this common atmospheric configuration seems to predominantly feature during the same stage of the year, a 50 d period between late February and early April (Fig. 2d). These findings contrast with other Spanish harbours (i.e. NW Iberian Peninsula) where the storm season typically spans from November to March (Ribeiro et al., 2023), highlighting the strong need to conduct a tailored assessment for each specific port and oceanographic region. Therefore, it might be deduced that large-scale atmospheric blocks leading to severe sea states in Melilla tend to be more probable during the winter-to-spring transition period. This outcome is in line with prior blocking climatologies for the eastern North Atlantic (Kautz et al., 2022; Barriopedro et al., 2006). In this context, previous works have also explored the dynamical links between blocking patterns and the North Atlantic Oscillation (NAO), which is the leading mode of atmospheric circulation variability over the Euro-Atlantic sector and is characterised by a seesaw of atmospheric mass between the Iceland Low and the Azores High (e.g. Hurrell and Deser 2009). The NAO appeared as the leading variability pattern during winter, accounting for 45 % of the blocking frequency variance (Barriopedro et al., 2006).
High-frequency (2 Hz) sea level and agitation observations during the 2011–2022 period, provided by the Melilla tide gauge, were used to investigate the relationship between offshore energetic waves and the sea state inside of the harbour (Fig. 3). A record-breaking value of harbour agitation (1.41 m) was recorded during the E7 event (Fig. 3a). The highest agitation records (above 1 m) were registered for incident high waves coming predominantly from the sector between 50 and 70° (clockwise from true north) with Tm and Tp values above 7 and 10 s, respectively (Fig. 3b–d). Extreme sea level oscillations (30 s to 1 h), which also reached record heights (up to 0.58 m), were linked to the highest values in the IG energy band (Fig. 3e). The seven extreme events in the Alborán Sea led to harsh sea conditions within the port: the energy in the IG band was significantly correlated (0.96) with an offshore parameter proportional to SWHo ⋅ , with energetic swell being responsible for the highest energies (above 2000 m2 s), as shown in Fig. 3f–h. Therefore, the IG waves related to energetic swell commonly observed on the NW Iberian coast can also be present during extreme wave events on the Mediterranean coast, as previously reported for Storm Gloria (2020) by Pérez-Gómez et al. (2021) and Álvarez-Fanjul et al. (2022).
Additionally, MED reanalysis was used to characterise the long-term mean (Fig. A5) and extreme (Fig. 4) wave climate over the Alborán Sea for the period 1993–2022. The intra-annual variability in the P99 of SWHm was examined on a monthly timescale to identify the existence of potential trends. Results seem to suggest that the intensity of extreme wave events impacting Melilla harbour increased for April (Fig. 4a and d), while observed trends indicate a significant decrease in P99 for the SWHm during June (Fig. 4b and e) or October (Fig. 4c and f). Such alterations of outer-harbour wave climate conditions might impact in-port wave agitation response as the amount of energy penetrating into the harbour would be different, as previously indicated by Sierra et al. (2015).
Still, it should be noted that the present work does not focus on the duration of extreme wave events over the SW Mediterranean Sea, so future endeavours should address this relevant aspect to complement the results presented here. Moreover, long-term historical changes in wave period and directionality are receiving increasing attention and should be further analysed to assess their specific impact on the operability of harbours (Erikson et al., 2022; Casas-Prat and Sierra, 2012). Permanent modifications in the wave direction might result in enhanced wave penetration into the harbour and thereby larger agitation, as port protective structures were originally designed to dampen wind and short waves coming from a predetermined sector (Casas-Prat and Sierra, 2012). Likewise, the offshore wave period also plays a primary role in the modulation of harbour agitation, as derived from Fig. 3c–d. As a consequence, any sharp increase in both wave period and SWHo could lead to severe sea states within the port. Regardless of the reported limitations of global and regional reanalyses (inherent to their coarse spatial resolution) when used on coastal and port scales (Fanti et al., 2023; Zacharioudaki et al., 2022), the MED reanalysis used in this work can be considered a robust first-guess estimator for the present intra-annual variability assessment of extreme waves in Melilla. This statement is supported not only by the comprehensive Quality Information Document (Zacharioudaki et al., 2023) but also by the 12-year skill assessment conducted against in situ hourly observations from the Melilla coastal buoy (Fig. A5a). The comparison yielded a correlation coefficient of 0.96 and revealed a slight underestimation of extreme SWHo values. To overcome such a drawback, future works should include the implementation of a dynamical downscaling methodology to improve wave reanalysis accuracy on finer coastal scales (Vannucchi et al., 2021). Of course, this would necessarily require finding the right trade-off between adequate spatial resolutions and the available in-house computational resources. Complementarily, additional efforts should be devoted to assessing the dominant modes of extreme wave variability and their relationship with the most important climatic indices since this could enhance the prognostic skills of extreme wave events and benefit the adaptation plans in the entire Spanish harbour system.
Finally, it is worth mentioning that most of the outcomes derived from this work could not only feed the incoming climate change observatory for the Spanish ports (which should be fully operational by 2025) but also be integrated into tailored multi-hazard early warning systems. They would act as a key component of robust capacity analysis frameworks, covering a wide range of dimensions, such as legislative, planning, infrastructure, technical, scientific, and institutional partnerships (Haigh et al., 2018). Special attention should be focused on the thorough revision of security protocols and the implementation of mitigation plans within the harbour territory based on the updated return periods presented in this work. The design lifetime risk should be recalculated accordingly, as coastal structures in the vicinity of the harbour must resist growing stresses during their lifespan and operations, such as wave overtopping, flooding, or resonance, to name a few. While the current port layout configuration must be adapted to the increasing frequency and magnitude of these stressors, future maritime facilities at Melilla harbour should be wisely designed and constructed taking into account these outcomes in order to withstand extreme wave regimes imposed by the changing marine environment (Vanem et al., 2019). Albeit methodologically robust, the return periods exposed in this work are based on a short (12-year) time series of quality-controlled in situ wave observations. Therefore, they should be further complemented by return periods computed by means of longer modelled time series from very-high-resolution wave reanalysis.
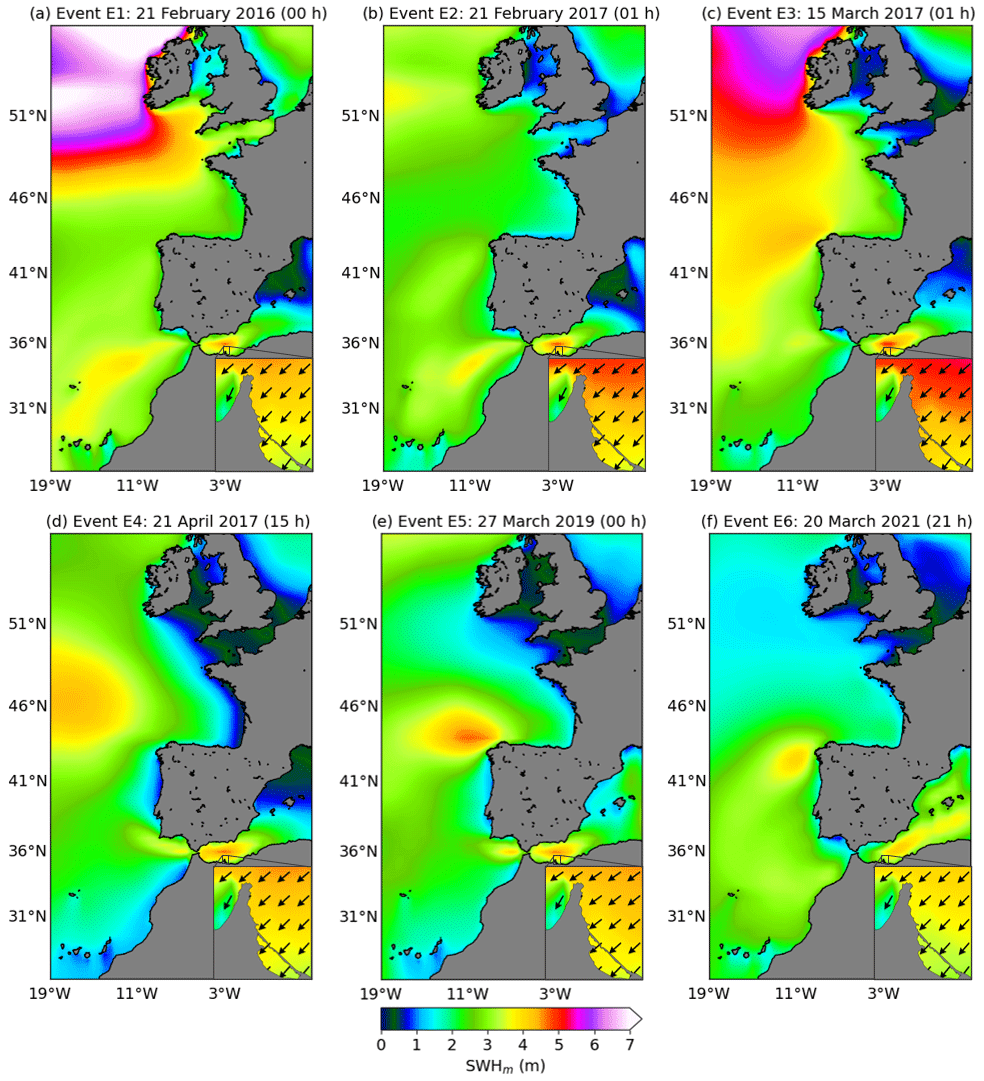
Figure A1Hourly maps of significant wave height (SWHm), derived from ERA5 reanalysis (product ref. no. 3 in Table 1), corresponding to six extreme wave events (E1–E6) affecting the Melilla area. Small maps in the bottom-right corner of each panel represent the hourly SWHm and wave propagation direction in the vicinity of Melilla harbour as derived from MED reanalysis (product ref. no. 4 in Table 1). The hour represents local time.
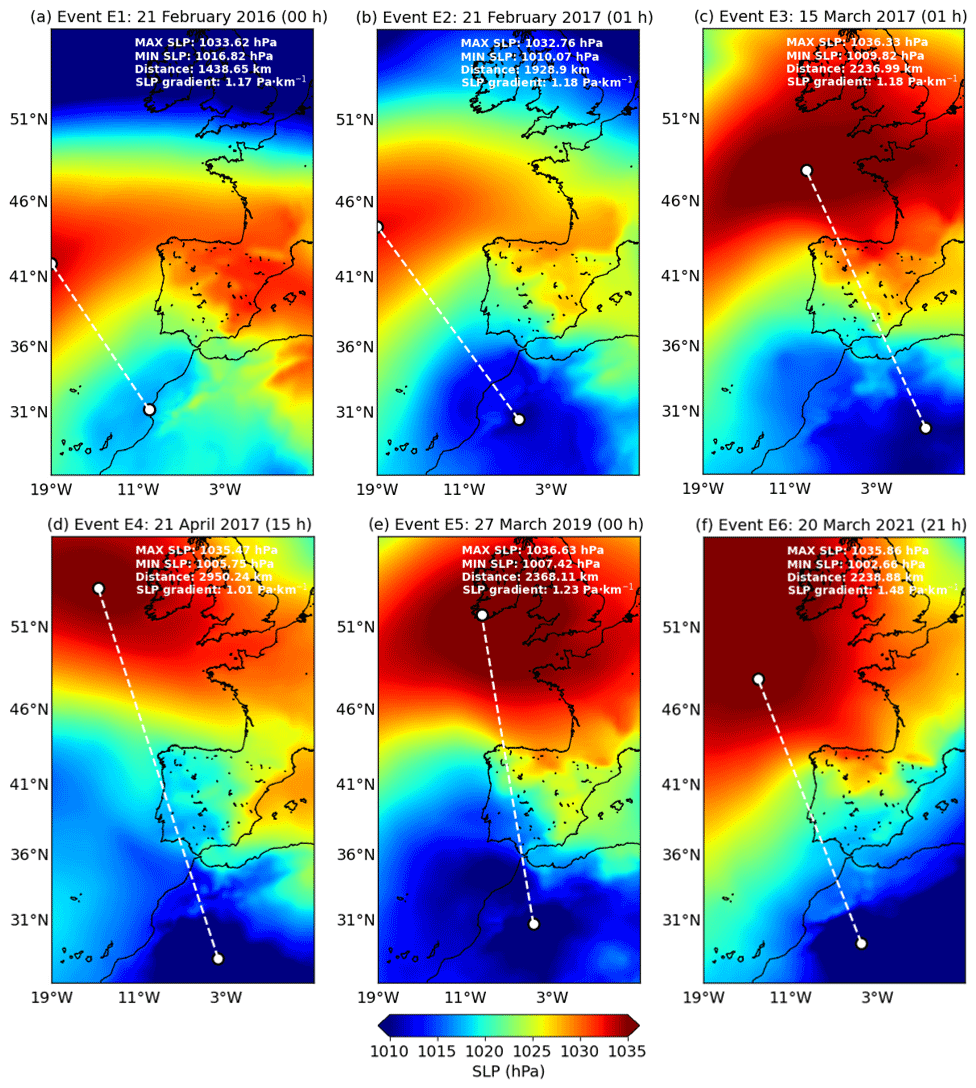
Figure A2Hourly maps of sea level pressure (SLP), derived from ERA5 reanalysis (product ref. no. 3 in Table 1), corresponding to six extreme wave events (E1–E6) affecting the Melilla area. Maximum and minimum values of SLP are marked with white dots and linked with a dashed white line. The distance between the two pressure centres and the related SLP gradient are indicated in the upper-right corner. The hour represents local time.
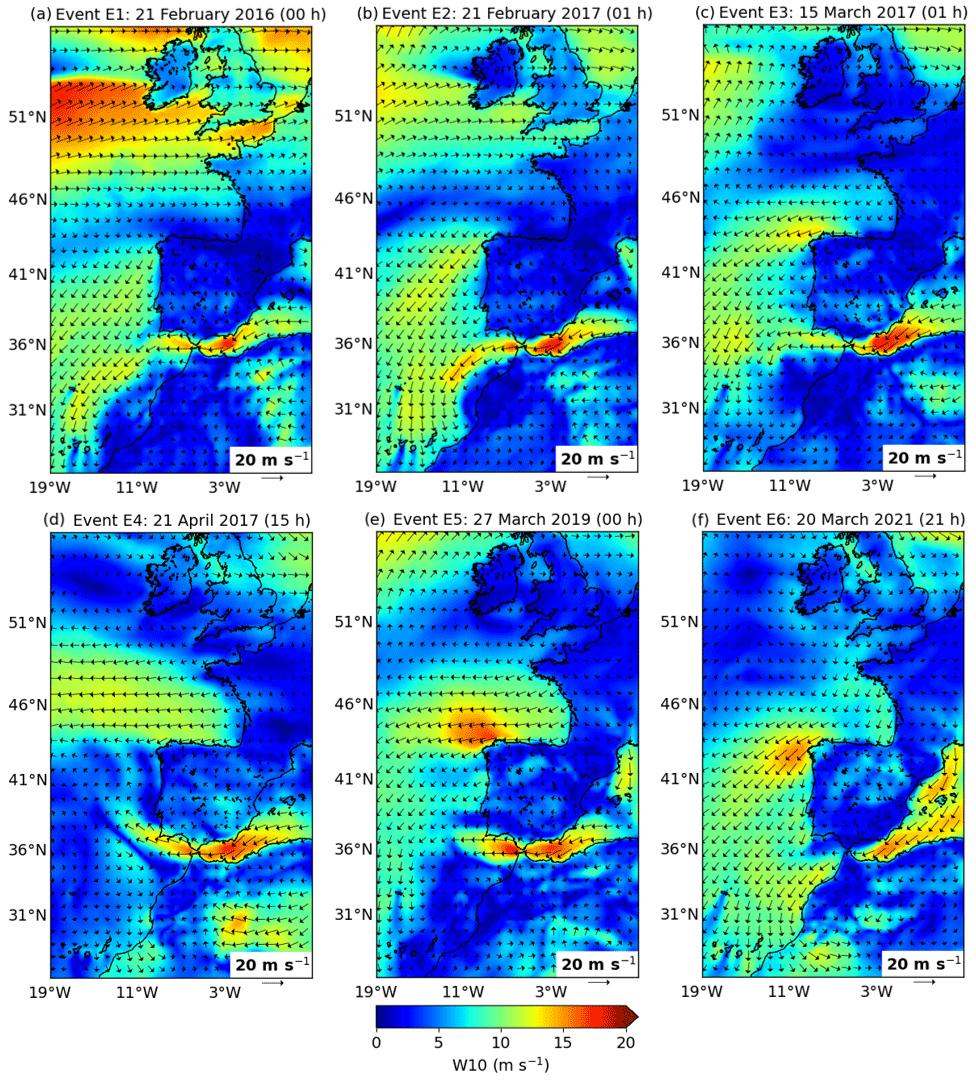
Figure A3Hourly maps of wind at 10 m height (W10), derived from ERA5 reanalysis (product ref. no. 3 in Table 1), corresponding to six extreme wave events (E1–E6) affecting the Melilla area. The hour represents local time.
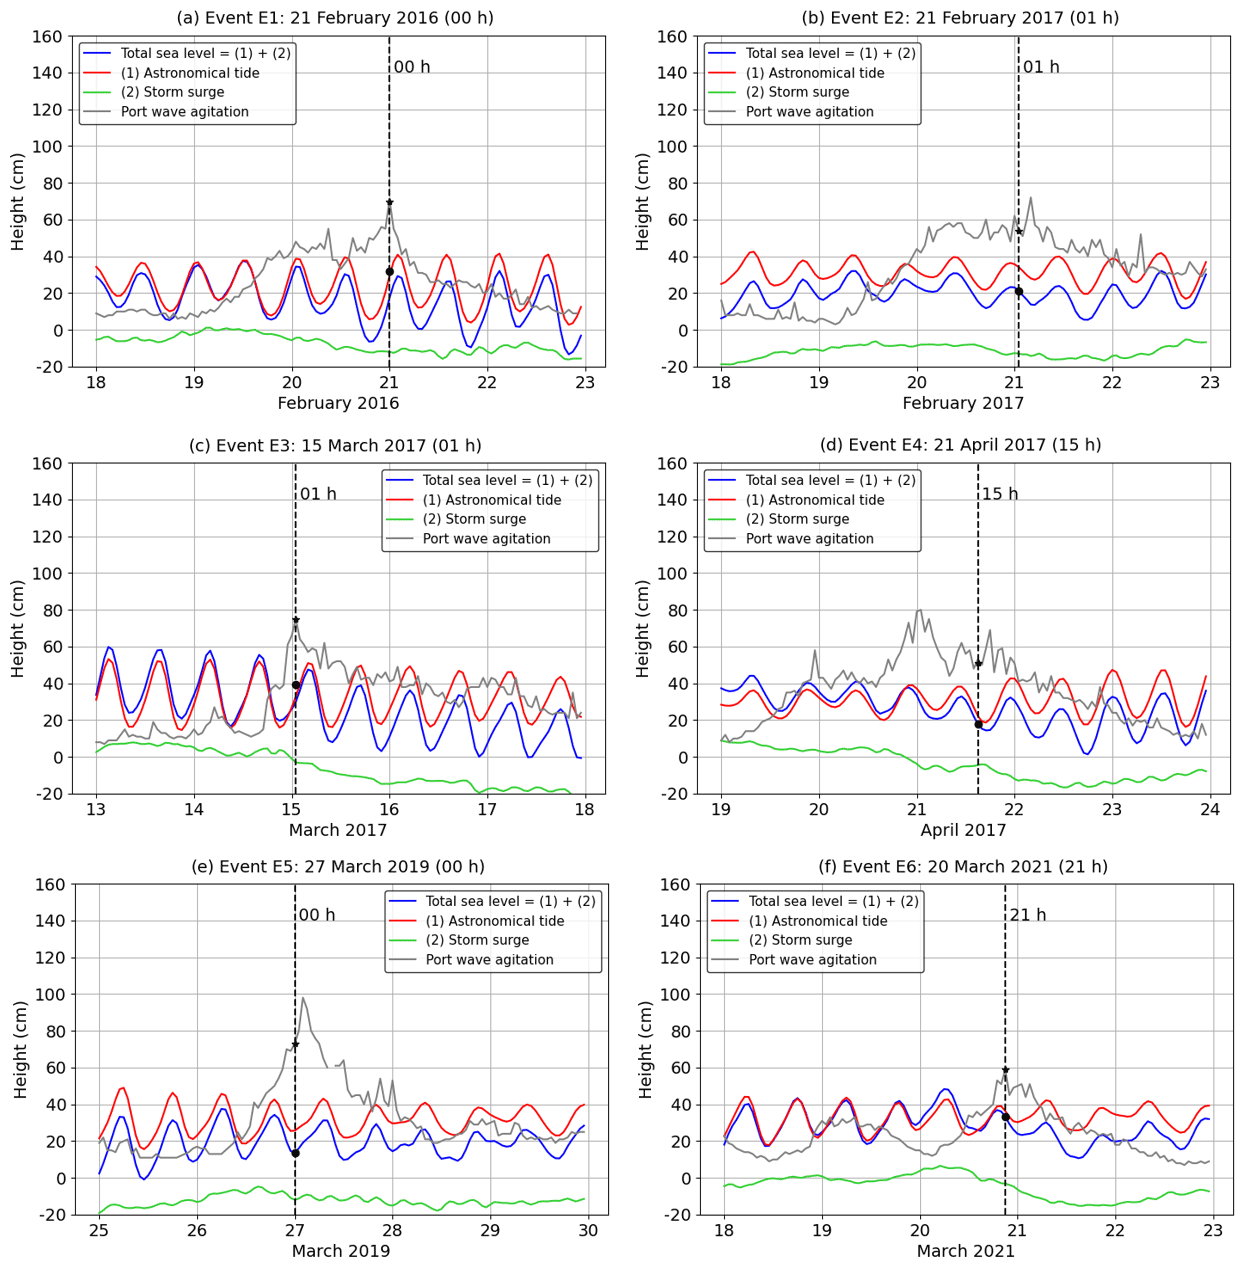
Figure A4Hourly time series of sea level height (blue line) and port agitation (grey line) observations corresponding to the six extreme wave events detected before the study case and labelled in Fig. 1d. Observations provided by the Melilla tide gauge (product ref. no. 2 in Table 1). Astronomical tides and meteorological residuals are represented by the red and green lines, respectively. The vertical dashed black line indicates the peak of the wave storm for each of the six events analysed.
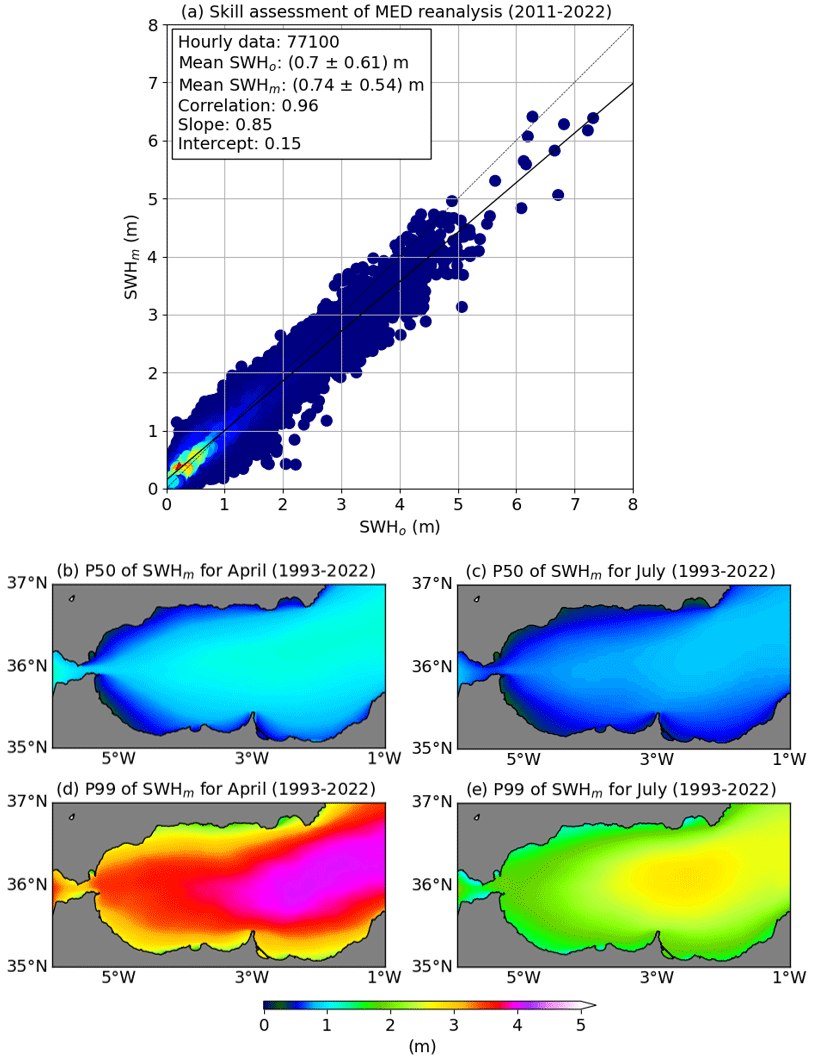
Figure A5(a) Skill assessment of MED reanalysis (product ref. no. 4 in Table 1) at the grid point closest to the Melilla coastal buoy (product ref. no. 1 in Table 1): best linear fit (solid black line) of the scatter plot between hourly estimations of modelled (SWHm) and observed (SWHo) significant wave height for the concurrent 12-year period (2011–2022). The dotted black line represents the result of perfect agreement with slope 1.0 and intercept 0. Statistical metrics are presented in the white box. Spatial distribution of the 50th (P50) (b, c) and 99th (P99) (d, e) percentiles of SWHm over the Alborán Sea for April (b, d) and July (c, e), as derived from MED reanalysis for the 1993–2022 period.
The model and observation products used in this study from both the Copernicus Marine Service and other sources are listed in Table 1.
PL, MdA, FM, BPG, and SPR conducted the pilot study through fruitful discussions in the framework of working team meetings. PL designed the experiment, analysed the long-term wave trends, created the figures, and prepared successive versions of the draft with inputs from several co-authors. MdA conducted a bibliographic revision of extreme metocean events previously occurring in the Mediterranean Sea. PG computed the return period before and after the record-breaking event. FM extracted time series from the Puertos del Estado internal database and prepared diverse in situ sensor datasets. BPG proposed the agitation and infragravity band study in the port and analysed the corresponding tide gauge records. SPR provided a tailored coastline for Melilla harbour and analysed the atmospheric driving mechanisms during the event. MIR applied a quality control for historical time series of wave parameters from Melilla coastal buoy. Finally, several authors participated in successive iterations and in the draft and revision of the article.
The contact author has declared that none of the authors has any competing interests.
Publisher’s note: Copernicus Publications remains neutral with regard to jurisdictional claims made in the text, published maps, institutional affiliations, or any other geographical representation in this paper. While Copernicus Publications makes every effort to include appropriate place names, the final responsibility lies with the authors.
The authors are grateful to the Copernicus Marine Service for the data provision.
This paper was edited by Marta Marcos and reviewed by two anonymous referees.
Álvarez-Fanjul, E., Pérez Gómez, B., de Alfonso Alonso-Muñoyerro, M., Lorente, P., García Sotillo, M., Lin-Ye, J., Aznar Lecocq, R., Ruíz Gil de la Serna, M., Pérez Rubio, S., Clementi, E., Coppini, G., García-León, M., Fernandes, M., García Valdecasas, J., García Valdecasas, J.M., Santos Muñoz, D., Luna Rico, M.Y., Mestres, M., Molina, R., Tintoré, J., Mourre, B., Masina, S., Mosso, C., Reyes, E., and Santana, A.: Western Mediterranean record-breaking storm Gloria: An integrated assessment based on models and observations, J. Oper. Oceanogr, 15, 1–220, https://doi.org/10.1080/1755876X.2022.2095169, 2022.
Amarouche, K., Akpınar, A., and Semedo, A.: Wave storm events in the Western Mediterranean Sea over four decades, Ocean Model., 170, 101933, https://doi.org/10.1016/j.ocemod.2021.101933, 2022a.
Amarouche, K., Bingölbali, B., and Akpinar, A.: New wind-wave climate records in the Western Mediterranean Sea, Clim. Dynam., 58, 1899–1922, https://doi.org/10.1007/s00382-021-05997-1, 2022b.
Amores, A., Marcos, M., Carrió, D. S., and Gómez-Pujol, L.: Coastal impacts of Storm Gloria (January 2020) over the north-western Mediterranean, Nat. Hazards Earth Syst. Sci., 20, 1955–1968, https://doi.org/10.5194/nhess-20-1955-2020, 2020.
Aucan, J. and Ardhuin, F.: Infragravity waves in the deep ocean: an upward revision, Geophys. Res. Lett., 40, 3435–3439, https://doi.org/10.1002/grl.50321, 2013.
Barbariol, F., Davison, S., Falcieri, F.M., Ferretti, R., Ricchi, A., Sclavo, M. and Benetazzo, A.: Wind Waves in the Mediterranean Sea: An ERA5 Reanalysis Wind-Based Climatology, Front. Mar. Sci., 8, 760614, https://doi.org/10.3389/fmars.2021.760614, 2021.
Barriopedro, D., García-Herrera, R., Lupo, A. R., and Hernández, E.: A climatology of Northern Hemisphere blocking, J. Climate, 19, 1042–1063, https://doi.org/10.1175/JCLI3678.1, 2006.
Bellafont, F.: Role of infragravity waves on port agitation during storm events, Civil Engineering, PhD thesis, Université de Pau et des Pays de l'Adour, France, 202 pp., 2019.
Bellotti, G. and Franco, L.: Measurement of long waves at the harbor of Marina di Carrara, Italy, Ocean Dynam., 61, 2051–2059, https://doi.org/10.1007/s10236-011-0468-6, 2011.
Bensoussan, N., Chiggiato, J., Nardelli, B. B., Pisano, A., and Garrabou, J.: Insights on 2017 Marine Heat Waves in the Mediterranean Sea, J. Oper. Oceanogr., 12, 101–108, https://doi.org/10.1080/1755876X.2019.1633075, 2019.
Berta, M., Corgnati, L., Magaldi, M., Griffa, A., Mantovani, C. Rubio, A. Reyes, E., and Mader, J.: Small scale ocean weather during an extreme wind event in the Ligurian Sea, J. Oper. Oceanogr., 13, 149–154, https://doi.org/10.1080/1755876X.2020.1785097, 2020.
Caloiero, T. and Aristodemo, F.: Trend Detection of Wave Parameters along the Italian Seas, Water, 13, 1634, https://doi.org/10.3390/w13121634, 2021.
Camus, P., Tomás, A., Izaguirre, C., Rodríguez, B., Díaz-Hernández, G., and Losada, I.: Probabilistic assessment of port operability under climate change, Coastal Engineering Proceedings, 1, 54, https://doi.org/10.9753/icce.v36.risk.54, 2018.
Casas-Prat, M. and Sierra, J. P.: Trend analysis of wave direction and associated impacts on the Catalan coast, Climatic Change, 115, 667–691, https://doi.org/10.1007/s10584-012-0466-9, 2012.
Cavaleri, L., Bertotti, L., Torrisi, L., Bitner-Gregersen, E., Serio, M., and Onorato, M.: Rogue waves in crossing seas: The Louis Majesty accident, J. Geophys. Res., 117, C00J10, https://doi.org/10.1029/2012JC007923, 2012.
Chiggiato, J., Artale, V., de Madron, X. D., Schroeder, K., Taupier-Letage, I., Velaoras, D., and Vargas-Yáñez, M.: Recent changes in the Mediterranean Sea, in: Oceanography of the Mediterranean Sea, An introductory guide, Elsevier, 289–334, https://doi.org/10.1016/B978-0-12-823692-5.00008-X, 2023.
Clementi, E., Korres, G., Cossarini, G., Ravdas, M., Federico, I., Goglio, A.C., Salon, S., Zacharioudaki, A., Pattanaro, M., and Coppini, G.: The September 2020 Medicane Ianos predicted by the Mediterranean Forecasting systems, Ocean State Report Issue 6, J. Oper. Oceanogr., 15, 185–192, https://doi.org/10.1080/1755876X.2022.2095169, 2022.
Copernicus Marine In Situ Team: Copernicus In Situ TAC, Real Time Quality Control for WAVES. CMEMS-INS-WAVES-RTQC, https://doi.org/10.13155/46607, 2020.
Costas, R., Figuero, A., Sande, J., Peña, E., and Guerra, A.: The influence of infragravity waves, wind, and basin resonance on vessel movements and related downtime at the Outer Port of Punta Langosteira, Spain, Appl. Ocean Res., 129, 103370, https://doi.org/10.1016/j.apor.2022.103370, 2022.
Dayan, H., McAdam, R., Juza, M., Masina, S., and Speich, S.: Marine heat waves in the Mediterranean Sea: An assessment from the surface to the subsurface to meet national needs, Front. Mar. Sci., 10, 1045138, https://doi.org/10.3389/fmars.2023.1045138, 2023.
de Alfonso, M., García-Valdecasas, J. M., Aznar, R., Pérez-Gómez, B., Rodríguez, P., de los Santos, F. J., and Álvarez-Fanjul, E.: Record wave storm in the Gulf of Cadiz over the past 20 years and its impact on harbours, Copernicus Marine Service Ocean State Report, Issue 4, J. Oper. Oceanogr., 13, 137–144, https://doi.org/10.1080/1755876X.2020.1785097, 2020.
de Alfonso, M., Lin-Ye, J., García-Valdecasas, J. M., Pérez-Rubio, S., Luna, M. Y., Santos-Muñoz, D., Ruiz, M. I., Pérez-Gómez, B., and Álvarez-Fanjul, E.: Storm Gloria: sea state evolution based on in situ measurements and modelled data and its impact on extreme values, Front. Mar. Sci., 8, 1–17, https://doi.org/10.3389/fmars.2021.646873, 2021.
De Leo, F., Briganti, R., and Besio, G.: Trends in ocean waves climate within the Mediterranean Sea: a review, Clim. Dynam., 62, 1555–1566, https://doi.org/10.1007/s00382-023-06984-4, 2023.
Denaxa, D., Korres, G., Sotiropoulou, M., and Lecci, R.: EU Copernicus Marine Service Product User Manual for the Mediterranean Sea Waves Reanalysis, MEDSEA_MULTIYEAR_WAV_006_012, Issue: 2.3, Mercator Ocean International, https://catalogue.marine.copernicus.eu/documents/PUM/CMEMS-MED-PUM-006-012.pdf (last access: 1 March 2024), 2023.
ECCLIPSE website: Homepage, https://ecclipse.eu/, last access: 11 January 2024.
Emery, W. J. and Thompson, R. E.: Data Analysis Methods in Physical Oceanography, Elsevier Science, Amsterdam, 654 pp., ISBN 9780080477008, 2001.
EU Copernicus Marine Service Product: Atlantic Iberian Biscay Irish Ocean- In-Situ Near Real Time Observations, Mercator Ocean International [data set], https://doi.org/10.48670/moi-00043, 2023a.
EU Copernicus Marine Service Product: Mediterranean Sea Waves Reanalysis, Mercator Ocean International [data set], https://doi.org/10.25423/cmcc/medsea_multiyear_wav_006_012, 2023b.
Elgar, S., Herbers, T. H. C., Okihiro, M., Oltman-Shay, J., and Guza, R. T.: Observations of infragravity waves, J. Geophys. Res., 97, 15573–15577, 1992.
Erikson, L., Morim, J., Hemer, M., Young, I., Wang, X. L., Mentaschi, L., Mori, N., Semedo, A., Stopa, J., Grigorieva, V., Gulev, S., Aarnes, O., Bidlot, J.-R., Breivik, Ø., Bricheno, L., Shimura, T., Menendez, M., Markina, M., Sharmar, V., Trenham, C., Wolf, J., Appendini, C., Caires, S., Groll, N., and Webb, A.: Global Ocean wave fields show consistent regional trends between 1980 and 2014 in a multi-product ensemble, Commun. Earth Environ., 3, 320, https://doi.org/10.1038/s43247-022-00654-9, 2022.
Eyring, V., Gillett, N. P., Achuta Rao, K. M., Barimalala, R., Barreiro Parrillo, M., Bellouin, N., Cassou, C., Durack, P. J., Kosaka, Y., McGregor, S., Min, S., Morgenstern, O., and Sun, Y.: Human Influence on the Climate System, In Climate Change 2021: The Physical Science Basis. Contribution of Working Group I to the Sixth Assessment Report of the Intergovernmental Panel on Climate Change, edited by: Masson-Delmotte, V., Zhai, P., Pirani, A., Connors, S. L., Péan, C., Berger, S., Caud, N., Chen, Y., Goldfarb, L., Gomis, M. I., Huang, M., Leitzell, K., Lonnoy, E., Matthews, J. B. R., Maycock, T. K., Waterfield, T., Yelekçi, O., Yu, R., and Zhou, B., Cambridge University Press, Cambridge, United Kingdom and New York, NY, USA, 423–552, https://doi.org/10.1017/9781009157896.005, 2021.
Fanti, V., Ferreira, Ó., Kümmerer, V., and Loureiro, C.: Improved estimates of extreme wave conditions in coastal areas from calibrated global reanalyses, Commun. Earth Environ., 4, 151, https://doi.org/10.1038/s43247-023-00819-0, 2023.
García-Valdecasas, J., Pérez Gómez, B., Molina, R., Rodríguez, A., Rodríguez, D., Pérez, S., Campos, A., Rodríguez-Rubio, P., Gracia, S., Ripollés, L., Terrés Nicoli, J. M., de los Santos, F. J., and Álvarez-Fanjul, E.: Operational tool for characterizing high-frequency sea level oscillations, Nat. Hazards, 106, 1149–1167, https://doi.org/10.1007/s11069-020-04316-x, 2021.
Garrabou, J., Gómez-Gras, D., Medrano, A., Cerrano, C., Ponti, M., Schlegel, R., Bensoussan, N., Turicchia, E., Sini, M., Gerovasileiou, V., Teixido, N., Mirasole, A., Tamburello, L., and Cebrian, E.: Marine heatwaves drive recurrent mass mortalities in the Mediterranean Sea, Glob. Change Biol., 28, 5708–5725, https://doi.org/10.1111/gcb.16301, 2022.
Giesen, R., Clementi, E., Bajo, M., Federico, I., Stoffelen, A., and Santoleri, R.: The November 2019 record high water levels in Venice, Italy, J. Oper. Oceanogr., 14, 156–162, https://doi.org/10.1080/1755876X.2021.1946240, 2021.
Goda, Y.: On the methodology of selecting design wave height, in: Proceedings 21st Coastal Engineering Conference, ASCE, New York, 20–25 June 1988, 899–913, https://doi.org/10.9753/icce.v21.67, 1988.
Gutiérrez-Serret, R., Grassa, J. M., and Grau, J. I.: Breakwater development in Spain, The last ten years, Proceeding presented at Coasts, Marine Structures and Breakwaters: Adapting to Change, 9th International Conference organised by the Institution of Civil Engineers, Edinburgh, Scotland, UK, 16–18 September 2009, https://doi.org/10.1680/cmsb.41301.0004, 2009.
Guza, R. T. and Thornton, E. B.: Swash oscillations on a natural beach, J. Geophys. Res.-Oceans, 87, 483–491, 1982.
Haigh, R., Amaratunga, D., and Hemachandra, K.: A capacity analysis framework for multi-hazard early warning in coastal communities, Procedia Engineer., 212, 1139–1146, https://doi.org/10.1016/j.proeng.2018.01.147, 2018.
Harley, M.: Coastal storm definition, in: Coastal storms: processes and impacts, John Wiley & Sons, 1–21, https://doi.org/10.1002/9781118937099.ch1, 2017.
Hersbach, H., Bell, B., Berrisford, P., Biavati, G., Horányi, A., Muñoz Sabater, J., Nicolas, J., Peubey, C., Radu, R., Rozum, I., Schepers, D., Simmons, A., Soci, C., Dee, D., and Thépaut, J.-N.: ERA5 hourly data on single levels from 1940 to present, Copernicus Climate Change Service (C3S) Climate Data Store (CDS) [data set], https://doi.org/10.24381/cds.adbb2d47, 2023.
Hochman, A., Marra, F., Messori, G., Pinto, J. G., Raveh-Rubin, S., Yosef, Y., and Zittis, G.: Extreme weather and societal impacts in the eastern Mediterranean, Earth Syst. Dynam., 13, 749–777, https://doi.org/10.5194/esd-13-749-2022, 2022.
Hurrell, J. W. and Deser, C.: North Atlantic climate variability: The role of the North Atlantic Oscillation, J. Mar. Syst., 78, 28–41, https://doi.org/10.1016/j.jmarsys.2009.11.002, 2009.
Inch, K., Davidson, M., Masselink, G., and Russell, P.: Observations of nearshore infragravity wave dynamics under high energy swell and wind-wave conditions, Cont. Shelf Res., 138, 19–31, https://doi.org/10.1016/j.csr.2017.02.010, 2017.
In Situ TAC partners: EU Copernicus Marine Service Product User Manual for the Atlantic Iberian Biscay Irish Ocean- In- Situ Near Real Time Observations, INSITU_IBI_PHYBGCWAV_DISCRETE_MYNRT_013_033, Issue: 2.0, Mercator Ocean International, https://catalogue.marine.copernicus.eu/documents/PUM/CMEMS-INS-PUM-013-030-036.pdf (last access: 1 March 2024), 2023.
Intergovernmental Panel on Climate Change (IPCC): The Ocean and Cryosphere in a Changing Climate: Special Report of the Intergovernmental Panel on Climate Change, Cambridge University Press, Cambridge, https://doi.org/10.1017/9781009157964, 2022.
Izaguirre, C., Losada, I. J., Camus, P., Vigh, J. L., and Stenek, V.: Climate change risk to global port operations, Nat. Clim. Change, 11, 14–20, https://doi.org/10.1038/s41558-020-00937-z, 2021.
Juza, M. and Tintoré, J.: Multivariate Sub-Regional Ocean Indicators in the Mediterranean Sea: From Event Detection to Climate Change Estimations, Front. Mar. Sci., 8, 610589, https://doi.org/10.3389/fmars.2021.610589, 2021.
Kautz, L.-A., Martius, O., Pfahl, S., Pinto, J. G., Ramos, A. M., Sousa, P. M., and Woollings, T.: Atmospheric blocking and weather extremes over the Euro-Atlantic sector – a review, Weather Clim. Dynam., 3, 305–336, https://doi.org/10.5194/wcd-3-305-2022, 2022.
Kendall, M. G.: Rank Correlation Methods; Hafner Publishing Company, New York, NY, USA, ISBN B008089IDY, 1962.
Kokkini, Z. and Notarstefano, G.: Unusual salinity pattern in the South Adriatic Sea in 2016, Copernicus Marine Service Ocean State Report, J. Oper. Oceanogr., 11, 130–131, https://doi.org/10.1080/1755876X.2018.1489208, 2018.
Konisky, D. M., Hughes, L., and Kaylor, C.H.: Extreme weather events and climate change concern, Climatic Change, 134, 533–547, https://doi.org/10.1007/s10584-015-1555-3, 2015.
Lashley, C. H., Bricker, J. D., Van der Meer, J., Altomare, C., and Suzuki, T.: Relative Magnitude of Infragravity Waves at Coastal Dikes with Shallow Foreshores: A Prediction Tool, J. Waterw. Port C., 146, 1–17, https://doi.org/10.1061/(ASCE)WW.1943-5460.0000576, 2020.
Linnenluecke, M. K., Griffiths, A., and Winn, M.: Extreme weather events and the critical importance of anticipatory adaptation and organizational resilience in responding to impacts, Bus. Strat. Environ., 21, 17–32, https://doi.org/10.1002/bse.708, 2012.
López, M. and Iglesias, G.: Long wave effects on a vessel at berth, Appl. Ocean Res., 47, 63–72, https://doi.org/10.1016/j.apor.2014.03.008, 2014.
Lorente, P., Lin-Ye, J., García-León, M., Reyes, E., Fernandes, M., Sotillo, M. G., Espino, M., Ruiz, M. I., Gracia, V., Pérez, S., Aznar, R., Alonso-Martirena, A., and Álvarez-Fanjul, E.: On the Performance of High Frequency Radar in the Western Mediterranean During the Record-Breaking Storm Gloria, Front. Mar. Sci., 8, 645762, https://doi.org/10.3389/fmars.2021.645762, 2021.
Lupo, A. R.: Atmospheric blocking events: a review, Ann. N. Y. Acad. Sci., 1504, 5–24, https://doi.org/10.1111/nyas.14557, 2021.
Mackay, E. and Johanning, L.: Long-term distributions of individual wave and crest heights, Ocean Eng., 165, 164–183, https://doi.org/10.1016/j.oceaneng.2018.07.047, 2018a.
Mackay, E. and Johanning, L.: A generalised equivalent storm model for long-term statistics of ocean waves, Coast. Eng., 140, 411–428, https://doi.org/10.1016/j.coastaleng.2018.06.001, 2018b.
Mann, H. B. Nonparametric tests against trend, Econometrica, 13, 245–259, 1945.
McComb, J.: Modelling long wave generation and propagation around and within ports, Proc. 2011 Coasts and Ports Conf. Perth, Australia, 28–30 September 2011.
McComb, P., Zyngfogel, R., and Pérez-Gomez, B.: Predicting infragravity waves in harbours – an evaluation of published equations and their use in forecasting operational thresholds, Coastal Engineering Proceedings, 36v, waves.7, https://doi.org/10.9753/icce.v36v.waves.7, 2020.
Milglietta, M. M. and Rotunno, R.: Development mechanisms for Mediterranean tropical-like cyclones (medicanes), Q. J. Roy. Meteor. Soc., 145, 1444–1460, 2019.
Morales-Márquez, V., Orfila, A., Simarro, G., and Marcos, M.: Extreme waves and climatic patterns of variability in the eastern North Atlantic and Mediterranean basins, Ocean Sci., 16, 1385–1398, https://doi.org/10.5194/os-16-1385-2020, 2020.
Naseef, T. M., Kumar, V. S., Joseph, J., and Jena, B. K.: Uncertainties of the 50-year wave height estimation using generalized extreme value and generalized Pareto distributions in the Indian Shelf seas, Nat. Hazards, 97, 1231–1251, https://doi.org/10.1007/s11069-019-03701-5, 2019.
Munk, W. H.: On the wind-driven ocean circulation, J. Atmos. Sci., 7, 80–93, https://doi.org/10.1175/1520-0469(1950)007<0080:OTWDOC>2.0.CO;2, 1950.
Notarstefano, G., Menna, M., and Legeais, J. F.: Reversal of the Northern Ionian circulation in 2017, Ocean State Report, 3, J. Oper. Oceanogr., 12, 108–111, https://doi.org/10.1080/1755876X.2019.1633075, 2019.
Okihiro, M., Guza, R. T., and Seymour, R. J.: Excitation of seiche observed in a small harbor, J. Geophys. Res., 98, 18.201–18.211, 1993.
Pérez, B., Payo, A., López, D., Woodworth, P. L., and Alvarez Fanjul, E.: Overlapping sea level time series measured using different technologies: an example from the REDMAR Spanish network, Nat. Hazards Earth Syst. Sci., 14, 589–610, https://doi.org/10.5194/nhess-14-589-2014, 2014.
Pérez-Gómez, B., Vela, J., and Alvarez-Fanjul, E.: A new concept of multi-purpose sea level station: example of implementation in the REDMAR network, in: Proceedings of the Fifth International Conference on EuroGOOS, 20–22 May 2008: Coastal to global operational oceanography: achievements and challenges, Exeter, 2008.
Pérez-Gómez, B., García-León, M., García-Valdecasas, J., Clementi, E., Mösso Aranda, C., Pérez-Rubio, S., Masina, S., Coppini, G., Molina-Sánchez, R., Muñoz-Cubillo, A., García Fletcher, A., Sánchez González, J. F., Sánchez-Arcilla, A., and Álvarez-Fanjul, E.: Understanding Sea Level Processes During Western Mediterranean Storm Gloria, Front. Mar. Sci. 8, 647437, https://doi.org/10.3389/fmars.2021.647437, 2021.
Portillo Juan, N., Negro Valdecantos, V., and del Campo, J. M.: Review of the Impacts of Climate Change on Ports and Harbours and Their Adaptation in Spain, Sustainability, 14, 7507, https://doi.org/10.3390/su14127507, 2022.
Radovic, V. and Iglesias, I.: Extreme Weather Events: Definition, Classification and Guidelines towards Vulnerability Reduction and Adaptation Management, in: Climate Action. Encyclopedia of the UN Sustainable Development Goals, edited by: Leal Filho, W., Azul, A., Brandli, L., Özuyar, P., and Wall, T., Springer, Cham. https://doi.org/10.1007/978-3-319-71063-1_68-1, 2018.
Ramirez-Llodra, E., De Mol, B., Company, J. B., Coll, M., and Sardà, F.: Effects of natural and anthropogenic processes in the distribution of marine litter in the deep Mediterranean Sea, Prog. Oceanogr., 118, 273–287, https://doi.org/10.1016/j.pocean.2013.07.027, 2013.
Rex, D. F.: Blocking action in the middle troposphere and its effect upon regional climate, Tellus, 2, 275–301, https://doi.org/10.1111/j.2153-3490.1950.tb00339.x, 1950.
Ribeiro, A. S., Lopes, C. L., Sousa, M. C., Gómez-Gesteira, M., Vaz, N., and Dias, J. M.: Reporting Climate Change Impacts on Coastal Ports (NW Iberian Peninsula): A Review of Flooding Extent, J. Mar. Sci. Eng., 11, 477, https://doi.org/10.3390/jmse11030477, 2023.
Romano-Moreno, E., Diaz-Hernandez, G., Lara, J. L. Tomás, A., and Jaime, F. F.: Wave downscaling strategies for practical wave agitation studies in harbours, Coast. Eng., 175, 104140, https://doi.org/10.1016/j.coastaleng.2022.104140, 2022.
Salvadori, G., Durante, F., and De Michele, C.: Multivariate return period calculation via survival functions, Water Resour. Res., 49, 2308–2311, https://doi.org/10.1002/wrcr.20204, 2013.
Sánchez-Arcilla, A., García-León, M., Gracia, V., Devoy, R., Stanica, A., and Gault, J.: Managing coastal environments under climate change: Pathways to adaptation, Sci. Total Environ., 572, 1336–1352, https://doi.org/10.1016/j.scitotenv.2016.01.124, 2016a.
Sánchez-Arcilla, A., Sierra, J. P., Brown, S., Casas-Prat, M., Nicholls, R. J., Lionello, P., and Conte, D.: A review of potential physical impacts on harbours in the Mediterranean Sea under climate change, Reg. Environ. Change, 16, 2471–2484, https://doi.org/10.1007/s10113-016-0972-9, 2016b.
Scicchitano, G., Scardino, G., Monaco, C., Piscitelli, A., Milella, M., De Giosa, F., and Mastronuzzi, G.: Comparing impact effects of common storms and Medicanes along the coast of south-eastern Sicily, Mar. Geol., 439, 106556, https://doi.org/10.1016/j.margeo.2021.106556, 2021.
Sen, P. K.: Estimates of the regression coefficient based on Kendall's tau, J. Am. Stat. Assoc., 63, 1379–1389, 1968.
Senechal, N., Coco, G., Bryan, K. R., and Holman, R. A.: Wave runup during extreme storm conditions, J. Geophys. Res., 116, C07032, https://doi.org/10.1029/2010JC006819, 2011.
Sierra, J. P., Casas-Prat, M., Virgili, M., Mösso, C., and Sánchez-Arcilla, A.: Impacts on wave-driven harbour agitation due to climate change in Catalan ports, Nat. Hazards Earth Syst. Sci., 15, 1695–1709, https://doi.org/10.5194/nhess-15-1695-2015, 2015.
Sierra, J. P., Genius, A. Lionello, P. Mestres, M., Mösso, C., and Marzo, L.: Modelling the impact of climate change on harbour operability: The Barcelona port case study, Ocean Eng., 141, 64–78, https://doi.org/10.1016/j.oceaneng.2017.06.002, 2017.
Sotillo, M. G., Mourre, B., Mestres, M., Lorente, P., Aznar, R., García-León, M., Liste, M., Santana, A., Espino, M., and Álvarez, E.: Evaluation of the Operational CMEMS and Coastal Downstream Ocean Forecasting Services During the Storm Gloria (January 2020), Front. Mar. Sci., 8, 644525, https://doi.org/10.3389/fmars.2021.644525, 2021.
Sousa, P. M., Barriopedro, D., García-Herrera, R., Woollings, T., and Trigo, R. M.: A New Combined Detection Algorithm for Blocking and Subtropical Ridges, J. Climate, 34, 7735–7758, https://doi.org/10.1175/JCLI-D-20-0658.1, 2021.
Soussi, A., Bersani, C., Sacile, R., Bouchta, D., El Amarti, A., Seghiouer, H., Nachite, D., and Al Miys, J.: Coastal Risk Modelling for Oil Spill in The Mediterranean Sea, Advances in Science, Technol. Eng. Syst. J., 5, 273–286, 2020.
Stockdon, H. F., Holman, R. A., Howd, P. A., and Sallenger Jr., A. H.: Empirical parameterization of setup, swash and runup, Coast. Eng., 53, 573–588, 2006.
Todd, D., Blanksby, A., and Schepis, J.: Verification of design life exposure and performance of a berm breakwater, Coast. Eng. Proceedings, 1, structures.72, https://doi.org/10.9753/icce.v33.structures.72, 2012.
Trigo, I. F., Davies, T. D., and Bigg, G. R. Objective climatology of cyclones in the Mediterranean region, J. Climate, 12, 1685–1696, https://doi.org/10.1175/1520-0442(1999)012<1685:OCOCIT>2.0.CO;2, 1999.
Tuel, A. and Eltahir, E. A. B.: Why Is the Mediterranean a Climate Change Hot Spot?, J. Climate, 33, 5829–5843, https://doi.org/10.1175/JCLI-D-19-0910.1, 2020.
Vanem, E., Fazeres-Ferradosa, T., Rosa-Santos, P., and Taveira-Pinto, F.: Statistical description and modelling of extreme ocean wave conditions, Proceedings of the Institution of Civil Engineers – Maritime Engineering, 172, 124–132, 2019.
Vannucchi, V., Taddei, S., Capecchi, V., Bendoni, M., and Brandini, C.: Dynamical Downscaling of ERA5 Data on the North-Western Mediterranean Sea: From Atmosphere to High-Resolution Coastal Wave Climate, Journal of Marine Science and Engineering, 9, 208, https://doi.org/10.3390/jmse9020208, 2021.
Velpuri, M., Das, J., and Umamahesh, N. V.: Spatio-temporal compounding of connected extreme events: Projection and hotspot identification, Environ. Res., 235, 116615, https://doi.org/10.1016/j.envres.2023.116615, 2023.
Verschuur, J., Koks, E. E., and Hall, J. W.: Ports' criticality in international trade and global supply-chains, Nat. Commun., 13, 4351, https://doi.org/10.1038/s41467-022-32070-0, 2022.
Verschuur, J., Koks, E. E., Li, S., and Hall, J. W.: Multi-hazard risk to global port infrastructure and resulting trade and logistics losses, Commun. Earth Environ., 4, 5, https://doi.org/10.1038/s43247-022-00656-7, 2023.
WCRP website: Homepage, https://www.wcrp-climate.org/gc-extreme-events, last access: 11 January 2024.
Wehde, H., Schuckmann, K. V., Pouliquen, S., Grouazel, A., Bartolome, T., Tintore, J., De Alfonso Alonso-Muñoyerro, M., Carval, T., Racapé, V., and the INSTAC team: EU Copernicus Marine Service Quality Information Document for the Atlantic Iberian Biscay Irish Ocean- In-Situ Near Real Time Observations, INSITU_IBI_PHYBGCWAV_DISCRETE_MYNRT_013_033, Issue 2.3, Mercator Ocean International, https://catalogue.marine.copernicus.eu/documents/QUID/CMEMS-INS-QUID-013-030-036.pdf (last access: 1 March 2024), 2023.
Wolff, C., Vafeidis, A. T., Muis, S., Lincke, D., Satta, A., Lionello, P., Jimenez, J. A., Conte, D., and Hinkel, J. A.: Mediterranean coastal database for assessing the impacts of sea-level rise and associated hazards, Sci. Data, 5, 180044, https://doi.org/10.1038/sdata.2018.44, 2018.
Zacharioudaki, A., Ravdas, M., and Korres, G.: Wave climate extremes in the Mediterranean Sea obtained from a wave reanalysis for the period 1993–2020. In: Copernicus Ocean State Report, Issue 6, J. Oper. Oceanogr., 15, s119–s126, https://doi.org/10.1080/1755876X.2022.2095169, 2022.
Zacharioudaki, A., Ravdas, M., Korres, G., and Goglio, A. C.: EU Copernicus Marine Service Quality Information Document for the Mediterranean Sea Waves Reanalysis. MEDSEA_MULTIYEAR_WAV_006_012, Issue: 2.3, Mercator Ocean 765 International, https://catalogue.marine.copernicus.eu/documents/QUID/CMEMS-MED-QUID-006-012.pdf (last access: 1 March 2024), 2023.