the Creative Commons Attribution 4.0 License.
the Creative Commons Attribution 4.0 License.
 | 30 Sep 2024 | OSR8 | Chapter 4.4
Baltic Sea surface temperature analysis 2022: a study of marine heatwaves and overall high seasonal temperatures
Anja Lindenthal
Simon Jandt-Scheelke
Tim Kruschke
Priidik Lagemaa
Eefke M. van der Lee
Ilja Maljutenko
Helen E. Morrison
Tabea R. Panteleit
Urmas Raudsepp
In 2022, large parts of the Baltic Sea surface experienced the third-warmest to the warmest temperatures over the summer and autumn months since 1997. Warm temperature anomalies can lead to marine heatwaves (MHWs), which are discrete periods of anomalous high temperatures relative to the usual local conditions. Here, we describe the overall sea surface temperature (SST) conditions observed in the Baltic Sea in 2022 and provide a spatiotemporal description of surface MHW events based on remote sensing, reanalysis, and in situ station data. The most MHWs, locally up to seven MHW events, were detected in the western Baltic Sea and the Inner Danish Straits, where maximum MHW intensities reached values of up to 4.6 °C above the climatological mean. The northern Baltic Proper and the Gulf of Bothnia were impacted mainly by two MHWs at maximum intensities of 7.3 and 9.6 °C, respectively. Our results also reveal that MHWs in the upper layer occur at a different period than at the bottom layers and are likely driven by different mechanisms. Reanalysis data from two exemplary stations, “Lighthouse Kiel (LT Kiel)” and “Northern Baltic”, show a significant increase in MHW occurrences of +0.73 MHW events per decade at LT Kiel and of +0.64 MHW events per decade at Northern Baltic between 1993 and 2022. Moreover, we discuss the expected future increased occurrence of MHWs based on a statistical analysis at both locations.
- Article
(9326 KB) - Full-text XML
- BibTeX
- EndNote


Global warming has led to an increase in ocean heat content (OHC) by about 350 ZJ in the upper 2000 m from 1958 to 2019, with the year 2022 being the warmest on record as of writing (Cheng et al., 2022; WMO, 2023). Simultaneously, marine heatwaves (MHWs), extreme events of high water temperature (Hobday et al., 2016), have increased in frequency, duration, spatial extent, and intensity during the past 4 decades (Sun et al., 2023). In 2022, MHWs were recorded on 58 % of the ocean surface (WMO, 2023).
The Baltic Sea is one of the marine ecosystems with the fastest recorded warming of surface temperatures of 1.35 °C between 1982 and 2006, i.e., 0.54 °C per decade (Belkin, 2009). Sea surface temperature (SST) data operationally produced by the German Federal Maritime and Hydrographic Agency (in the following BSH, product ref. no. 1 in Table 1) show a warming trend of 0.58 °C per decade for the period 1990–2022. High SSTs can affect phytoplankton production, while unprecedented high temperatures in the subsurface layers of the sea could have even more devastating effects on the marine ecosystem (Kauppi et al., 2023). Conditions that facilitate the fast warming of the Baltic Sea are the limited exchange between surface and deeper layers due to a permanent halocline at a depth of 60–80 m (Väli et al., 2013) and the limited water exchange between the Baltic Sea and the open ocean through the narrow Skagerrak. That is why local air–sea heat exchange is the main physical factor for the surface layer water temperature and heat content in the Baltic Sea (Raudsepp et al., 2022).
Global mean air temperature in 2022 was among the six warmest in the 173-year instrumental record (WMO, 2023). For Europe especially, the Copernicus Climate Change Service/ECMWF (2022a) states that the air temperatures in August 2022 were higher than the 1991–2020 average across most of the continent, especially in a band in Eastern Europe stretching from the Barents and Kara seas to the Caucasus. In November 2022, air temperatures were higher than the 1991–2020 average, especially over the west, southeast, and far north of Europe, and were unusually mild over the northern European seas (Copernicus Climate Change Service/ECMWF, 2022b). These large-scale weather patterns likely lead to high sea surface temperatures (SST) in marginal seas like the Baltic Sea and are a likely driver of MHWs. This hypothesis is further supported by a study by Holbrook et al. (2019), which found that MHWs at middle- and high-latitude regions were driven by large-scale atmospheric pressure anomalies which cause anomalous ocean warming. Stalled atmospheric high-pressure systems coincide with clear skies, warm air, and reduced wind speeds. These conditions then lead to quick warming of the upper ocean and increased thermal stratification due to reduced vertical mixing.
So far, there generally have been only a few studies on MHWs in the Baltic Sea (Goebeler at al., 2022; She et al., 2020). In this study, we show that remote sensing data revealed several SST anomalies over the entire Baltic Sea in 2022. We thus use reanalysis and in situ station data to provide a spatiotemporal description of the corresponding MHWs. Both datasets contain data collected over a long enough period to also provide its own respective climatology, thereby enabling a consistent representation of MHWs. While the in situ data provide accurate point-wise measurements of the temperature at selected locations, the reanalysis data allow for a widespread analysis of MHWs over the entire Baltic Sea, including their extension into subsurface layers. Furthermore, we extend our study by providing a climatology of MHWs at two specific mooring locations, namely at the Lighthouse Kiel (LT Kiel) and Northern Baltic stations. The overall aim of this study is to highlight the areas of the Baltic Sea that were (most) affected by MHWs and determine whether surface MHWs can propagate into deeper layers and thus potentially threaten the subsurface ecosystem. Furthermore, analyzing the climatology of MHWs can provide insight into whether the global increase in MHWs can also be expected to occur on a local scale for the Baltic Sea.
2.1 Satellite data
The satellite data service at the BSH compiles daily maps of SST data (product ref. no. 1 in Table 1). These have contributed, for example, to the assessment of climate change in the Baltic Sea (The BACC Author Team, 2008) and to the model evaluation in the Baltic Sea Model Intercomparison Project (Gröger et al., 2022). The SST data are recorded as radiances by the Advanced Very High Resolution Radiometer (AVHRR/3) in two thermal infrared channels aboard the NOAA-19 and MetOp B satellites, providing a spatial resolution of 1.1 km, swath widths of 1447 km, and orbital periods of 100 min (EUMETSAT, 2015; Minnett et al., 2019). The raw data of eight or nine daytime passes over the Baltic and North Sea are received directly from EUMETSAT and processed using automated, standardized correction procedures (atmospheric correction, cloud masking, georeferencing, etc.). Additionally, each flyover is corrected manually in order to preserve as much data as possible whilst eliminating any faulty or cloudy pixels. All available single images from a calendar day are combined and averaged, on a single pixel basis, into one daily mean image. These daily images are then used to produce a weekly analysis on an operational basis. While the BSH has been carrying out the processing of the satellite data itself on the 1.1 km grid since 1990, operational SST analysis for the Baltic Sea did not start until the autumn of 1996. The analysis of the BSH SST dataset presented in this chapter is therefore limited to the period from 1997–2022.
2.2 Station data
In situ temperature time series from mooring stations located in the Baltic Sea are used for (1) model validation and (2) cross validation of the MHW computation from the reanalysis data. Except for SST data from Northern Baltic (Hedi Kanarik, FMI, personal communication, 2023), the station data are obtained from product ref. no. 2 in Table 1. Each available dataset has already been quality controlled by the regional production units (In Situ TAC partners, 2023). The temporal resolution varies from hourly at the German stations to half-hourly at the stations in the northern Baltic Proper and Gulf of Finland. Due to failures, maintenance, and other circumstances, no mooring station entirely covers the period from 1 January 1993 until now.
Of all available mooring stations, we selected those that contain data from 2022 and from at least 10 additional years from 1993 until 2021 for at least one depth. Out of the remaining seven mooring stations that contained surface temperature data, two mooring stations were chosen for the cross validation of MHWs: Lighthouse Kiel (LT Kiel) and Northern Baltic (Fig. 1). Regarding the observation data, LT Kiel has the greatest time coverage (1989 until the present, missing data: 9.1 % of days). This mooring station lies in the far western part of the southern Baltic, and the water depth there is about 12 m. The station Northern Baltic is located in the northern Baltic Proper, and the SST observations there cover the period from 1997 until now (missing data: 8.0 % of days). No mooring station provides a time series in deeper layers long or consistent enough to analyze subsurface MHWs, thus reducing the scope of measurement-based analysis of MHWs to the surface layers.
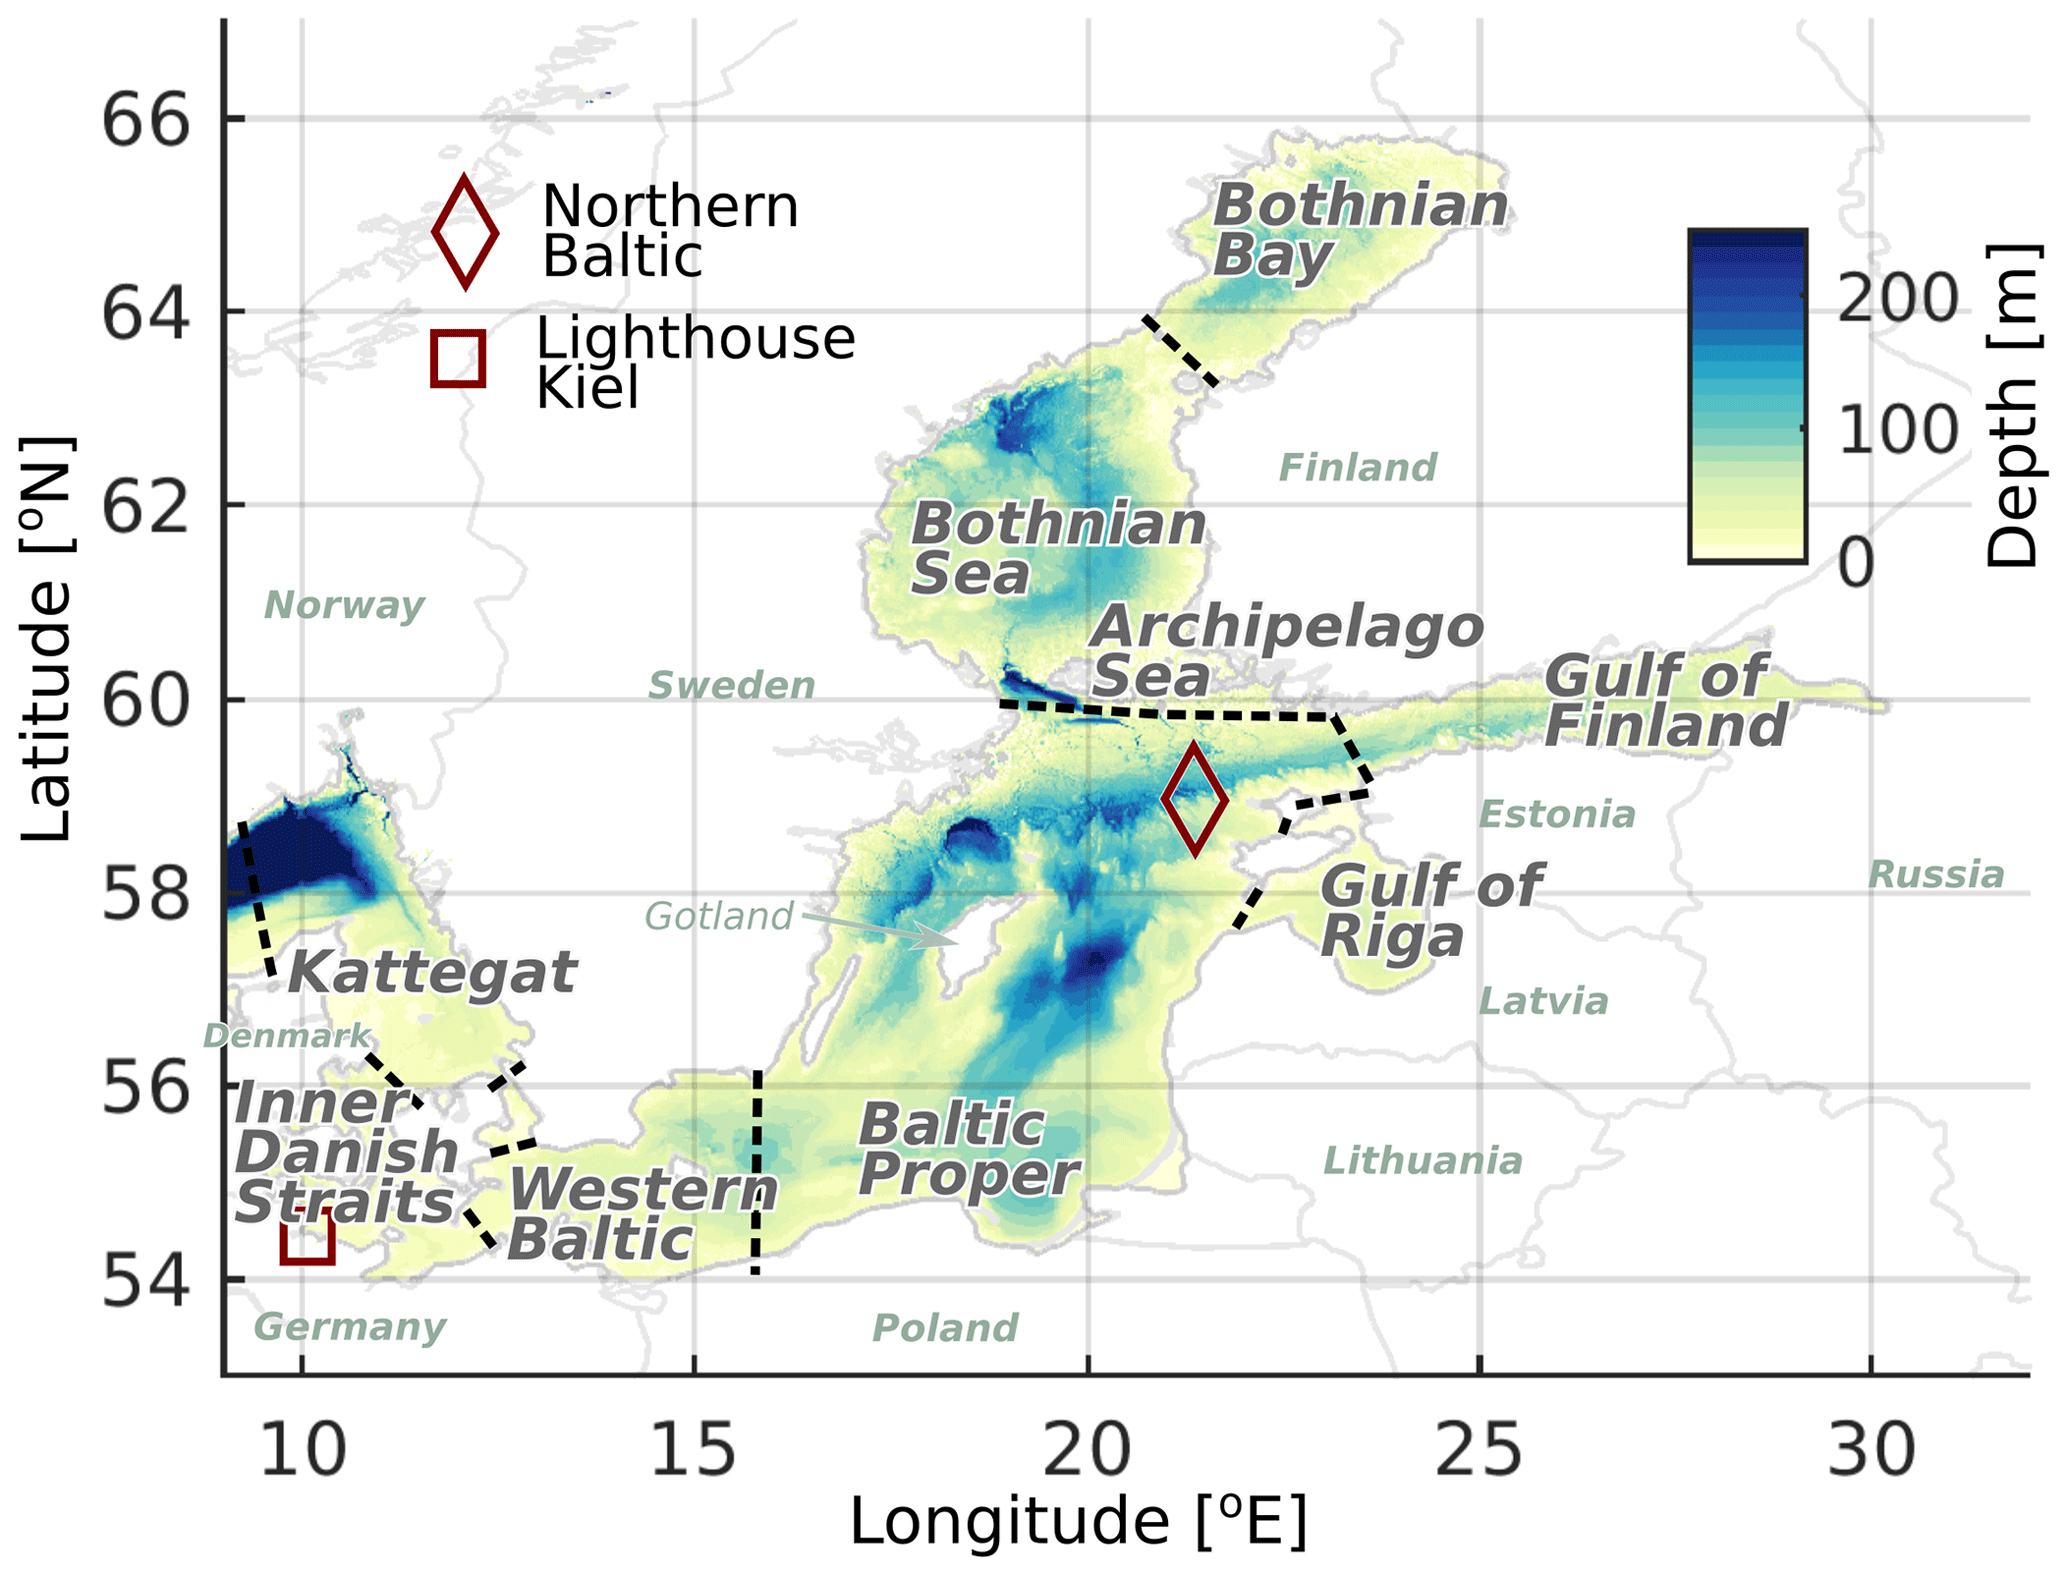
Figure 1Map of the Baltic Sea with relevant locations mentioned in the study. Boundaries between subregions are marked with dashed lines.
2.3 Baltic Sea physics reanalysis data
The Baltic Sea physics reanalysis multi-year product (BAL-MYP; product ref. no. 3 in Table 1) is a dataset based on the ocean model NEMO v4.0 (Gurvan et al., 2019). The model system assimilates satellite observations of SST (EU Copernicus Marine Service Product, 2023b) and in situ temperature and salinity profile observations from the ICES database (ICES Bottle and low-resolution CTD dataset, 2022). The product provides gridded information on SST and subsurface temperature conditions. The spatial coverage is 1 nautical mile, i.e., approximately 1.8 km. The grid covers the entire Baltic Sea, including the transition zone to the North Sea, with a vertical resolution of 56 non-equidistant depth levels. This multi-year product (MYP) covers the reference period from 1993 up to 2022. The model setup is described in the product user manual (PUM; Ringgaard et al., 2023).
2.4 Heatwave detection
Marine heatwaves refer to a discrete period of unusually high seawater temperatures. While several definitions describe MHWs quantitatively, the most commonly used method defines them as periods when temperatures exceed the 90th percentile of the local climatology for 5 d or more (Hobday et al., 2016). We use open-source tools to detect MHWs (Oliver, 2016; Zhao and Marin, 2019a) in station and reanalysis data. The identified MHWs can be classified following Hobday et al. (2018), in which the MHW category is based on the maximum intensity in multiples of threshold exceedances, i.e., the local difference between the 90th percentile threshold and the climatology. If the threshold is exceeded less than two times, the MHW is classified as moderate (Category I), at two to three times it is classified as strong (Category II), at three to four times it is classified as severe (Category III), and at four or more times it is classified as extreme (Category IV).
Here, the occurrence of MHWs in the Baltic Sea in 2022 is analyzed based on the BAL-MYP (product ref. no. 3 in Table 1). MHWs are computed at every third surface grid point, resulting in a resolution of approximately 5.4 km for the following statistical metrics: cumulative intensity, mean intensity, duration of the longest heatwave, number of heatwaves (frequency), maximum intensity and total days of MHW conditions.
Then, in order to evaluate the development of those MHW metrics over time, block averages (using a block length of one year) for each MHW metric are computed for both the observations (product ref. no. 2 in Table 1) and the BAL-MYP (product ref. no. 3 in Table 1) at two stations: Lighthouse Kiel and Northern Baltic. The yearly MHW metrics from observations and the reanalysis are correlated for evaluation, and linear trends (95 % significance) are calculated for each of those metrics. Finally, the correlation of the annual MHW metrics to the annual mean temperature based on reanalysis data was assessed using a linear least-squares regression and a two-sided t test for significance.
All MHW assessments in the following sections use the period from 1993 to 2021 for the climatology, except for Sect. 3.2.1, in which the comparison of the multi-year evolution of MHWs at Northern Baltic uses the overlapping period from 1997 to 2021 due to the lack of observations at this station before 1997.
2.5 Validation of the Baltic Sea physics reanalysis
The BAL-MYP (product ref. no. 3 in Table 1) has already been extensively validated in the corresponding quality information document (QuID; Panteleit et al., 2023), where the reanalysis data are validated within the time period from 1 January 1993 to 31 December 2018. The validation in the QuID shows a negative bias at the surface with a shift towards more positive values at deeper levels. A variation in statistical values with depth is also clearly visible in the estimated accuracy number (EAN), which represents the root-mean-square difference (RMSD) of a specific depth layer. The RMSD varies between 0.29 °C at 200–400 m over 0.63 °C at the surface to 1.3 °C at 5–30 m depth.
For this study, we additionally evaluated the BAL-MYP data in more detail using a clustering approach, which offers insights into the overall accuracy of the reanalysis by grouping the errors. This clustering procedure employs the k-means algorithm (Raudsepp and Maljutenko, 2022). In this evaluation, all available data within the model's domain and simulation period are considered. A two-dimensional error space (dS, dT) is established using simultaneously measured temperature and salinity values as the foundation for clustering. Here, and represent the differences between the reanalysis (Smod and Tmod) and observed (Sobs and Tobs) salinity and temperature, respectively. The dataset employed in this validation study was sourced from the EMODNET dataset compiled by SMHI (product ref. no. 4 in Table 1). It consists of a total of 3 094 089 observations aligning with the simulation period of the BAL-MYP and covering the years 1993 to 2022. A comprehensive explanation of the k-means method and detailed results describing the accuracy of the BAL-MYP can be found in Appendix A. The results can be summarized as in that approximately 82 % of all validation points exhibit relatively low temperature bias, standard deviation (SD), and RMSD (Table A1). The surface layer validation shows that less than 10 % of comparison points have significant temperature errors (Fig. A1c). Due to the low proportion of these validation points, we do not expect a significant impact on the determination of the surface MHWs and their statistics. Below the surface layer, i.e., at depths ranging from 0.5–40 m, up to 25 % of the points correspond to clusters with temperature errors greater than ±2.0 °C; in deeper layers, this percentage gets smaller again (Fig. A1c). Consequently, we anticipate that the reanalysis data provide sufficiently accurate information for calculating both surface and subsurface MHWs and their statistics for the Baltic Sea.
Table 2Pearson correlation coefficients from linear regression between the MHW metrics computed from the station data and the reanalysis data at the stations Lighthouse Kiel and Northern Baltic.
The BAL-MYP is also validated in terms of how accurately it reproduces the MHWs of 2022 and how well it represents their characteristics during the overlapping time periods of data availability at the two locations (1993–2022 for LT Kiel and 1997–2022 for Northern Baltic). For this, the reanalysis was compared to the available station data (product ref. no. 2 in Table 1 for LT Kiel; Hedi Kanarik, FMI, personal communication, 2023, for Northern Baltic) at these locations. Table 2 shows the Pearson correlation coefficients for the MHW metrics in Fig. 4 between observational and reanalysis data for the two stations, which show overall good agreement between the two datasets with respect to MHW detection.
We also compared the 2022 temperature curves from both the reanalysis and the station data at each location (Fig. A2). Overall, the curves show the same progression. The temperature from the BAL-MYP is generally slightly lower, and consequently this results in a slightly lower temperature climatology and threshold (here, the 90th percentile) on which MHW detection is based. In general, the MHWs and their respective intensities and lengths are detected equally in both the station and reanalysis data.
3.1 Sea surface temperature anomalies in satellite data
In the summer of 2022, large parts of the Baltic Sea featured strong warm anomalies based on the BSH SST analysis (product ref. no. 1 in Table 1, Fig. 2). The highest values were up to 3 °C above the long-term mean (1997–2021) in the Bothnian Sea in June and in the Bothnian Bay in July. In August, however, these areas were neutral or exhibited cold anomalies, while the Baltic Proper, as well as the Gulf of Finland and the Gulf of Riga, showed the warmest anomalies of +1.5 to 2.5 °C. At the beginning of autumn, the Baltic Sea is marked by a substantial east-to-west gradient of SST anomalies due to a series of upwelling events along its eastern shores. In November, the whole Baltic Sea features strong warm anomalies, again with peak values above +2 °C around southern Sweden.
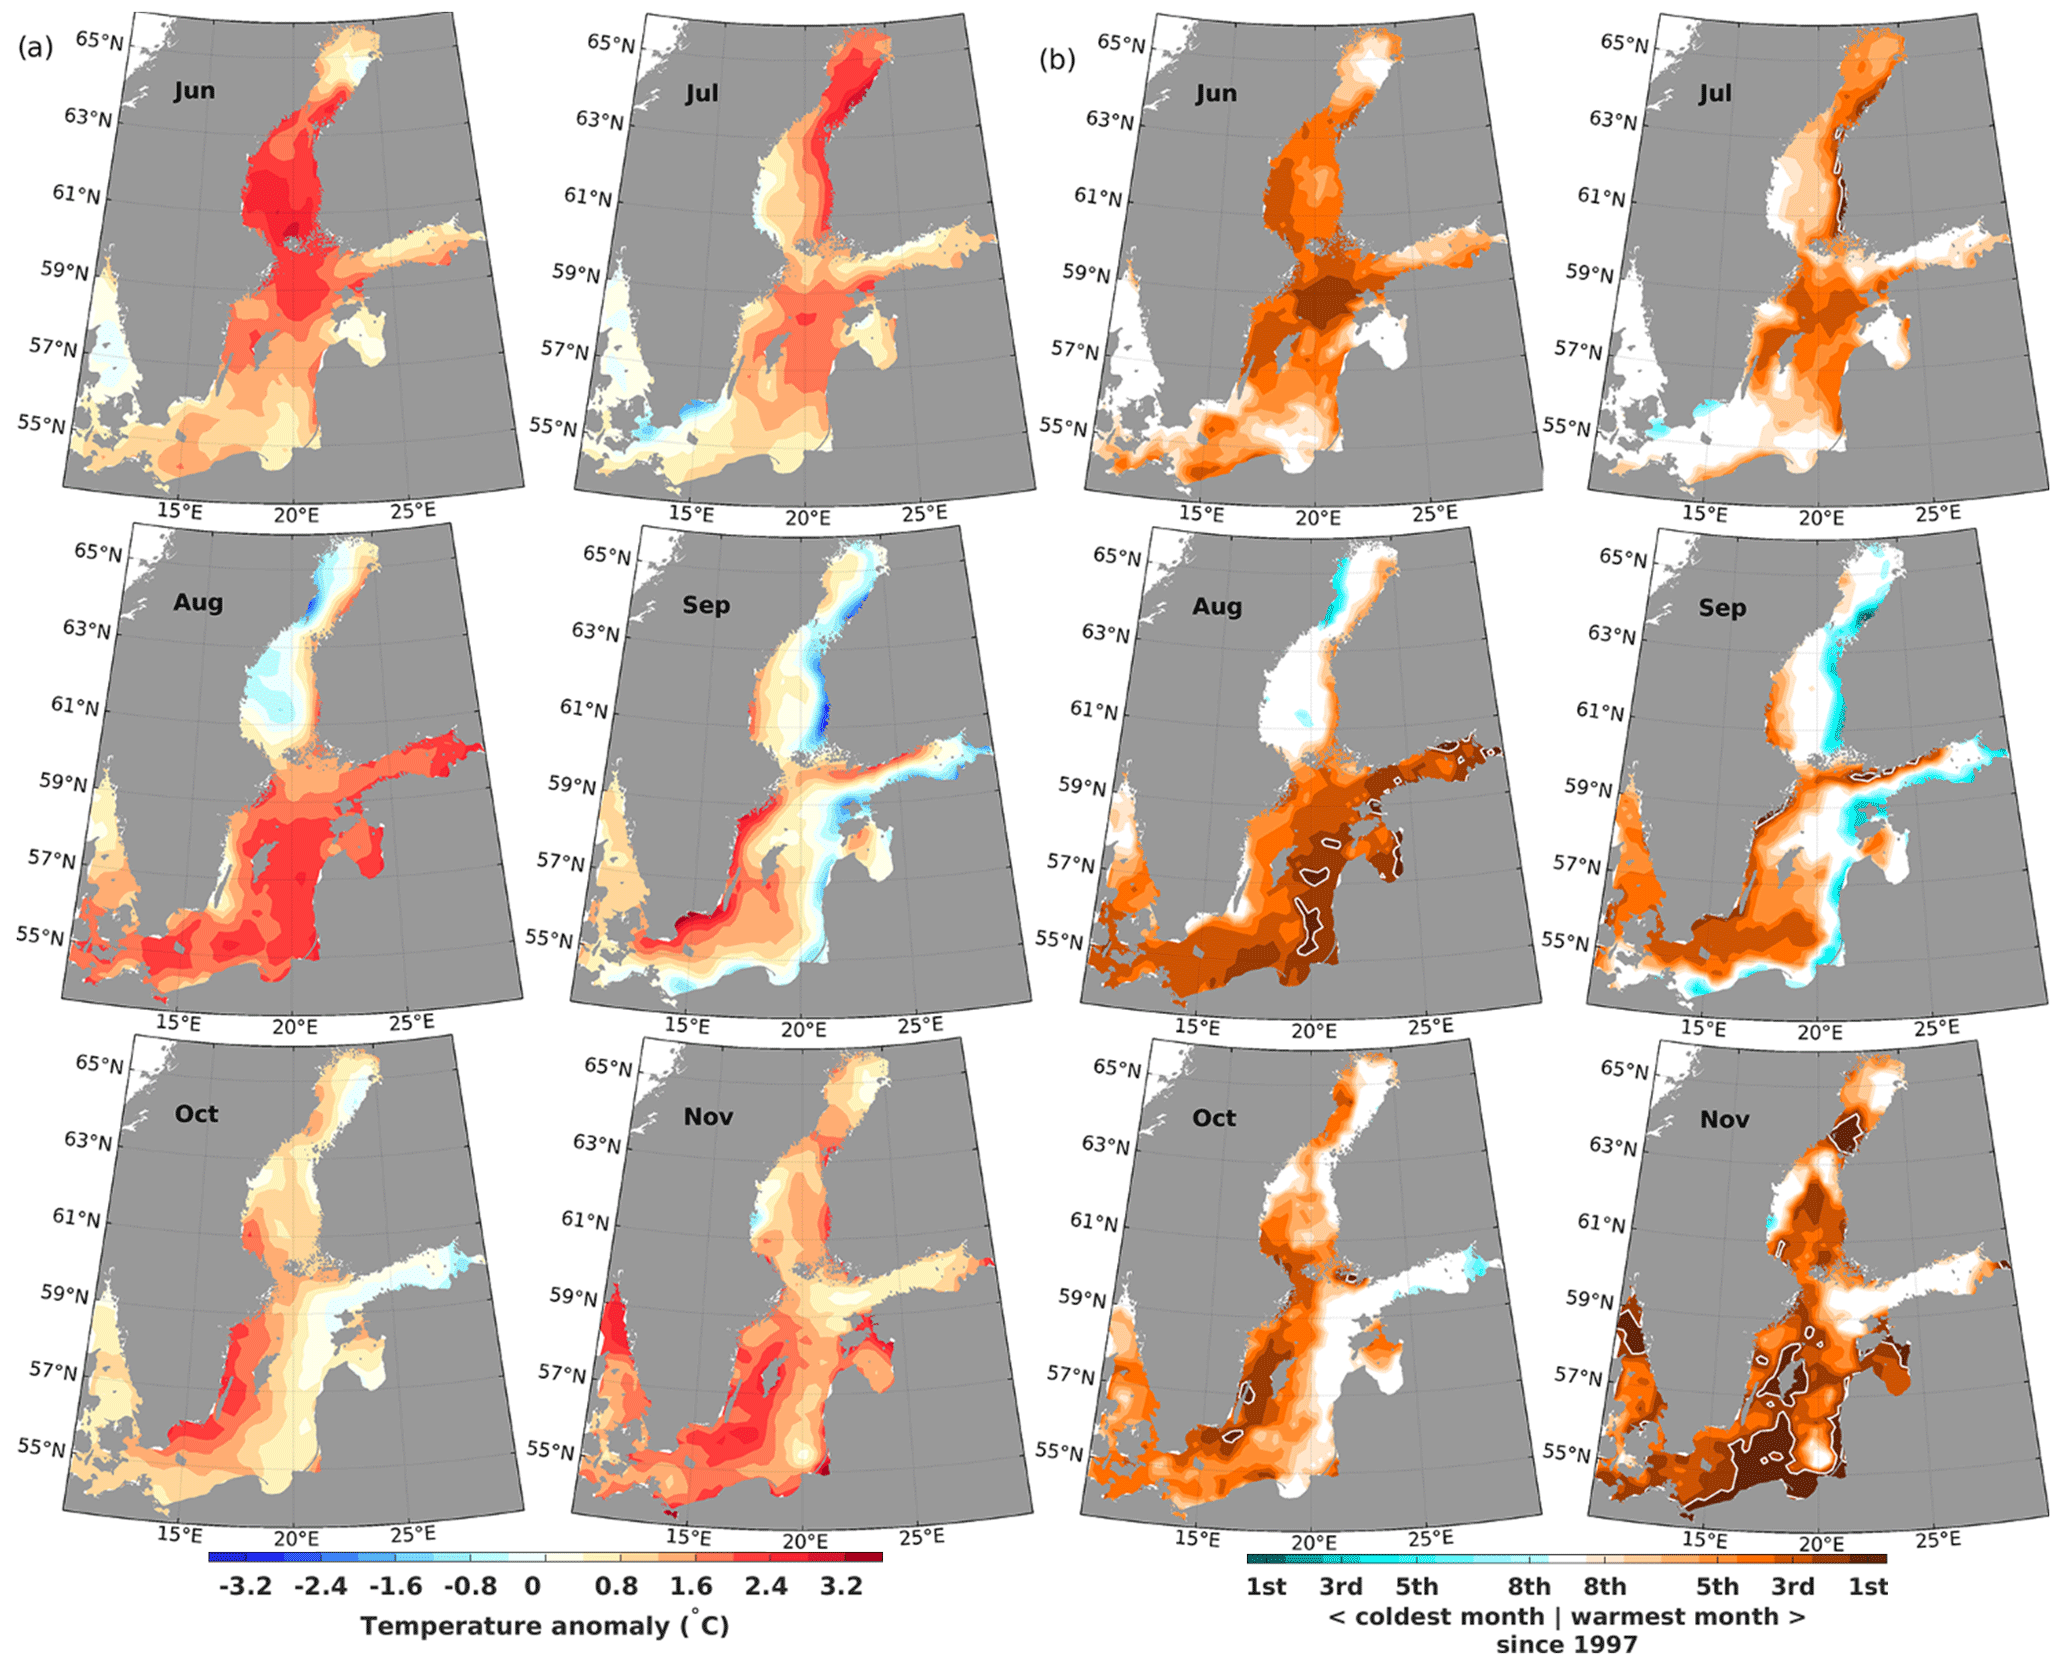
Figure 2Anomalies (difference from climatology of 1997–2021) of SST for the Baltic Sea according to the BSH SST analysis (product ref. no. 1 in Table 1) during the summer and autumn months in 2022 (a) and ranks of these SST anomalies (b) when compared to the full dataset starting in 1997. In (b), brownish (cyan) colors denote anomalies belonging to the warmest (coldest) eight anomalies found since 1997. Record warm anomalies (rank 1) are highlighted by white contours.
To provide some climatological context for the observed SST anomalies in a straightforward way, we also present maps ranking the SST anomalies for the summer and autumn months of 2022 against the same months in previous years (right two columns of Fig. 2). These anomaly rankings provide information on how extreme an anomaly of a given magnitude is. For every grid point and for each calendar month, the monthly anomalies are ranked by magnitude. The warm anomalies over large parts of the Baltic Sea during the summer and autumn of 2022 are among the warmest eight on record for the respective months. In September, coastal upwelling led to cold anomalies along the eastern shores, but the other 5 months of the summer and fall of 2022 (June, July and August as well as October and November) show large areas of the Baltic Sea with warm anomalies that are among the four most pronounced on record. In August and November, we see several large areas along the coastlines of the Baltic countries as well as off the Polish coast and around Gotland that according to the BSH SST analysis dataset featured the highest ever surface temperatures.
3.2 Marine heatwaves
MHWs describe exceptionally warm temperature anomalies. As the monthly overview in Fig. 2 already provides an indication of possible MHW conditions in 2022, the MHW metrics defined by Hobday et al. (2016) are assessed using the BAL-MYP (product ref. no. 3 in Table 1). Each region of the Baltic Sea experienced different MHW characteristics during 2022 (Fig. 3, Table 3).
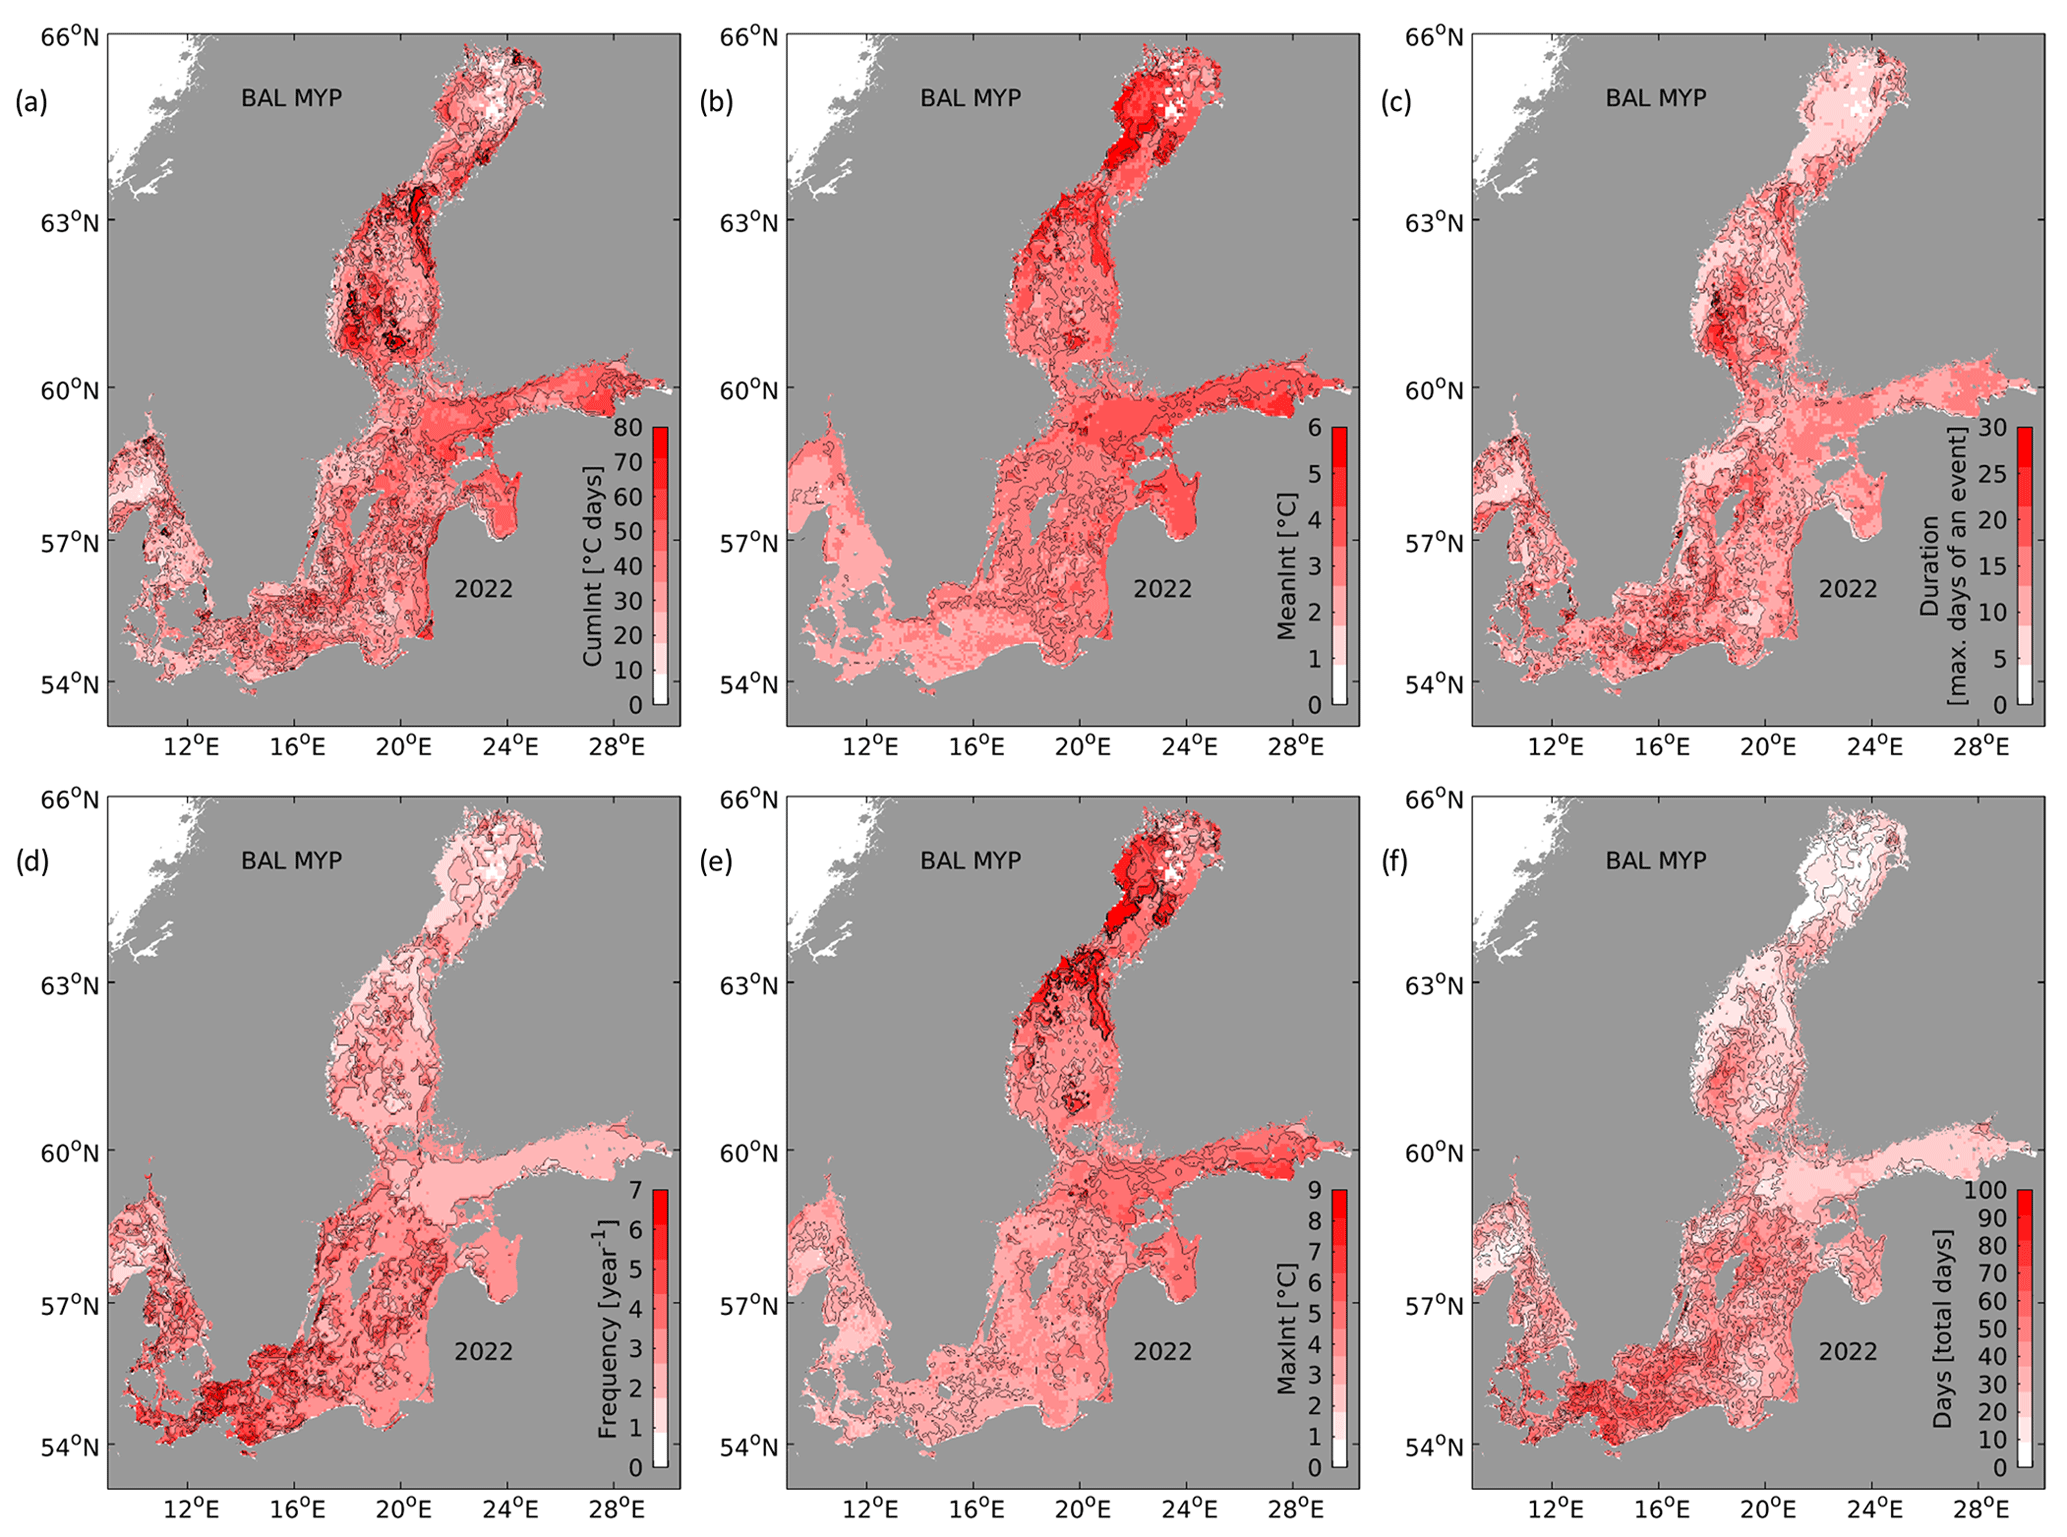
Figure 3Statistical metrics of MHWs in 2022 in the Baltic Sea based on SST data of the BAL-MYP (product ref. no. 3 in Table 1) with the climatological period covering the years 1993 to 2021: (a) cumulative intensity of the longest heatwave, (b) mean intensity, (c) duration of the longest heatwave, (d) number of heatwaves during 2022, (e) maximum intensity during the longest heatwave, (f) summed up days of all heatwave during 2022. The definition of these metrics follows Hobday et al. (2016).
Table 3Statistical MHW parameter values in various subregions of the Baltic Sea for 2022 based on the reanalysis data from the BAL-MYP (product ref. no. 3 in Table 1) using daily values of SST between 1 January 1993 and 31 December 2022. The climatological period covers the years 1993 to 2021.
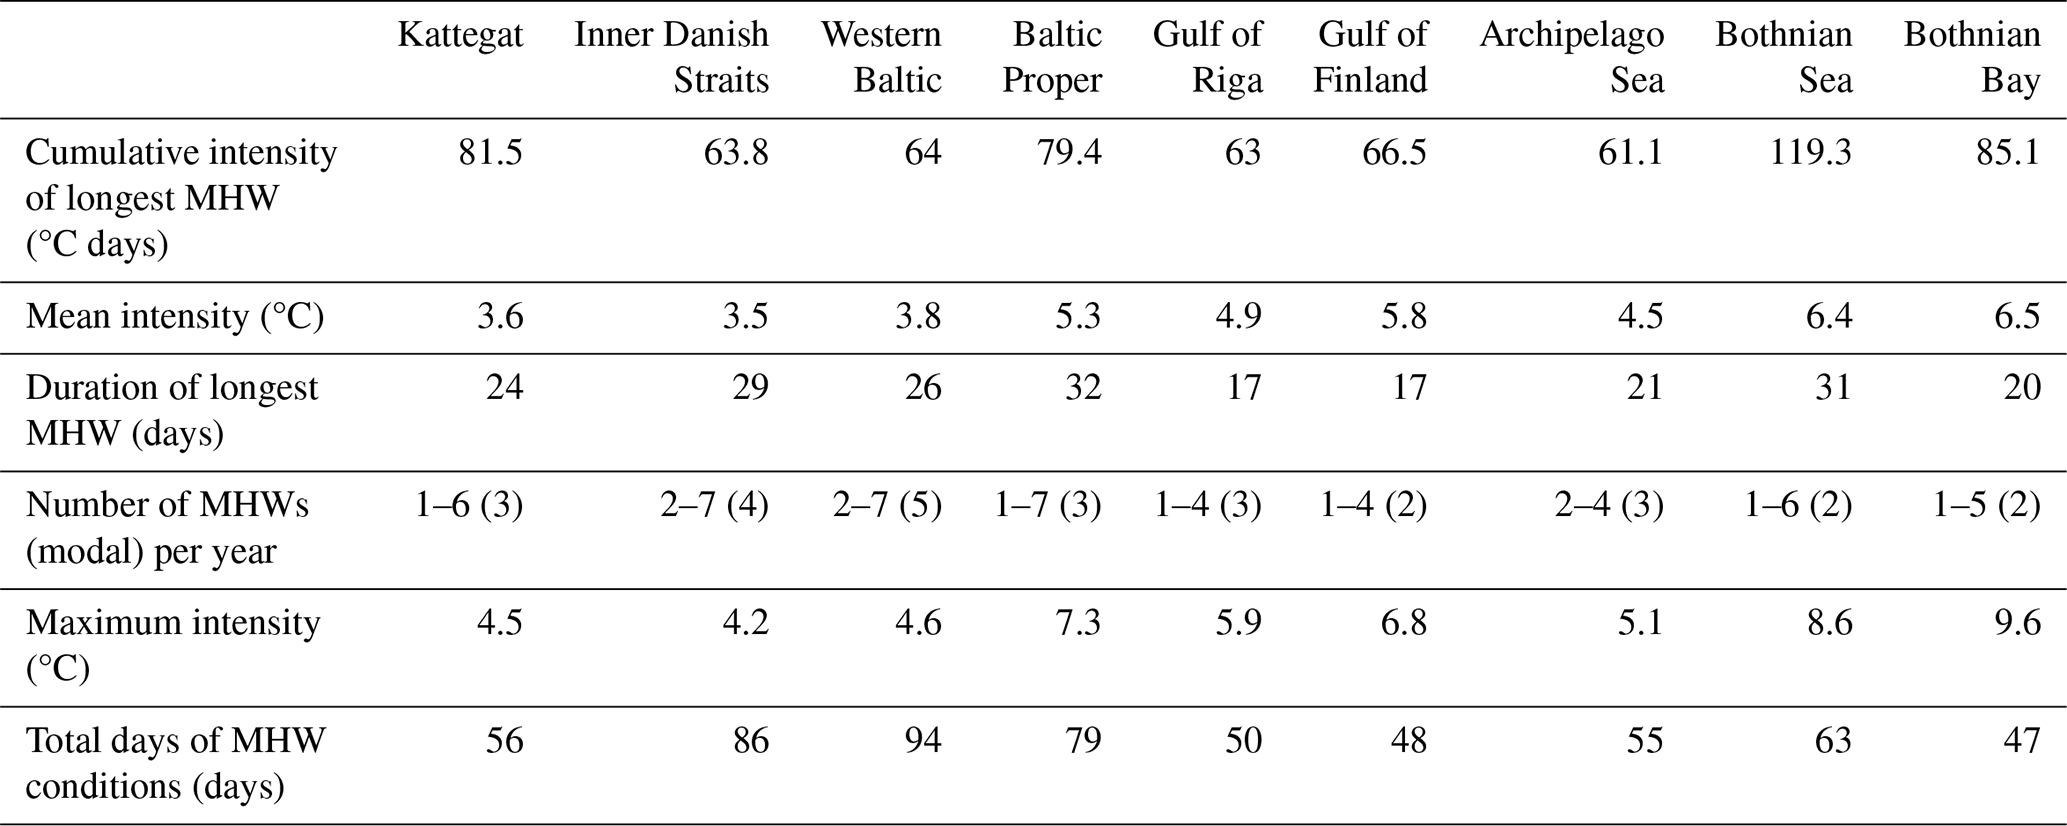
The most MHWs during 2022 occurred in the Inner Danish Straits and the western Baltic Sea (Fig. 3d). In most areas, four to five MHWs were detected, with some assessed locations experiencing up to seven MHWs and a maximum of 94 total days of MHW conditions (Fig. 3f). The mean and maximum intensities of all MHWs in the Western Baltic reached up to 3.8 and 4.6 °C, respectively (Fig. 3b and e). The highest mean and maximum intensity values were reached in the northern Baltic Proper and in the Bothnian Sea and Bothnian Bay (Fig. 3b and e), though these regions were affected mainly by only two MHWs. The maximum intensity in the Bothnian Bay even reached 9.6 °C, the highest within the entire studied period from 1993 to 2022. The longest MHW is found in the Baltic Proper (32 d), followed by the Bothnian Sea (31 d) and the Inner Danish Straits (29 d) (Fig. 3c). The highest values of cumulative intensity (of a single MHW), with up to 119.3 °C d, are found in the Kvarken, a strait between the Bothnian Sea and the Bothnian Bay (Fig. 3a).
3.2.1 Multi-year evaluation of MHW metrics
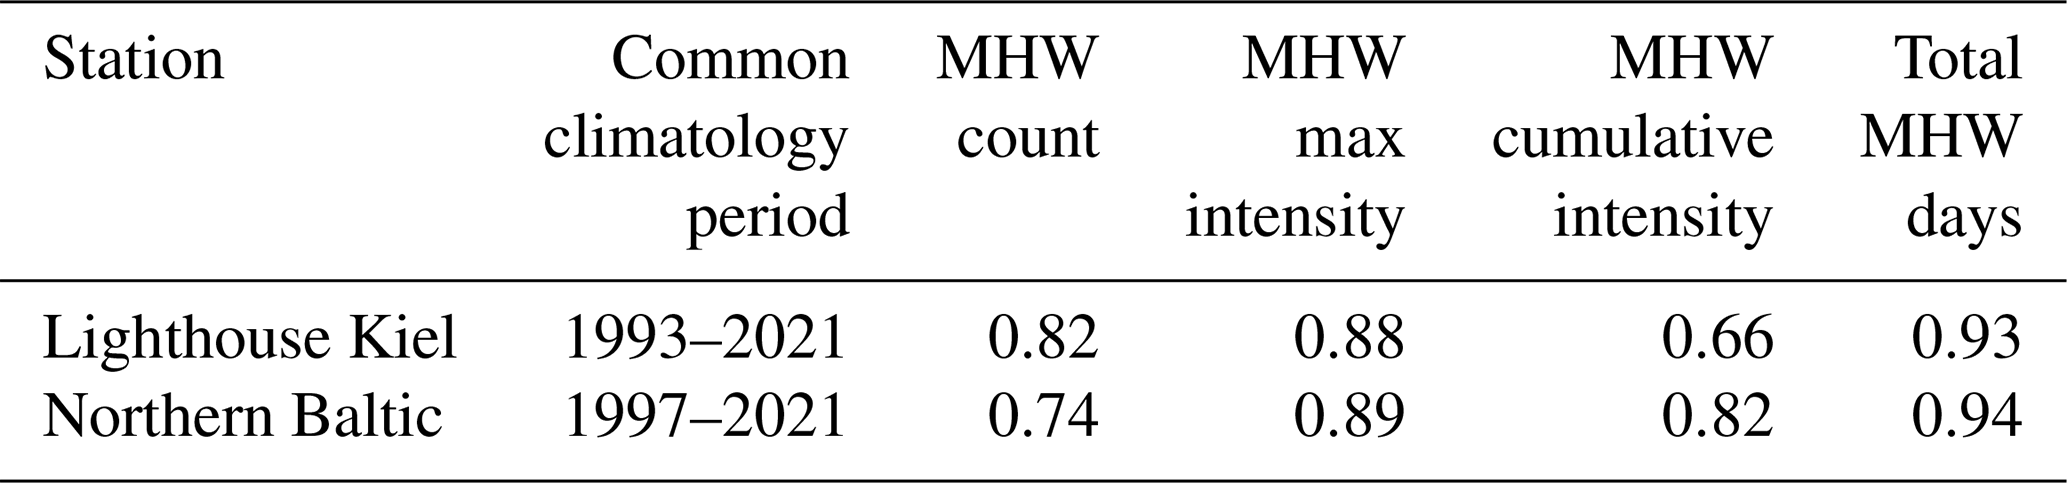
Next, we assess the frequency and other characteristics of the MHWs that occurred in 2022 in a climatological context based on both observations and reanalysis data for the two stations, LT Kiel (based on the overlapping climatology period 1993–2021, Fig. 4a–h) and Northern Baltic (based on the overlapping climatology period 1997–2021, Fig. 4i–p). Overall, the results for the yearly MHW metric calculation are well correlated between the observations and the reanalysis data (Table 2).
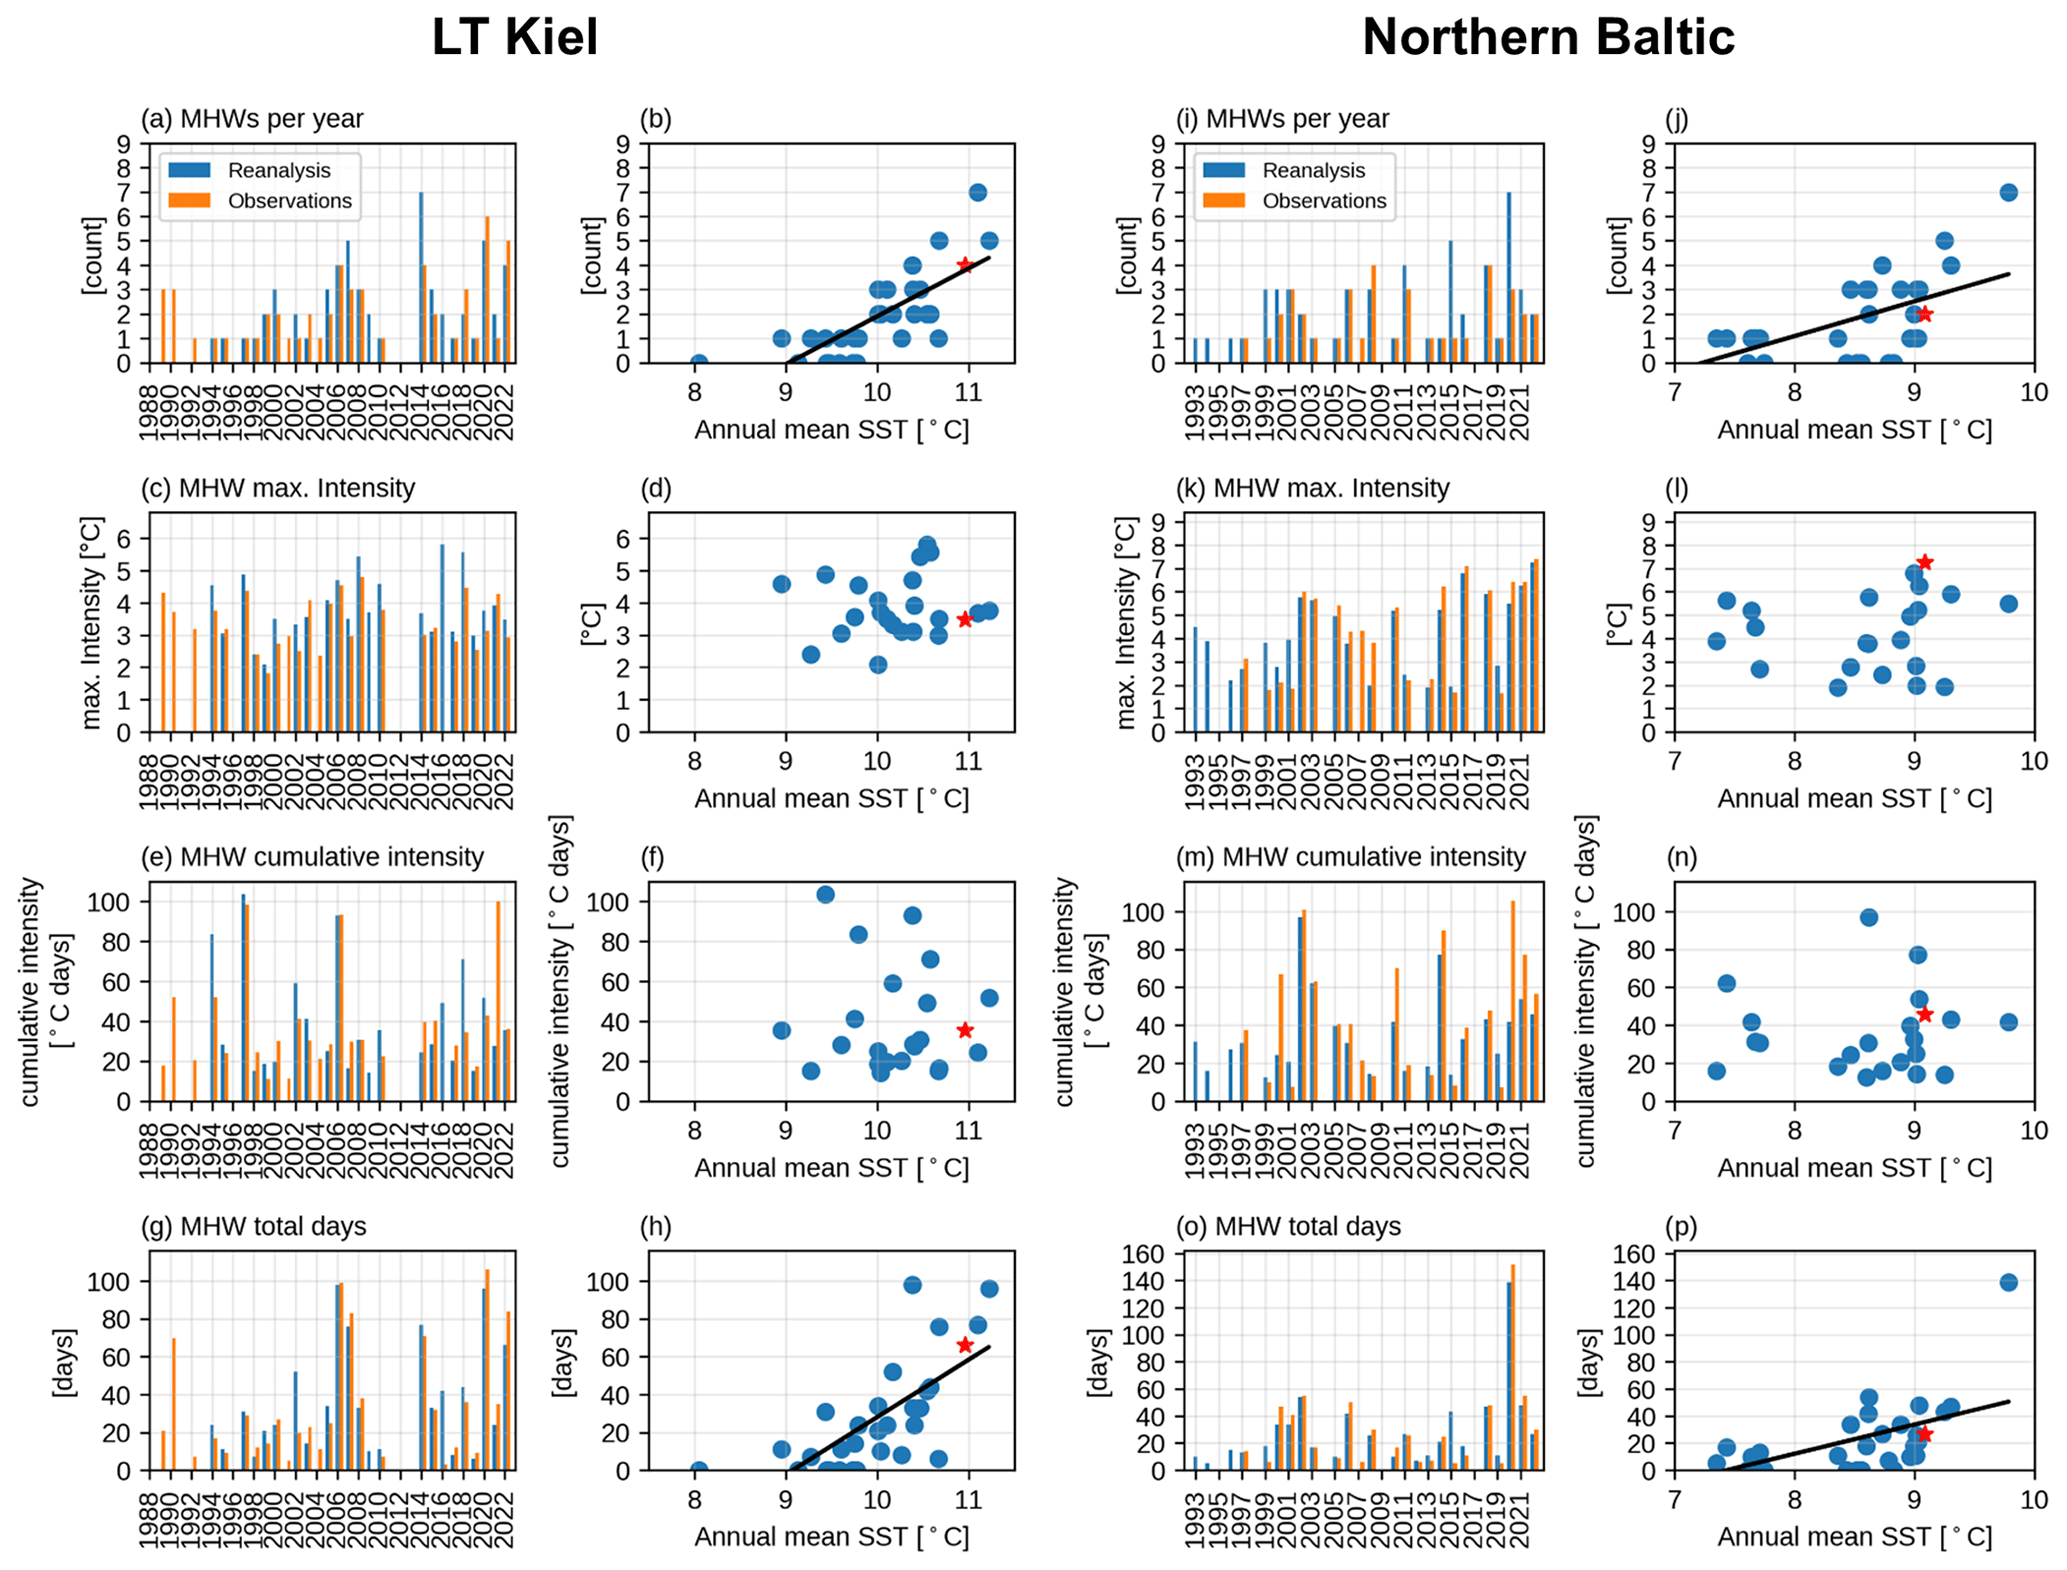
Figure 4Comparison and time series of annual MHW metrics (a, i: MHW events; c, k: maximum intensity (°C); e, m: cumulative intensity (°C days); g, o: MHW days) for station data (orange bars) and BAL-MYP (blue bars) at the stations LT Kiel (left) and Northern Baltic (right). The MHW metrics from the reanalysis are plotted against the annual mean SST at that station with the year 2022 marked in red. Statistically significant (95 %) correlations are indicated with a black line.
In 2022, a total of five MHWs (four in the BAL-MYP) occurred throughout the year at LT Kiel (Fig. A2a). Though none of them was extraordinarily long or intense at LT Kiel, the time series of yearly MHW metrics shows that, based on observational data, the number of MHW occurrences in 2022 was the second highest there since 1989 (Fig. 4a). The time series of MHW frequencies per year suggests that the occurrence of MHW events has increased over the last 3 decades (Fig. 4a). The linear trend computed from reanalysis data is +0.73 MHWs per decade for the period 1993–2022. The number of MHW events per year is positively correlated (R = 0.76) with the increasing annual mean SST at this mooring station (Fig. 4b). The maximum (Fig. 4c) and cumulative intensities (Fig. 4e) of observed MHWs do not show a clear trend and are not correlated to the warming annual mean temperatures (Fig. 4d and f). There is no significant trend in total MHW days (Fig. 4g) at LT Kiel, but there is a positive correlation (R = 0.71) with rising average temperatures (Fig. 4h).
For Northern Baltic, neither the station data nor the reanalysis data exhibit a statistically significant trend in MHW events for the overlapping period (Fig. 4i). However, when all of the available reanalysis data from 1993–2022 are taken into account, the trend in MHW occurrences becomes significant at the 95 % level, with +0.64 MHWs per decade. Again, the number of events is positively correlated with annual mean temperature (R = 0.58, Fig. 4j). The highest maximum MHW intensities were recorded in recent years (2016, 2018, 2021, 2022), with 2022 showing the highest intensity of any MHW, at 7.3 °C (reanalysis data) to 7.4 °C (station data) above the climatologically expected temperature (Fig. 4k, l, see also Fig. A2b). The cumulative MHW intensities show no clear trend or correlation with annual mean temperatures at this station (Fig. 4m, n). In terms of total MHW days, 2018 shows the highest numbers (Fig. 4o), but otherwise no trend is detectable for this metric, though there is a positive correlation with annual mean temperatures (R = 0.56, Fig. 4p).
3.2.2 Analysis of vertical MHW distribution at Northern Baltic
At Northern Baltic, which is about 103 m deep and located in the western Baltic Proper, the surface temperature has been measured continuously over several decades. However, no quality-controlled temperature measurements exist for the lower layers at this station. The validation of the BAL-MYP shows that at other locations the reanalysis represents temperatures generally well, both at the surface and in the lower stratum. In order to obtain further insights into heatwave propagation towards the seafloor, we analyzed the reanalysis data along the water column.
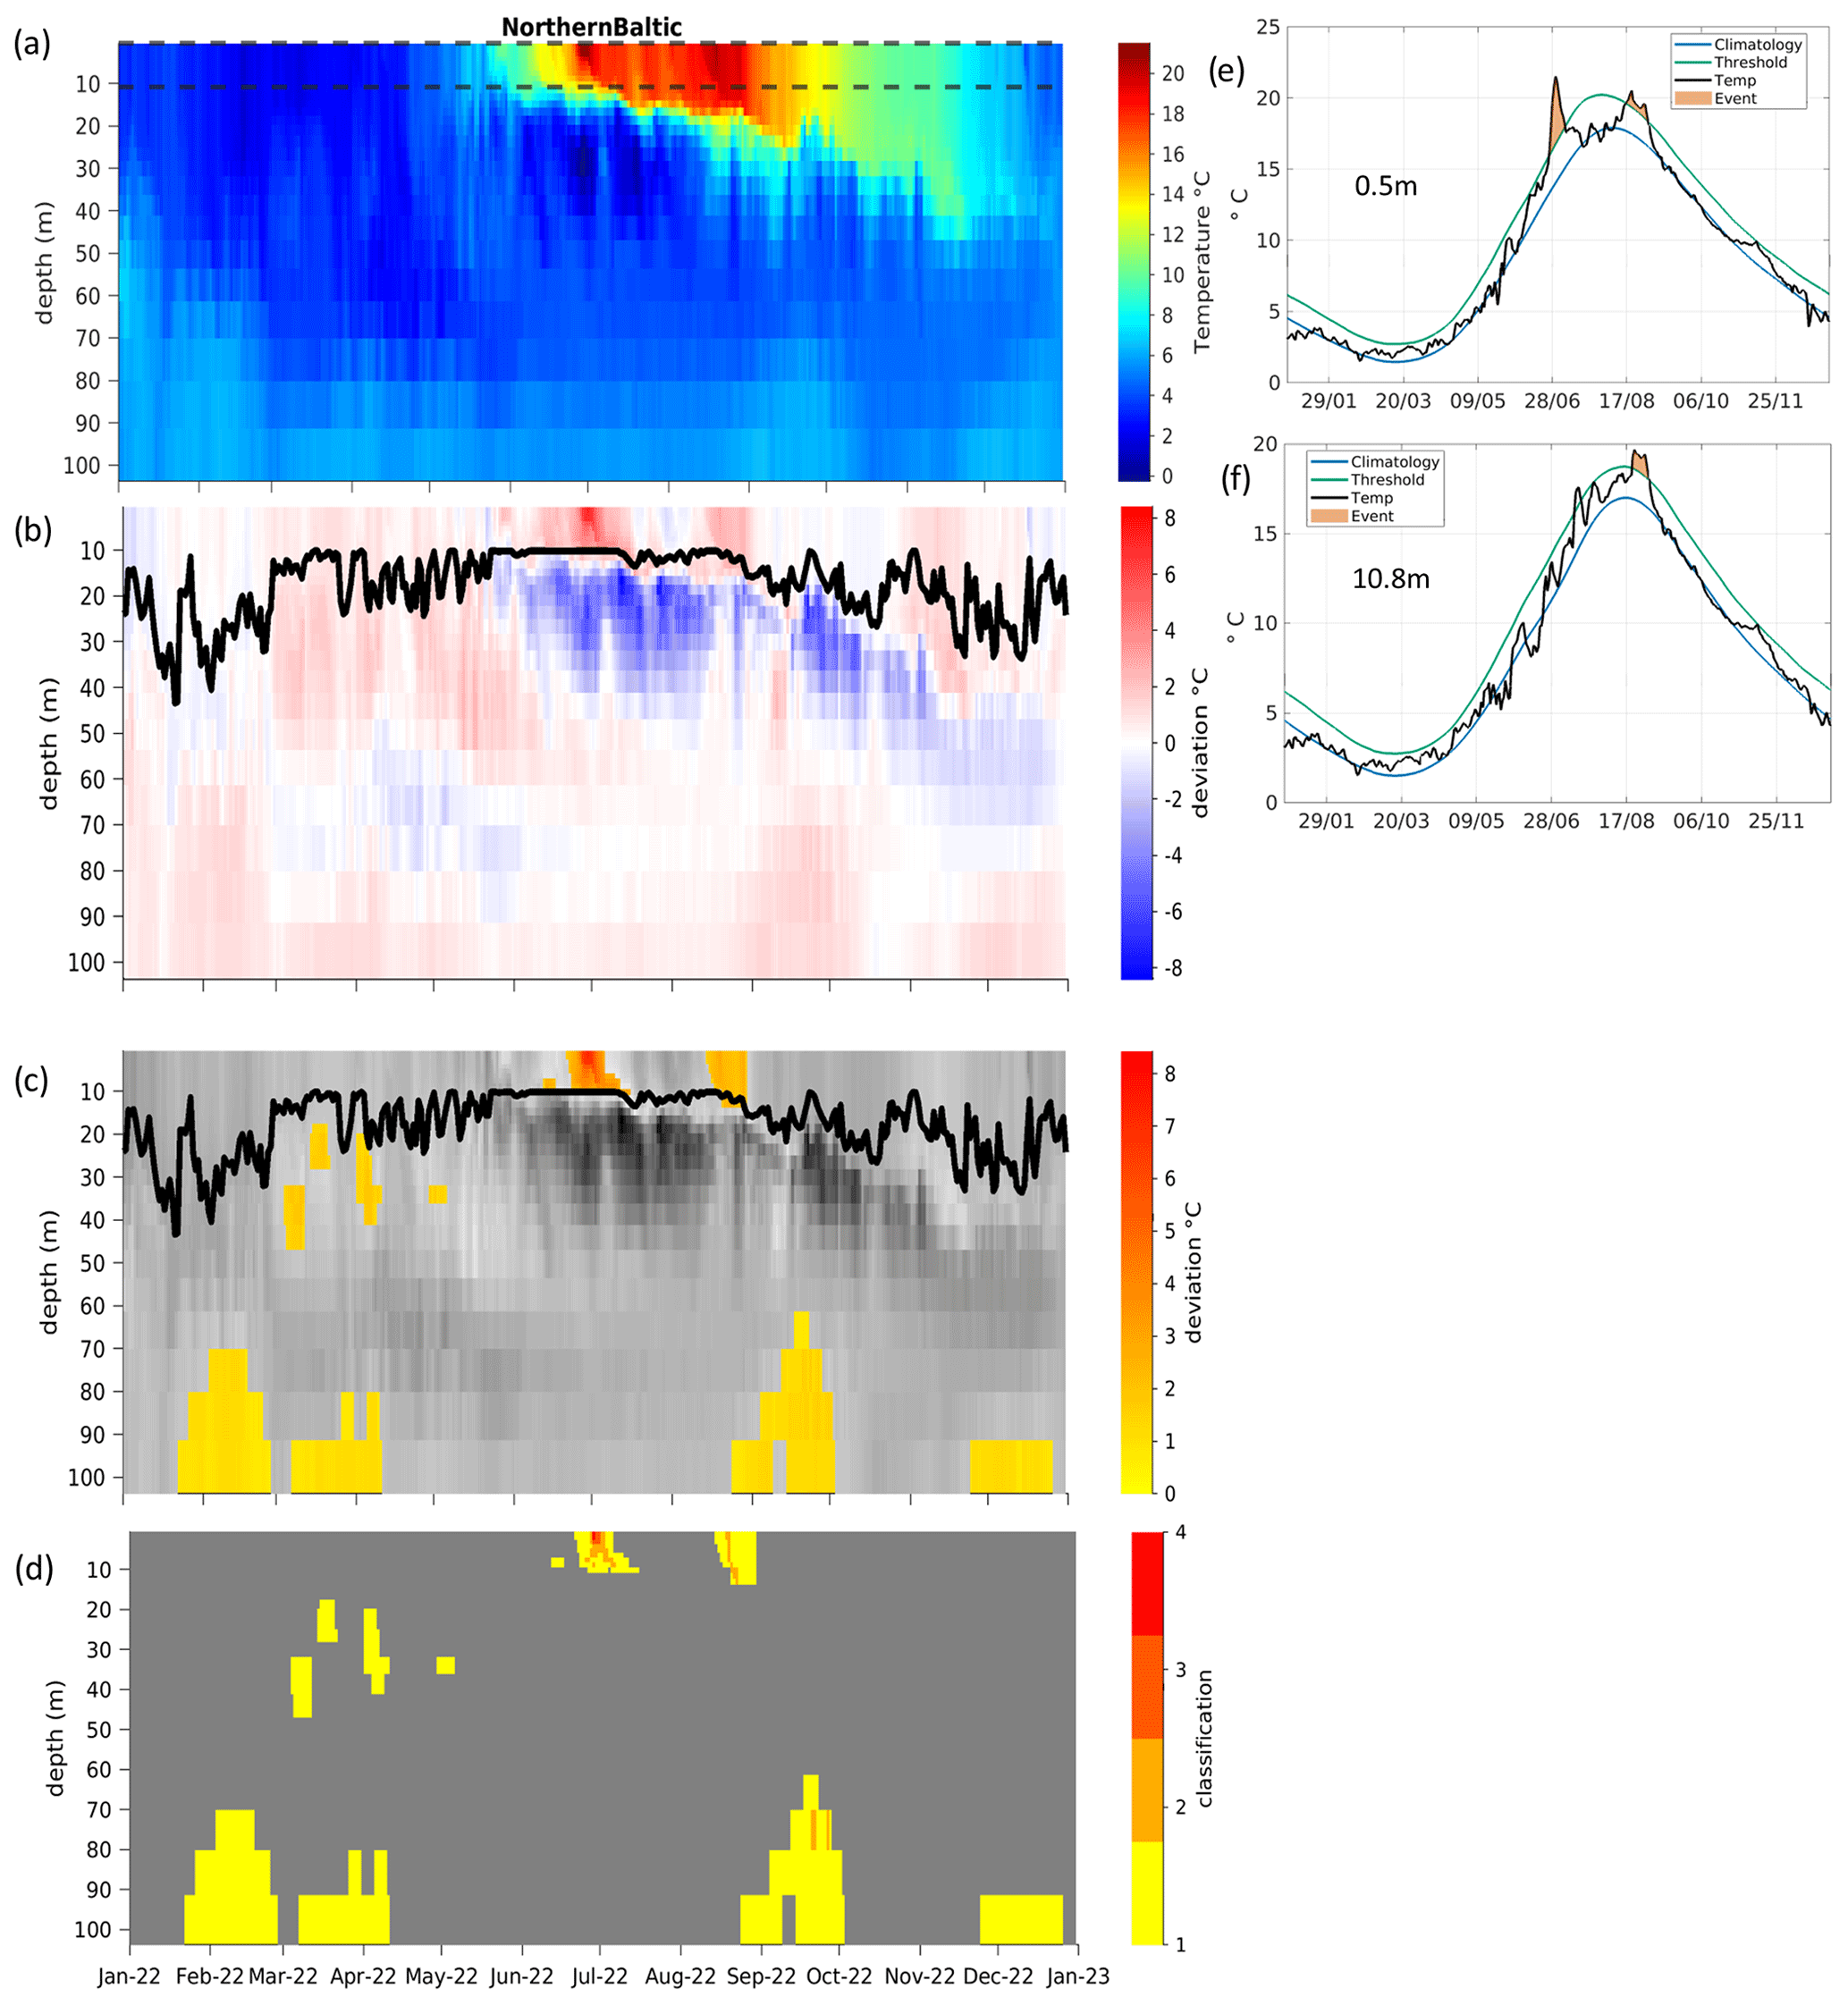
Figure 5Hovmöller diagrams showing absolute water temperature (a) and temperature deviation between the climatology and the BAL-MYP data for 2022 (b) and MHWs (c) and their classifications (d, 1 – moderate; 2 – strong; 3 – severe; 4 – extreme) including the mixed-layer depth as the thick black line (b, c) at Northern Baltic based on the BAL-MYP (product ref. no. 3 in Table 1). The time series on the right (e–f) are located at the vertical positions marked as dashed lines in (a) and show temperature (black), climatology (blue), 90th percentile threshold for MHW analysis (green), and MHWs (red shading) based on reanalysis data at depths of 0.5 m (e) and 10.8 m (f). The period used for the climatology is 1993–2021.
A seasonal SST signal is clearly visible in Fig. 5a. In general, the temperature tends to decrease with depth while the bottom temperature is comparably cold and uniform. In early summer (June), a so-called cold intermediate layer (CIL), defined as a minimum temperature between the thermocline and the perennial halocline (Chubarenko et al., 2017; Dutheil et al., 2023), develops at a depth of 20–60 m and acts as a barrier between the surface and bottom waterbodies. At Northern Baltic, the upper boundary of the CIL coincides with the mixed layer depth (MLD), which is depicted in Fig. 5b–c. Starting from around June, a water stratum with a significantly lower temperature than the climatological mean (up to −7 °C deviation) is located immediately under the MLD (Fig. 5b), which suggests that the CIL was significantly colder at this time in 2022. This also coincides with the onset of significantly higher temperatures near the surface, at 0.5 m depth, compared to the climatological mean, though these were initially not high enough to result in a MHW (Fig. 5e). At this depth, there is a significant temperature surge of 5 °C above the climatological mean, followed by abrupt and substantial fluctuations in temperature within in a brief time frame. This eventually leads to a MHW which lasts for 15 d starting from the end of June and which contains a 1 d long extreme MHW (Category IV) event at a temperature of 7.4 °C above the climatological mean, followed by a severe MHW (Category III) for another 3 d. Significant temperature deviations can also be observed at a depth of 10.8 m, i.e., at the MLD, after 2 July, just after the Category IV MHW at 0.5 m depth. However, these temperature deviations did not result in a MHW at 10.8 m depth. A comparably weak MHW can be detected in mid-August at both 0.5 m (Fig. 5e) and 10.8 m (Fig. 5f). Thus, this weaker MHW penetrates past the MLD into slightly deeper levels before reaching the comparably cold layer of water underneath.
As shown in Fig. 5c and d, the intensity of the MHW tends to decrease as the depth increases. Four MHWs in regions close to the seafloor (i.e., below 60 m) were detected during specific periods from February to April, September to October, and in December. These MHWs are mostly moderate, with temperatures reaching up to 1.59 °C above the climatological mean. At the end of September, only 3 d can be classified as a Category II MHW in one specific depth layer close to the seafloor. In the bottom-most depth layer, the corresponding subsurface MHW is interrupted by 5 d of temperatures below the 90th percentile. However, as the temperatures are only slightly below the threshold and the MHW criteria are still met in the depth layers above, one might still count this as one continuous MHW. Furthermore, Fig. 5c also shows isolated Category I MHWs at depths between 20 and 50 m.
During August and November 2022, record warm sea surface temperatures were observed in substantial areas of the Baltic Sea proper. Large parts of the Baltic Sea exhibited the third-warmest to the warmest temperatures in summer and autumn months since 1997. Both periods, in August and November, coincided with atmospheric temperature anomalies. Over the entire year of 2022, the distribution in quantity and intensity of MHWs within the Baltic Sea was twofold: up to seven individual MHW occurrences were recorded and simulated in the southwestern part of the Baltic Sea, and as a result this region experienced the maximum number of total MHW days of anywhere in the Baltic Sea in 2022. In the northern Baltic Sea, the number of MHWs was lower, with some locations registering only one MHW; remarkably, however, this one MHW led to the highest mean and maximum MHW intensities in the Baltic Sea since the reanalysis started in 1993. In some areas in the Bothnian Bay, the BAL-MYP revealed temperatures that exceeded 9 °C above the 90th percentile of the climatologically expected temperature values (Fig. 3d, e). This can be considered an extraordinarily high MHW intensity, since maximum SST anomalies above 5 °C have only been observed in about 5 % of the global ocean, while MHW intensities normally peak at 2.5 to 3.7 °C (Sen Gupta et al., 2020). In our case, the area in the Bothnian Bay experienced a short period with southerly winds and air temperatures up to 28 °C at the end of June 2022 (SMHI, 2023a, b), which led to a short but very intense MHW in the shallow areas of the bay.
A significant increase in MHW occurrences is detectable over time at our two exemplary stations: +0.73 MHW events per decade at LT Kiel and +0.64 MHW events per decade at Northern Baltic. Both MHW frequency and the total number of MHW days are statistically related to rising mean temperatures. This confirms that an increasing number of MHWs can also be expected in the future in the Baltic Sea due to global warming (Frölicher et al., 2018; Oliver, 2019). The adverse impact of MHWs on the ecosystem's various trophic levels has been widely documented (Smale et al., 2019; IPCC, 2022; Smith et al., 2023). The Baltic Sea, which has a relatively vulnerable ecosystem, could experience a significant negative impact from MHWs (Kauppi and Villnäs, 2022; Kauppi et al., 2023), and the analysis of subsurface MHWs opens up further potential ways to study their effects. At the Northern Baltic mooring station, MHWs were found close to the surface, propagating into deeper layers until reaching the CIL, and some were also detected close to the seafloor. Isolated MHWs were also observed at depths between 20 and 50 m. However, these are subject to higher uncertainty compared to the ones in the surface and bottom layers due to a higher uncertainty in modeling variability in the pycnocline (QuID; Panteleit et al., 2023). Possible reasons for the development of the four MHWs close to the seafloor at Northern Baltic could, for example, be vertical heat transport from the surface or a lateral transport of warmer water due to bottom currents. However, a more detailed evaluation would be required to assess their precise cause.
Potential avenues for future studies include examining whether and how surface MHWs are able to propagate into the deeper water masses close to the halocline and examining the correlation between the strength (i.e., the classification category) of the MHW and its propagation into deeper water masses. At Northern Baltic, severe and extreme MHWs occurred close to the surface when the CIL was particularly cold compared to the climatology. This therefore raises questions of whether a strong CIL might be linked to the development of MHWs at the surface and whether the one might even favor the development of the other. Additional studies could also focus on the positive feedback on the bottom temperature, as was observed in 2022. It might be interesting to determine if this phenomenon can also be found in other years and whether it is triggered by the superposition of either lateral currents or MHWs or of both together. Understanding the effects that potentially lead to the vertical propagation of MHWs like those observed particularly in the late summer of 2022 will become increasingly crucial in order to evaluate how the already increasing occurrences of surface MHWs may affect the ecosystem in subsurface layers.
We apply a clustering approach to evaluate the precision of the Baltic Sea physics reanalysis multi-year product (BAL-MYP, product ref. no. 3 in Table 1) in order to highlight its ability to accurately capture both surface and subsurface MHWs over the entire domain. This clustering approach offers insights into the overall accuracy of the reanalysis with respect to temperature and salinity by grouping the respective errors. The procedure employs the k-means algorithm, a type of unsupervised machine learning (Jain, 2010). The original explanation of this technique can be found in a study by Raudsepp and Maljutenko (2022). In our evaluation, all available data within the model's domain and simulation period are considered, even if the observation data are unevenly distributed or occasionally sparse. This strategy enables us to assess the quality of the reanalysis at each specific location and time instance at which measurements have been acquired.
Initially, a two-dimensional error space (dS, dT) was established using simultaneously measured temperature and salinity values as the foundation for clustering. Here, and represent the differences between the model (Smod and Tmod) and observed (Sobs and Tobs) salinity and temperature, respectively. The dataset employed in this validation study was sourced from the EMODNET dataset compiled by SMHI (product ref. no. 4 in Table 1). It consists of a total of 3 094 089 observations aligning with the simulation period of the BAL-MYP and covering the years 1993 to 2022. For each observation, we extracted the nearest model values from the reanalysis dataset.
The next stage involves choosing the number of clusters, and for simplicity we opted in advance for five clusters. Subsequently, the third step entails conducting k-means clustering on the two-dimensional errors. This clustering process is applied to the normalized errors achieved through separate normalization for temperature and salinity errors using the corresponding standard deviations. The k-means algorithm then identifies the centroids' positions within the error space for the predetermined number of clusters. These centroids' locations signify the bias of the error set for each cluster. In the fourth step, statistical metrics for non-normalized clustered errors are computed. Standard deviation (SD), root-mean-square deviation (RMSD) and the correlation coefficient are examples of common statistics that can be calculated for the parameters associated with each cluster.
The fifth step involves examining the spatiotemporal distributions of errors associated with different clusters. During the creation of the error space, we retained the coordinates of each error point , allowing us to map the errors of each cluster back onto the locations where the measurements were conducted. To achieve this, the model domain is partitioned into horizontal grid cells (i,j) of 27 × 27 km2 in size. Subsequently, the number of error points attributed to various clusters at each grid cell (i,j) is tallied. The total number of error points linked to the grid cell (i,j) is the sum of points from each cluster. The proportion of error points in each grid cell affiliated with cluster k is determined by the ratio of the number of error points of cluster k to the total number of error points in each grid cell.
Figure A1 displays the results of the k-means clustering for non-normalized errors. Table A1 presents the corresponding metrics. Within cluster k = 5, the salinity and temperature values closely align with the observations, with a bias of dS = −0.40 g kg−1 and dT = −0.02 °C, respectively. This cluster encompasses 57 % of all data points. The points are distributed throughout the Baltic Sea and the great majority of them exceed 0.5 (Fig. A1b). Clusters k = 3 and k = 4 exhibit relatively even spatial distributions across the Baltic Sea, accounting for 11 % and 8 % of the points, respectively. These clusters are particularly noteworthy due to their relatively high temperature biases and variability, both of which are crucial for the calculation of marine heatwaves. The clusters k = 1 and k = 2 represent points with low temperature but a high salinity error (Table A1). Spatially, these points are predominantly located in the southwestern Baltic Sea (Fig. A1b), which points to the occasional underestimation or overestimation of the inflow and outflow salinity.
Collectively, approximately 82 % of all validation points exhibit relatively low temperature bias, SD, and RMSD (Table A1). The surface layer validation shows that less than 10 % of comparison points have significant temperature errors (Fig. A1c). Due to the low proportion of these validation points, we do not expect a significant impact on the determination of surface MHWs and their statistics. Below the surface layer, i.e., at depths ranging from 0.5–40 m, up to 25 % of the points correspond to clusters k = 3 and k = 4 (Fig. A1c). Consequently, we anticipate that the reanalysis data provides sufficiently accurate information for calculating subsurface MHWs and their statistics for the Baltic Sea.
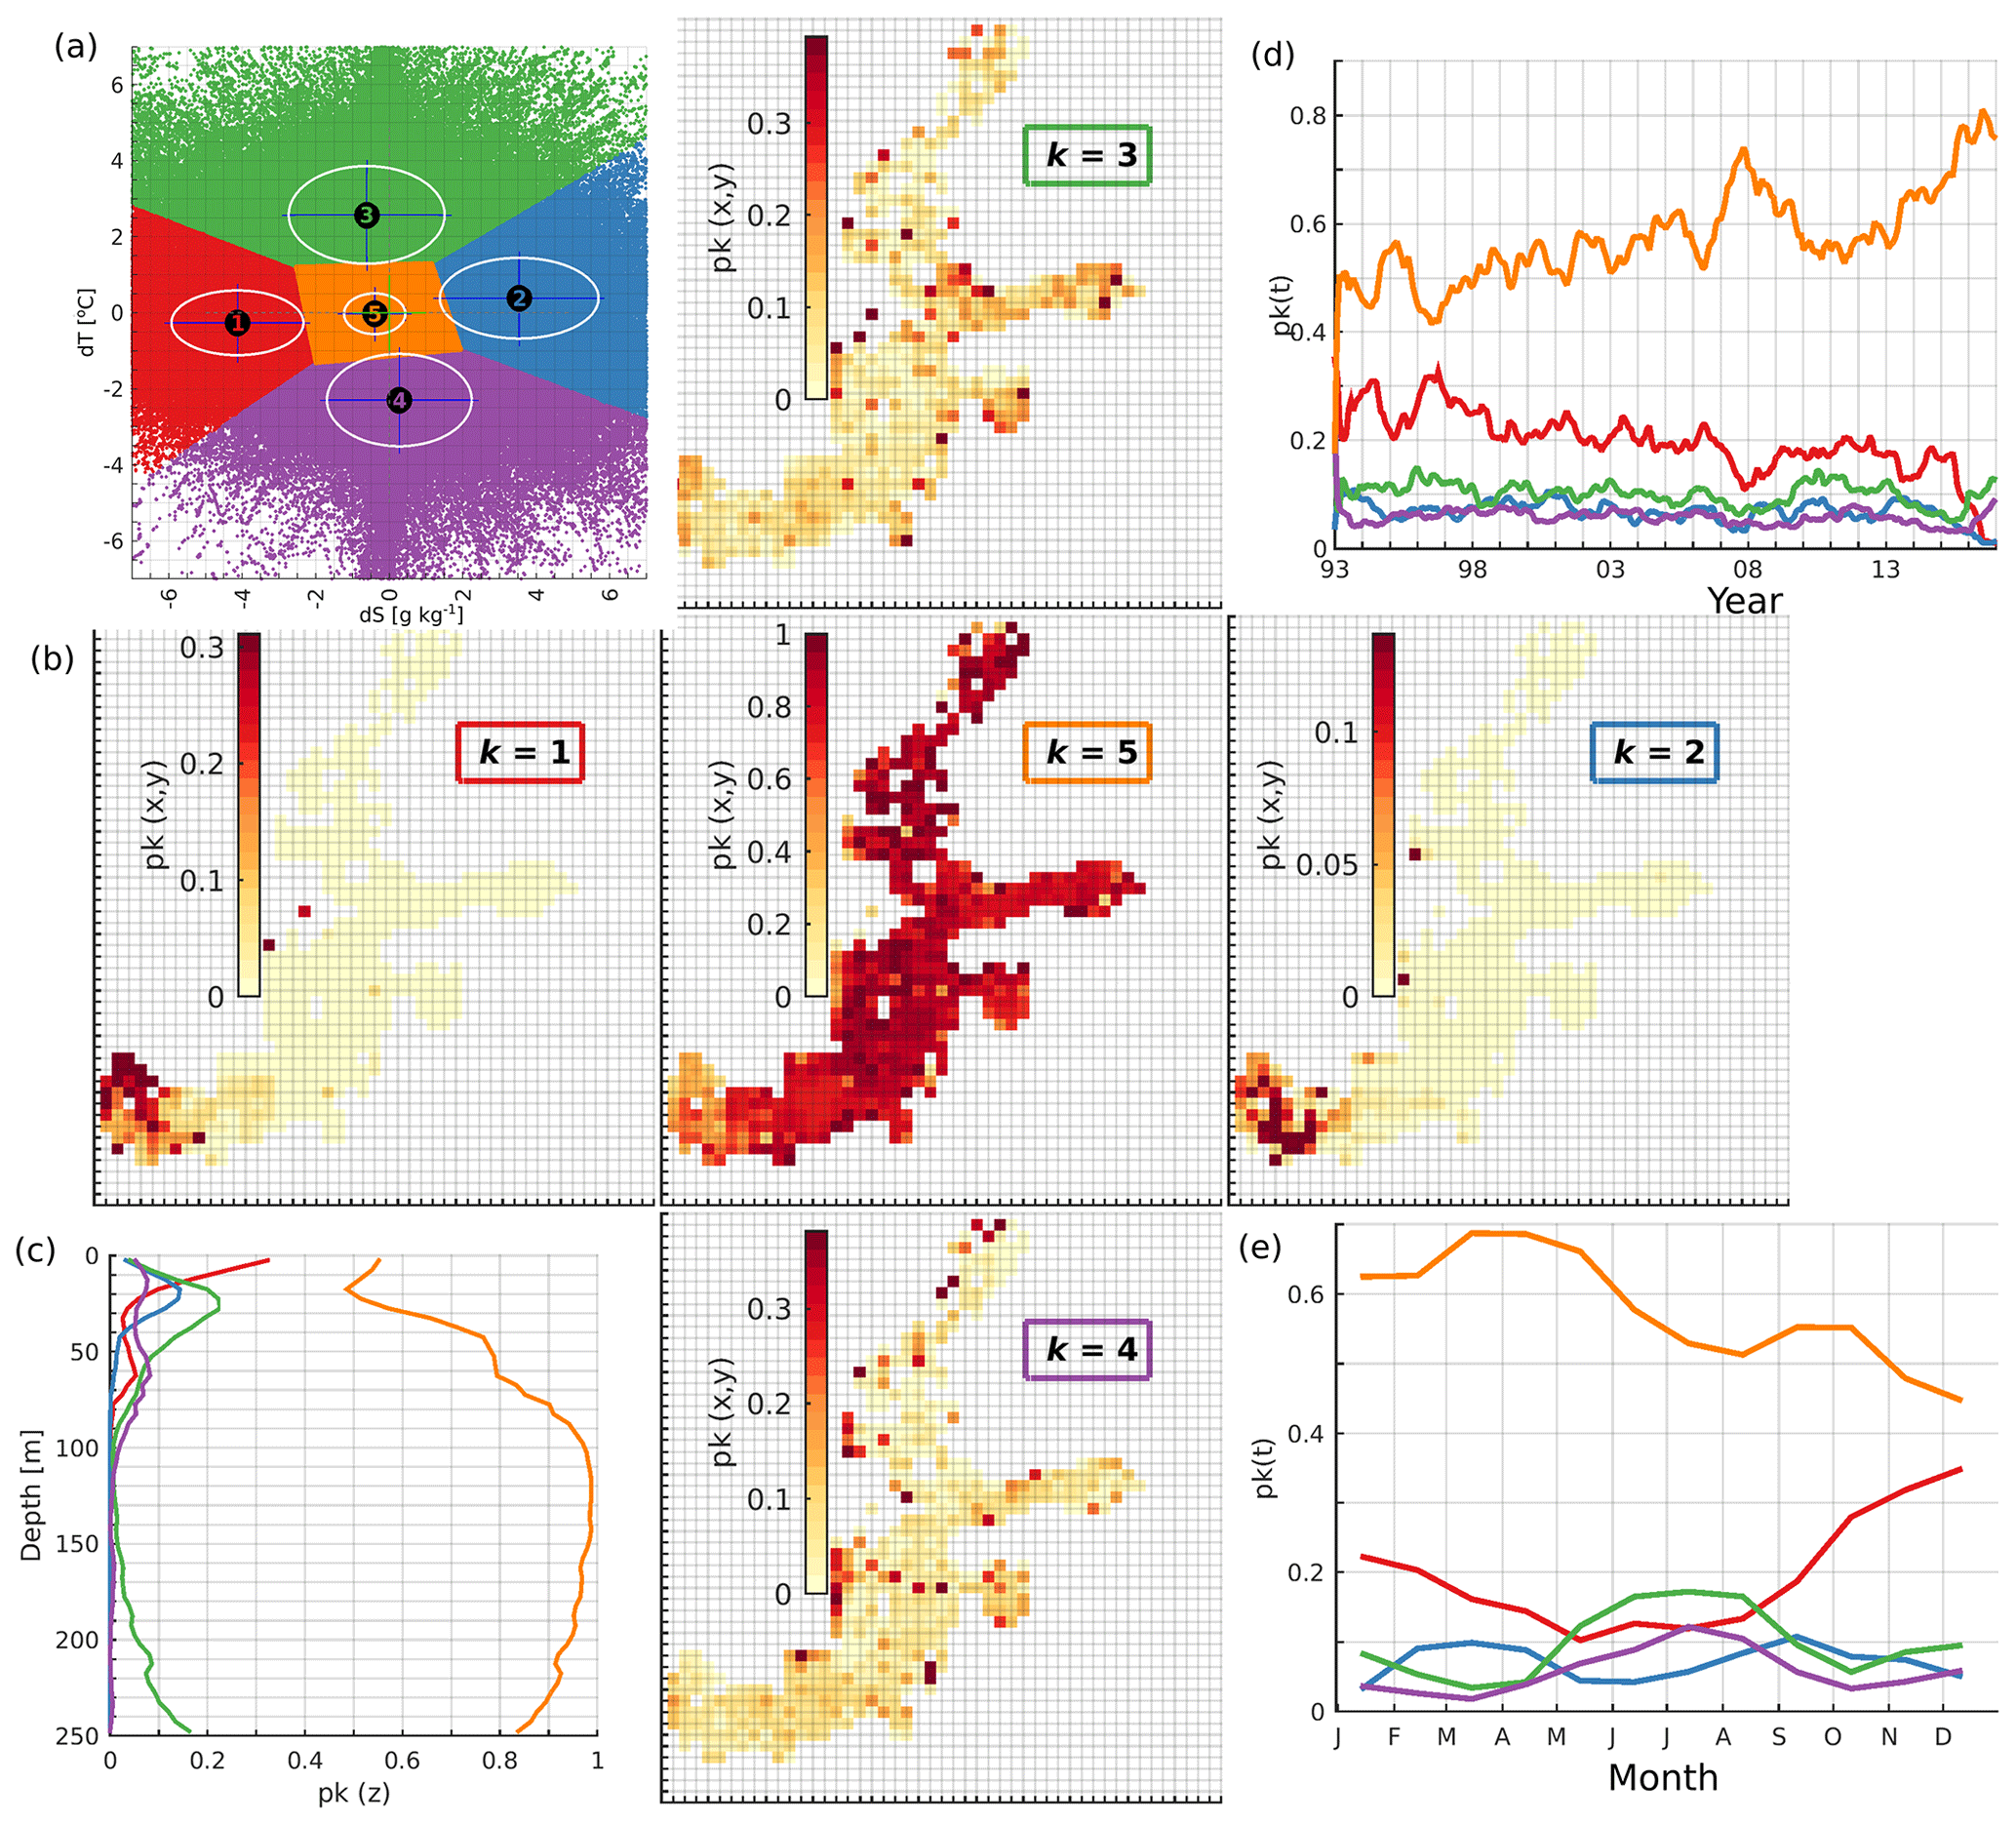
Figure A1Distribution of normalized error clusters for the BAL-MYP for k = 5 (a) and the spatial distribution (b, shaded sub-plots), vertical distribution (c), temporal distribution (d), and seasonal distribution (e) of the share of error points belonging to the five different clusters.
Table A1The share (%), bias, root-mean-square error (RMSE), standard deviation (SD), and correlation coefficient (Corr) for each of the five clusters.
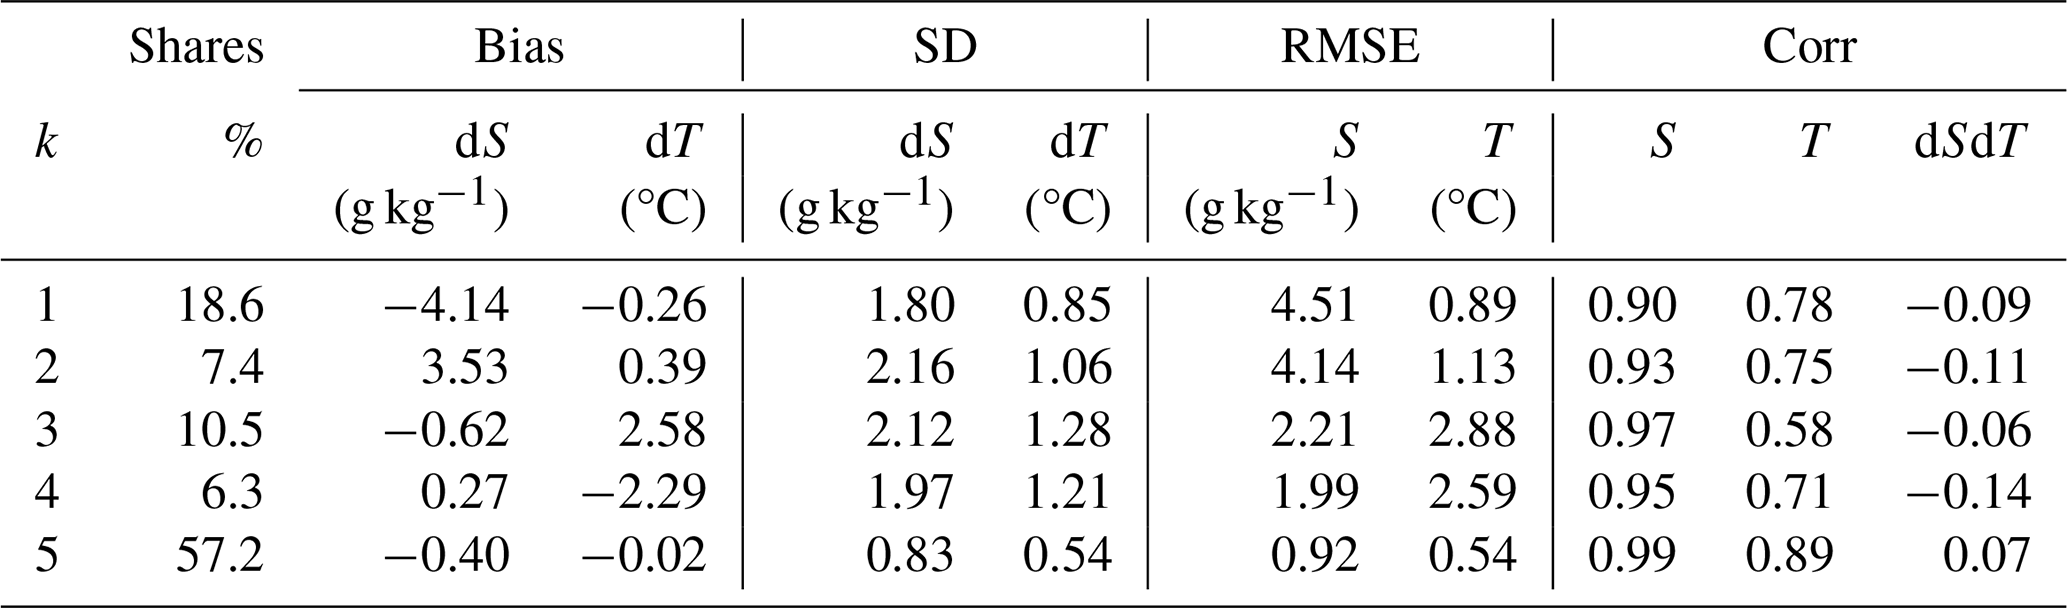
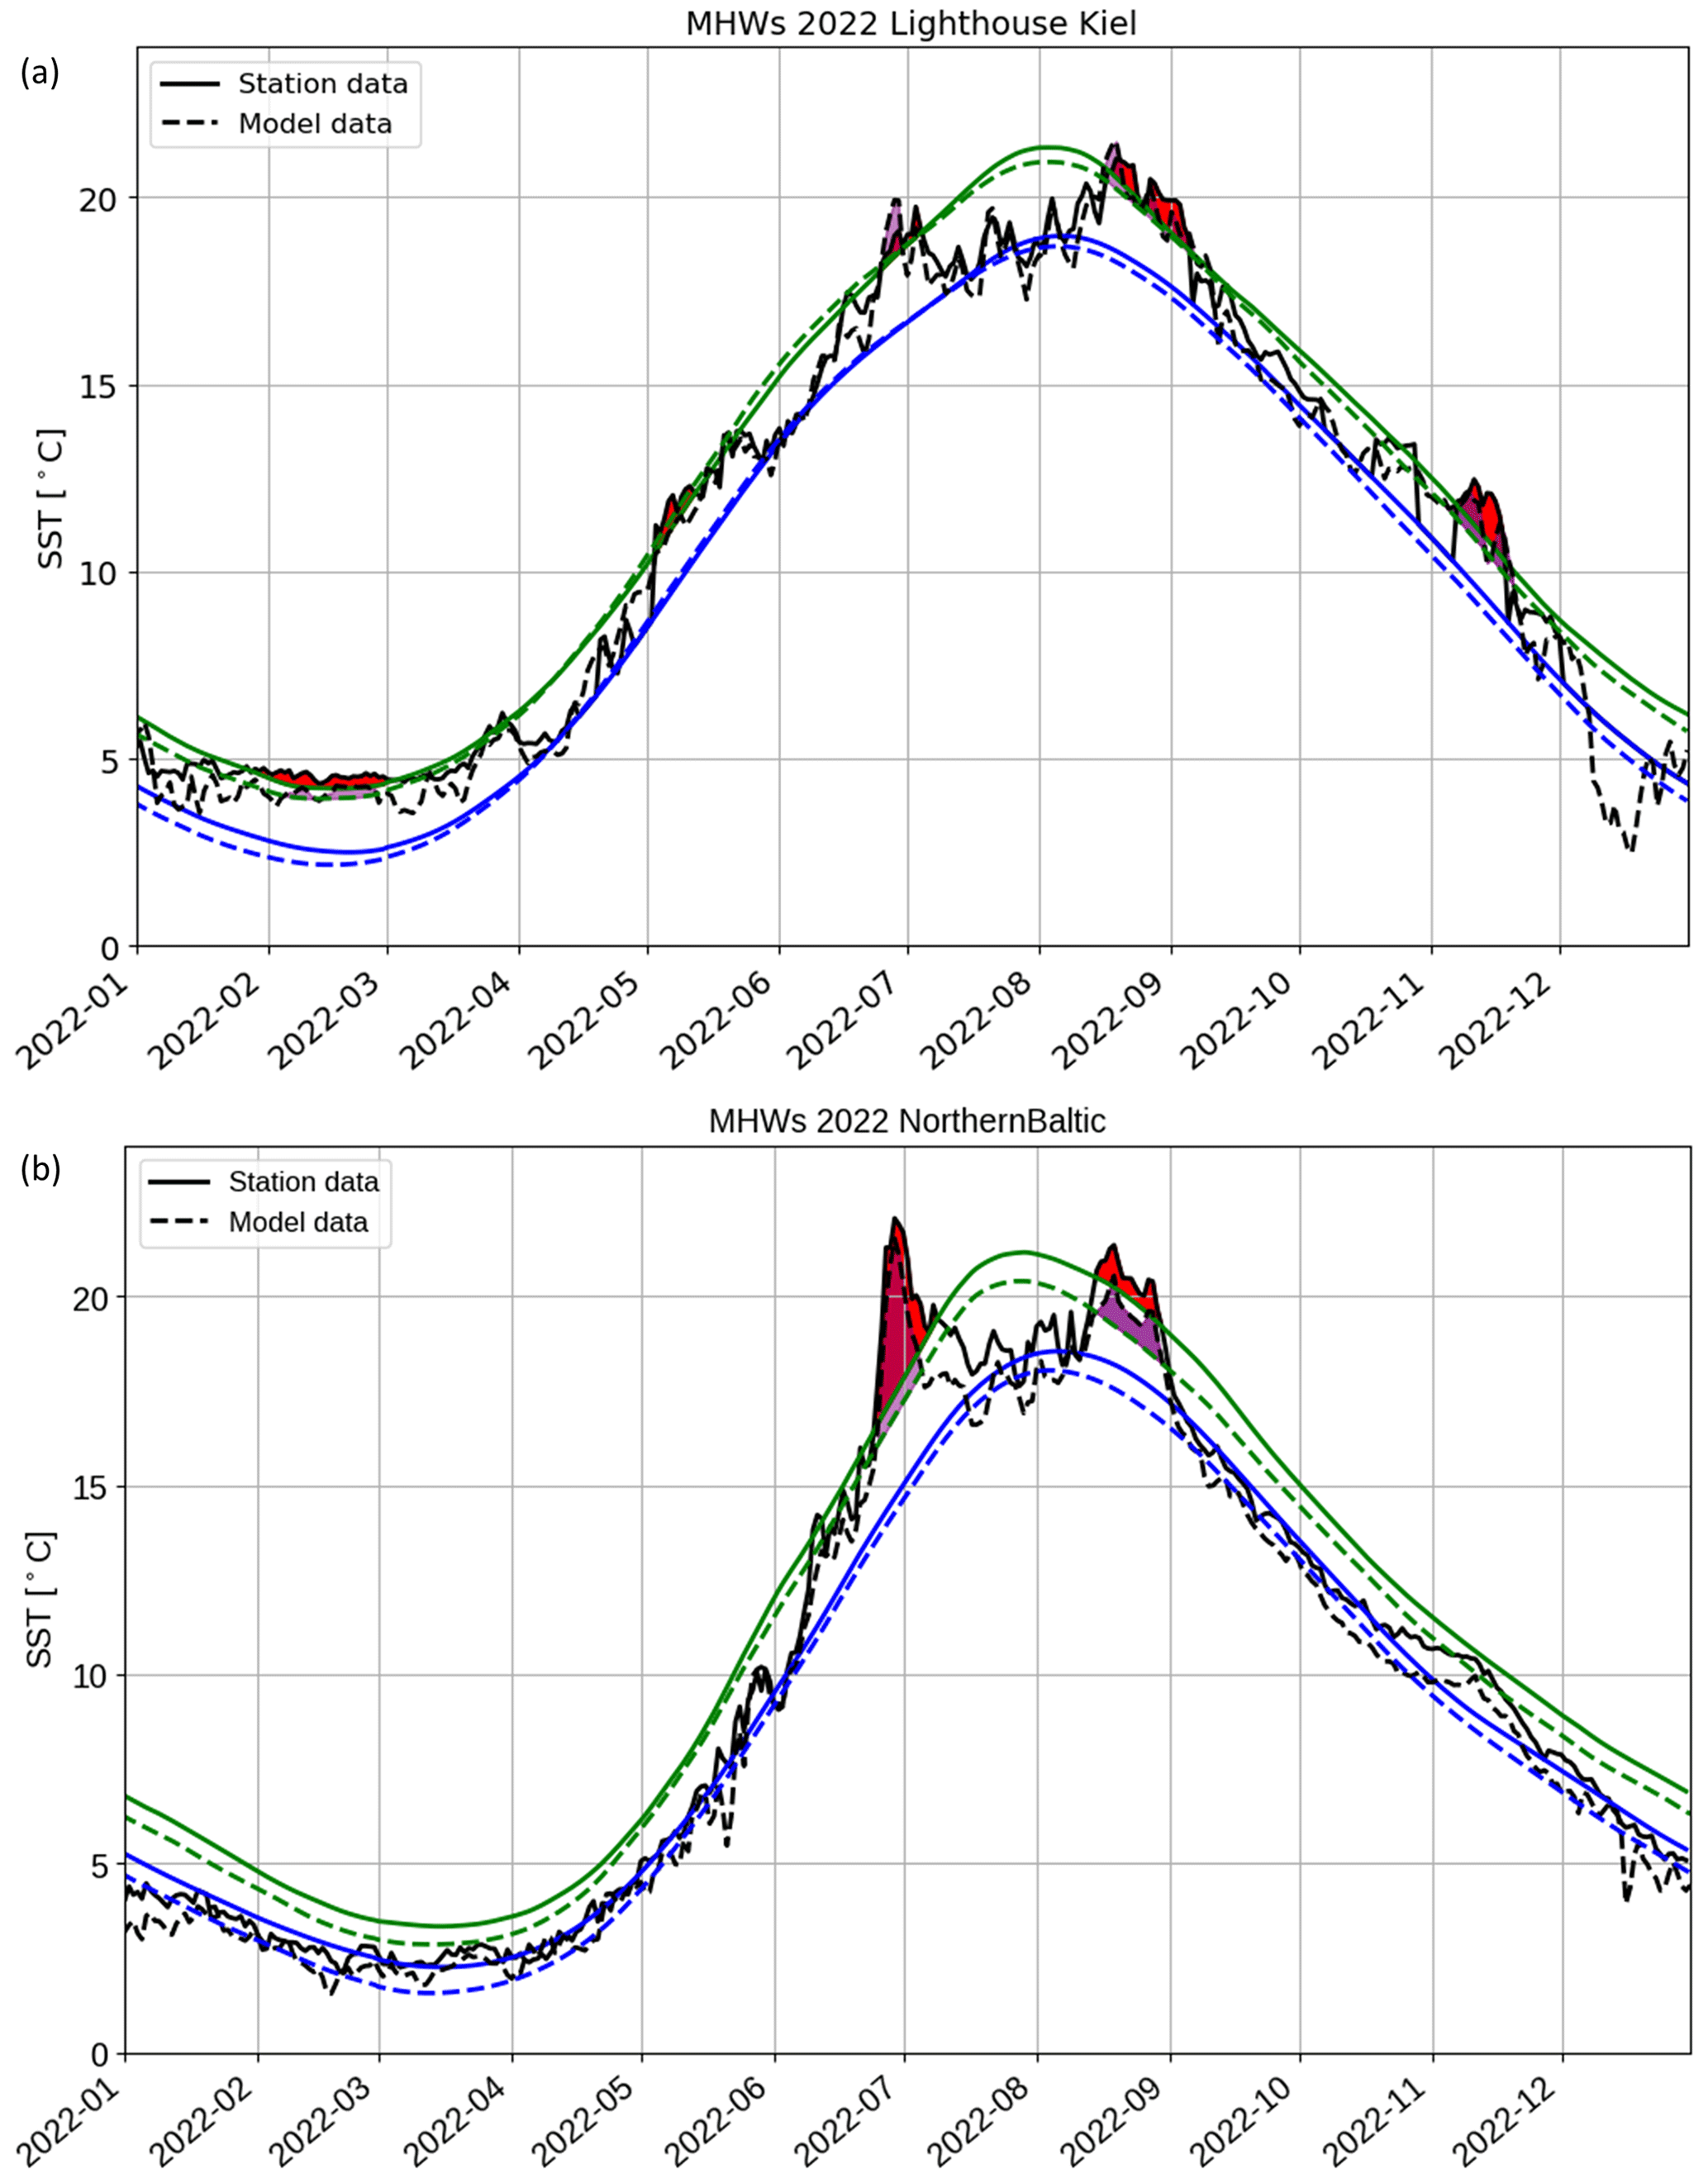
Figure A2Comparison of station data with BAL-MYP data at (a) LT Kiel (product ref. no. 2 and 3 in Table 1) and (b) Northern Baltic (Hedi Kanarik, FMI, personal communication, 2023, and product ref. no. 3 in Table 1). The dashed lines correspond to the reanalysis, while the continuous lines correspond to the station data. The climatological mean is shown in blue. The green lines show the 90th percentile threshold for MHW detection, and the black lines are the respective 2022 temperature data. The purple (BAL-MYP) and red (station data) marked areas show the detected MHWs in 2022. The reference period is 1993–2021 for LT Kiel (a) and 1997–2021 for Northern Baltic (b).
The Python-based toolbox for marine heatwave detection is available at https://github.com/ecjoliver/marineHeatWaves (Oliver, 2016). The MATLAB toolbox for marine heat wave detection is available at https://github.com/ZijieZhaoMMHW/m_mhw1.0 (Zhao and Marin, 2019b, a).
This study is based on public databases, and the references are listed in Table 1. Weather observations at Umeå airport (close to southwestern Bothnian Bay) are available from SMHI at https://www.smhi.se/data/meteorologi/ladda-ner-meteorologiska-observationer/#param=wind,stations=core,stationid=140480 (SMHI, 2023b) and https://www.smhi.se/data/meteorologi/ladda-ner-meteorologiska-observationer/#param=airtemperatureInstant,stations=core,stationid=140480 (SMHI, 2023a).
The idea for and concept behind this chapter were formed by AL, CH, PL, HEM, and UR. The data curation was done by EMvdL and TK for the data from product ref. no. 1 in Table 1, by CH and TRP for the data from product ref. no. 2 in Table 1, and by SJS and TRP for the data from product ref. no. 3 in Table 1. The formal analyses of the datasets and the resulting investigations were performed by AL, CH, SJS, TK, and TRP. The k-means model validation was performed by UR and IM. CH, SJS, IM, TK, and TRP were responsible for the visualization of the data. AL, CH, SJS, TK, EMvdL, TRP, and UR were involved in the original draft preparation. The final manuscript was reviewed and edited by CH, PL, HEM, and UR with contributions from all co-authors.
The contact author has declared that none of the authors has any competing interests.
Publisher’s note: Copernicus Publications remains neutral with regard to jurisdictional claims made in the text, published maps, institutional affiliations, or any other geographical representation in this paper. While Copernicus Publications makes every effort to include appropriate place names, the final responsibility lies with the authors.
This work is supported by the Copernicus Marine Service for the Baltic Sea Monitoring and Forecasting Center (21002L2-COP-MFC BAL-5200).
This paper was edited by Marilaure Grégoire and reviewed by Álvaro de Pascual Collar and one anonymous referee.
Belkin, I. M.: Rapid warming of large marine ecosystems, Prog. Oceanogr., 81, 207–213, https://doi.org/10.1016/j.pocean.2009.04.011, 2009.
Buga, L., Sarbu, G., Fryberg, L., Magnus, W., Wesslander, K., Gatti, J., Leroy, D., Iona, S., Larsen, M., Koefoed Rømer, J., Østrem, A. K., Lipizer, M., and Giorgetti A.: EMODnet Chemistry Eutrophication and Acidity aggregated datasets v2018, EMODnet, Thematic Lot no. 4/SI2.749773, https://doi.org/10.6092/EC8207EF-ED81-4EE5-BF48-E26FF16BF02E, 2018.
Cheng, L., von Schuckmann, K., Abraham, J. P., Trenberth, K. E., Mann, M. E, Zanna, L., England, M. H., Zika, J. D., Fasullo, J. T., Yu, Y., Pan, Y., Zhu, J., Newsom, E. R., Bronselaer, B., and Lin, X.: Past and future ocean warming, Nature Reviews Earth and Environment, 3, 776–794, https://doi.org/10.1038/s43017-022-00345-1, 2022.
Chubarenko, I. P., Demchenko, N. Y., Esiukova, E. E., Lobchuk, O. I., Karmanov, K. V., Pilipchuk, V. A., Isachenko, I. A., Kuleshov, A. F., Chugaevich, V. Y., Stepanova, N. B., Krechik, V. A., and Bagaev, A. V.: Spring thermocline formation in the coastal zone of the southeastern Baltic Sea based on field data in 2010–2013, Oceanology, 57, 632–638, https://doi.org/10.1134/S000143701705006X, 2017.
Copernicus Climate Change Service/ECMWF: Surface air temperature for August 2022, Copernicus Climate Change Service/ECMWF, https://climate.copernicus.eu/surface-air-temperature-august-2022 (last access: 11 July 2023), 2022a.
Copernicus Climate Change Service/ECMWF: Surface air temperature for November 2022, Copernicus Climate Change Service/ECMWF, https://climate.copernicus.eu/surface-air-temperature-november-2022 (last access: 11 July 2023), 2022b.
Dutheil, C., Meier, H. E. M., Gröger, M., and Börgel, F.: Warming of Baltic Sea water masses since 1850, Clim. Dynam., 61, 1311–1331, https://doi.org/10.1007/s00382-022-06628-z, 2023.
EU Copernicus Marine Service Product: Global Ocean – In-Situ Near-Real-Time Observations, Mercator Ocean International [data set], https://doi.org/10.48670/moi-00036, 2023a.
EU Copernicus Marine Service Product: Baltic Sea – L3S Sea Surface Temperature Reprocessed, Mercator Ocean International [data set], https://doi.org/10.48670/moi-00312, 2023b.
EU Copernicus Marine Service Product: Baltic Sea Physics Reanalysis, Mercator Ocean International [data set], https://doi.org/10.48670/moi-00013, 2023c.
EUMETSAT: AVHRR Factsheet, Doc. No. EUM/OPS/DOC/09/5183, https://www-cdn.eumetsat.int/files/2020-04/pdf_avhrr_factsheet.pdf (last access: 24 April 2024), 2015.
Frölicher, T. L., Fischer, E. M., and Gruber, N.: Marine heatwaves under global warming, Nature, 560, 360–364, https://doi.org/10.1038/s41586-018-0383-9, 2018.
Giorgetti, A., Lipizer, M., Molina Jack, M. E., Holdsworth, N., Jensen, H. M., Buga, L., Sarbu, G., Iona, A., Gatti, J., Larsen, M., and Fyrberg, L.: Aggregated and Validated Datasets for the European Seas: The Contribution of EMODnet Chemistry, Front. Mar. Sci., 7, 583657, https://doi.org/10.3389/fmars.2020.583657, 2020.
Goebeler, N., Norkko, A., and Norkko, J.: Ninety years of coastal monitoring reveals baseline and extreme ocean temperatures are increasing off the Finnish coast, Commun. Earth Environ., 3, 215, https://doi.org/10.1038/s43247-022-00545-z, 2022.
Gröger, M., Placke, M., Meier, H. E. M., Börgel, F., Brunnabend, S.-E., Dutheil, C., Gräwe, U., Hieronymus, M., Neumann, T., Radtke, H., Schimanke, S., Su, J., and Väli, G.: The Baltic Sea Model Intercomparison Project (BMIP) – a platform for model development, evaluation, and uncertainty assessment, Geosci. Model Dev., 15, 8613–8638, https://doi.org/10.5194/gmd-15-8613-2022, 2022.
Gurvan, M., Bourdallé-Badie, R., Chanut, J., Clementi, E., Coward, A., Ethé, C., Iovino, D., Lea, D., Lévy, C., Lovato, T., Martin, N., Masson, S., Mocavero, S., Rousset, C., Storkey, D., Vancoppenolle, M., Müeller, S., Nurser, G., Bell, M., and Samson, G.: NEMO ocean engine, in: Notes du Pôle de modélisation de l'Institut Pierre-Simon Laplace (IPSL) (v4.0, Number 27), Zenodo, https://doi.org/10.5281/zenodo.3878122, 2019.
Hobday, A. J., Alexander, L. V., Perkins, S. E., Smale, D. A., Straub, S. C., Oliver, E. C. J., Benthuysen, J. A., Burrows, M. T., Donat, M. G., Feng, M., Holbrook, N. J., Moore, P. J., Scannell, H. A., Sen Gupta, A., and Wernberg, T.: A hierarchical approach to defining marine heatwaves, Prog. Oceanogr., 141, 227–238, https://doi.org/10.1016/j.pocean.2015.12.014, 2016.
Hobday, A. J., Oliver, E. C. J., Sen Gupta, A., Benthuysen, J. A., Burrows, M. T., Donat, M. G., Holbrook, N. J., Moore, P. J., Thomsen, M. S., Wernberg, T., and Smale, D. A.: Categorizing and naming marine heatwaves, Oceanography, 31, 162–173, https://doi.org/10.5670/oceanog.2018.205, 2018.
Holbrook, N. J., Scannell, H. A., Sen Gupta, A., Benthuysen, J. A., Feng, M., Oliver, E. C., Alexander, L. V., Burrows, M. T., Donat, M. G., Hobday, A. J., and Moore, P. J.: A global assessment of marine heatwaves and their drivers, Nat. Commun., 10, 2624, https://doi.org/10.1038/s41467-019-10206-z, 2019.
ICES Bottle and low-resolution CTD dataset: Extractions 22 DEC 2013 (for years 1990–2012), 25 FEB 2015 (for year 2013), 13 OCT 2016 (for year 2015), 15 JAN 2019 (for years 2016–2017), 22 SEP 2020 (for year 2018), 10 MAR 2021 (for years 2019–2020), 28 FEB 2022 (for year 2021), ICES, Copenhagen [data set], https://data.ices.dk (last access: 30 April 2024), 2022.
In Situ TAC partners: EU Copernicus Marine Service Product User Manual for the Global Ocean- In-Situ Near-Real-Time Observations, INSITU_GLO_PHYBGCWAV_DISCRETE_MYNRT_013_030, Issue 2.0, Mercator Ocean International, https://catalogue.marine.copernicus.eu/documents/PUM/CMEMS-INS-PUM-013-030-036.pdf (last access: 22 March 2024), 2023.
IPCC: Climate Change 2022: Impacts, Adaptation, and Vulnerability. Contribution of Working Group II to the Sixth Assessment Report of the Intergovernmental Panel on Climate Change, edited by: Pörtner, H.-O., Roberts, D. C., Tignor, M., Poloczanska, E. S., Mintenbeck, K., Alegría, A., Craig, M., Langsdorf, S., Löschke, S., Möller, V., Okem, A., and Rama, B., Cambridge University Press, Cambridge, UK and New York, NY, USA, 3056 pp., https://doi.org/10.1017/9781009325844, 2022.
Jain, A. K.: Data clustering: 50 years beyond K-means, Pattern Recogn. Lett., 31, 651–666, https://doi.org/10.1016/j.patrec.2009.09.011, 2010.
Kauppi, L. and Villnäs, A.: Marine heatwaves of differing intensities lead to distinct patterns in seafloor functioning, P. Roy. Soc. B, 289, 20221159, https://doi.org/10.1098/rspb.2022.1159, 2022.
Kauppi, L., Göbeler, N., Norkko, J., Norkko, A., Romero-Ramirez, A., and Bernard, G.: Changes in macrofauna bioturbation during repeated heatwaves mediate changes in biogeochemical cycling of nutrients, Front. Mar. Sci., 9, 1070377, https://doi.org/10.3389/fmars.2022.1070377, 2023.
Minnett, P. J., Alvera-Azcárate, A., Chin, T. M., Corlett, G. K., Gentemann, C. L., Karagali, I., Li, X., Marsouin, A., Marullo, S., Maturi, E., Santoleri, R., Saux Picart, S., Steele, M., and Vazquez-Cuervo, J.: Half a century of satellite remote sensing of sea-surface temperature, Remote Sens. Environ., 233, 111366, https://doi.org/10.1016/j.rse.2019.111366, 2019.
Oliver, E. C. J.: marineHeatWaves v0.16, GitHub [code], https://github.com/ecjoliver/marineHeatWaves (last access: 17 March 2023), 2016.
Oliver, E. C. J.: Mean warming not variability drives marine heatwave trends, Clim. Dynam., 53, 1653–1659, https://doi.org/10.1007/s00382-019-04707-2, 2019.
Panteleit, T., Verjovkina, S., Jandt-Scheelke, S., Spruch, L., and Huess, V.: EU Copernicus Marine Service Quality Information Document for the Baltic Sea Physics Reanalysis, BALTICSEA_MULTIYEAR_PHY_003_011, Issue 4.0, Mercator Ocean International, https://catalogue.marine.copernicus.eu/documents/QUID/CMEMS-BAL-QUID-003-011.pdf (last access: 12 April 2023), 2023.
Raudsepp, U. and Maljutenko, I.: A method for assessment of the general circulation model quality using the K-means clustering algorithm: a case study with GETM v2.5, Geosci. Model Dev., 15, 535–551, https://doi.org/10.5194/gmd-15-535-2022, 2022.
Raudsepp, U., Maljutenko, I., Haapala, J., Männik, A., Verjovkina, S., Uiboupin, R., von Schuckmann, K., and Mayer, M.: Record high heat content and low ice extent in the Baltic Sea during winter 2019/20, in: Copernicus Ocean State Report, Issue 6, J. Oper. Oceanogr., 15, Supplement, s175–s185, https://doi.org/10.1080/1755876X.2022.2095169, 2022.
Ringgaard, I., Korabel, V., Spruch, L., Lindenthal, A., and Huess, V.: EU Copernicus Marine Service Product User Manual for the Baltic Sea Physics Reanalysis, BALTICSEA_MULTIYEAR_PHY_003_011, Issue 1.0, Mercator Ocean International, https://catalogue.marine.copernicus.eu/documents/PUM/CMEMS-BAL-PUM-003-011_012.pdf (last access: 12 April 2023), 2023.
Sen Gupta, A., Thomsen, M., Benthuysen, J. A., Hobday, A. J., Oliver, E., Alexander, L. V., Burrows, M. T., Donat, M. G., Feng, M., Holbrook, N. J., Perkins-Kirkpatrick, S., Moore, P. J., Rodrigues, R. R., Scannell, H. A., Taschetto, A. S., Ummenhofer, C. C., Wernberg, T., and Smale, D. A.: Drivers and impacts of the most extreme marine heatwave events, Sci. Rep., 10, 19359, https://doi.org/10.1038/s41598-020-75445-3, 2020.
She, J., Su, J., and Zinck, A.-S.: Anomalous surface warming in the Baltic Sea in summer 2018 and mechanism analysis, in: Copernicus Marine Service Ocean State Report, Issue 4, J. Oper. Oceanogr., 13, Supplement, s125–s132, https://doi.org/10.1080/1755876X.2020.1785097, 2020.
Smale, D. A., Wernberg, T., Oliver, E. C. J., Thomsen, M., Harvey, B. P., Straub, S. C., Burrows, M. T., Alexander, L. V., Benthuysen, J. A., Donat, M. G., Feng, M., Hobday, A. J., Holbrook, N. J., Perkins-Kirkpatrick, S. E., Scannell, H. A., Sen Gupta, A., Payne, B. L., and Moore, P. J.: Marine heatwaves threaten global biodiversity and the provision of ecosystem services, Nat. Clim, Change, 9, 306–312, https://doi.org/10.1038/s41558-019-0412-1, 2019.
SMHI: Baltic Sea – Eutrophication and Acidity aggregated datasets 1902/2017 v2018, Swedish Meteorological and Hydrological Institute, EMODnet Chemistry [data set], https://doi.org/10.6092/595D233C-3F8C-4497-8BD2-52725CEFF96B, 2018.
SMHI: Meteorological observations, air temperature, station number 140480 (Umeå Flygplats), Swedish Meteorological and Hydrological Institute [data set], https://www.smhi.se/data/meteorologi/ladda-ner-meteorologiska-observationer/#param=airtemperatureInstant,stations=core,stationid=140480 (last access: 19 December 2023), 2023a.
SMHI: Meteorological observations, wind, station number 140480 (Umeå Flygplats), Swedish Meteorological and Hydrological Institute [data set], https://www.smhi.se/data/meteorologi/ladda-ner-meteorologiska-observationer/#param=wind,stations=core,stationid=140480 (last access: 19 December 2023), 2023b.
Smith, K. E., Burrows, M. T., Hobday, A. J., King, N. G., Moore, P. J., Gupta, A. S., Thomsen, M. S., Wernberg, T., and Smale, D. A.: Biological Impacts of Marine Heatwaves, Annu. Rev. Mar. Sci., 15, 119–145, https://doi.org/10.1146/annurev-marine-032122-121437, 2023.
Sun, D., Jing, Z., Li, F., and Wu, L.: Characterizing global marine heatwaves under a spatio-temporal framework, Prog. Oceanogr., 211, 102947, https://doi.org/10.1016/j.pocean.2022.102947, 2023.
The BACC Author Team: Assessment of Climate Change for the Baltic Sea Basin, Springer Berlin, Heidelberg, p. 88, https://doi.org/10.1007/978-3-540-72786-6, 2008.
Väli, G., Meier, H. M., and Elken, J.: Simulated halocline variability in the Baltic Sea and its impact on hypoxia during 1961–2007, J. Geophys. Res.-Oceans, 118, 6982–7000, https://doi.org/10.1002/2013JC009192, 2013.
Wehde, H., Schuckmann, K. V., Pouliquen, S., Grouazel, A., Bartolome, T., Tintore, J., De Alfonso Alonso-Munoyerro, M., Carval, T., Racapé, V., and the INSTAC team: EU Copernicus Marine Service Quality Information Document for the Global Ocean- In-Situ Near-Real-Time Observations, INSITU_GLO_PHYBGCWAV_DISCRETE_MYNRT_013_030, Issue 2.3, Mercator Ocean International, https://catalogue.marine.copernicus.eu/documents/QUID/CMEMS-INS-QUID-013-030-036.pdf (last access: 22 March 2024), 2023.
WMO: State of the Global Climate 2022, WMO-No. 1316, World Meteorological Organization, 2023, 48 pp., ISBN 978-92-63-11347-4, https://library.wmo.int/idurl/4/66214 (last access: 2 May 2023), 2023.
Zhao, Z. and Marin, M.: A MATLAB toolbox to detect and analyze marine heatwaves, Journal of Open Source Software, 4, 1124, https://doi.org/10.21105/joss.01124, 2019a.
Zhao, Z. and Marin, M.: A MATLAB toolbox to detect and analyze marine heatwaves (MHWs), GitHub [code], https://github.com/ZijieZhaoMMHW/m_mhw1.0 (last access: 28 May 2024), 2019b.